
Stable Dried Catalase Particles Prepared by Electrospraying


Abstract
: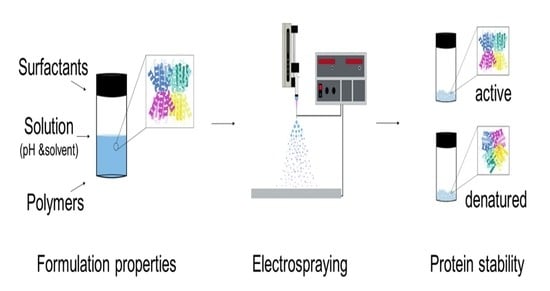
1. Introduction
2. Materials and Methods
2.1. Materials
2.2. Characterisation of Catalase and Particles
2.2.1. Bradford Assay
2.2.2. microBCA
2.2.3. Size Exclusion Chromatography
2.2.4. Turbidity Assay
2.2.5. Catalase Activity Assay
2.2.6. Morphology and Size Distribution
2.2.7. Fourier Transform Infrared Spectroscopy (FTIR)
2.2.8. X-ray Diffraction (XRD)
2.3. Pre-Formulation
2.3.1. Ethanol Concentration
2.3.2. Surfactants
2.4. Preparation of Catalase Particles
2.4.1. Surfactant Concentration
2.4.2. Solvent Type
2.4.3. Polymer Type
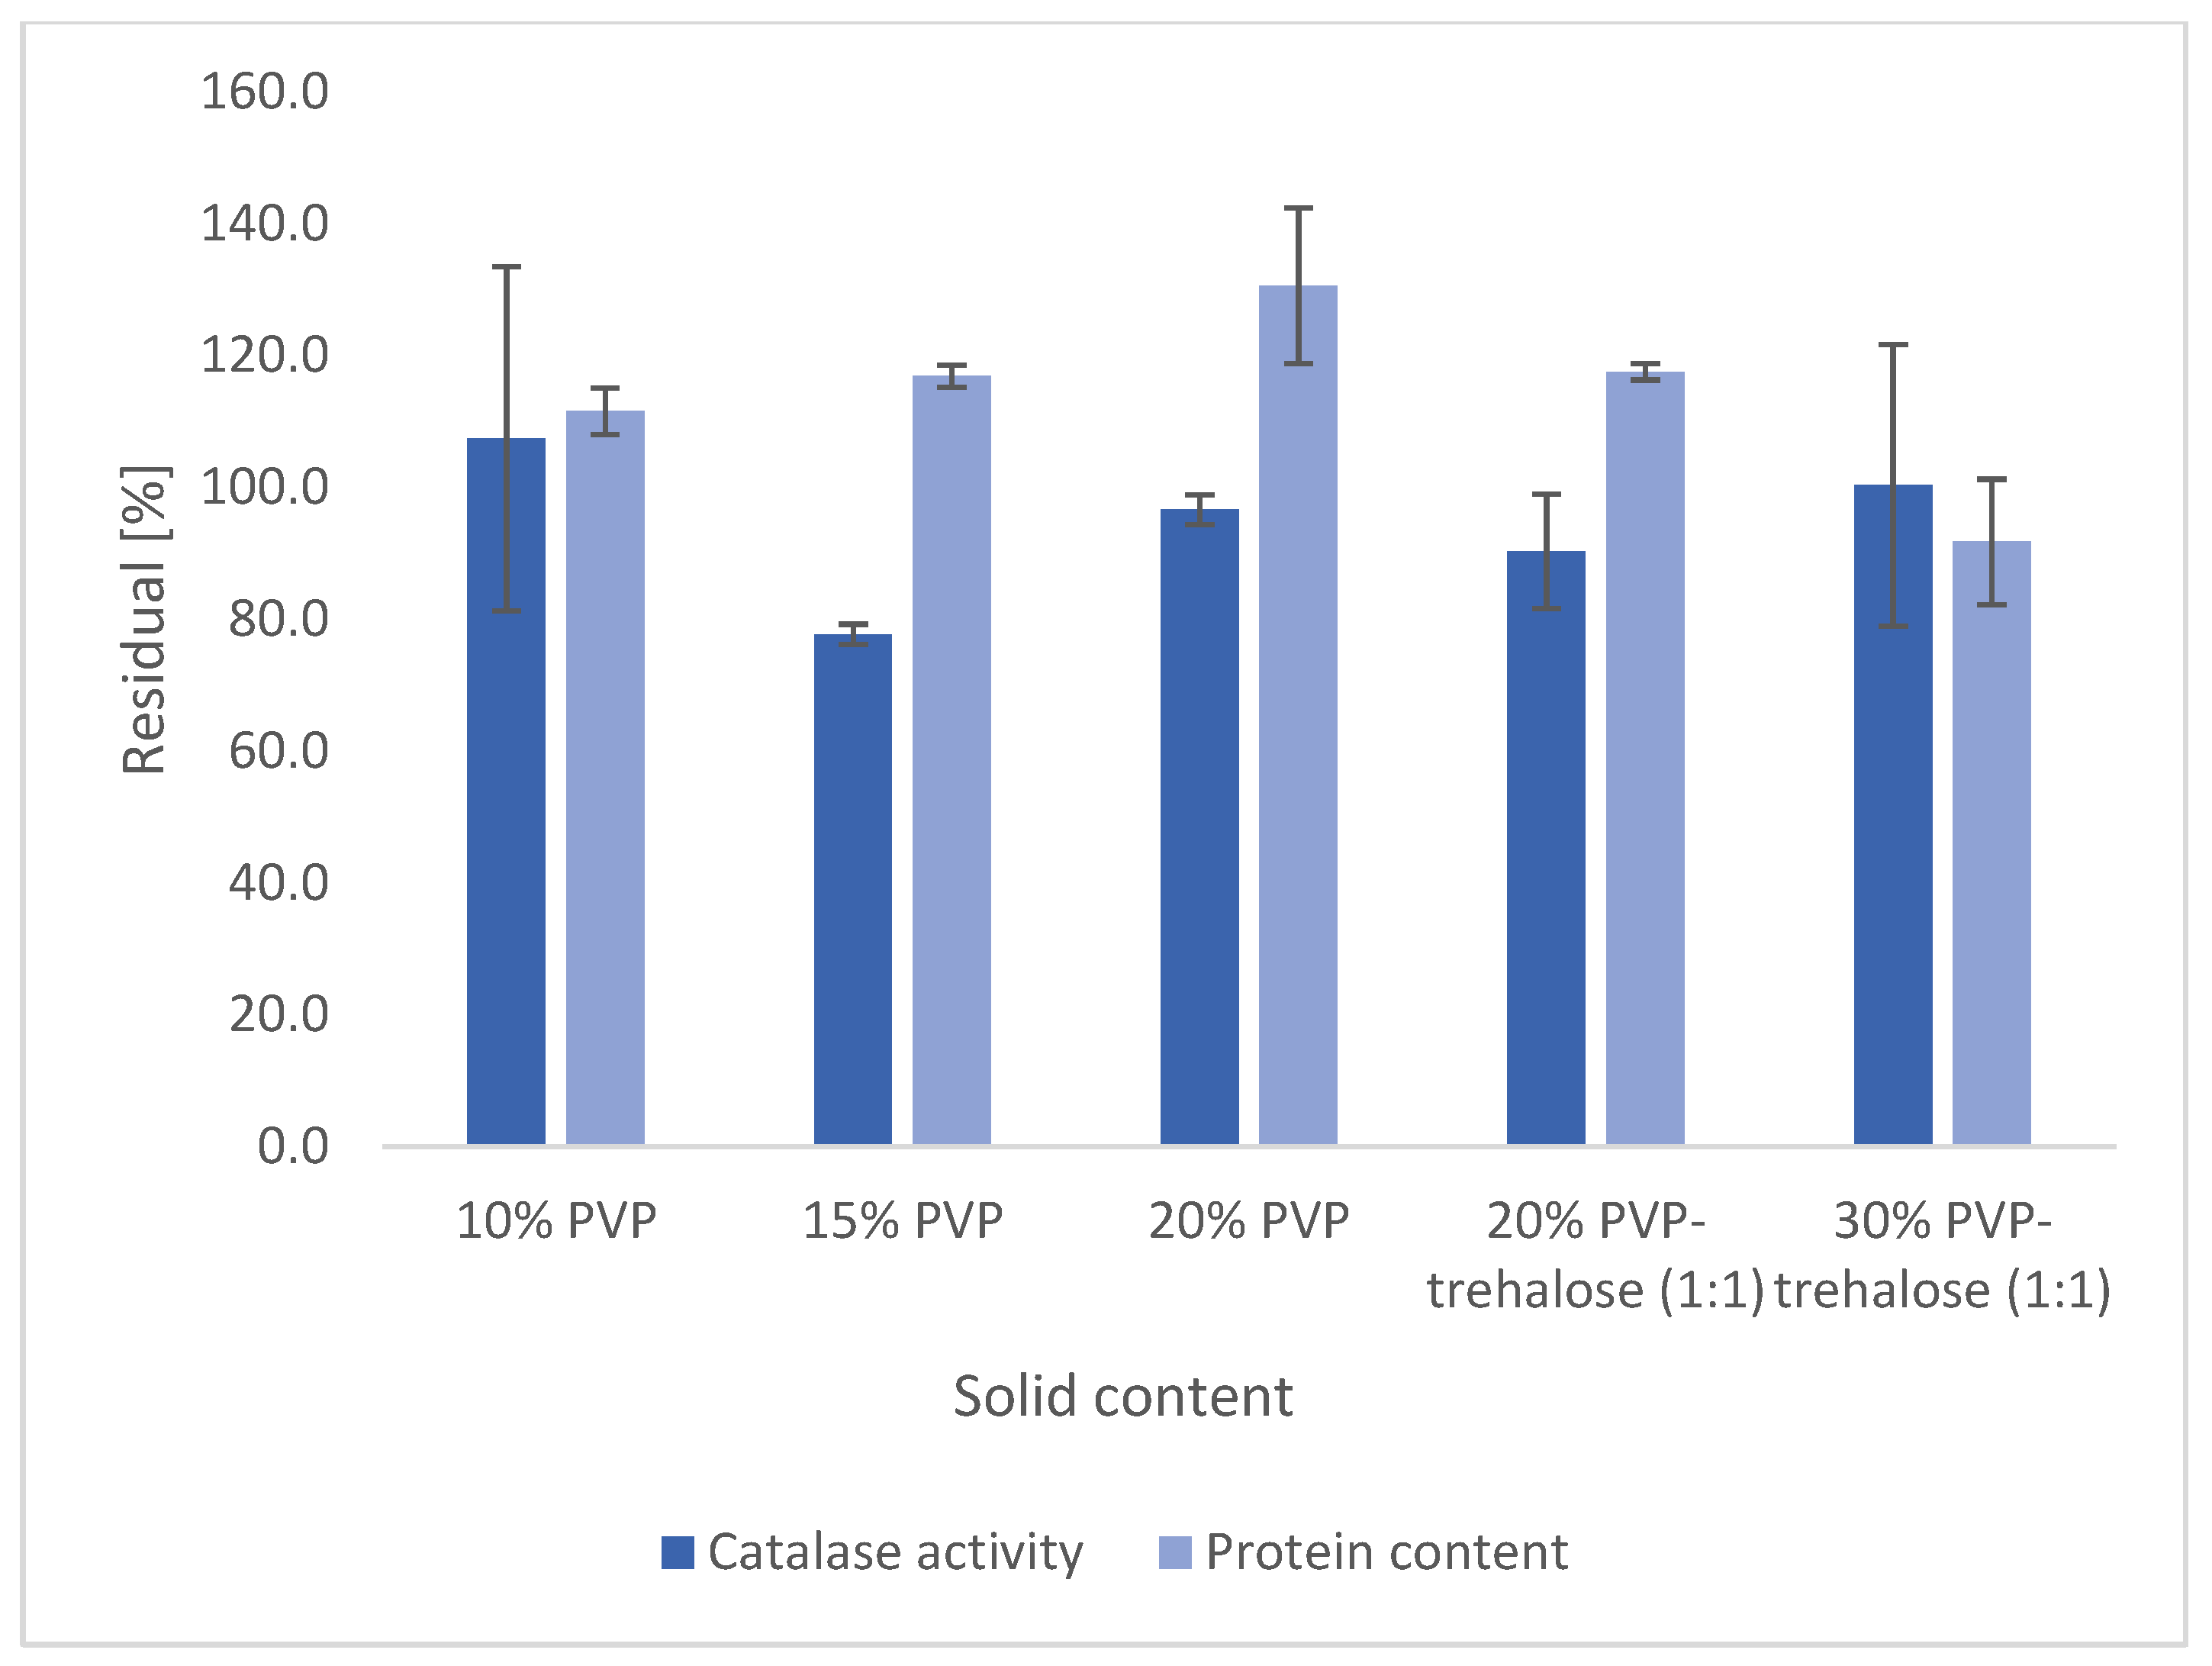
2.4.4. Polymer Concentration
2.5. Stability Evaluation of the Electrosprayed Particles
2.6. Statistical Analysis
3. Results and Discussion
3.1. Pre-Formulation
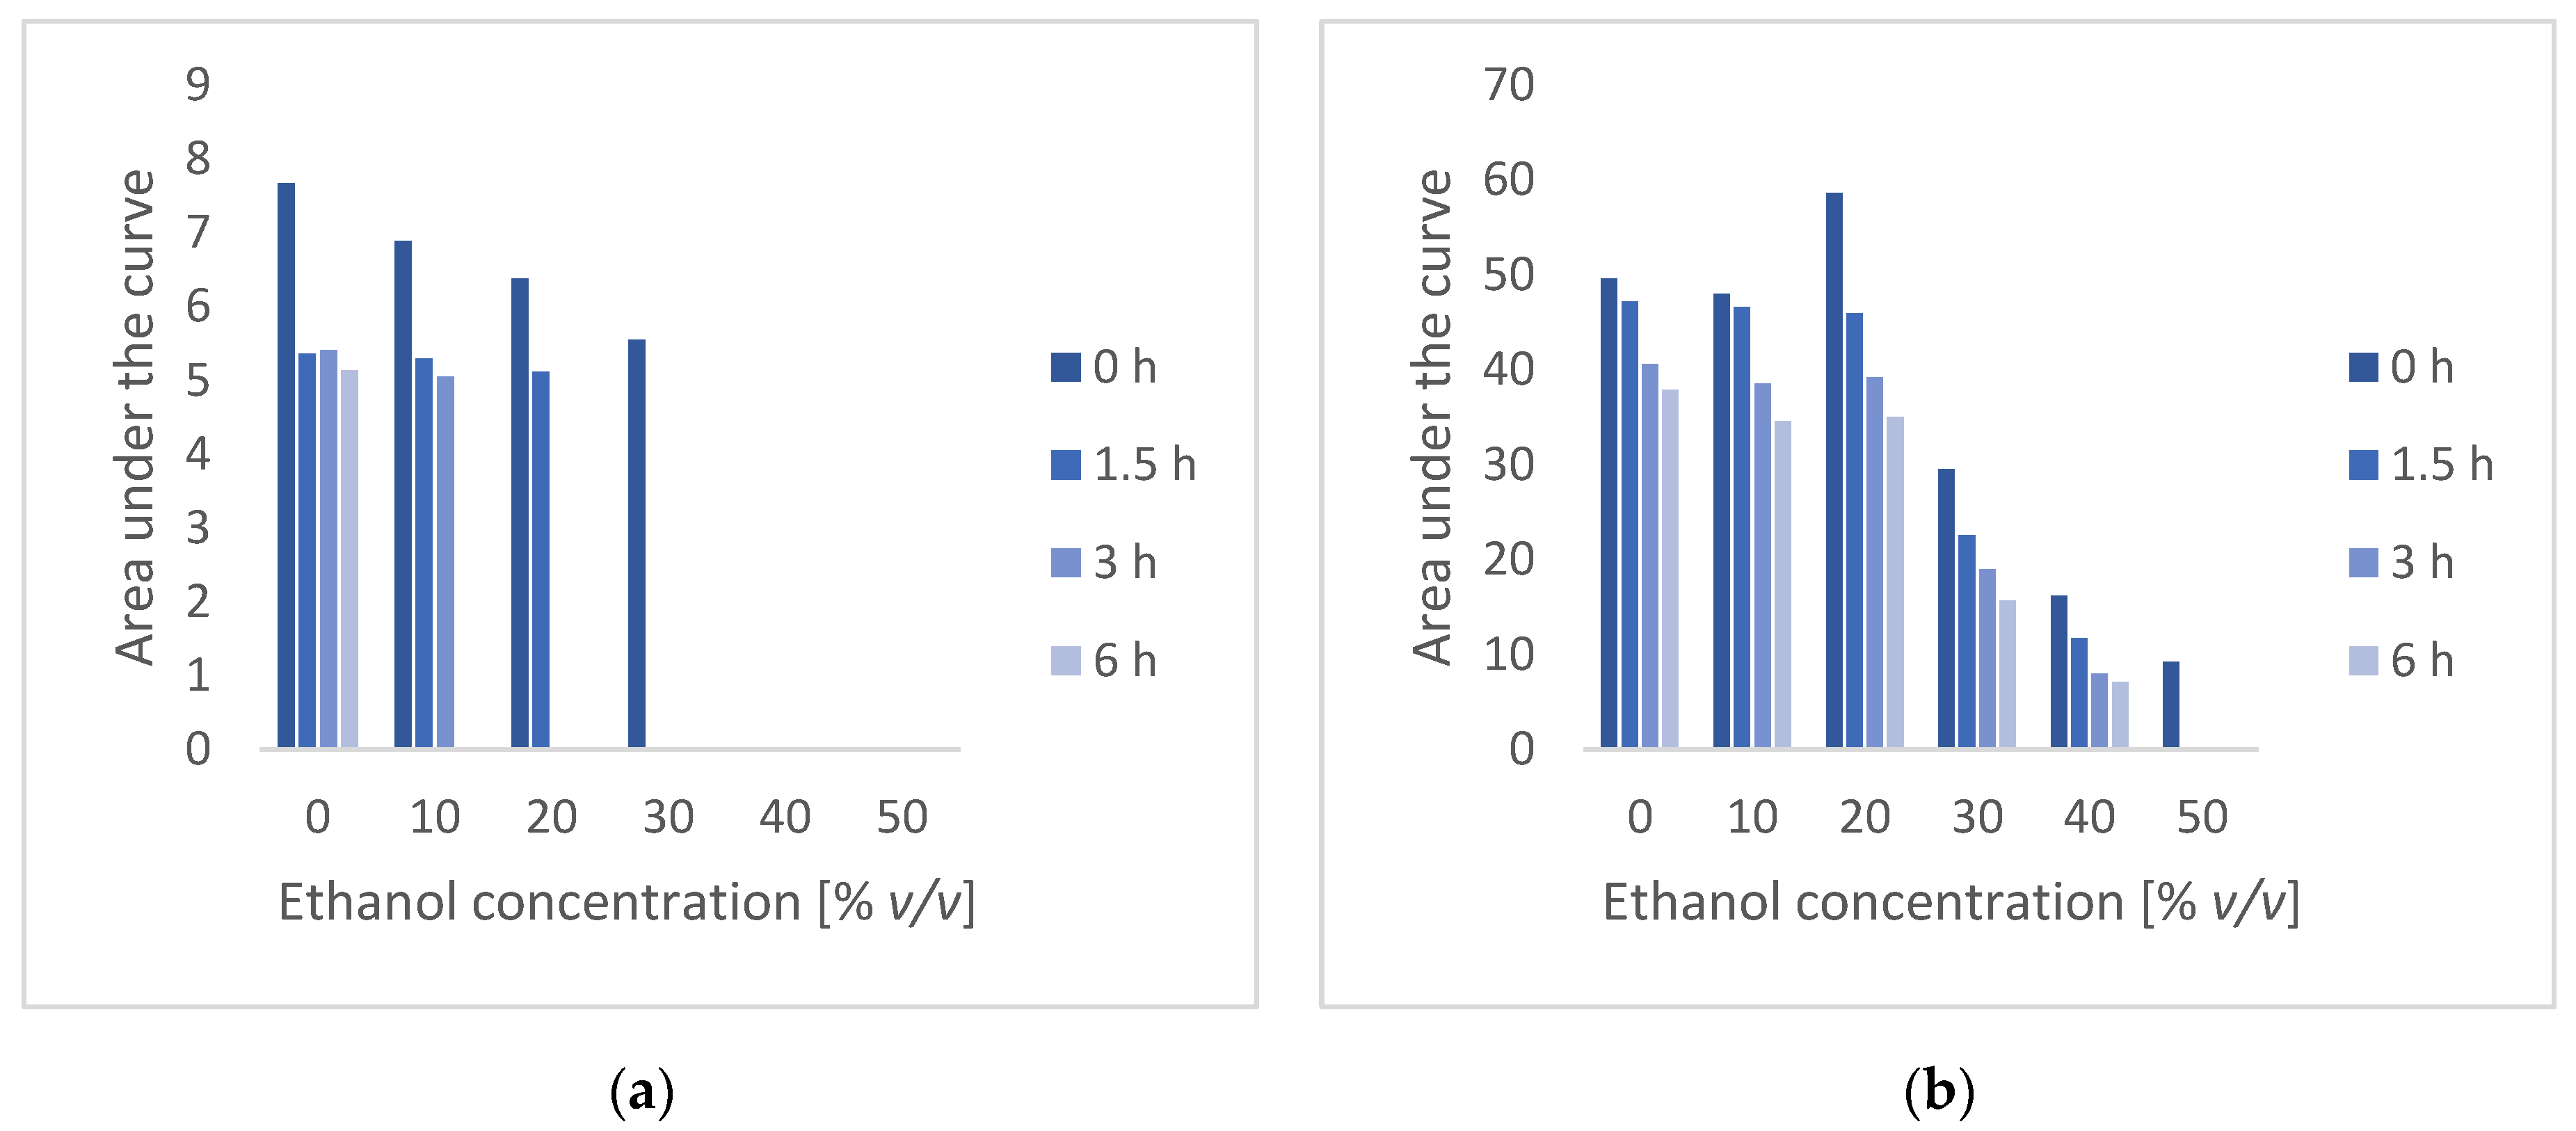
3.1.1. Ethanol Concentration
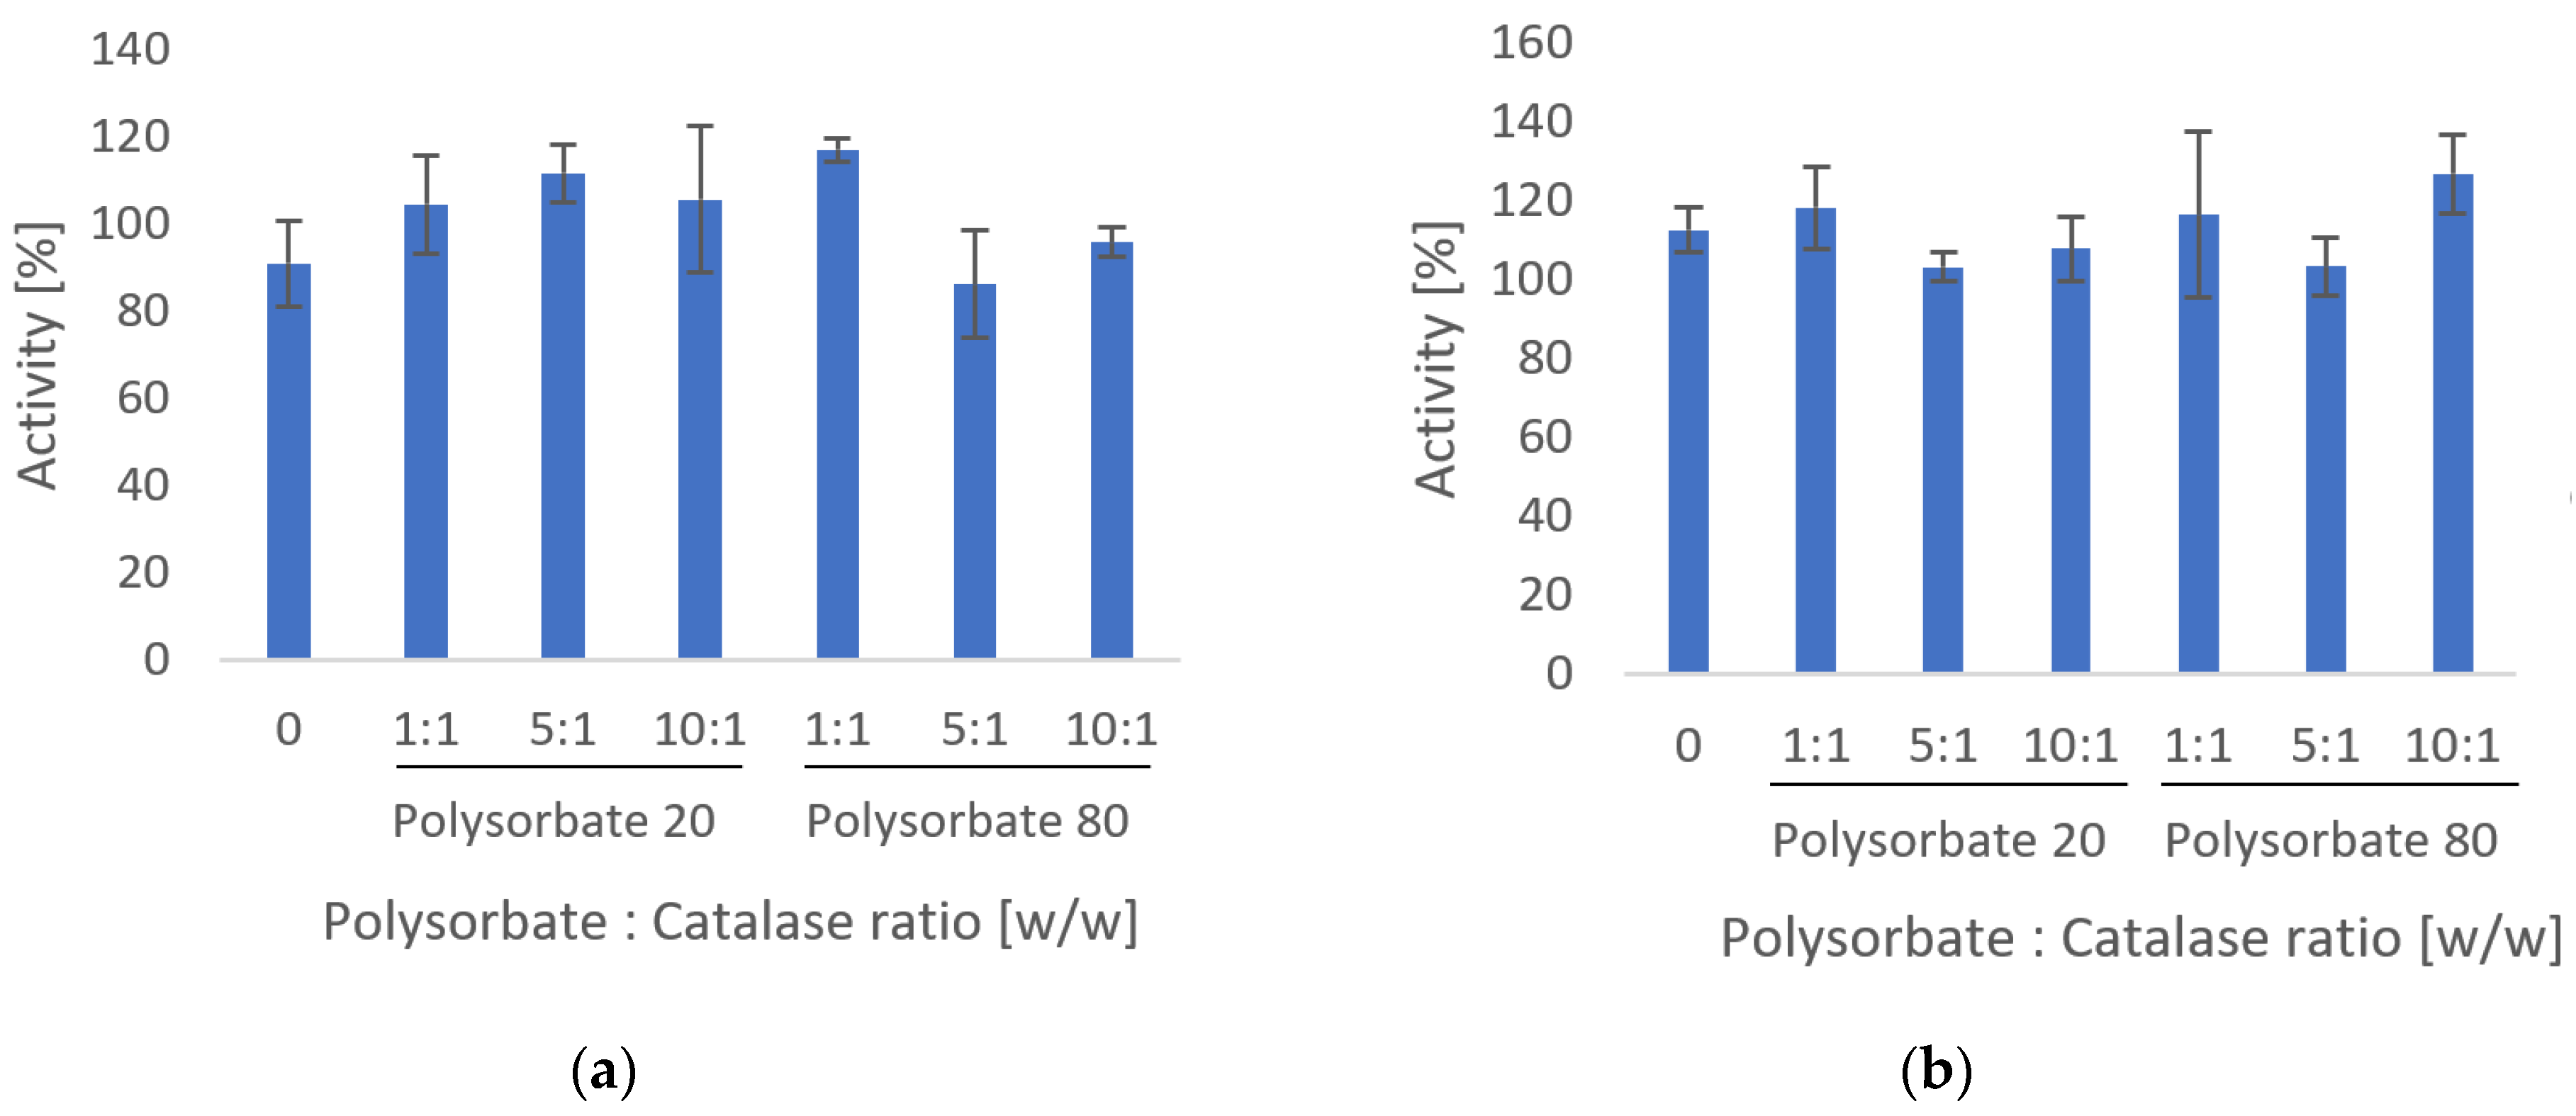
3.1.2. Surfactant
3.2. Formulation Development
3.2.1. Surfactant Concentration
3.2.2. Solvent
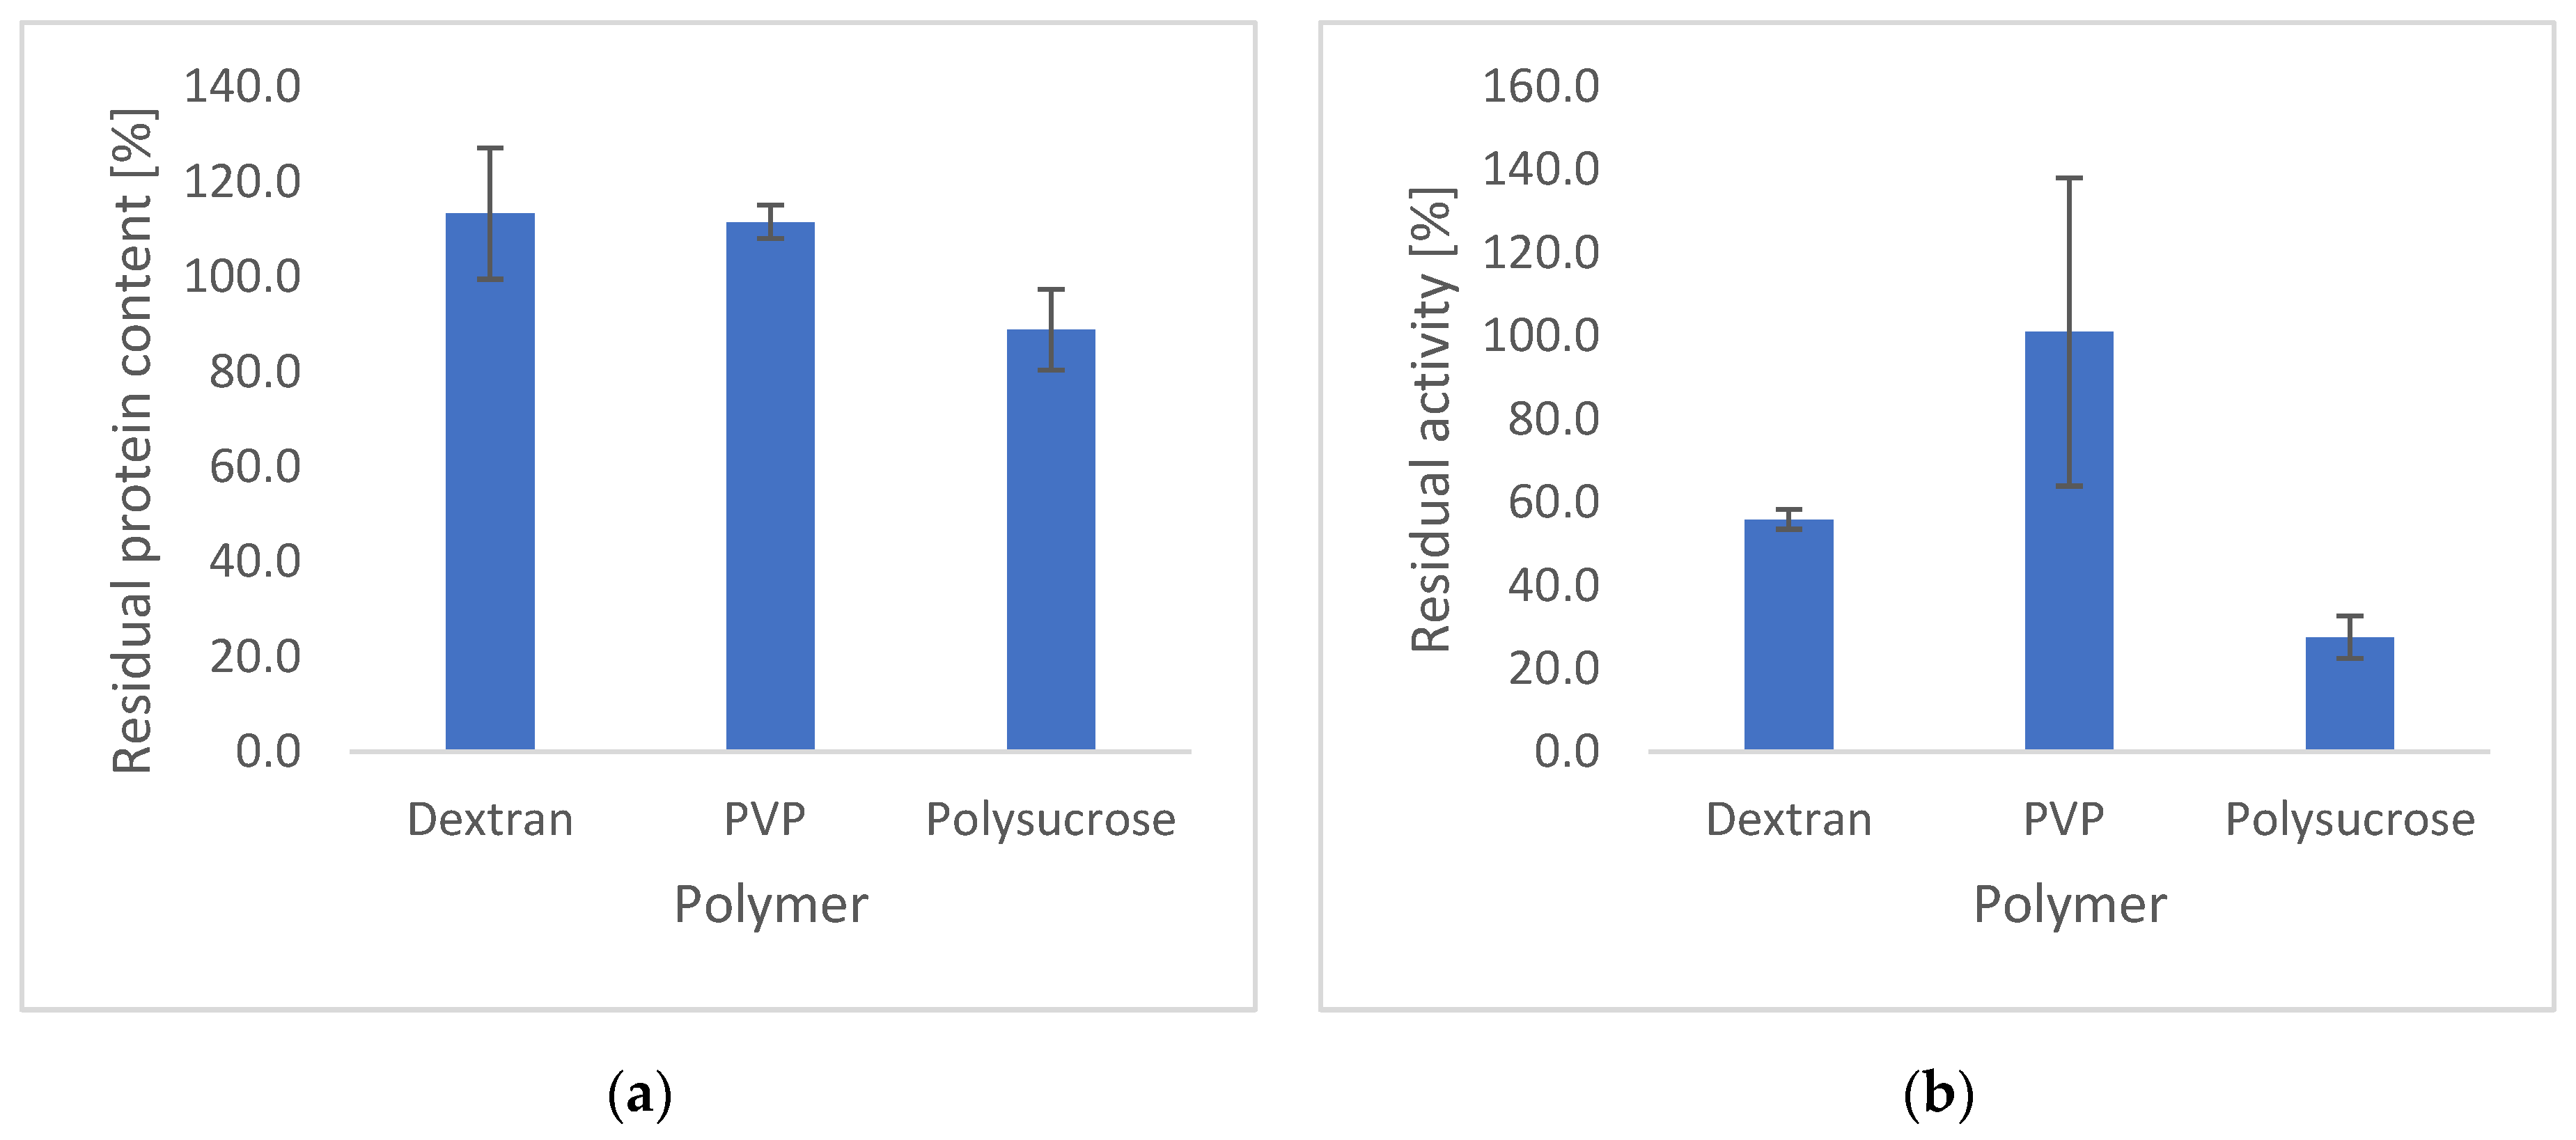
3.2.3. Polymer Type
3.3. Optimisation of the Electrospraying Conditions
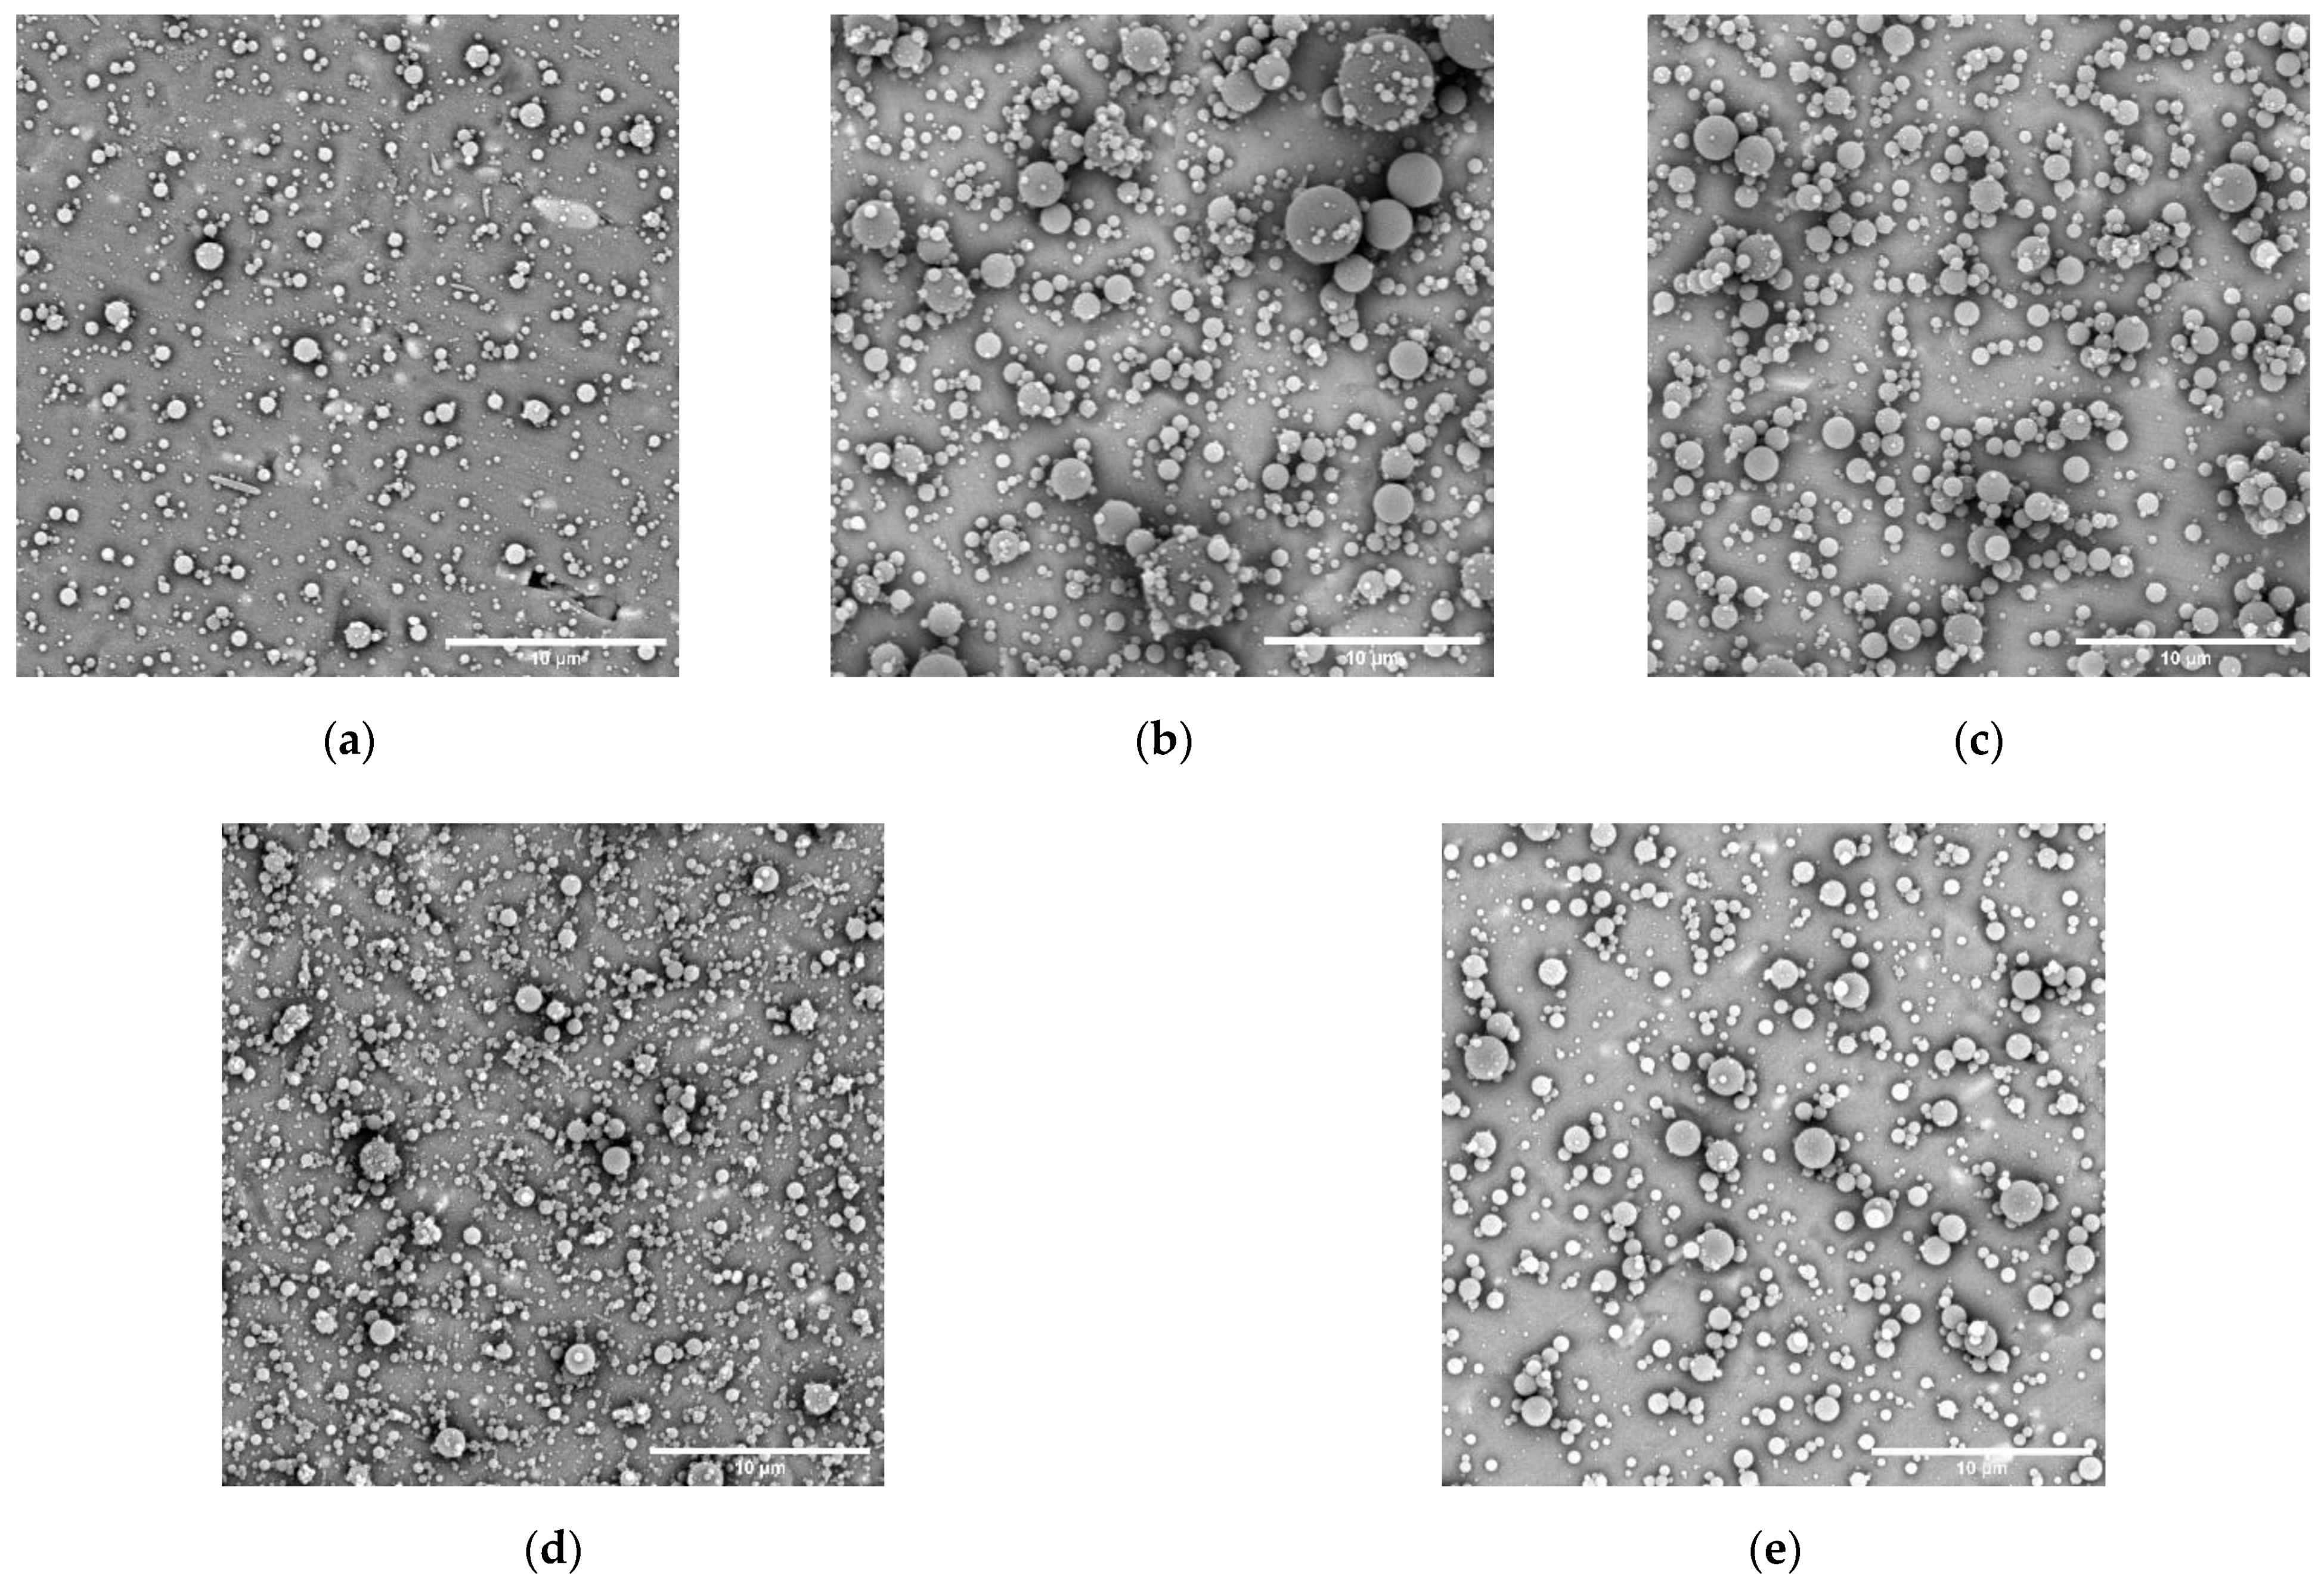
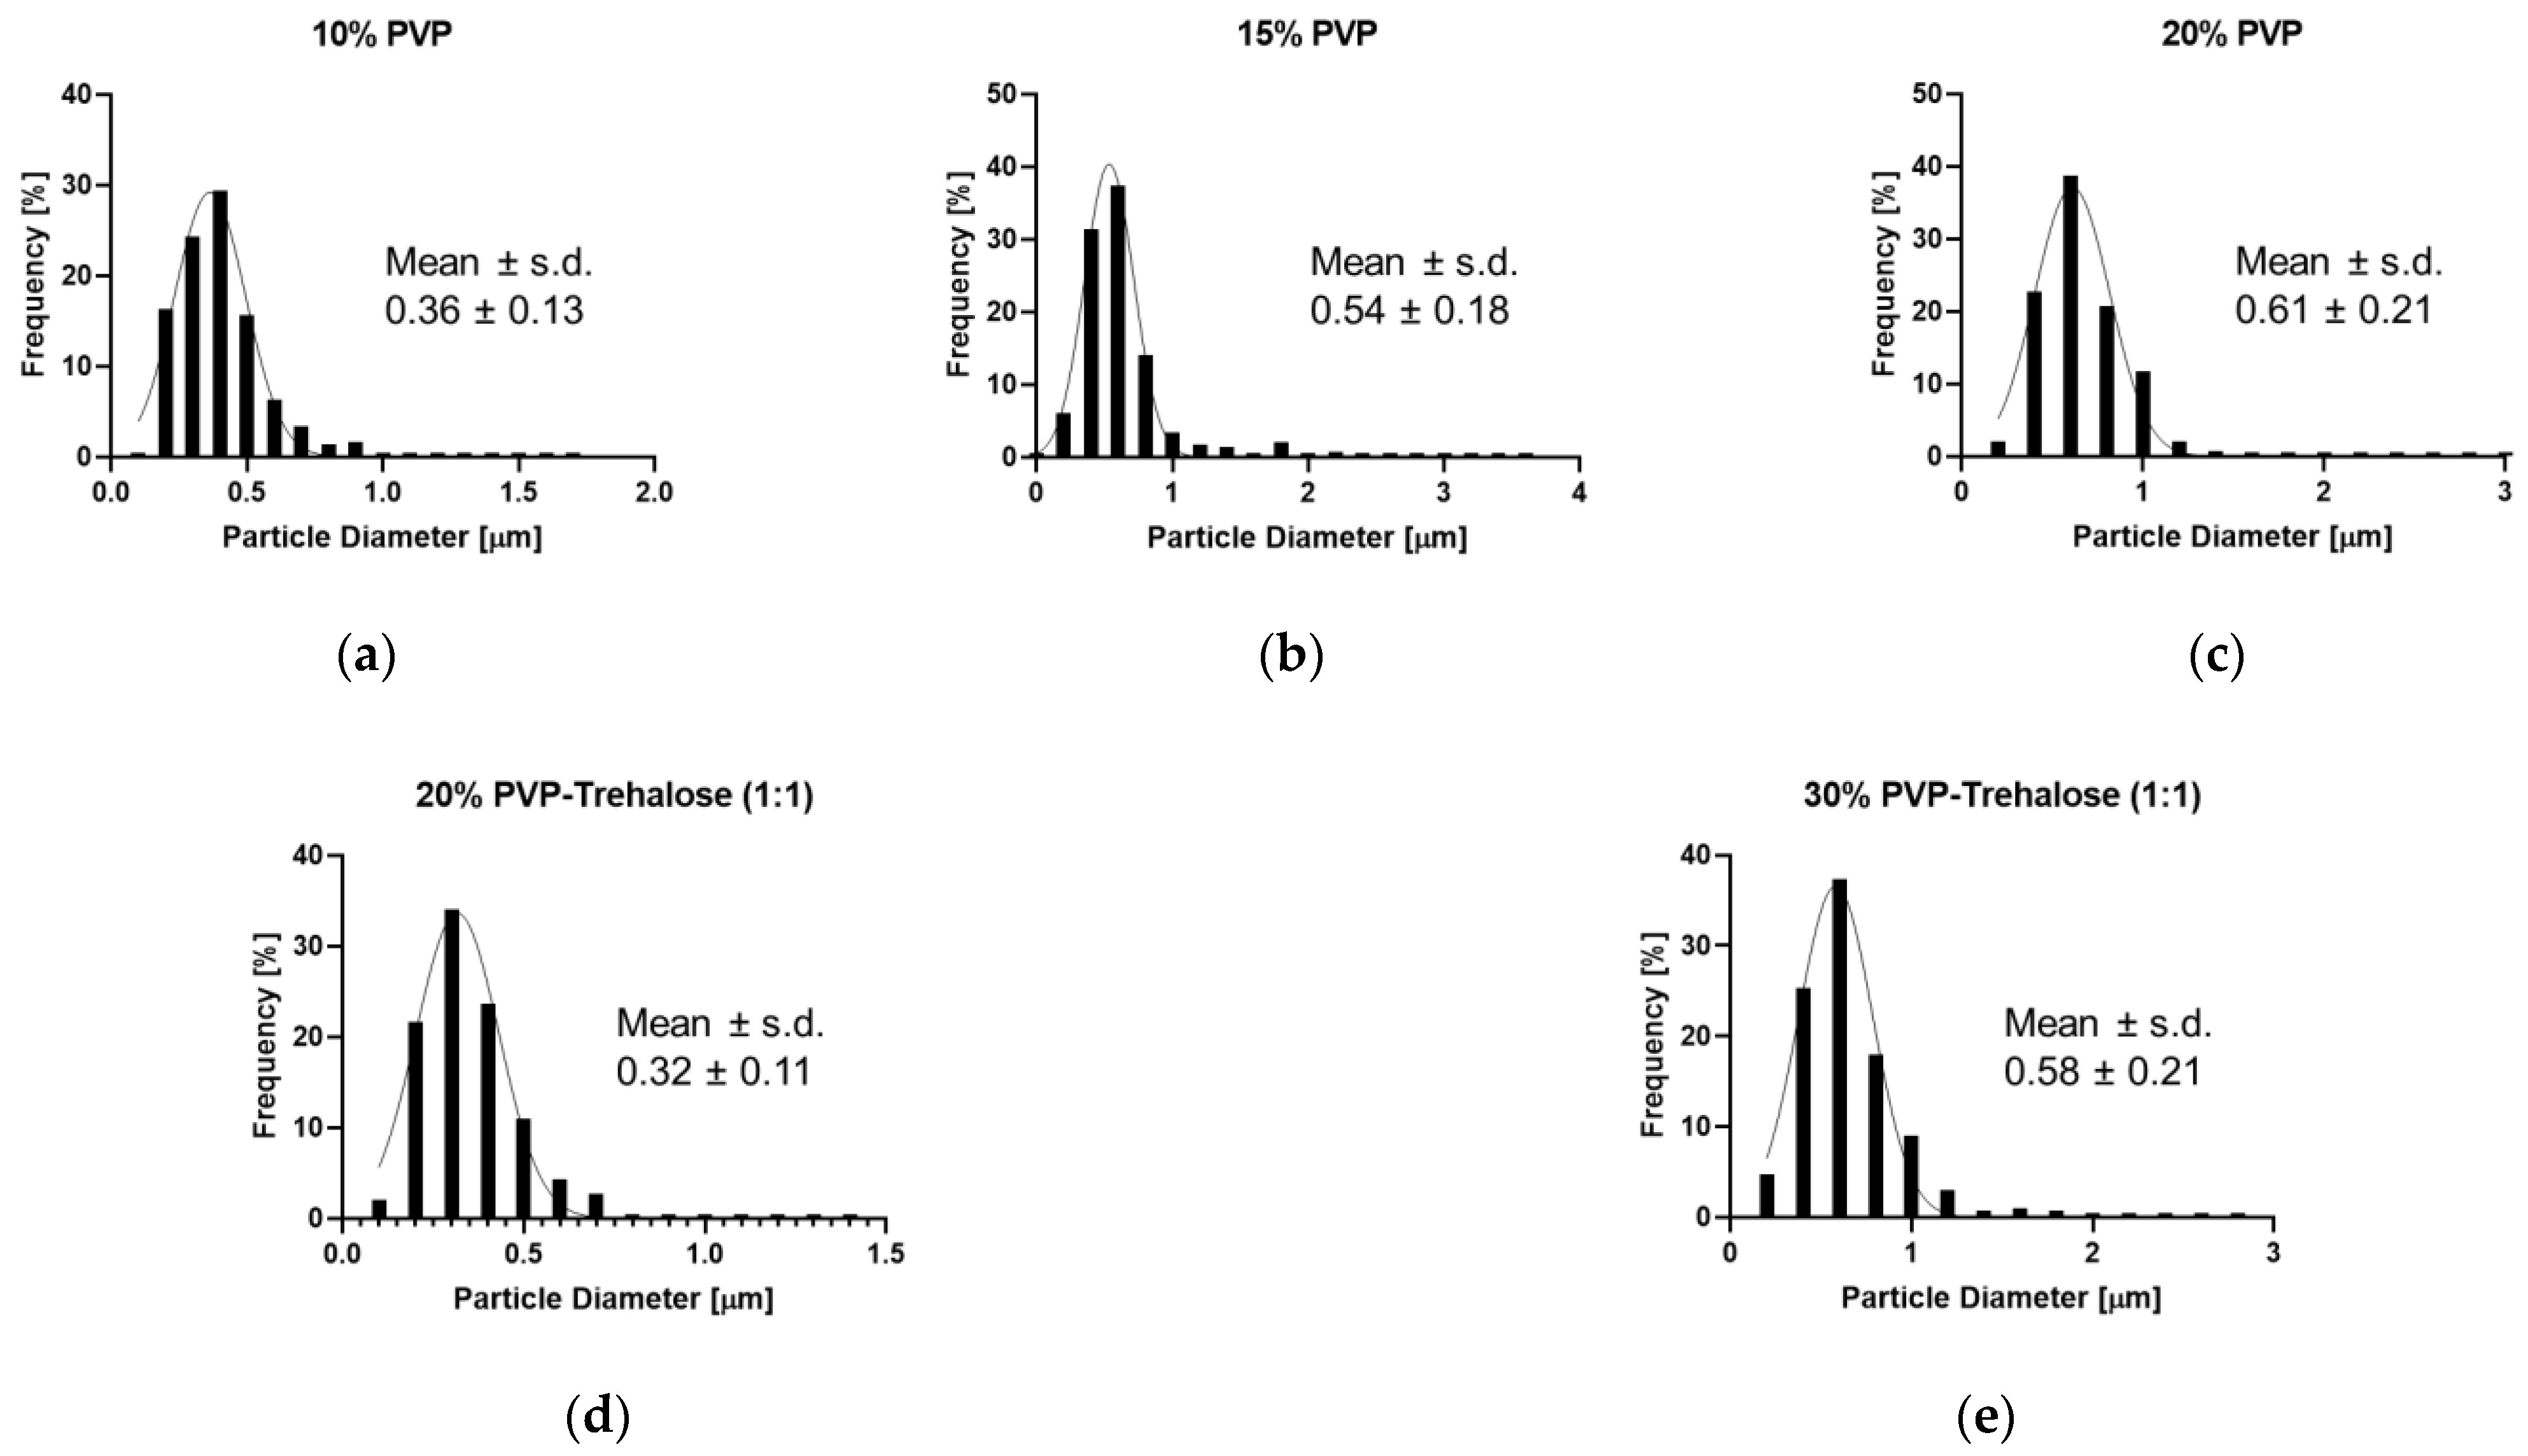
3.3.1. Particle Characterisation
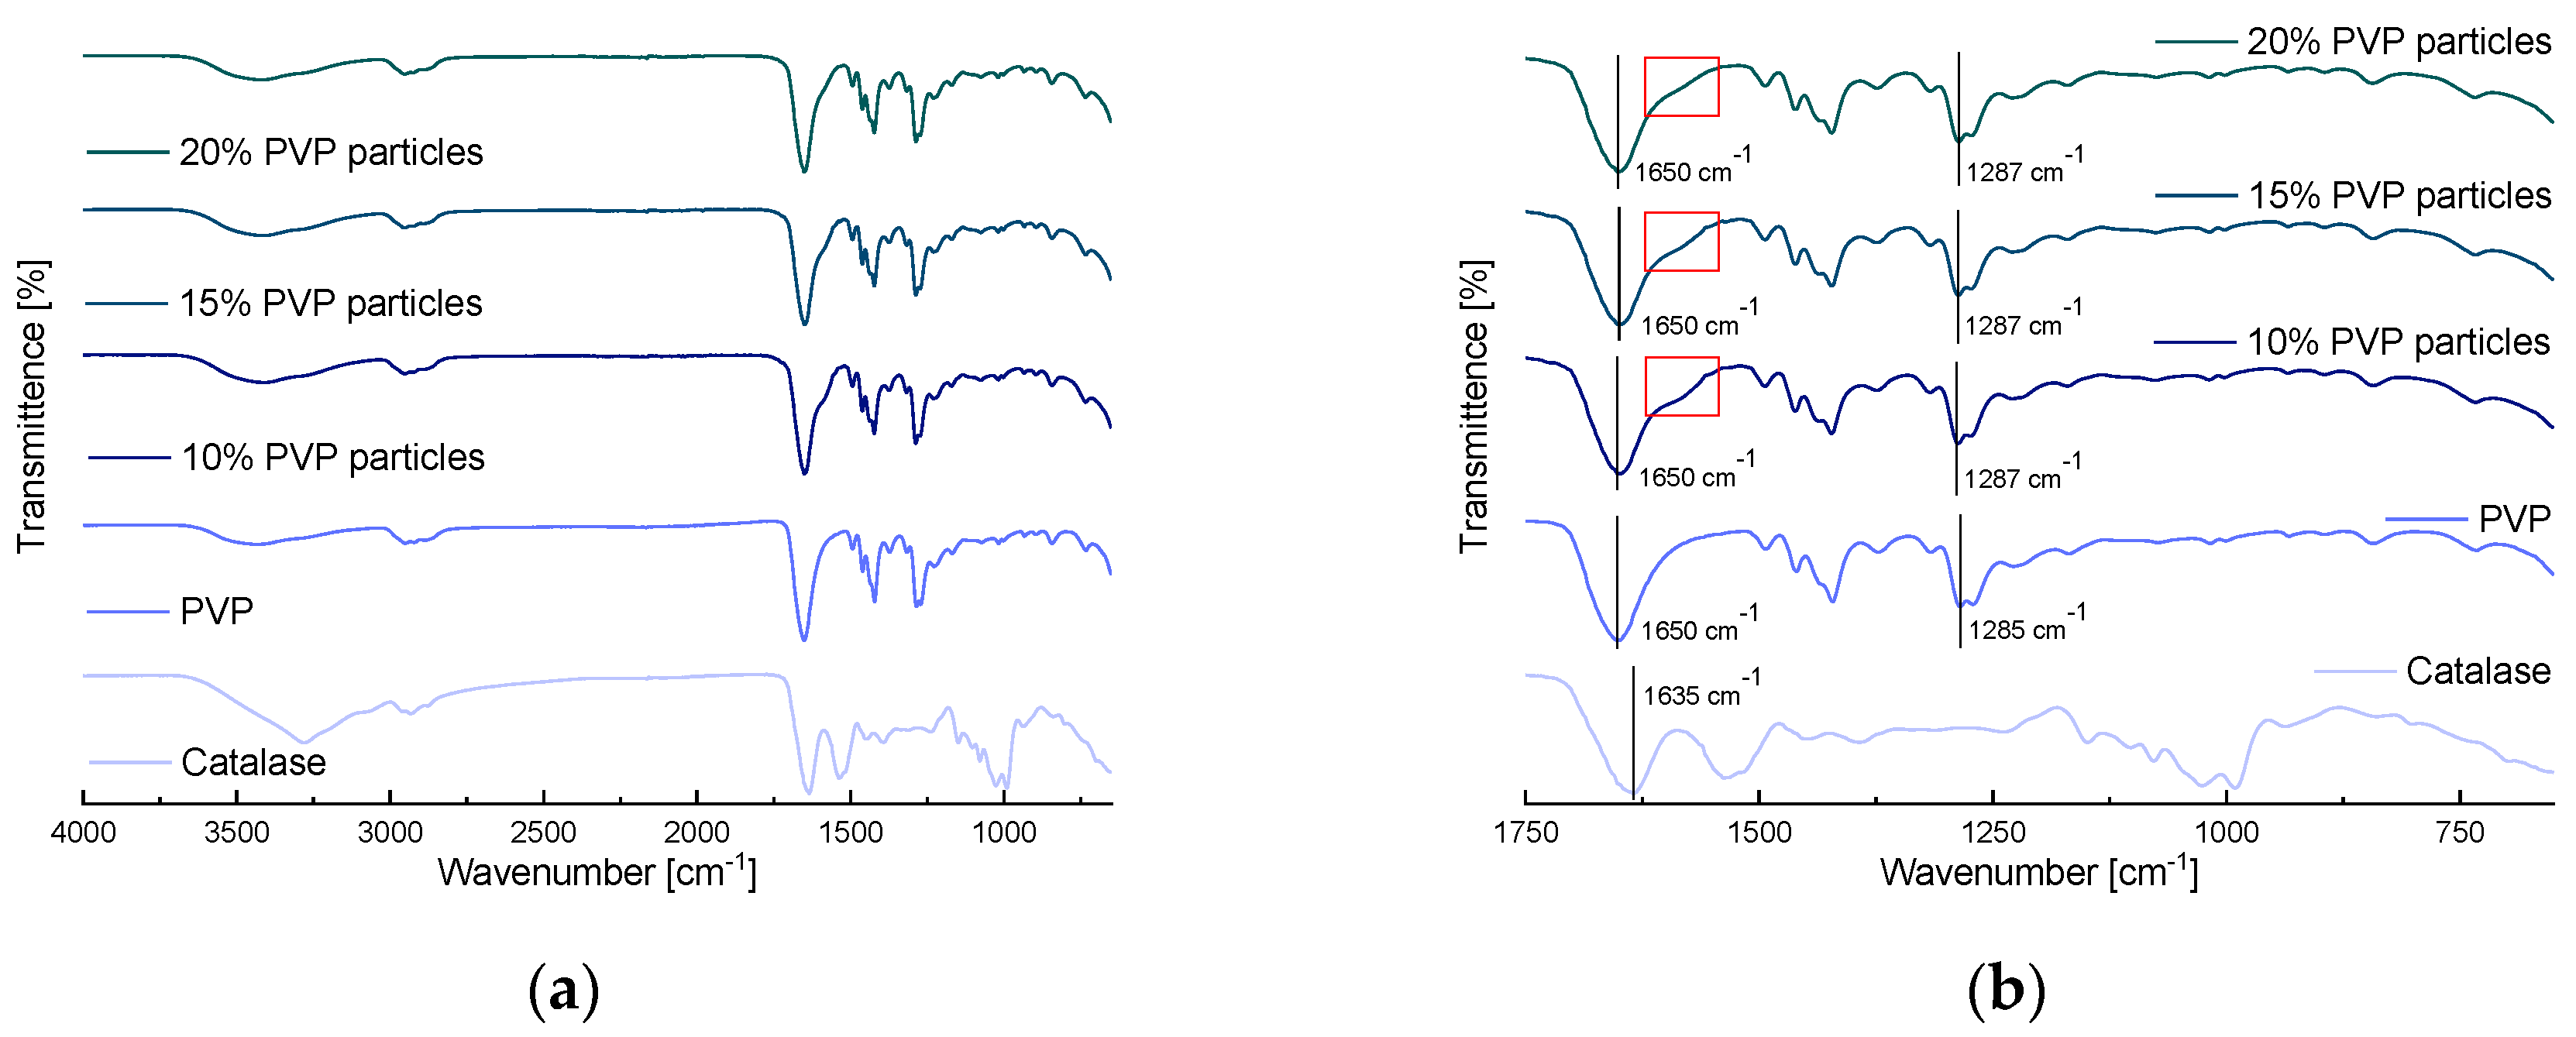
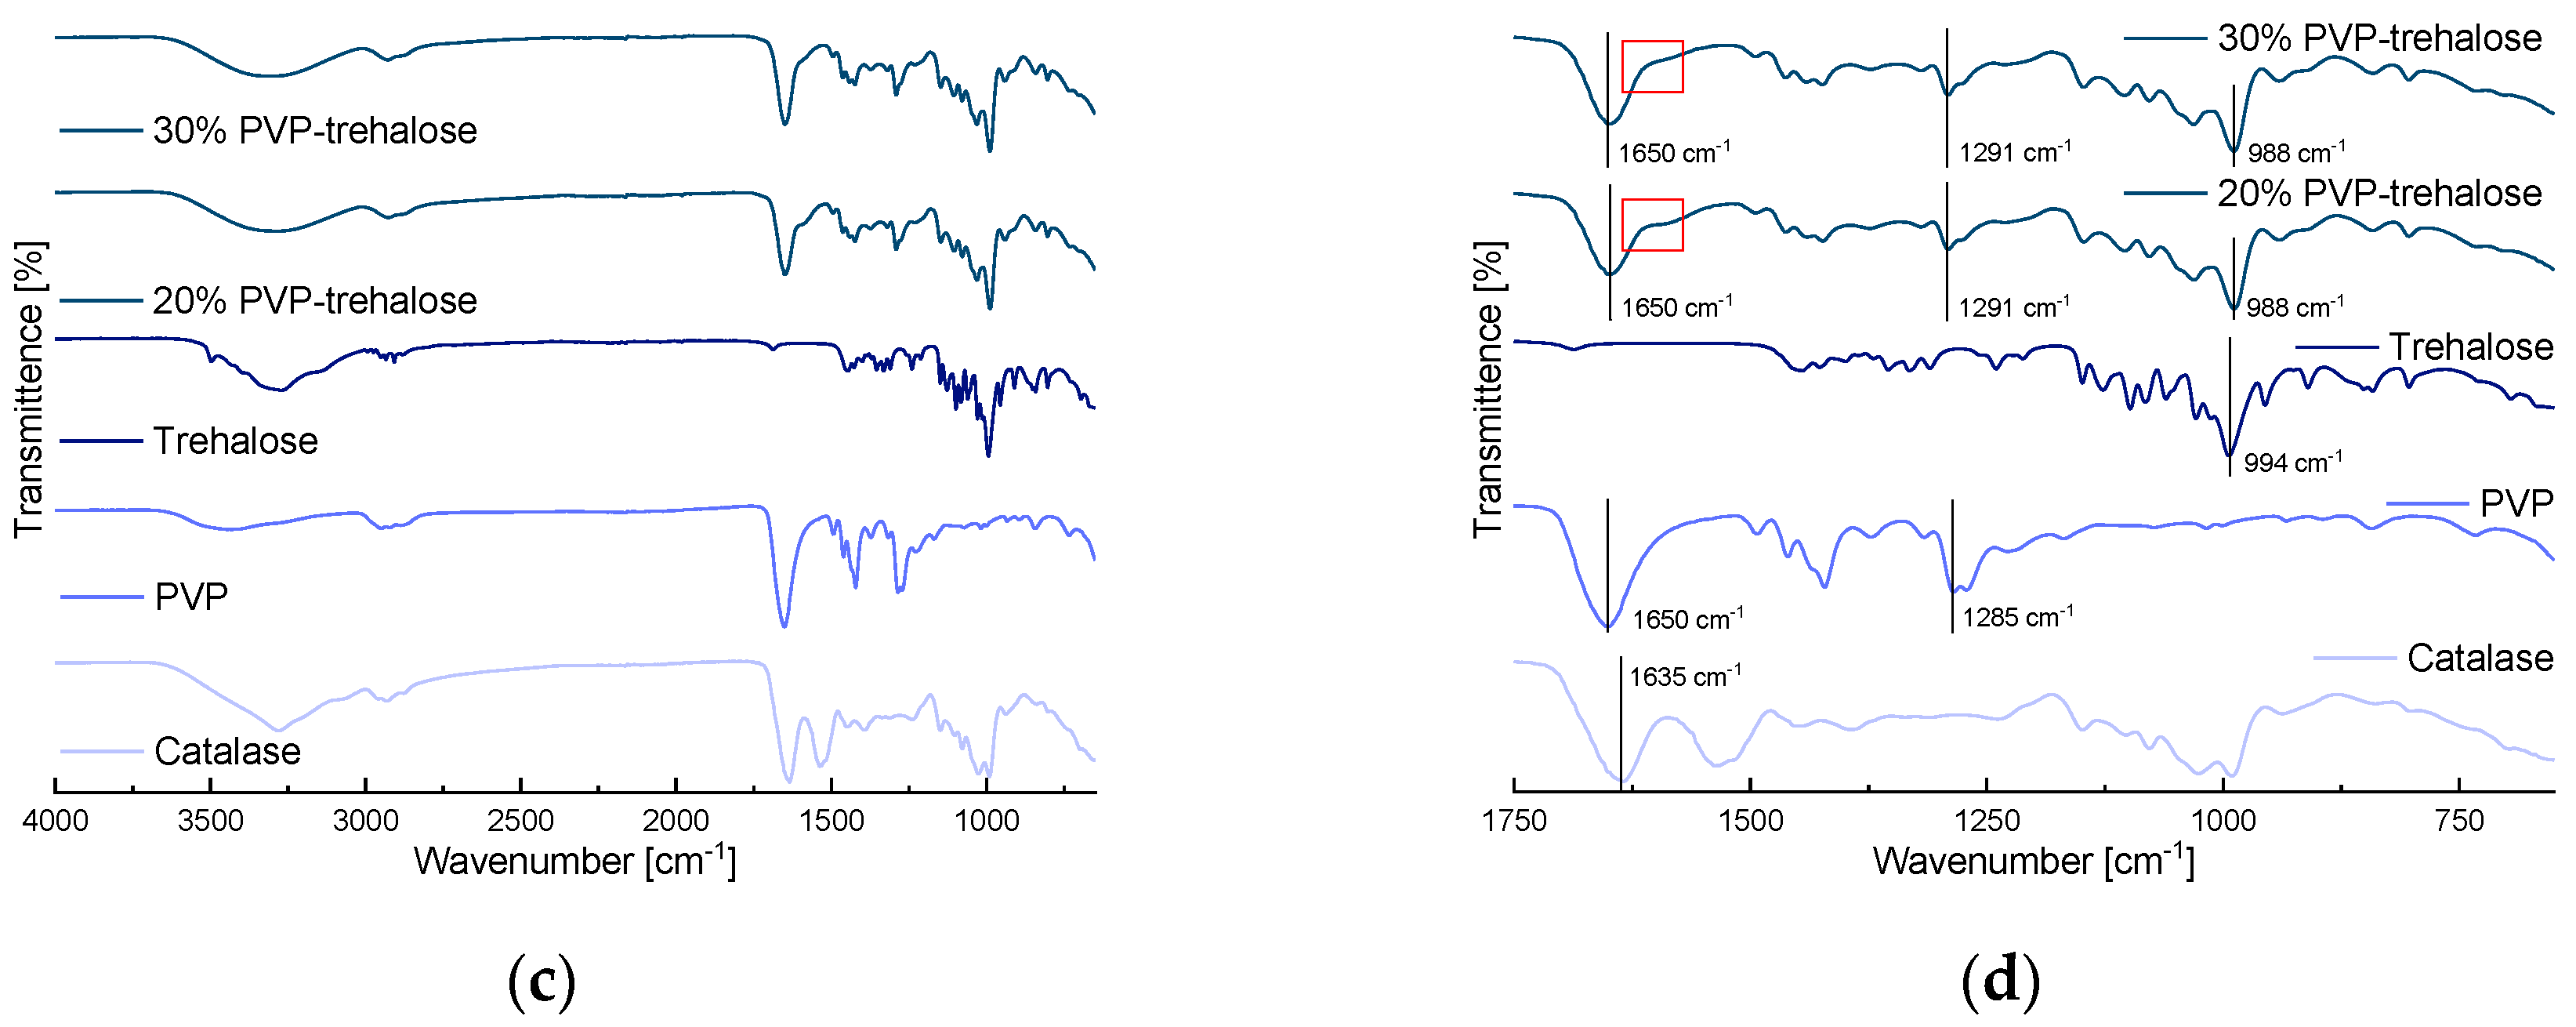
3.3.2. FTIR Spectroscopy
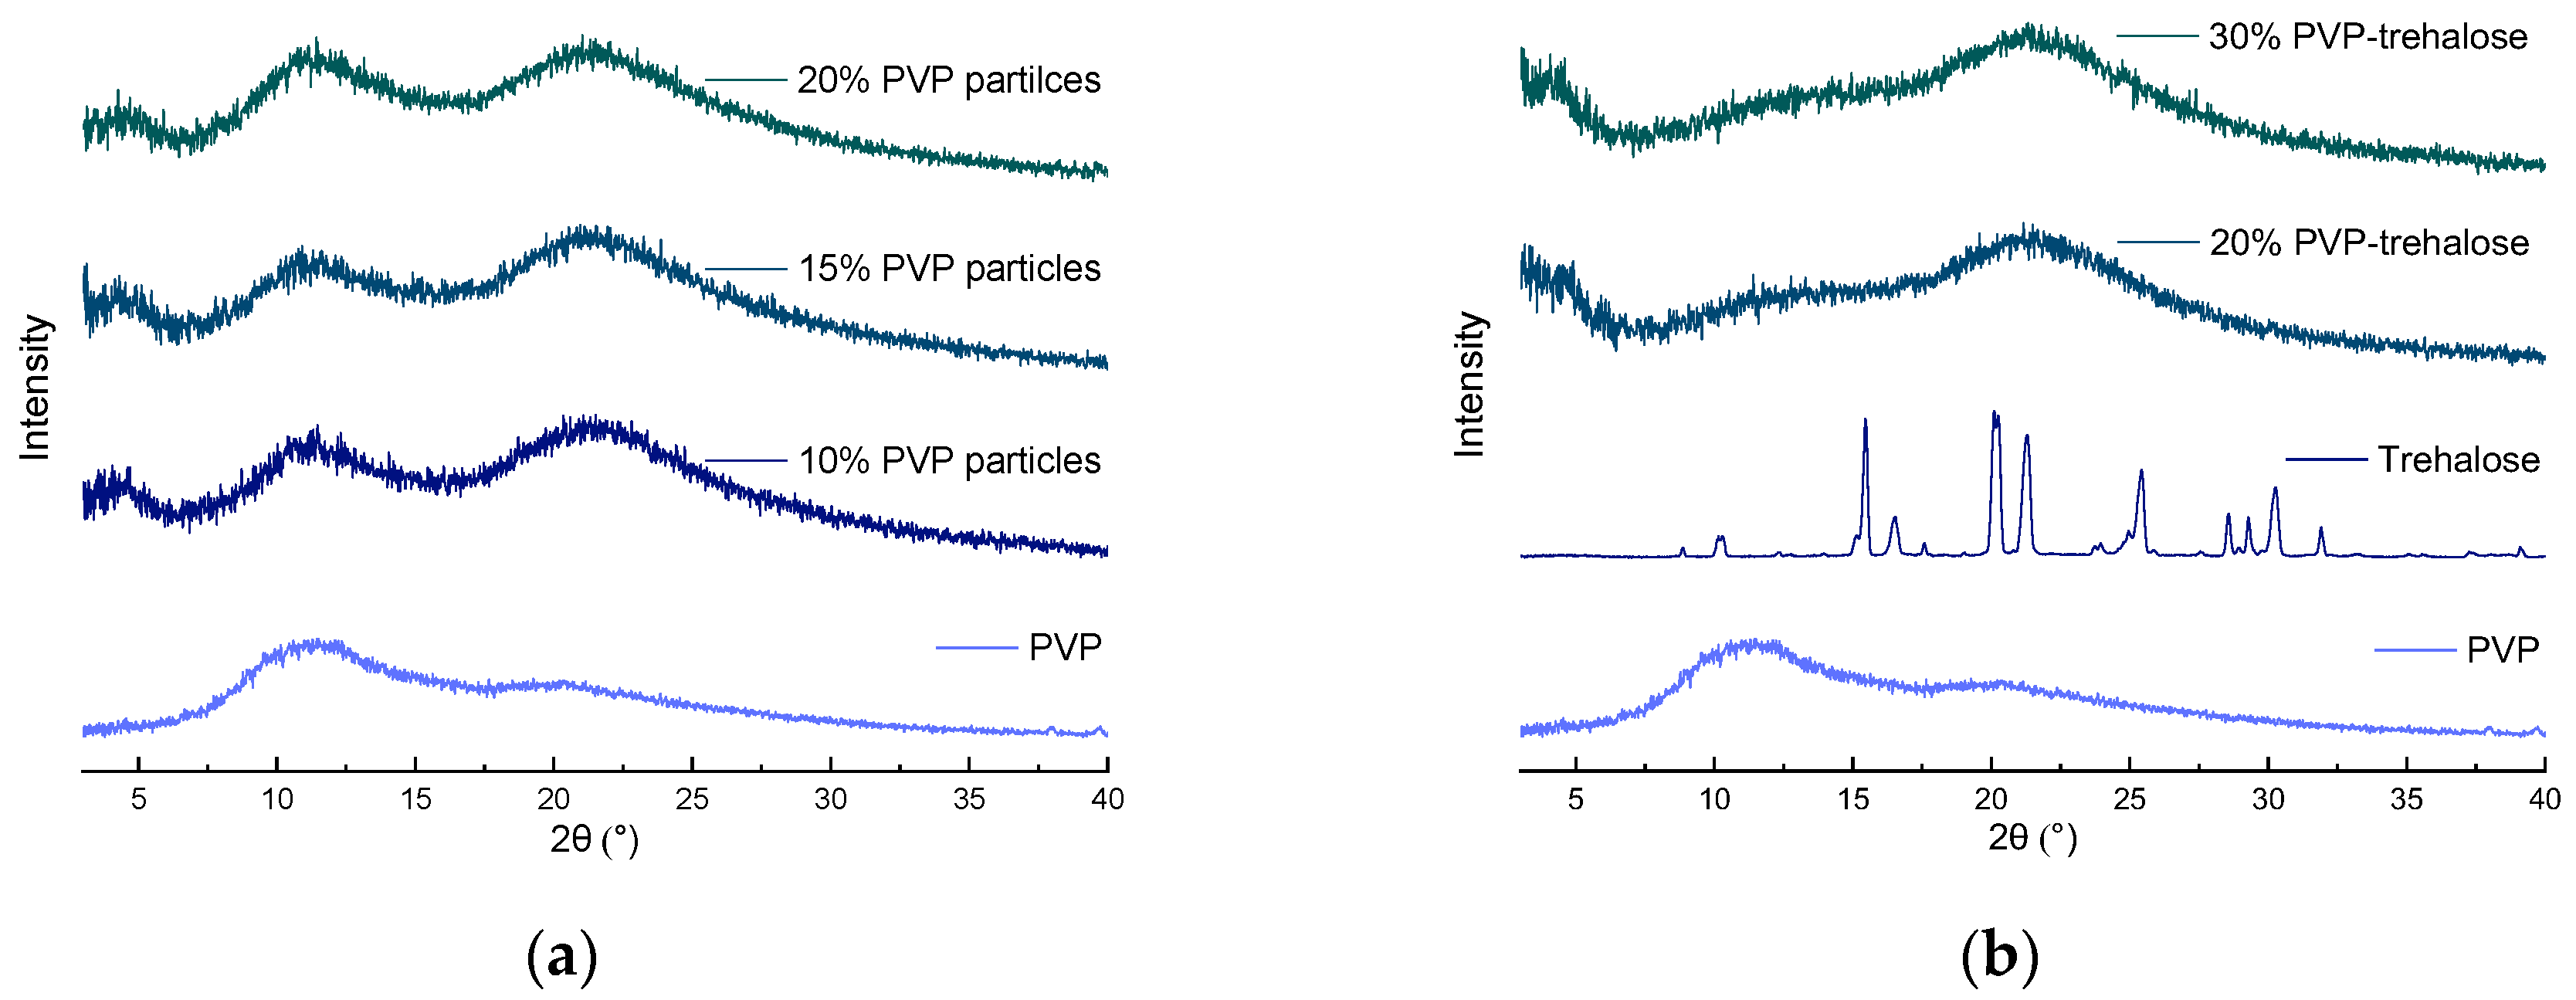
3.3.3. XRD
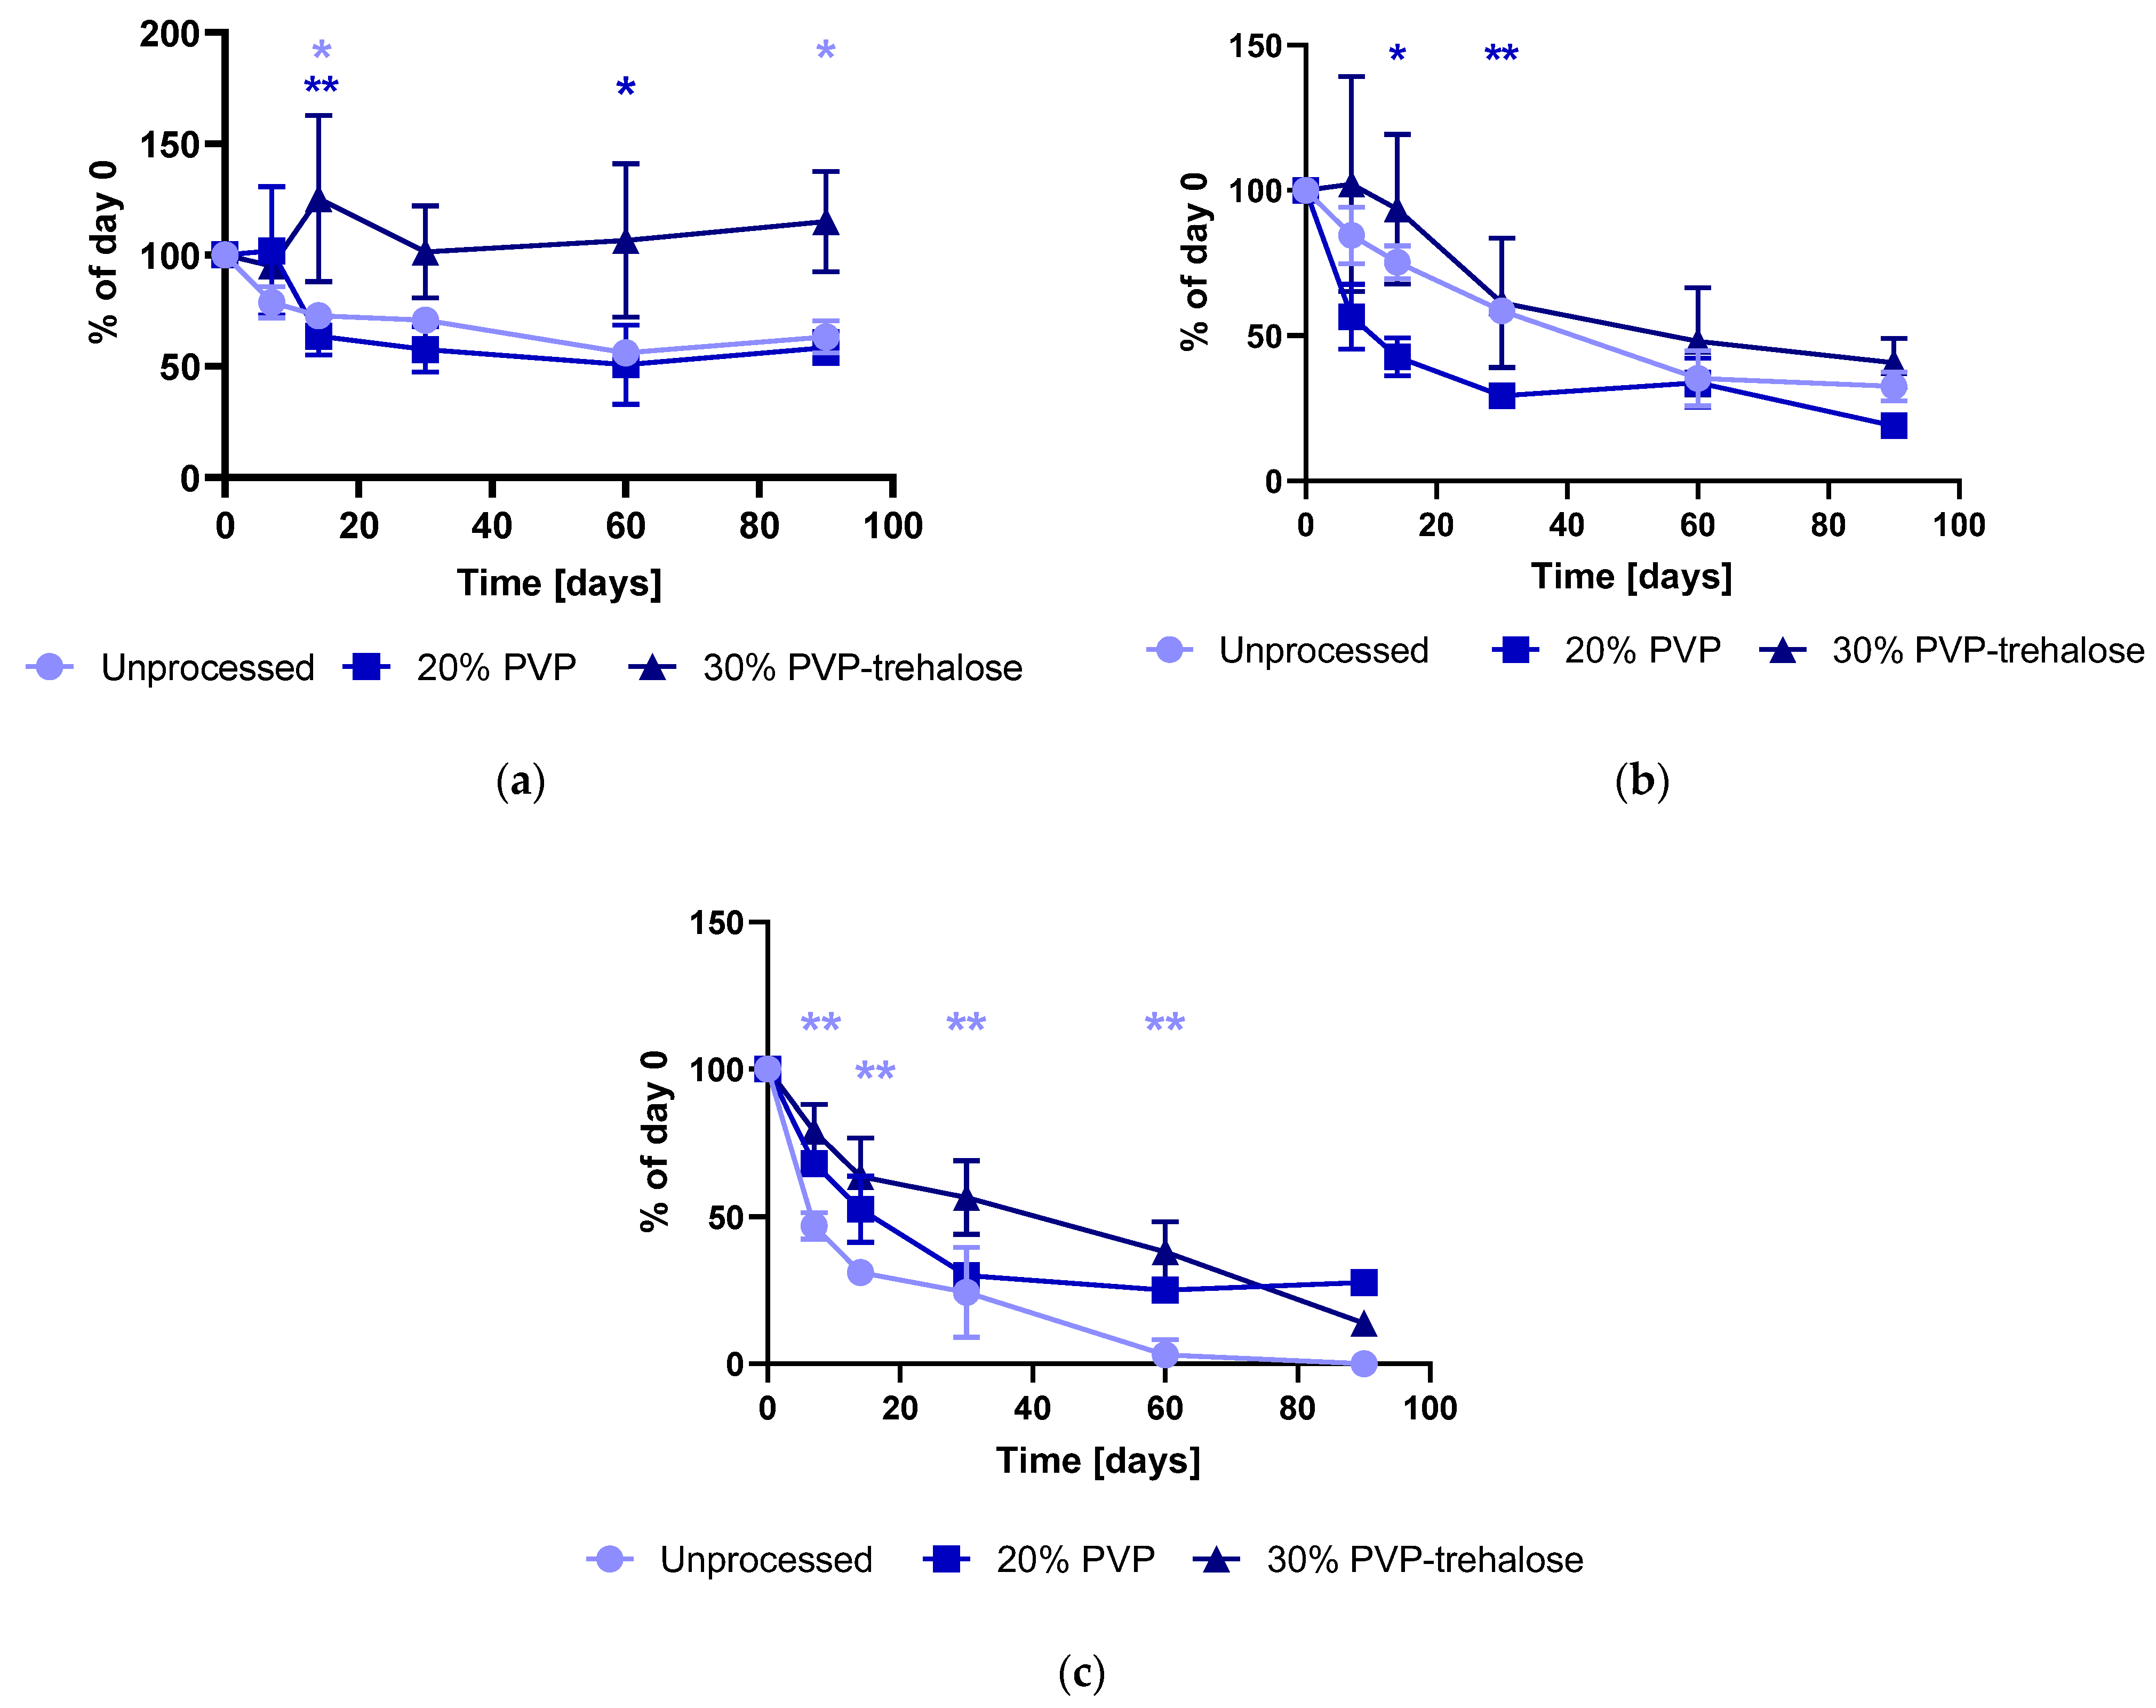
3.4. Catalase Stability in the Electrosprayed Particles
4. Conclusions
Supplementary Materials
Author Contributions
Funding
Institutional Review Board Statement
Informed Consent Statement
Data Availability Statement
Conflicts of Interest
References
- Bajracharya, R.; Song, J.G.; Back, S.Y.; Han, H.-K. Recent Advancements in Non-Invasive Formulations for Protein Drug Delivery. Comput. Struct. Biotechnol. J. 2019, 17, 1290–1308. [Google Scholar] [CrossRef] [PubMed]
- Leader, B.; Baca, Q.J.; Golan, D.E. Protein therapeutics: A summary and pharmacological classification. Nat. Rev. Drug Discov. 2008, 7, 21–39. [Google Scholar] [CrossRef] [PubMed]
- Moreira, A.; Lawson, D.; Onyekuru, L.; Dziemidowicz, K.; Angkawinitwong, U.; Costa, P.F.; Radacsi, N.; Williams, G.R. Protein encapsulation by electrospinning and electrospraying. J. Control. Release 2021, 329, 1172–1197. [Google Scholar] [CrossRef] [PubMed]
- Bobály, B.; Sipkó, E.; Fekete, J. Challenges in liquid chromatographic characterization of proteins. J. Chromatogr. B 2016, 1032, 3–22. [Google Scholar] [CrossRef]
- Crommelin, D.J.A.; Sindelar, R.D.; Meibohm, B. Pharmaceutical Biotechnology: Fundamentals and Applications, 5th ed.; Springer International Publishing: Cham, Switzerland, 2019; ISBN 978-3-030-00709-6. [Google Scholar]
- Nguyen, D.N.; Clasen, C.; Van den Mooter, G. Pharmaceutical Applications of Electrospraying. J. Pharm. Sci. 2016, 105, 2601–2620. [Google Scholar] [CrossRef] [Green Version]
- Ameri, M.; Maa, Y.-F. Spray Drying of Biopharmaceuticals: Stability and Process Considerations. Dry. Technol. 2006, 24, 763–768. [Google Scholar] [CrossRef]
- Zhang, J.; Pritchard, E.; Hu, X.; Valentin, T.; Panilaitis, B.; Omenetto, F.G.; Kaplan, D.L. Stabilization of vaccines and antibiotics in silk and eliminating the cold chain. Proc. Natl. Acad. Sci. USA 2012, 109, 11981–11986. [Google Scholar] [CrossRef] [Green Version]
- Geraldes, D.C.; Beraldo-de-Araújo, V.L.; Pardo, B.O.P.; Pessoa Junior, A.; Stephano, M.A.; de Oliveira-Nascimento, L. Protein drug delivery: Current dosage form profile and formulation strategies. J. Drug Target. 2020, 28, 339–355. [Google Scholar] [CrossRef]
- Li, X.; Su, Y.; Liu, S.; Tan, L.; Mo, X.; Ramakrishna, S. Encapsulation of proteins in poly(l-lactide-co-caprolactone) fibers by emulsion electrospinning. Colloids Surf. B Biointerfaces 2010, 75, 418–424. [Google Scholar] [CrossRef]
- Briggs, T.; Arinzeh, T.L. Examining the formulation of emulsion electrospinning for improving the release of bioactive proteins from electrospun fibers: Formulation of Emulsion Electrospinning. J. Biomed. Mater. Res. A 2014, 102, 674–684. [Google Scholar] [CrossRef]
- Chen, P.; Sun, Y.; Zhu, Z.; Wang, R.; Shi, X.; Lin, C.; Ye, Y. A controlled release system of superoxide dismutase by electrospun fiber and its antioxidant activity in vitro. J. Mater. Sci. Mater. Med. 2010, 21, 609–614. [Google Scholar] [CrossRef] [PubMed]
- Gomez, A.; Bingham, D.; de Juan, L.; Tang, K. Production of protein nanoparticles by electrospray drying. J. Aerosol Sci. 1998, 29, 561–574. [Google Scholar] [CrossRef]
- Domján, J.; Vass, P.; Hirsch, E.; Szabó, E.; Pantea, E.; Andersen, S.K.; Vigh, T.; Verreck, G.; Marosi, G.; Nagy, Z.K. Monoclonal antibody formulation manufactured by high-speed electrospinning. Int. J. Pharm. 2020, 591, 120042. [Google Scholar] [CrossRef] [PubMed]
- Angkawinitwong, U.; Awwad, S.; Khaw, P.T.; Brocchini, S.; Williams, G.R. Electrospun formulations of bevacizumab for sustained release in the eye. Acta Biomater. 2017, 64, 126–136. [Google Scholar] [CrossRef]
- Lee, D.-S.; Kang, D.W.; Choi, G.-W.; Choi, H.-G.; Cho, H.-Y. Development of Level A In Vitro–Vivo Correlation for Electrosprayed Microspheres Containing Leuprolide: Physicochemical, Pharmacokinetic, and Pharmacodynamic Evaluation. Pharmaceutics 2020, 12, 36. [Google Scholar] [CrossRef] [Green Version]
- Lancina, M.G.; Shankar, R.K.; Yang, H. Chitosan nanofibers for transbuccal insulin delivery. J. Biomed. Mater. Res. A 2017, 105, 1252–1259. [Google Scholar] [CrossRef] [Green Version]
- Williams, G.R.; Raimi-Abraham, B.T.; Luo, C.J. Nanofibres in Drug Delivery, 1st ed.; UCL Press: London, UK, 2018; ISBN 978-1-78735-018-2. [Google Scholar]
- Batens, M.; Dewaele, L.; Massant, J.; Teodorescu, B.; Clasen, C.; Van den Mooter, G. Feasibility of electrospraying fully aqueous bovine serum albumin solutions. Eur. J. Pharm. Biopharm. 2020, 147, 102–110. [Google Scholar] [CrossRef]
- Onyekuru, L.C.; Moreira, A.; Zhang, J.; Angkawinitwong, U.; Costa, P.F.; Brocchini, S.; Williams, G.R. An investigation of alkaline phosphatase enzymatic activity after electrospinning and electrospraying. J. Drug Deliv. Sci. Technol. 2021, 64, 102592. [Google Scholar] [CrossRef]
- Focarete, M.L.; Tampieri, A. Core-Shell Nanostructures for Drug Delivery and Theranostics: Challenges, Strategies, and Prospects for Novel Carrier Systems, 1st ed.; Woodhead Publishing: Duxford, UK, 2018; ISBN 978-0-08-102198-9. [Google Scholar]
- Zamocky, M.; Furtmüller, P.G.; Obinger, C. Evolution of Catalases from Bacteria to Humans. Antioxid. Redox Signal. 2008, 10, 1527–1548. [Google Scholar] [CrossRef] [Green Version]
- Prakash, K.; Prajapati, S.; Ahmad, A.; Jain, S.K.; Bhakuni, V. Unique oligomeric intermediates of bovine liver catalase. Protein Sci. 2002, 11, 46–57. [Google Scholar] [CrossRef]
- Abdel-Mageed, H.M.; Fahmy, A.S.; Shaker, D.S.; Mohamed, S.A. Development of novel delivery system for nanoencapsulation of catalase: Formulation, characterization, and in vivo evaluation using oxidative skin injury model. Artif. Cells Nanomed. Biotechnol. 2018, 46, 362–371. [Google Scholar] [CrossRef] [PubMed] [Green Version]
- Rhee, S.G.; Yang, K.-S.; Kang, S.W.; Woo, H.A.; Chang, T.-S. Controlled Elimination of Intracellular H2O2: Regulation of Peroxiredoxin, Catalase, and Glutathione Peroxidase via Post-translational Modification. Antioxid. Redox Signal. 2005, 7, 619–626. [Google Scholar] [CrossRef] [PubMed]
- Kübler, A.C. Photodynamic therapy. Med. Laser Appl. 2005, 20, 37–45. [Google Scholar] [CrossRef]
- Dziemidowicz, K.; Brocchini, S.; Williams, G.R. A simple route to functionalising electrospun polymer scaffolds with surface biomolecules. Int. J. Pharm. 2021, 597, 120231. [Google Scholar] [CrossRef]
- Li, X.; Cheng, Y.; Yi, C.; Hua, Y.; Yang, C.; Cui, S. Effect of ionic strength on the heat-induced soy protein aggregation and the phase separation of soy protein aggregate/dextran mixtures. Food Hydrocoll. 2009, 23, 1015–1023. [Google Scholar] [CrossRef]
- Carrotta, R.; Manno, M.; Giordano, F.M.; Longo, A.; Portale, G.; Martorana, V.; Biagio, P.L.S. Protein stability modulated by a conformational effector: Effects of trifluoroethanol on bovine serum albumin. Phys. Chem. Chem. Phys. 2009, 11, 4007. [Google Scholar] [CrossRef]
- Herskovits, T.T.; Gadegbeku, B.; Jaillet, H. On the Structural Stability and Solvent Denaturation of Proteins. J. Biol. Chem. 1970, 245, 2588–2598. [Google Scholar] [CrossRef]
- Nikolaidis, A.; Andreadis, M.; Moschakis, T. Effect of heat, pH, ultrasonication and ethanol on the denaturation of whey protein isolate using a newly developed approach in the analysis of difference-UV spectra. Food Chem. 2017, 232, 425–433. [Google Scholar] [CrossRef]
- Pérez-Masiá, R.; Lagaron, J.M.; López-Rubio, A. Surfactant-aided electrospraying of low molecular weight carbohydrate polymers from aqueous solutions. Carbohydr. Polym. 2014, 101, 249–255. [Google Scholar] [CrossRef] [Green Version]
- Parkins, D.A.; Lashmar, U.T. The formulation of biopharmaceutical products. Pharm. Sci. Technol. Today 2000, 3, 129–137. [Google Scholar] [CrossRef]
- Carpenter, J.F.; Manning, M.C. Rational Design of Stable Protein Formulation; Pharmaceutical Biotechnology; Springer: Boston, MA, USA, 2002; Volume 13, ISBN 978-1-4613-5131-3. [Google Scholar]
- Kamerzell, T.J.; Esfandiary, R.; Joshi, S.B.; Middaugh, C.R.; Volkin, D.B. Protein–excipient interactions: Mechanisms and biophysical characterization applied to protein formulation development. Adv. Drug Deliv. Rev. 2011, 63, 1118–1159. [Google Scholar] [CrossRef] [PubMed]
- Zapadka, K.L.; Becher, F.J.; Gomes dos Santos, A.L.; Jackson, S.E. Factors affecting the physical stability (aggregation) of peptide therapeutics. Interface Focus 2017, 7, 20170030. [Google Scholar] [CrossRef] [PubMed] [Green Version]
- Díaz-Montes, E. Dextran: Sources, Structures, and Properties. Polysaccharides 2021, 2, 554–565. [Google Scholar] [CrossRef]
- Mittal, K.L. Determination of CMC of Polysorbate 20 in Aqueous Solution by Surface Tension Method. J. Pharm. Sci. 1972, 61, 1334–1335. [Google Scholar] [CrossRef] [PubMed]
- Povey, J.F.; Smales, C.M.; Hassard, S.J.; Howard, M.J. Comparison of the effects of 2,2,2-trifluoroethanol on peptide and protein structure and function. J. Struct. Biol. 2007, 157, 329–338. [Google Scholar] [CrossRef]
- Kim, M.K.; Lee, J.Y.; Oh, H.; Song, D.W.; Kwak, H.W.; Yun, H.; Um, I.C.; Park, Y.H.; Lee, K.H. Effect of shear viscosity on the preparation of sphere-like silk fibroin microparticles by electrospraying. Int. J. Biol. Macromol. 2015, 79, 988–995. [Google Scholar] [CrossRef]
- Bock, N.; Woodruff, M.A.; Hutmacher, D.W.; Dargaville, T.R. Electrospraying, a Reproducible Method for Production of Polymeric Microspheres for Biomedical Applications. Polymers 2011, 3, 131–149. [Google Scholar] [CrossRef] [Green Version]
- Sharma, A.; Jain, C.P. Preparation and characterization of solid dispersions of carvedilol with PVP K30. Res. Pharm. Sci. 2010, 5, 49–56. [Google Scholar]
- Yang, H.; Yang, S.; Kong, J.; Dong, A.; Yu, S. Obtaining information about protein secondary structures in aqueous solution using Fourier transform IR spectroscopy. Nat. Protoc. 2015, 10, 382–396. [Google Scholar] [CrossRef]
- Haris, P.I.; Severcan, F. FTIR spectroscopic characterization of protein structure in aqueous and non-aqueous media. J. Mol. Catal. B Enzym. 1999, 7, 207–221. [Google Scholar] [CrossRef]
- Taylor, L.S.; York, P. Characterization of the Phase Transitions of Trehalose Dihydrate on Heating and Subsequent Dehydration. J. Pharm. Sci. 1998, 87, 347–355. [Google Scholar] [CrossRef] [PubMed]
- Williams, G.R.; Chatterton, N.P.; Nazir, T.; Yu, D.-G.; Zhu, L.-M.; Branford-White, C.J. Electrospun nanofibers in drug delivery: Recent developments and perspectives. Ther. Deliv. 2012, 3, 515–533. [Google Scholar] [CrossRef] [PubMed]
- Chen, Y.; Mutukuri, T.T.; Wilson, N.E.; Zhou, Q. Pharmaceutical protein solids: Drying technology, solid-state characterization and stability. Adv. Drug Deliv. Rev. 2021, 172, 211–233. [Google Scholar] [CrossRef]
- Stoddard, R.J.; Steger, A.L.; Blakney, A.K.; Woodrow, K.A. In pursuit of functional electrospun materials for clinical applications in humans. Ther. Deliv. 2016, 7, 387–409. [Google Scholar] [CrossRef] [PubMed]
- Cicerone, M.T.; Pikal, M.J.; Qian, K.K. Stabilization of proteins in solid form. Adv. Drug Deliv. Rev. 2015, 93, 14–24. [Google Scholar] [CrossRef] [Green Version]
- Li, Y.; Williams, T.D.; Topp, E.M. Effects of Excipients on Protein Conformation in Lyophilized Solids by Hydrogen/Deuterium Exchange Mass Spectrometry. Pharm. Res. 2008, 25, 259–267. [Google Scholar] [CrossRef]
- Mensink, M.A.; Nethercott, M.J.; Hinrichs, W.L.J.; van der Voort Maarschalk, K.; Frijlink, H.W.; Munson, E.J.; Pikal, M.J. Influence of Miscibility of Protein-Sugar Lyophilizates on Their Storage Stability. AAPS J. 2016, 18, 1225–1232. [Google Scholar] [CrossRef] [Green Version]
- Devineni, D.; Gonschorek, C.; Cicerone, M.T.; Xu, Y.; Carpenter, J.F.; Randolph, T.W. Storage stability of keratinocyte growth factor-2 in lyophilized formulations: Effects of formulation physical properties and protein fraction at the solid–air interface. Eur. J. Pharm. Biopharm. 2014, 88, 332–341. [Google Scholar] [CrossRef] [PubMed] [Green Version]
- Cortés-Ríos, J.; Zárate, A.M.; Figueroa, J.D.; Medina, J.; Fuentes-Lemus, E.; Rodríguez-Fernández, M.; Aliaga, M.; López-Alarcón, C. Protein Quantification by Bicinchoninic Acid (BCA) Assay Follows Complex Kinetics and Can Be Performed at Short Incubation Times. Anal. Biochem. 2020, 608, 113904. [Google Scholar] [CrossRef]


| Formulation | PVP [w/v] | Trehalose [w/v] | Polysorbate 20 [μg/mL] | Catalase [μg/mL] | Ethanol [v/v] |
|---|---|---|---|---|---|
| 20% PVP | 20% | - | 500 | 200 | 20% |
| (% w/w in the dried particles) | (99.7) | - | (0.3) | (0.1) | - |
| 30% PVP trehalose | 15% | 15% | 500 | 300 | 20% |
| (% w/w in the dried particles) | (49.85) | (49.85) | (0.2) | (0.1) | - |
Publisher’s Note: MDPI stays neutral with regard to jurisdictional claims in published maps and institutional affiliations. |
© 2022 by the authors. Licensee MDPI, Basel, Switzerland. This article is an open access article distributed under the terms and conditions of the Creative Commons Attribution (CC BY) license (https://creativecommons.org/licenses/by/4.0/).
Share and Cite
Schlosser, C.S.; Brocchini, S.; Williams, G.R. Stable Dried Catalase Particles Prepared by Electrospraying. Nanomaterials 2022, 12, 2484. https://doi.org/10.3390/nano12142484
Schlosser CS, Brocchini S, Williams GR. Stable Dried Catalase Particles Prepared by Electrospraying. Nanomaterials. 2022; 12(14):2484. https://doi.org/10.3390/nano12142484
Chicago/Turabian StyleSchlosser, Corinna S., Steve Brocchini, and Gareth R. Williams. 2022. "Stable Dried Catalase Particles Prepared by Electrospraying" Nanomaterials 12, no. 14: 2484. https://doi.org/10.3390/nano12142484