Communication

Polyacrylic Acid-Ca(Eu) Nanoclusters as a Luminescence Sensor of Phosphate Ion

1
State Key Laboratory of Advanced Technology for Material Synthesis and Processing, Wuhan University of Technology, Wuhan 430070, China
2
Foshan Xianhu Laboratory of the Advanced Energy Science and Technology Guangdong Laboratory, Xianhu Hydrogen Valley, Foshan 528200, China
*
Author to whom correspondence should be addressed.
Nanomaterials 2022, 12(14), 2398; https://doi.org/10.3390/nano12142398
Submission received: 25 June 2022 / Revised: 11 July 2022 / Accepted: 12 July 2022 / Published: 14 July 2022

Abstract

:
In this study, we synthesized polyacrylic acid (PAA)-Ca (Eu) nanoclusters as a luminescence sensor of phosphate ion by a complex method, and we aimed to achieve the quantitative detection of PO43− based on the sensitivity of the charge transfer band of Eu3+ to anionic ligand. The resulting PAA-Ca(Eu) nanoclusters showed a well-dispersed and a dot-like morphology, with an ultra-small diameter (the average size of 2.17 nm) under high resolution transmission electron microscopy(HRTEM) observation. A dynamic light scattering particle size analyzer (DLS) showed a hydrodynamic size of 2.39 nm. The (PAA)-Ca (Eu) nanoclusters as a luminescence sensor showed a significantly higher sensitivity for PO43− than other anions (CO32−, SiO32−, SO42−, SO32−, Br, Cl, F). The luminescence intensity displayed a linear increase (y = 19.32x + 74.75, R2 > 0.999) in a PO43 concentration range (0–10 mM) with the concentration of PO43− increase, and the limit of detection was 0.023 mM. The results showed good recovery rates and low relative standard deviations. These (PAA)-Ca (Eu) nanoclusters are hopeful to become a luminescence sensor for quantitatively detecting PO43−.

1. Introduction

Europium element with a unique 4f electron layer structure is a commonly used luminescent probe [1,2,3] due to its good optical stability, high thermal and chemical stability, narrow emission band, high resistance to photobleaching, and light quenching [4,5,6]. The excitation wavelength of Europium mainly includes the 350–475 nm band of energy levels transition and the charge transfer band (CTB) in the ultraviolet region [5,7]. The energy level transition excitation can obtain better near-infrared emission luminescence, which is mainly used in the biomedical field [6,8,9,10,11,12]. The CTB has unique properties, Eu3+ binds to the anionic ligand to form a CTB. The position of the charge transfer transition band depends on the ligand [13,14,15,16,17,18]. Therefore, the CTB of Eu3+ can be used for qualitative and quantitative analysis of the types and contents of anionic ligands. For example, CTB formed with phosphate in hydroxyapatite is at 254 nm, while CTB formed with anionic ligand in LaOF is at 285 nm [7,19].
Phosphorus plays an important role in organisms and the environment [20,21]. Excessive phosphate content in water can cause water pollution [22,23]. Phosphate in organisms participates in a variety of metabolism processes. Phosphate content is one of the important indicators of human health, and its quantitative detection is of great significance [24,25]. In this study, inspired by the biomineralization process of calcium phosphate, we used polyacrylic acid (PAA) to complex Ca2+ and Eu3+ ions to obtain PAA-Ca (Eu) nanoclusters as a sensor for the quantitative detection of PO43 based on the sensitivity of charge transfer band of Eu3+ to anionic ligand. The morphology, size, ion selectivity and luminescence of PAA-Ca (Eu) nanoclusters were characterized, and the mechanism of quantitative phosphate radical detection was analyzed and explained by luminescence spectra and molecular dynamics simulation (MDS).

2. Materials and Methods

2.1. Synthesis of PAA-Ca (Eu) Nanoclusters

The PAA-Ca(Eu) nanoclusters were prepared by a complex method. An aqueous Ca(Eu) solution (20 mL) was prepared using CaCl2·2H2O (99.42 mg, Sinopharm, Beijing, China) and Eu(NO3)·6H2O (33.52 mg, Aladdin, Shanghai, China) with a concentration of 37.575 mM in which the Eu3+/(Ca2+ + Eu3+) molar ratio was 10%. The solution was stirred vigorously to make it fully dissolved. An aqueous solution of PAA (average molecular weight of ~1800 g/mol, 216.43 mg, 20 mL, Sigma, St. Louis, USA) was quickly added to the aqueous Ca(Eu) solution, and the pH was adjusted to 7.5–8.0 using NH3·H2O (Sinopharm, Beijing, China) to yield the PAA-Ca(Eu) nanoclusters. The temperature of all the above solutions was room temperature (25 °C).

2.2. Characterization

High resolution transmission electron microscopy (HRTEM, Talos F200S, Waltham, MA, USA) was used to observe and to analyze the microstructure of the materials. Fourier transform infrared spectroscopy (FT-IR, Nicolet6700, Waltham, MA, USA) was used to record the spectra of the near infrared region (4000~400 cm−1), analyze and study the vibration mode of the characteristic peak of the material, identify the substance, and determine the chemical composition or relative content of the substance. A dynamic light scattering particle size analyzer (DLS, Malvern, UK) was used to measure the particle size distribution and the dispersion coefficient of solution. Luminescence excitation and emission spectra of samples were measured by luminescence spectrophotometer (970CRT, Shanghai Sanco, Shanghai, China).

2.3. Detection of PO43−

An aqueous solution of phosphate ion was prepared by Na2HPO4·12H2O and added to the PAA-Ca(Eu) nanoclusters solution. Finally, NH3·H2O was used to adjust the pH to 9.0–9.5 for luminescence detection.

2.4. Preparation of Buffer Solution

A total of 1.07 g of NH4Cl (Sinopharm, Beijing, China) was added to 100 mL of deionized water. After it was fully dissolved, ammonia was added to adjust the pH of the aqueous solution to 8.0 to obtain the buffer solution.

2.5. Molecular Dynamics Simulation

All MDS employed the AMBER/general AMBER force field. In the cubic simulation unit with an initial size of 10 nm, the step change was set to 1 fs, and all simulations were run for 50 ns in real time using Gromacs 2018 software package [26,27].

3. Results and Discussion

3.1. Structure Characterization

First, the microstructure and the particle size of PAA-Ca (Eu) nanoclusters were characterized (Figure 1). Through HRTEM, it can be seen that the nanoclusters present dot-like particles, and the nanoclusters do not gather directly. The particle size also presents a relatively uniform distribution. Through the statistics of the nanoclusters in the HRTEM image, their particle size is concentrated in the range of 1.8–2.4 nm (this particle size range accounts for 88% of the total particle size), with an average particle size of 2.17 nm. DLS test results also showed a similar hydrodynamic size (2.39 nm).
In addition, FT-IR spectra of PAA-Ca (Eu) nanoclusters and samples with different PO43− additions are shown in Figure 2. The absorption peak at 3478 cm−1 is the O-H stretching vibration peak in PAA molecule [28]. The absorption peaks at 1556 cm−1 and 1401 cm−1 are the asymmetric stretching vibration peak (νas(COO)) and the symmetric stretching vibration peak (νs(COO)) of COO in the PAA molecule, respectively. Compared with pure PAA, the C=O absorption peak shifts to a low frequency and the C-O absorption peak shifts to a high frequency, which νas(COO)–νs(COO) is approximately 150 cm−1, indicating that the coordination between carboxylic acid and the metal ions in PAA is a bridge coordination compound [29,30]. After adding PO43−, the absorption peak of the phosphate ion appeared obviously in the infrared spectrum, which was located at 1104 cm−1, 1072 cm−1 and 536 cm−1, belonging to the asymmetric stretching (ν3) and the asymmetric angle change (ν4) of PO43− [31,32].

3.2. Luminescent Characterization

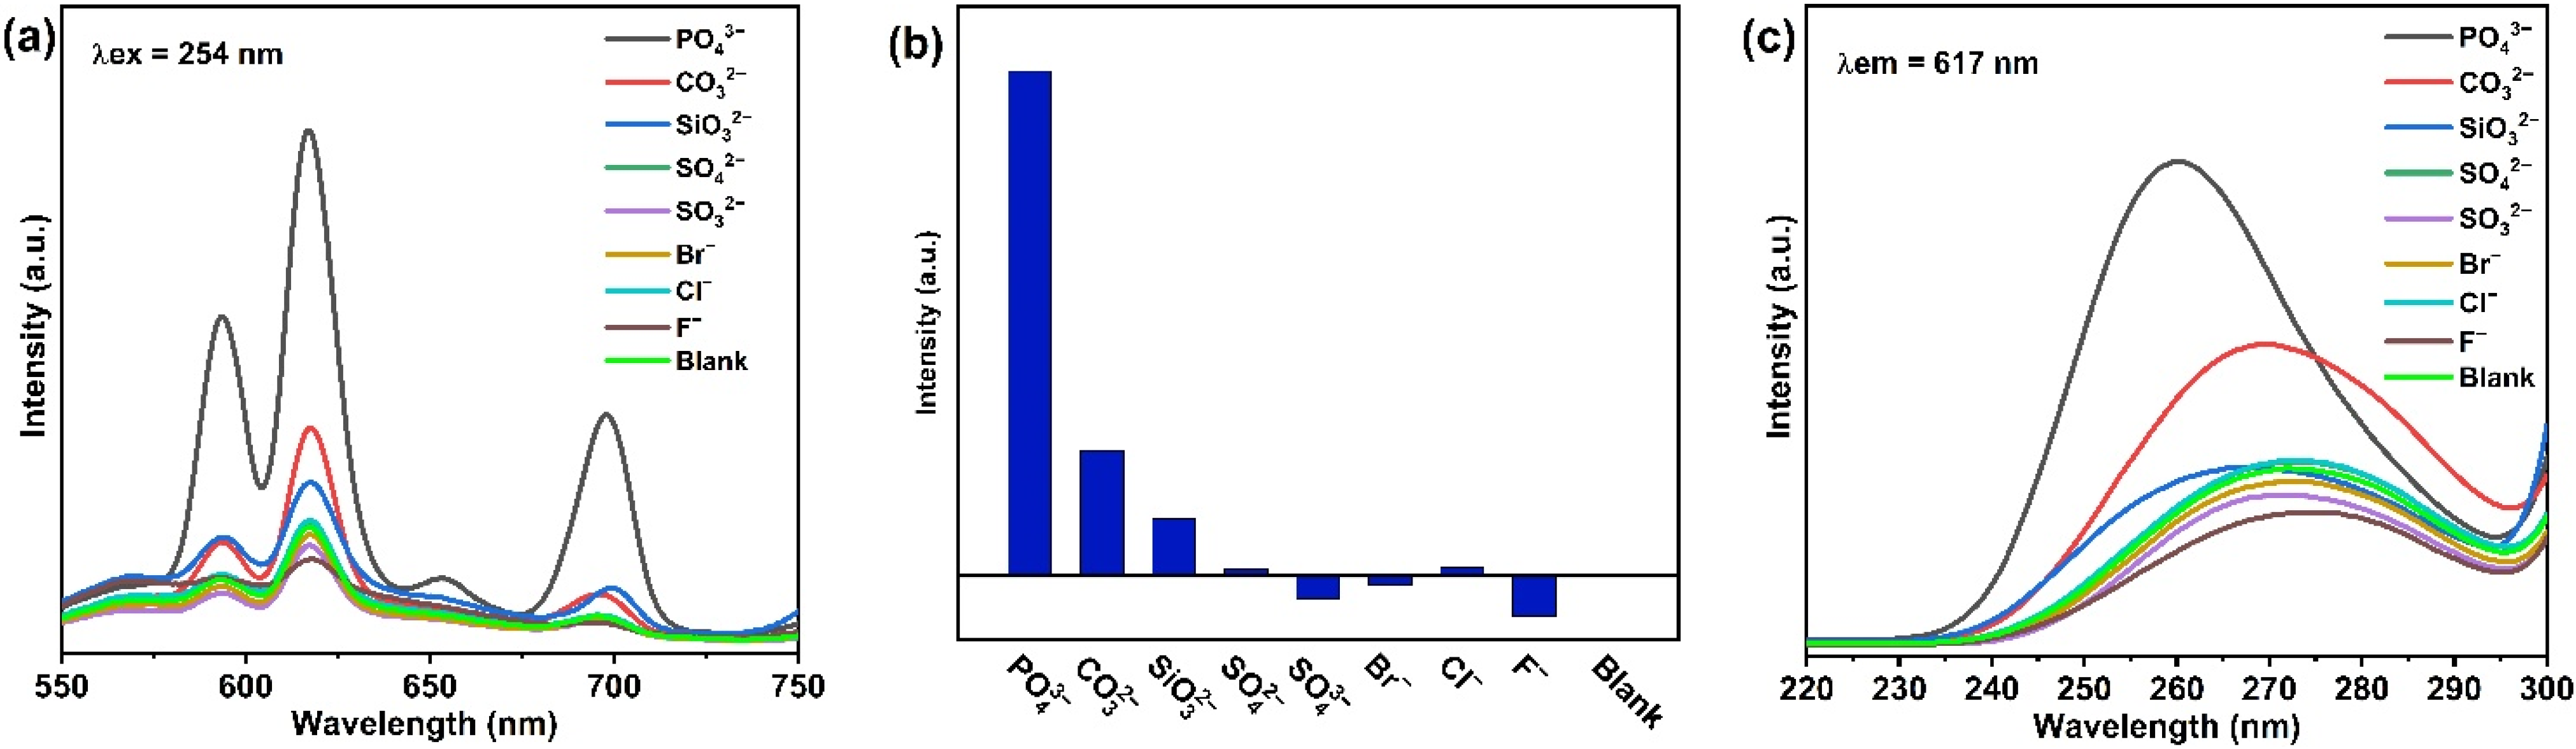
3.2.1. Ion Selectivity

PAA-Ca(Eu) nanoclusters were used as sensors to detect common anions (the anion concentration was 10 mM). As shown in Figure 3a, PO43− is the most sensitive to the sensor, and it has the highest luminescence intensity. The luminescence emission peak with the maximum luminescence intensity (617 nm) was selected for comparison, as shown in Figure 3b. It can be more intuitively observed that the sensor is sensitive to PO43−. Figure 3c shows that CTB positions and intensities are different for different anionic ligands. The CTB of PO43− position is unique, and it is the strongest. All of the above indicated that PAA-Ca (Eu) nanoclusters could be used for the detection of PO43− concentration.

3.2.2. Detection of PO43− Concentration

In the emission spectrum excited at 254 nm, Eu3+ showed characteristic emission at 594 (5D07F1), 617 (5D07F2), 654 (5D07F3), and 699 nm (5D07F4) (Figure 4a). Figure 4b shows that with the increase of PO43− concentration, the increase of luminescence first increased and then remained basically unchanged. The linear fitting of PO43− concentration in the range of 0–10 mM showed that the linear equation was y = 19.32x + 74.75, and its R2 was 0.999, indicating that PAA-Ca(Eu) nanoclusters can quantitatively detect PO43− in this concentration range. In the excitation spectrum, Eu-O CTB gradually moved to the left from 273.7 nm to 258.6 nm with the increase of PO43− concentration, indicating that the anion ligand connected to Eu3+ changed during this process.
LOD = 3σ/K
The detection limit of the fluorescent sensor is calculated using Formula (1), where LOD is limit of detection, σ is the standard deviation of the blank, and K is the slope of the linear relationship. We tested six groups of blank samples, obtained their standard deviation, and calculated that the detection limit of the luminescence sensor for PO43− was 0.023 mM. It shows that the sensor can be used to detect PO43− in serum and other samples [33]. We added a known concentration of PO43− to the sample, which reacted with PAA-Ca(Eu) nanoclusters, and then tested its luminescence at 254 nm excitation wavelength. According to the emission peak intensity at 617 nm and the linear equation in Figure 4b, the spiked recovery rate of PO43− in the sample was calculated. The results are shown in Table 1. Overall, all samples showed good recovery rates and low relative standard deviations (RSD) within the linear range, making PAA-Ca(Eu) nanoclusters a sensor for PO43− quantitative detection.

3.2.3. Buffer Solution

It can be seen from Figure 5 that in an aqueous solution and a buffer solution, the luminescence intensity of the PAA-Ca(Eu) nanoclusters is basically the same after reacting with PO43− of the same concentration. It proved that the luminescence sensor also has a good sensing function in the buffer solution.

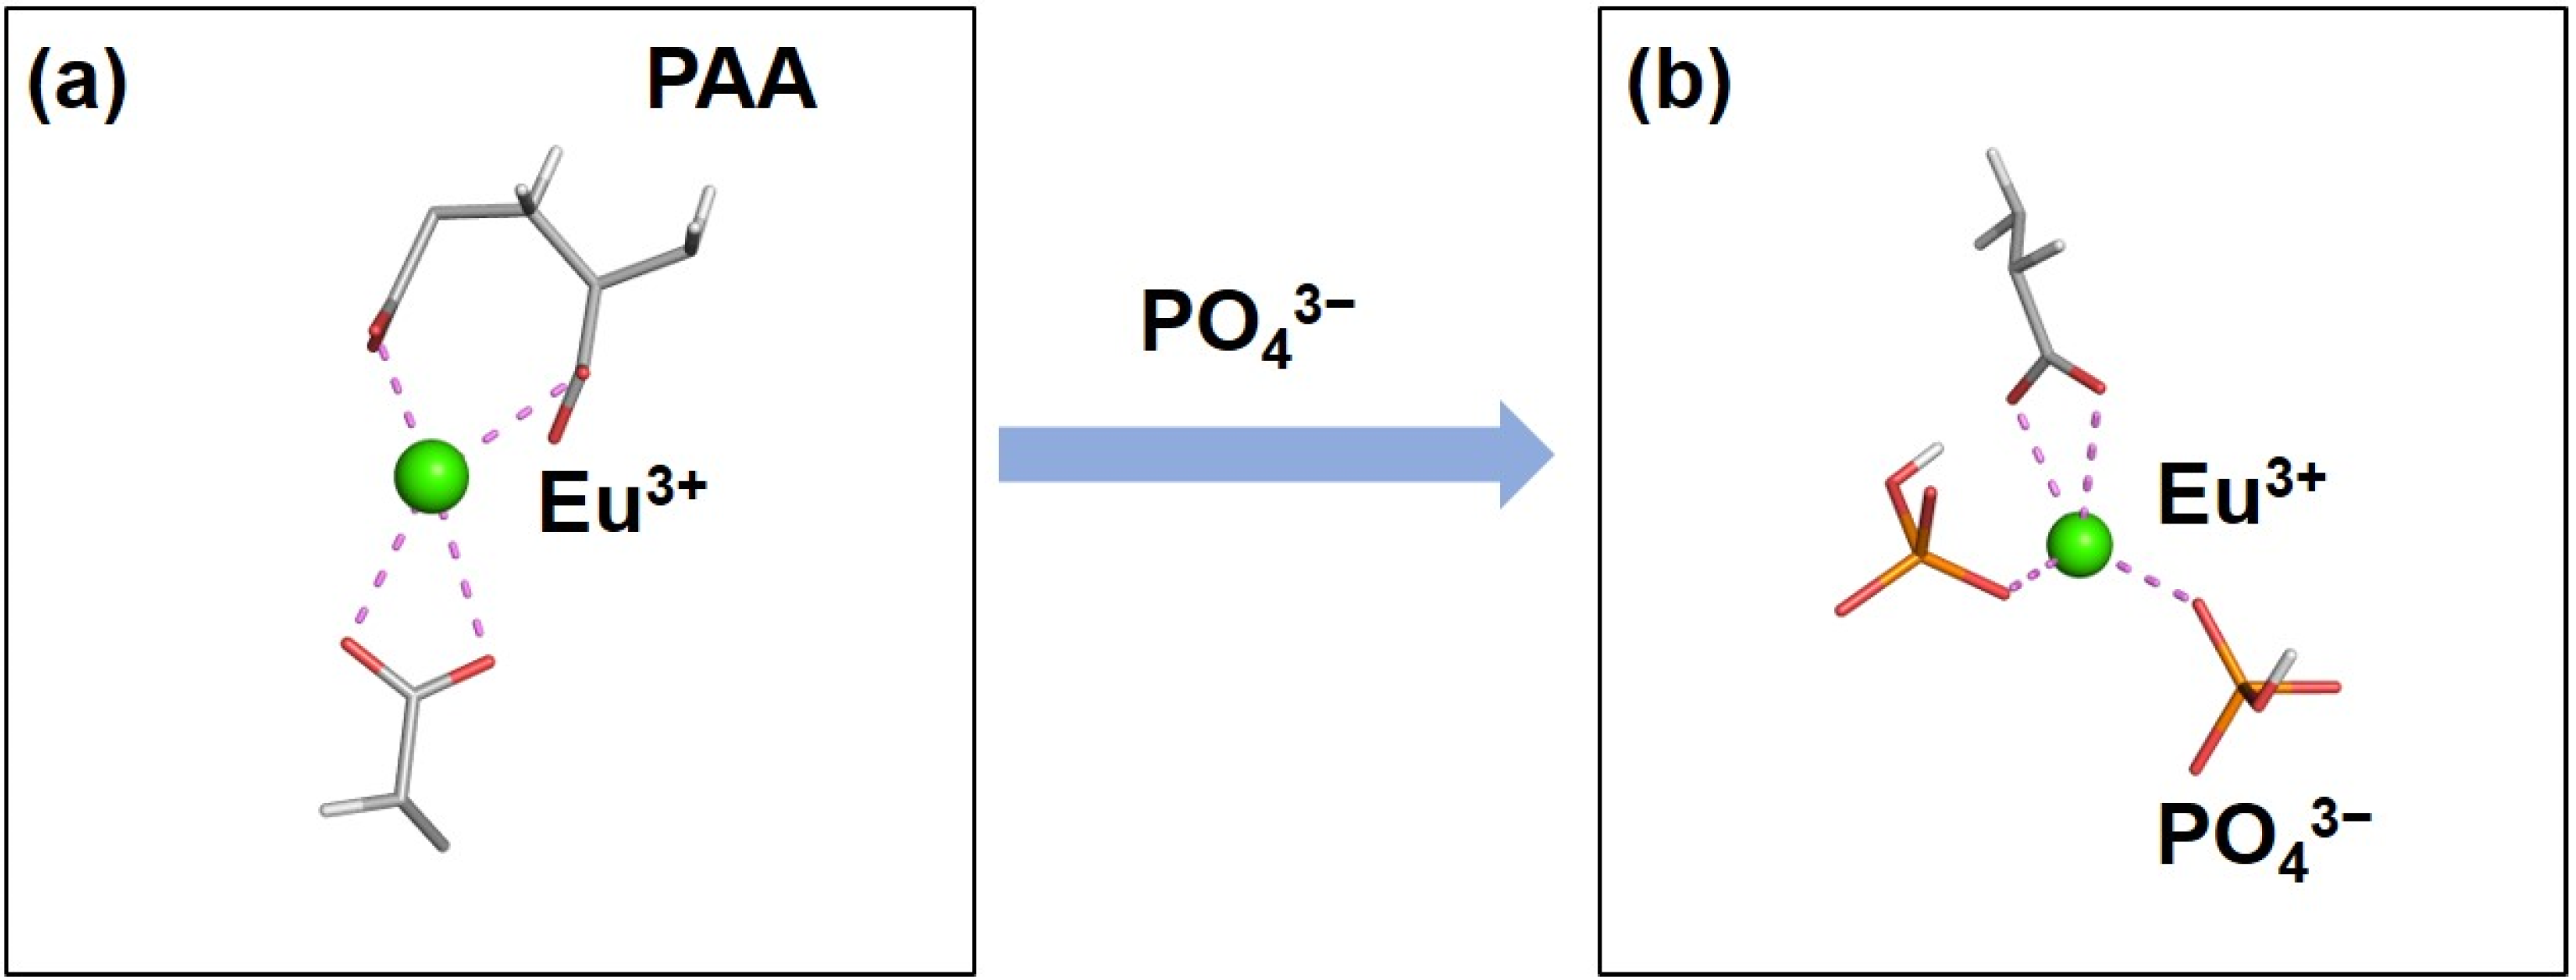
3.3. Mechanism of PO43− Concentration Detection

After adding PO43− to PAA-Ca(Eu) nanoclusters, the vibrational peak of PO43− appeared in FT-IR, and the peak position and intensity of CTB changed in the excitation spectra (λem = 617 nm), indicating that the anions bonded with Eu changed in this process. In addition, MDS showed that Eu3+ combines with the oxygen anion of the PAA carboxyl group in PAA-Ca(Eu) nanoclusters, showing Eu–O1 CTB (Figure 6a). When PO43− was added to the PAA-Ca(Eu) nanoclusters, the COO bonded Eu3+ was bound by the oxygen anion of PO43−, displaying a new Eu–O2 CTB (Figure 6b). This change in the bonding state of Eu3+ caused an increased energy state, corresponding to the shift to a low wavelength and an increased luminescence intensity. Based on this mechanism, the quantitative detection of PO43− can be realized.

4. Conclusions

In conclusion, we synthesized ultra-small PAA-Ca(Eu) nanoclusters with an average particle size of 2.17 nm under HRTEM observation. The nanoclusters are sensitive to PO43−, and they can be used for quantitative detection of PO43− in a certain concentration range (0–10 mM), with good linear correlation. The LOD is 0.023 mM. Based on the sensitivity of CTB of Eu3+ to anionic ligand, the quantitative detection of PO43− can be carried out. In addition, the detected concentration range by the PAA-Ca(Eu) nanoclusters sensor covers the content of PO43− in serum, urine, and sewage. So, it is hoped that it can detect PO43− in physiological conditions and a natural environment.

Author Contributions

Conceptualization, C.S. and Y.H; methodology, C.S.; data curation, Q.S. and Z.D.; writing—original draft preparation, C.S.; writing—review and editing, Y.H. All authors have read and agreed to the published version of the manuscript.

Funding

This research received no external funding.

Data Availability Statement

All data supporting the research results are provided in this paper, and relevant data are also available from corresponding authors. The original data for relevant Figures can also be obtained from corresponding authors.

Acknowledgments

This work was supported by the Foshan Xianhu Laboratory of the Advanced Energy Science and Technology Guangdong Laboratory (XHT2020-008).

Conflicts of Interest

The authors declare no conflict of interest.

References

  1. Chen, L.; Cheng, P.; Zhang, Z.; He, L.; Oeckler, O. Reduced Local Symmetry in Lithium Compound Li2SrSiO4 Distinguished by an Eu3+ Spectroscopy Probe. Adv. Sci. 2019, 6, 1802126. [Google Scholar] [CrossRef] [PubMed] [Green Version]
  2. Ma, H.; Song, B.; Wang, Y.X.; Cong, D.Y.; Jiang, Y.F.; Yuan, J.L. Dual-emissive nanoarchitecture of lanthanide-complex- modified silica particles for in vivo ratiometric time-gated luminescence imaging of hypochlorous acid. Chem. Sci. 2017, 8, 150–159. [Google Scholar] [CrossRef] [PubMed] [Green Version]
  3. Pan, H.; Xu, S.; Ni, Y.H. Rare-earth post-modified Zn-based coordination polymer microspheres: Simple room-temperature preparation, fluorescent performances and application for detection of tryptophane. Sens. Actuators B-Chem. 2019, 283, 731–739. [Google Scholar] [CrossRef]
  4. Gupta, S.K.; Kadam, R.M.; Pujari, P.K. Lanthanide spectroscopy in probing structure-property correlation in multi-site photoluminescent phosphors. Coord. Chem. Rev. 2020, 420, 213–405. [Google Scholar] [CrossRef]
  5. Binnemans, K. Interpretation of europium(III) spectra. Coord. Chem. Rev. 2015, 295, 1–45. [Google Scholar] [CrossRef] [Green Version]
  6. Syamchand, S.S.; Sony, G. Europium enabled luminescent nanoparticles for biomedical applications. J. Lumin. 2015, 165, 190–215. [Google Scholar] [CrossRef]
  7. Xing, Q.; Zhang, X.; Wu, D.; Han, Y.; Nirmali Wickramaratne, M.; Dai, H.; Wang, X. Ultrasound-Assisted Synthesis and Characterization of Heparin-Coated Eu3+ Doped Hydroxyapatite Luminescent Nanoparticles. Colloid Interface Sci. Commun. 2019, 29, 17–25. [Google Scholar] [CrossRef]
  8. Ma, B.J.; Zhang, S.; Qiu, J.C.; Li, J.H.; Sang, Y.H.; Xia, H.B.; Jiang, H.D.; Claverie, J.; Liu, H. Eu/Tb codoped spindle-shaped fluorinated hydroxyapatite nanoparticles for dual-color cell imaging. Nanoscale 2016, 8, 11580–11587. [Google Scholar] [CrossRef]
  9. Zhang, T.T.; Wang, Z.J.; Xiang, H.J.; Xu, X.; Zou, J.; Lu, C.C. Biocompatible Superparamagnetic Europium-Doped Iron Oxide Nanoparticle Clusters as Multifunctional Nanoprobes for Multimodal In Vivo Imaging. ACS Appl. Mater. Interfaces 2021, 13, 33850–33861. [Google Scholar] [CrossRef]
  10. Liu, Y.T.; Zhou, S.X.; Fan, L.Z.; Fan, H. Synthesis of red fluorescent graphene quantum dot-europium complex composites as a viable bioimaging platform. Microchim. Acta 2016, 183, 2605–2613. [Google Scholar] [CrossRef]
  11. Podyachev, S.N.; Zairov, R.R.; Mustafina, A.R. 1,3-Diketone Calix 4 arene Derivatives-A New Type of Versatile Ligands for Metal Complexes and Nanoparticles. Molecules 2021, 26, 1214. [Google Scholar] [CrossRef] [PubMed]
  12. Zairov, R.R.; Dovzhenko, A.P.; Sapunova, A.S.; Voloshina, A.D.; Tatarinov, D.A.; Nizameev, I.R.; Gubaidullin, A.T.; Petrov, K.A.; Enrichi, F.; Vomiero, A.; et al. Dual red-NIR luminescent Eu-Yb heterolanthanide nanoparticles as promising basis for cellular imaging and sensing. Mater. Sci. Eng. C-Mater. Biol. Appl. 2019, 105, 110057. [Google Scholar] [CrossRef]
  13. Dorenbos, P. Systematic behaviour in trivalent lanthanide charge transfer energies. J. Phys.-Condens. Matter 2003, 15, 8417–8434. [Google Scholar] [CrossRef]
  14. Dorenbos, P. The Eu3+ charge transfer energy and the relation with the band gap of compounds. J. Lumin. 2005, 111, 89–104. [Google Scholar] [CrossRef]
  15. Zhou, B.Y.; Du, H.; Luo, P.L.; Ye, J.Y. Structural and luminescent properties of YOF:Eu3+ nanocrystals embedded glass-ceramics derived by Spark Plasma Sintering. Opt. Mater. 2021, 118, 111247. [Google Scholar] [CrossRef]
  16. Li, L.; Zhang, S.Y. Dependence of charge transfer energy on crystal structure and composition in Eu3+-doped compounds. J. Phys. Chem. B 2006, 110, 21438–21443. [Google Scholar] [CrossRef]
  17. Kitagawa, Y.; Ueda, J.; Fujii, K.; Yashima, M.; Funahashi, S.; Nakanishi, T.; Takeda, T.; Hirosaki, N.; Hongo, K.; Maezono, R.; et al. Site-Selective Eu3+ Luminescence in the Monoclinic Phase of YSiO2N. Chem. Mater. 2021, 33, 8873–8885. [Google Scholar] [CrossRef]
  18. Zairov, R.R.; Dovzhenko, A.P.; Podyachev, S.N.; Sudakova, S.N.; Kornev, T.A.; Shvedova, A.E.; Masliy, A.N.; Syakaev, V.V.; Alekseev, I.S.; Vatsouro, I.M.; et al. Role of PSS-based assemblies in stabilization of Eu and Sm luminescent complexes and their thermoresponsive luminescence. Colloids Surf. B Biointerfaces 2022, 217, 112664. [Google Scholar] [CrossRef]
  19. Zhu, B.; Chen, N.; Zhu, D.H.; Li, Y.S.; Sun, W.; Liu, G.H.; Du, G.P. Thermal annealing of LaF3:Eu3+ nanocrystals synthesized by a solvothermal method and their luminescence properties. J. Sol-Gel Sci. Technol. 2013, 66, 126–132. [Google Scholar] [CrossRef]
  20. Cieslik, B.; Konieczka, P. A review of phosphorus recovery methods at various steps of wastewater treatment and sewage sludge management. The concept of “no solid waste generation” and analytical methods. J. Clean. Prod. 2017, 142, 1728–1740. [Google Scholar] [CrossRef]
  21. Whyte, M.P. Hypophosphatasia-aetiology, nosology, pathogenesis, diagnosis and treatment. Nat. Rev. Endocrinol. 2016, 12, 233–246. [Google Scholar] [CrossRef] [PubMed]
  22. Yang, Q.; Wang, X.L.; Luo, W.; Sun, J.; Xu, Q.X.; Chen, F.; Zhao, J.W.; Wang, S.N.; Yao, F.B.; Wang, D.B.; et al. Effectiveness and mechanisms of phosphate adsorption on iron-modified biochars derived from waste activated sludge. Bioresour. Technol. 2018, 247, 537–544. [Google Scholar] [CrossRef] [PubMed]
  23. Zhang, M.; Song, G.; Gelardi, D.L.; Huang, L.B.; Khan, E.; Masek, O.; Parikh, S.J.; Ok, Y.S. Evaluating biochar and its modifications for the removal of ammonium, nitrate, and phosphate in water. Water Res. 2020, 186, 116303. [Google Scholar] [CrossRef] [PubMed]
  24. Hruska, K.A.; Mathew, S.; Lund, R.; Qiu, P.; Pratt, R. Hyperphosphatemia of chronic kidney disease. Kidney Int. 2008, 74, 148–157. [Google Scholar] [CrossRef] [PubMed] [Green Version]
  25. Virkki, L.V.; Biber, J.; Murer, H.; Forster, I.C. Phosphate transporters: A tale of two solute carrier families. Am. J. Physiol.-Ren. Physiol. 2007, 293, F643–F654. [Google Scholar] [CrossRef] [Green Version]
  26. Abraham, M.J.; Murtola, T.; Schulz, R.; Páll, S.; Smith, J.C.; Hess, B.; Lindahl, E. GROMACS: High performance molecular simulations through multi-level parallelism from laptops to supercomputers. SoftwareX 2015, 1–2, 19–25. [Google Scholar] [CrossRef] [Green Version]
  27. Kutzner, C.; Pall, S.; Fechner, M.; Eszternnann, A.; de Groot, B.L.; Grubmuller, H. More bang for your buck: Improved use of GPU nodes for GROMACS 2018. J. Comput. Chem. 2019, 40, 2418–2431. [Google Scholar] [CrossRef] [Green Version]
  28. Li, F.; Xing, Q.G.; Han, Y.C.; Li, Y.; Wang, W.; Perera, T.S.H.; Dai, H.L. Ultrasonically assisted preparation of poly(acrylic acid)/calcium phosphate hybrid nanogels as pH-responsive drug carriers. Mater. Sci. Eng. C 2017, 80, 688–697. [Google Scholar] [CrossRef]
  29. Escudero, A.; Calvo, M.E.; Rivera-Fernandez, S.; de la Fuente, J.M.; Ocana, M. Microwave-Assisted Synthesis of Biocompatible Europium-Doped Calcium Hydroxyapatite and Fluoroapatite Luminescent Nanospindles Functionalized with Poly(acrylic acid). Langmuir 2013, 29, 1985–1994. [Google Scholar] [CrossRef] [Green Version]
  30. Kirwan, L.J.; Fawell, P.D.; Van Bronswijk, W. In situ FTIR-ATR Examination of Poly (acrylic acid) Adsorbed onto Hematite at Low pH. Langmuir 2003, 19, 5802–5807. [Google Scholar] [CrossRef]
  31. Ding, H.C.; Pan, H.H.; Xu, X.R.; Tang, R.K. Toward a Detailed Understanding of Magnesium Ions on Hydroxyapatite Crystallization Inhibition. Cryst. Growth Des. 2014, 14, 763–769. [Google Scholar] [CrossRef]
  32. Qin, J.L.; Zhong, Z.Y.; Ma, J. Biomimetic synthesis of hybrid hydroxyapatite nanoparticles using nanogel template for controlled release of bovine serum albumin. Mater. Sci. Eng. C 2016, 62, 377–383. [Google Scholar] [CrossRef] [PubMed]
  33. Khoshniat, S.; Bourgine, A.; Julien, M.; Weiss, P.; Guicheux, J.; Beck, L. The emergence of phosphate as a specific signaling molecule in bone and other cell types in mammals. Cell. Mol. Life Sci. 2011, 68, 205–218. [Google Scholar] [CrossRef] [PubMed]
Figure 1. (a) High-resolution transmission electron microscopy image of PAA-Ca (Eu) nanoclusters; (b) Particle size statistics of (a); (c) Hydrodynamic size of PAA-Ca(Eu) nanoclusters.
Nanomaterials 12 02398 g001
Figure 2. Fourier transform infrared spectroscopy spectra of PAA-Ca (Eu) nanoclusters with different PO43− concentration. Ⅰ–Ⅲ are 0 mM, 2 mM, and 7.5 mM.
Nanomaterials 12 02398 g002
Figure 3. (a) Emission spectra (λex = 254 nm) of different anions at the excitation wavelength of 254 nm; (b) Luminescence intensity of the characteristic emission peak at 617 nm was selected for comparison; (c) Excitation spectra (λem = 617 nm) of different anions at emission wavelengths of 617 nm.
Nanomaterials 12 02398 g003
Figure 4. (a) Emission spectra (λex = 254 nm) of PAA-Ca(Eu) nanoclusters and PO43− at different concentrations; (b) The relationship between luminescence intensity increase rate and PO43− concentration at 617 nm emission peak; (c) Excitation spectra (λem = 617 nm) of PAA-Ca(Eu) nanoclusters and PO43− at different concentrations.
Nanomaterials 12 02398 g004
Figure 5. (a) The emission spectrum of PAA-Ca(Eu) nanoclusters in aqueous solution and buffer solution after reacting with different concentrations of PO43−, (b) luminescence intensity at 617 nm.
Nanomaterials 12 02398 g005
Figure 6. (a) The bonding of Eu in PAA-Ca(Eu) nanoclusters; (b) The bonding of Eu after adding PO43−.
Nanomaterials 12 02398 g006
Table 1. Results and recovery of samples (n = 3).
PO43 Spiked (mM)PO43 Found (mM)Recovery (%)RSD (%)
11.060106.04.2
44.200105.0
54.79395.9
87.95199.4
109.91499.1
Publisher’s Note: MDPI stays neutral with regard to jurisdictional claims in published maps and institutional affiliations.

