Article

Surface Modification of ZrO2 Nanoparticles with TEOS to Prepare Transparent ZrO2@SiO2-PDMS Nanocomposite Films with Adjustable Refractive Indices

1
Department of Chemistry, Chungnam National University, Daejeon 34134, Korea
2
School of Electric Engineering, Kookmin University, Seoul 02707, Korea
*
Authors to whom correspondence should be addressed.
These authors contributed equally to this work.
Nanomaterials 2022, 12(14), 2328; https://doi.org/10.3390/nano12142328
Submission received: 16 June 2022 / Revised: 2 July 2022 / Accepted: 4 July 2022 / Published: 6 July 2022
(This article belongs to the Special Issue New Growth Mechanisms for Synthesizing Various Novel Nanostructures)

Abstract

:
Here, highly transparent nanocomposite films with an adjustable refractive index were fabricated through stable dispersion of ZrO2 (n = 2.16) nanoparticles (NPs) subjected to surface modification with SiO2 (n = 1.46) in polydimethylsiloxane (PDMS) (n = 1.42) using the Stöber method. ZrO2 NPs (13.7 nm) were synthesized using conventional hydrothermal synthesis, and their surface modification with SiO2 (ZrO2@SiO2 NPs) was controlled by varying the reaction time (3–54 h). The surface modification of the NPs was characterized using Fourier-transform infrared spectroscopy, dynamic light scattering, X-ray photoelectron spectroscopy, scanning electron microscopy, transmission electron microscopy, and ellipsometry. The surface modification was monitored, and the effective layer thickness of SiO2 varied from 0.1 nm to 4.2 nm. The effective refractive index of the ZrO2@SiO2 NPs at λ = 633 nm was gradually reduced from 2.16 to 1.63. The 100 nm nanocomposite film was prepared by spin-coating the dispersion of ZrO2@SiO2 NPs in PDMS on the coverslip. The nanocomposite film prepared using ZrO2@SiO2 NPs with a reaction time of 18 h (ZrO2@SiO2-18h-PDMS) exhibited excellent optical transparency (Taverage = 91.1%), close to the transparency of the coverslip (Taverage = 91.4%) in the visible range, and an adjustable refractive index (n = 1.42–1.60) as the NP content in the film increased from 0 to 50.0 wt%.

1. Introduction

Polymers are widely used in our daily lives and in industry because of their easy processing, flexible functions, and diverse applications [1]. Several chemical synthesis methods use modified polymer materials for multiple functionalities while maintaining their basic properties [2]. However, the practical development of polymers has limitations, such as high cost and difficult production [3,4]. Incorporating inorganic nanoparticles (NPs) into polymer matrices allows the polymers to take on the various functions of the added NPs and enhances their mechanical, thermal, optical, and plasmonic properties. Owing to these advantages, nanocomposites have been developed in various research and industrial fields for practical use as high-performance functional materials [1,5,6,7,8,9,10,11,12].
A representative application of nanocomposites is as transparent high-refractive-index materials that can effectively manipulate light. Therefore, these materials can play an essential role in the development of compact lenses, optical fibers, and high-efficiency mobile displays by improving light refraction and extraction [10,11,12]. To realize a transparent nanocomposite with a high refractive index, the following criteria must be satisfied [1]. First, considering applications utilizing the visible region, NPs and polymers should not absorb light in the visible region (400–800 nm). Second, NPs added to increase the refractive index of a nanocomposite should have a high refractive index. Refractive index matching between the NP and polymer must also be considered; therefore, selecting appropriate materials for the NP and polymer is essential [13]. Third, the size of NPs should be negligibly small compared to the wavelength of light to prevent an increase in haze due to light scattering and a reduction in light transmission [13,14]. The agglomerate formation in NPs can cause strong light scattering [14]. Several studies have reported methods for the strengthening of chemical affinity or for the conforming of stable chemical bonds between NPs and polymers to avoid agglomeration [15,16,17,18,19,20,21,22,23,24,25,26,27,28,29].
Due to their high refractive index and transparency in the visible region, ZrO2 NPs have been used in the development of transparent nanocomposite films with high refractive indices [25,26,27,28,29]. Many studies investigating the surface modification of ZrO2 with organic molecules or polymers in order to avoid ZrO2 agglomeration and achieve stable dispersion in the polymer matrix have been published [21,22,23,24,25,26,27,28,29]. A typical example of such materials is a commercial product from Pixelligent Technologies LLC (Baltimore, MD, USA) that uses ZrO2 NPs 5–20 nm in size functionalized with organic molecules. However, this product can be used with epoxy, acrylic resins, or specific polymers [30,31,32]. In addition to the surface modification of ZrO2 with organic materials, Vossmeyer et al. and Xu et al. reported the surface modification of ZrO2 with inorganic materials, such as SiO2. However, they did not show the fabrication of transparent nanocomposite films [21,22]. To the best of our knowledge, there have been no reports on the fabrication of transparent nanocomposite film with adjustable refractive indices utilizing ZrO2 NPs surface-modified with only a SiO2 layer.
For uniform dispersion of ZrO2 NPs in a non-polar polymer with high molecular weight, like polydimethylsiloxane (PDMS), modifying the polar surface of NPs with appropriate organic molecules or polymers containing significantly different polarities is difficult [29,30,31,32,33]. Therefore, research on chemical synthesis methods for surface modification of NPs that can be easily accessed at the lab scale is required. In this study, we prepared ZrO2 NPs with a size of 13.7 nm through conventional hydrothermal synthesis [22]. As shown in Figure 1, surface modification of ZrO2 NPs with SiO2 (ZrO2@SiO2 NPs) was performed through hydrolysis and polymerization of tetraethyl orthosilicate (TEOS) using the Stöber method [22]. We demonstrate that a transparent, thin nanocomposite film with an adjustable refractive index can be fabricated by dispersing ZrO2@SiO2 NPs in PDMS. The surface modification was characterized by transmission electron microscopy (TEM) with energy-dispersive X-ray spectroscopy (EDX) and X-ray photoelectron spectroscopy (XPS). Fourier-transform infrared spectroscopy (FT-IR) and dynamic light scattering (DLS) confirmed the growth of the SiO2 layer on ZrO2 NPs, which was controlled by the reaction time of the reaction between the NPs and TEOS (≤54 h). Based on the growth of the SiO2 layer, the effective refractive index of the ZrO2@SiO2 NPs was determined from the aqueous NP solution by ellipsometry. The effective thickness of the SiO2 layer (0–4.2 nm) formed on the surface of the ZrO2 NPs was calculated using the effective refractive index [34]. After 18 h of reacting with TEOS, the ZrO2@SiO2 NPs had an appropriate thickness (1.3 nm) for the SiO2 layer that allowed stable dispersal in the PDMS matrix with a high refractive index. Depending on the ZrO2@SiO2 NP content (ZrO2@SiO2-18h), the refractive index of the nanocomposite films was adjusted from 1.42 to 1.60 in the visible region. The nanocomposite film exhibited excellent optical transparency (Taverage = 91.1%), close to the transparency of the coverslip (Taverage = 91.4%).

2. Materials and Methods

2.1. Materials

Zirconyl chloride octahydrate (ZrOCl2·8H2O, 98%), urea (CH4N2O, 99.0–100.5%), citric acid (C6H8O7, ≥99.5%), TEOS (Si(OC2H5)4, 98%), and aqueous ammonia (28 wt%) were purchased from Sigma Aldrich Co. (St. Louis, MI, USA). Ethanol, methanol, 2-propanol, and n-hexane were purchased from Samchun Chemicals Co. (Seoul, Korea). Commercial deionized water (18.25 MΩ, 25 °C) was purchased from Joylife Co. (Gimhae, Korea). A curing agent and PDMS base resin (Sylgard 184) were purchased from Dow Corning Co. (Midland, TX, USA). All the chemicals were used without further purification.

2.2. Synthesis of ZrO2 NPs

ZrO2 NPs were synthesized through conventional hydrothermal synthesis, and the experimental details were modified for our environment [22]. A total of 0.8 g of zirconyl chloride octahydrate, 1.2 g of urea, and 0.4 g of citric acid were added to 25 g of deionized water. The solution was vigorously mixed for 30 min and then transferred to a precleaned Teflon hydrothermal reactor. The reactor was placed into a hydrothermal furnace and heated to 150 °C for 2 h. The reaction proceeded for 12 h, and then the hydrothermal reactor was cooled to room temperature. After cooling, the solution was centrifuged using methanol. Methanol was used for the primary centrifuge because it has greater solubility in urea than ethanol [35]. An additional centrifugation was performed with ethanol. The NPs were dried in a vacuum desiccator and used for TEOS surface modification.

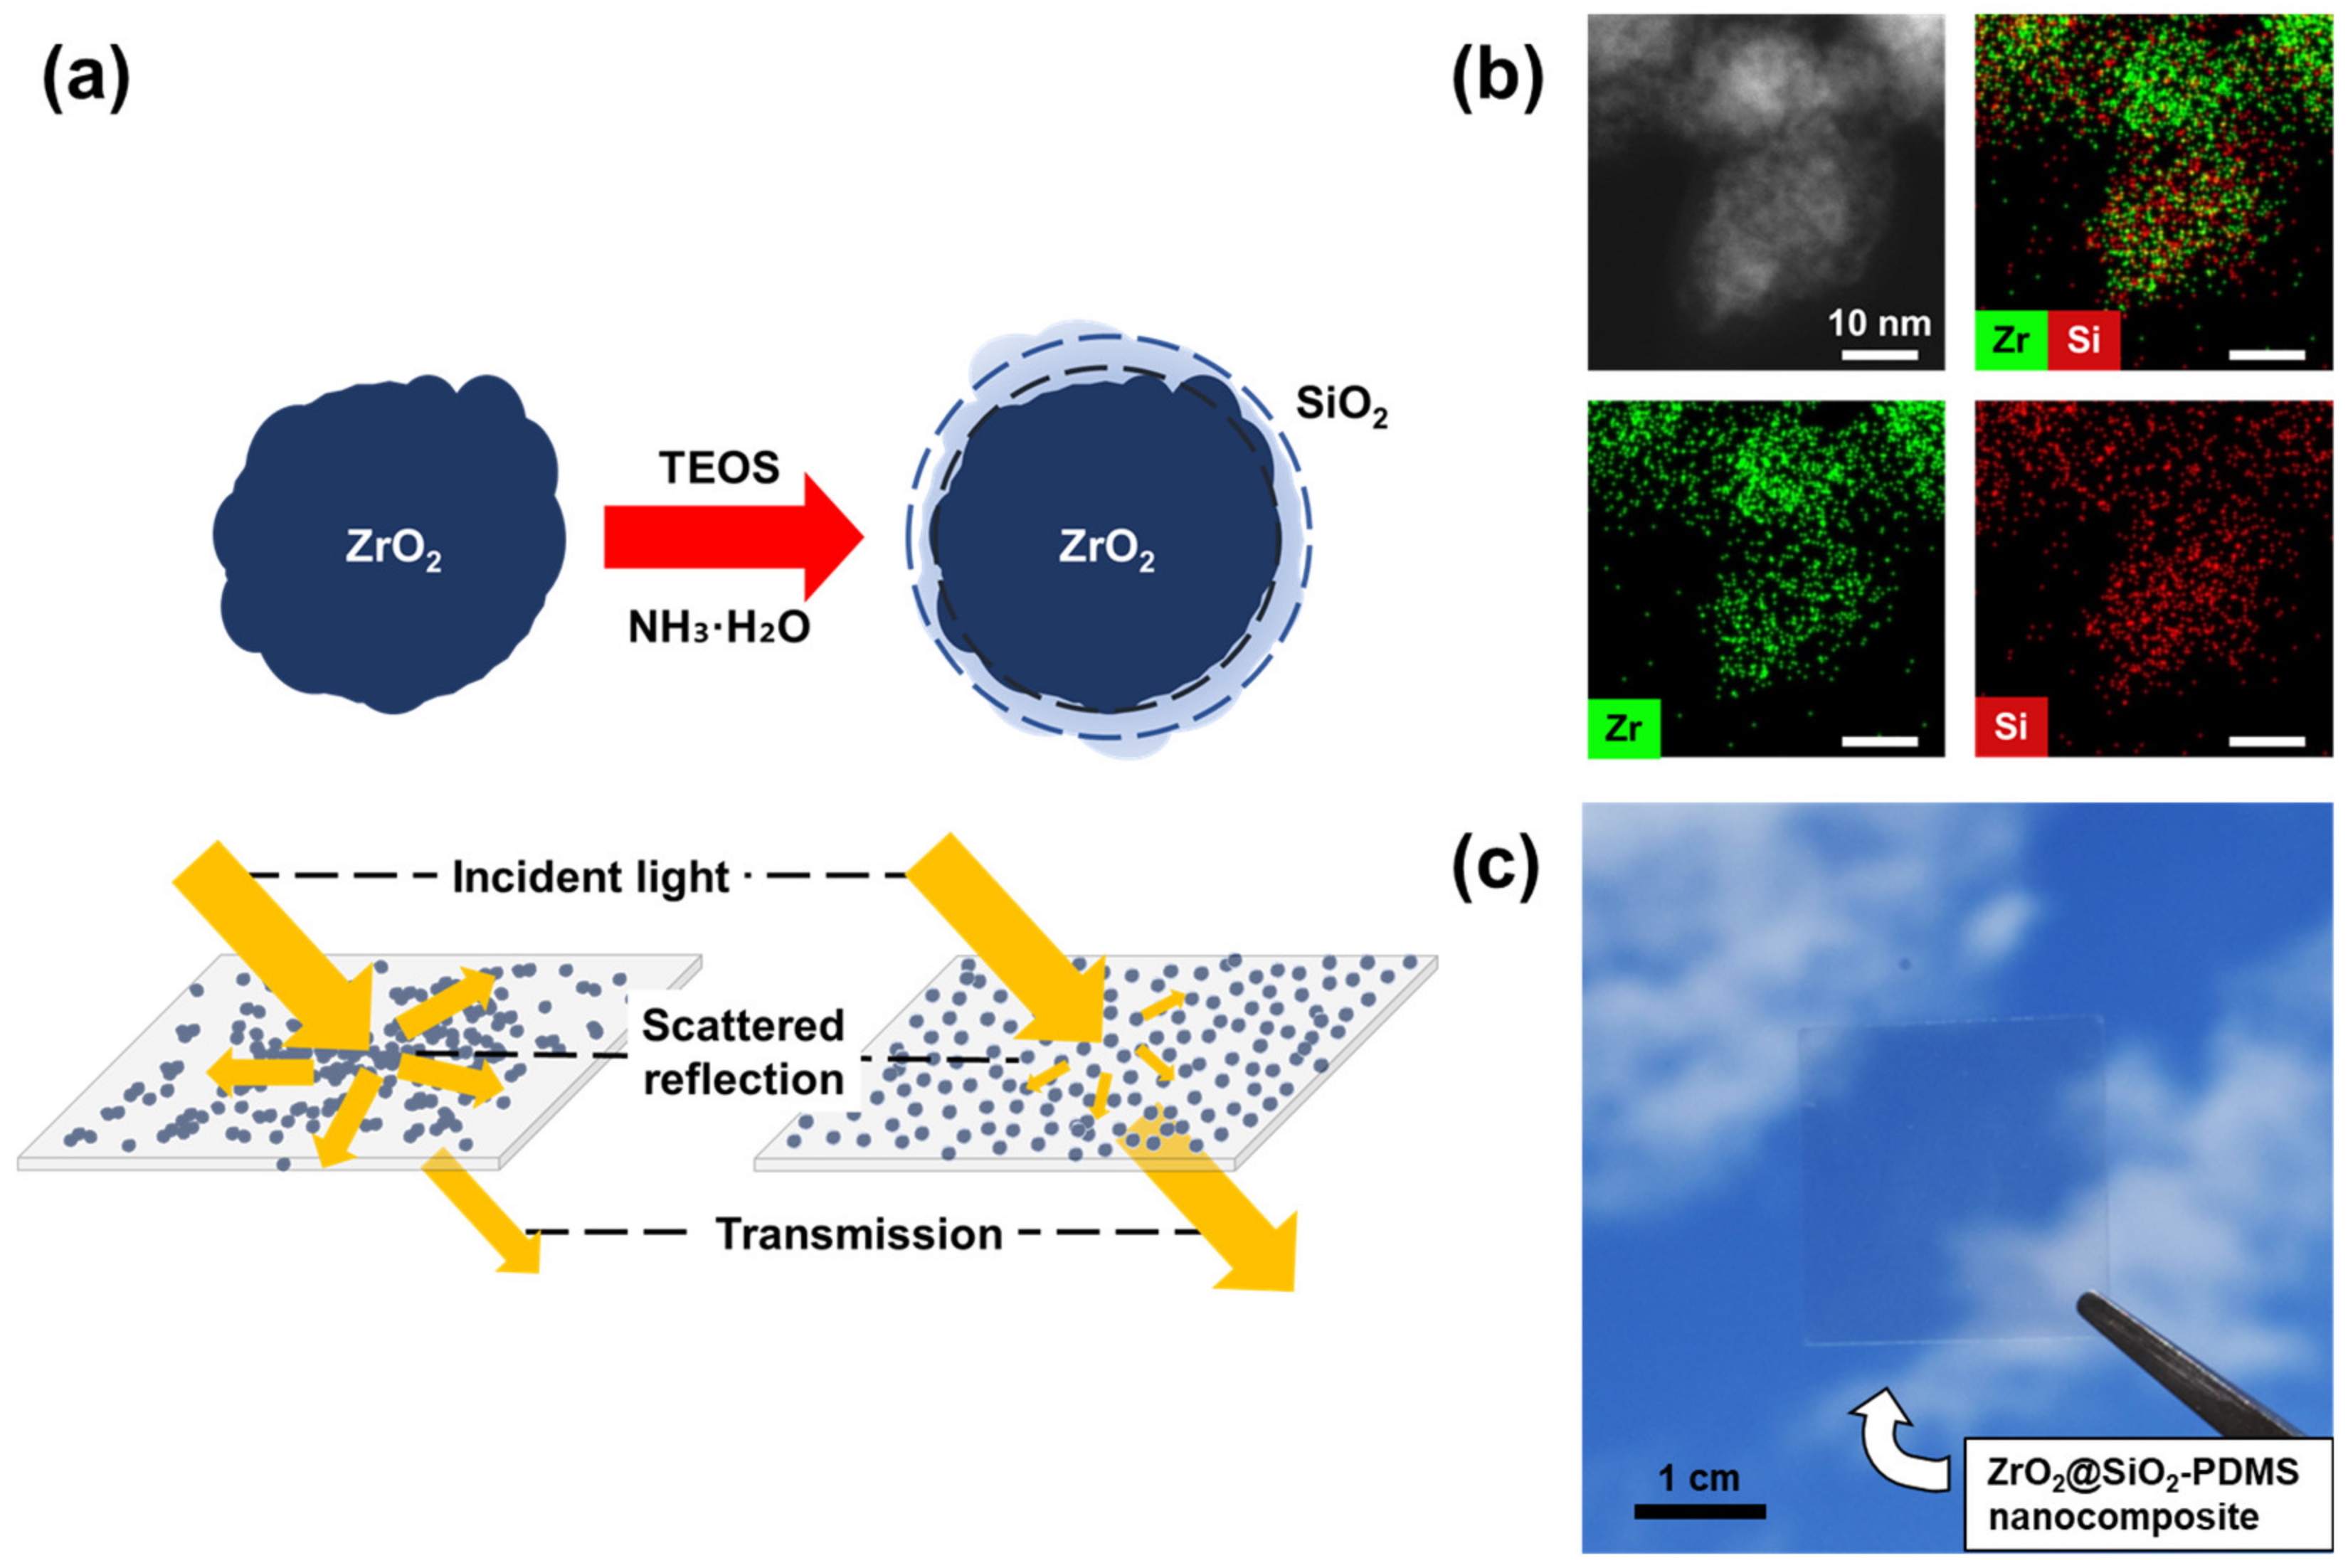
2.3. Surface Modification of ZrO2 NPs with SiO2

Surface modification of ZrO2 NPs was performed using the Stöber method, and the experimental details were modified for our environment [22]. A total of 46 mg of ZrO2 NPs was dispersed in 1 g of deionized water. The ZrO2 NP dispersion and 0.5 mL of aqueous ammonia were added to 20 mL of 2-propanol. The solution was stirred at 1000 rpm at 30 °C, and then 24 μL of TEOS was added to the solution. To control the thickness of the SiO2 layer, the reactions were performed at different reaction times of 3, 9, 18, 27, and 54 h. The solution was then centrifuged using 2-propanol, and additional centrifuges were performed with ethanol. The synthesized ZrO2@SiO2 NPs were then dried in a vacuum desiccator.

2.4. Preparation of ZrO2@SiO2-PDMS Nanocomposites

An equal amount of PDMS mixture and ZrO2@SiO2 NPs were added to hexane in a mass ratio of 1:1:100 (PDMS mixture:ZrO2@SiO2 NPs:hexane). The PDMS mixture was prepared by mixing the PDMS base with a curing agent at a weight ratio of 10:1 (PDMS base:curing agent). This mixture was fully dispersed by ultrasonication and dropped on the precleaned substrates (silicon wafer, coverslip). Spin-coating was performed at 1500 rpm for 30 s to produce the 100 nm nanocomposite film. Finally, the ZrO2@SiO2-PDMS nanocomposite film was cured in a convection oven for 5 h at 80 °C.

2.5. Characterizations

The morphologies of the ZrO2 and ZrO2@SiO2 NPs were investigated with TEM (JEOL, JEM-ARM200F, Tokyo, Japan). For qualitative elemental analysis, EDX (Bruker, Quantax 400, Billerica, MA, USA) was performed using TEM. X-ray diffraction (XRD; Bruker, D8 Advance, Billerica, MA, USA) was used to determine the crystal structure of the ZrO2 NPs. For the scanning electron microscopy (SEM, Tescan, Clara, Brno, Czech Republic) analysis, the ZrO2 and ZrO2@SiO2 NPs were diluted to 1 g/L in ethanol and drop-casted on silicon wafers. Nanocomposite films were prepared on silicon wafers. The NPs and nanocomposite films were sputtered with Pt prior to SEM analysis. The elemental analysis of ZrO2 and ZrO2@SiO2 NPs was verified using XPS (Thermo Scientific, K-alpha+, Waltham, MA, USA). FT-IR (Shimadzu, IRSpirit, Kyoto, Japan) at the CNU Chemistry Core Facility (Daejeon, Korea) was used to analyze the chemical bonds of the ZrO2 and ZrO2@SiO2 NPs. NPs were diluted to 1 g/L in deionized water and ultrasonicated, and their hydrodynamic diameter was measured using DLS (Malvern Instruments, Zetasizer Nano ZS, Malvern, UK). An ultraviolet-visible spectrophotometer (UV-vis; Agilent Technologies, Agilent 8453, Santa Clara, CA, USA) at the CNU Chemistry Core Facility (Daejeon, Korea) was used to determine the optical characteristics of the aqueous solutions of the ZrO2 and ZrO2@SiO2 NPs. The refractive indices of the NPs and nanocomposite films were measured using an ellipsometer (J.A. Woollam Co., RC-2, Lincoln, NE, USA). NPs were dispersed in deionized water to avoid light scattering and nanocomposite films were prepared on silicon wafers [36]. A lab-built UV-vis spectrophotometer with an integrating sphere was used for the optical characterization of nanocomposite films, and their reflectance and transmittance were measured on a coverslip. The extinction spectrum was obtained from the following relationship:
E λ + T λ + R λ = 100   % ,
where E(λ), T(λ), and R(λ) are the extinction, transmittance, and reflectance, respectively, at a given wavelength.

3. Results and Discussion

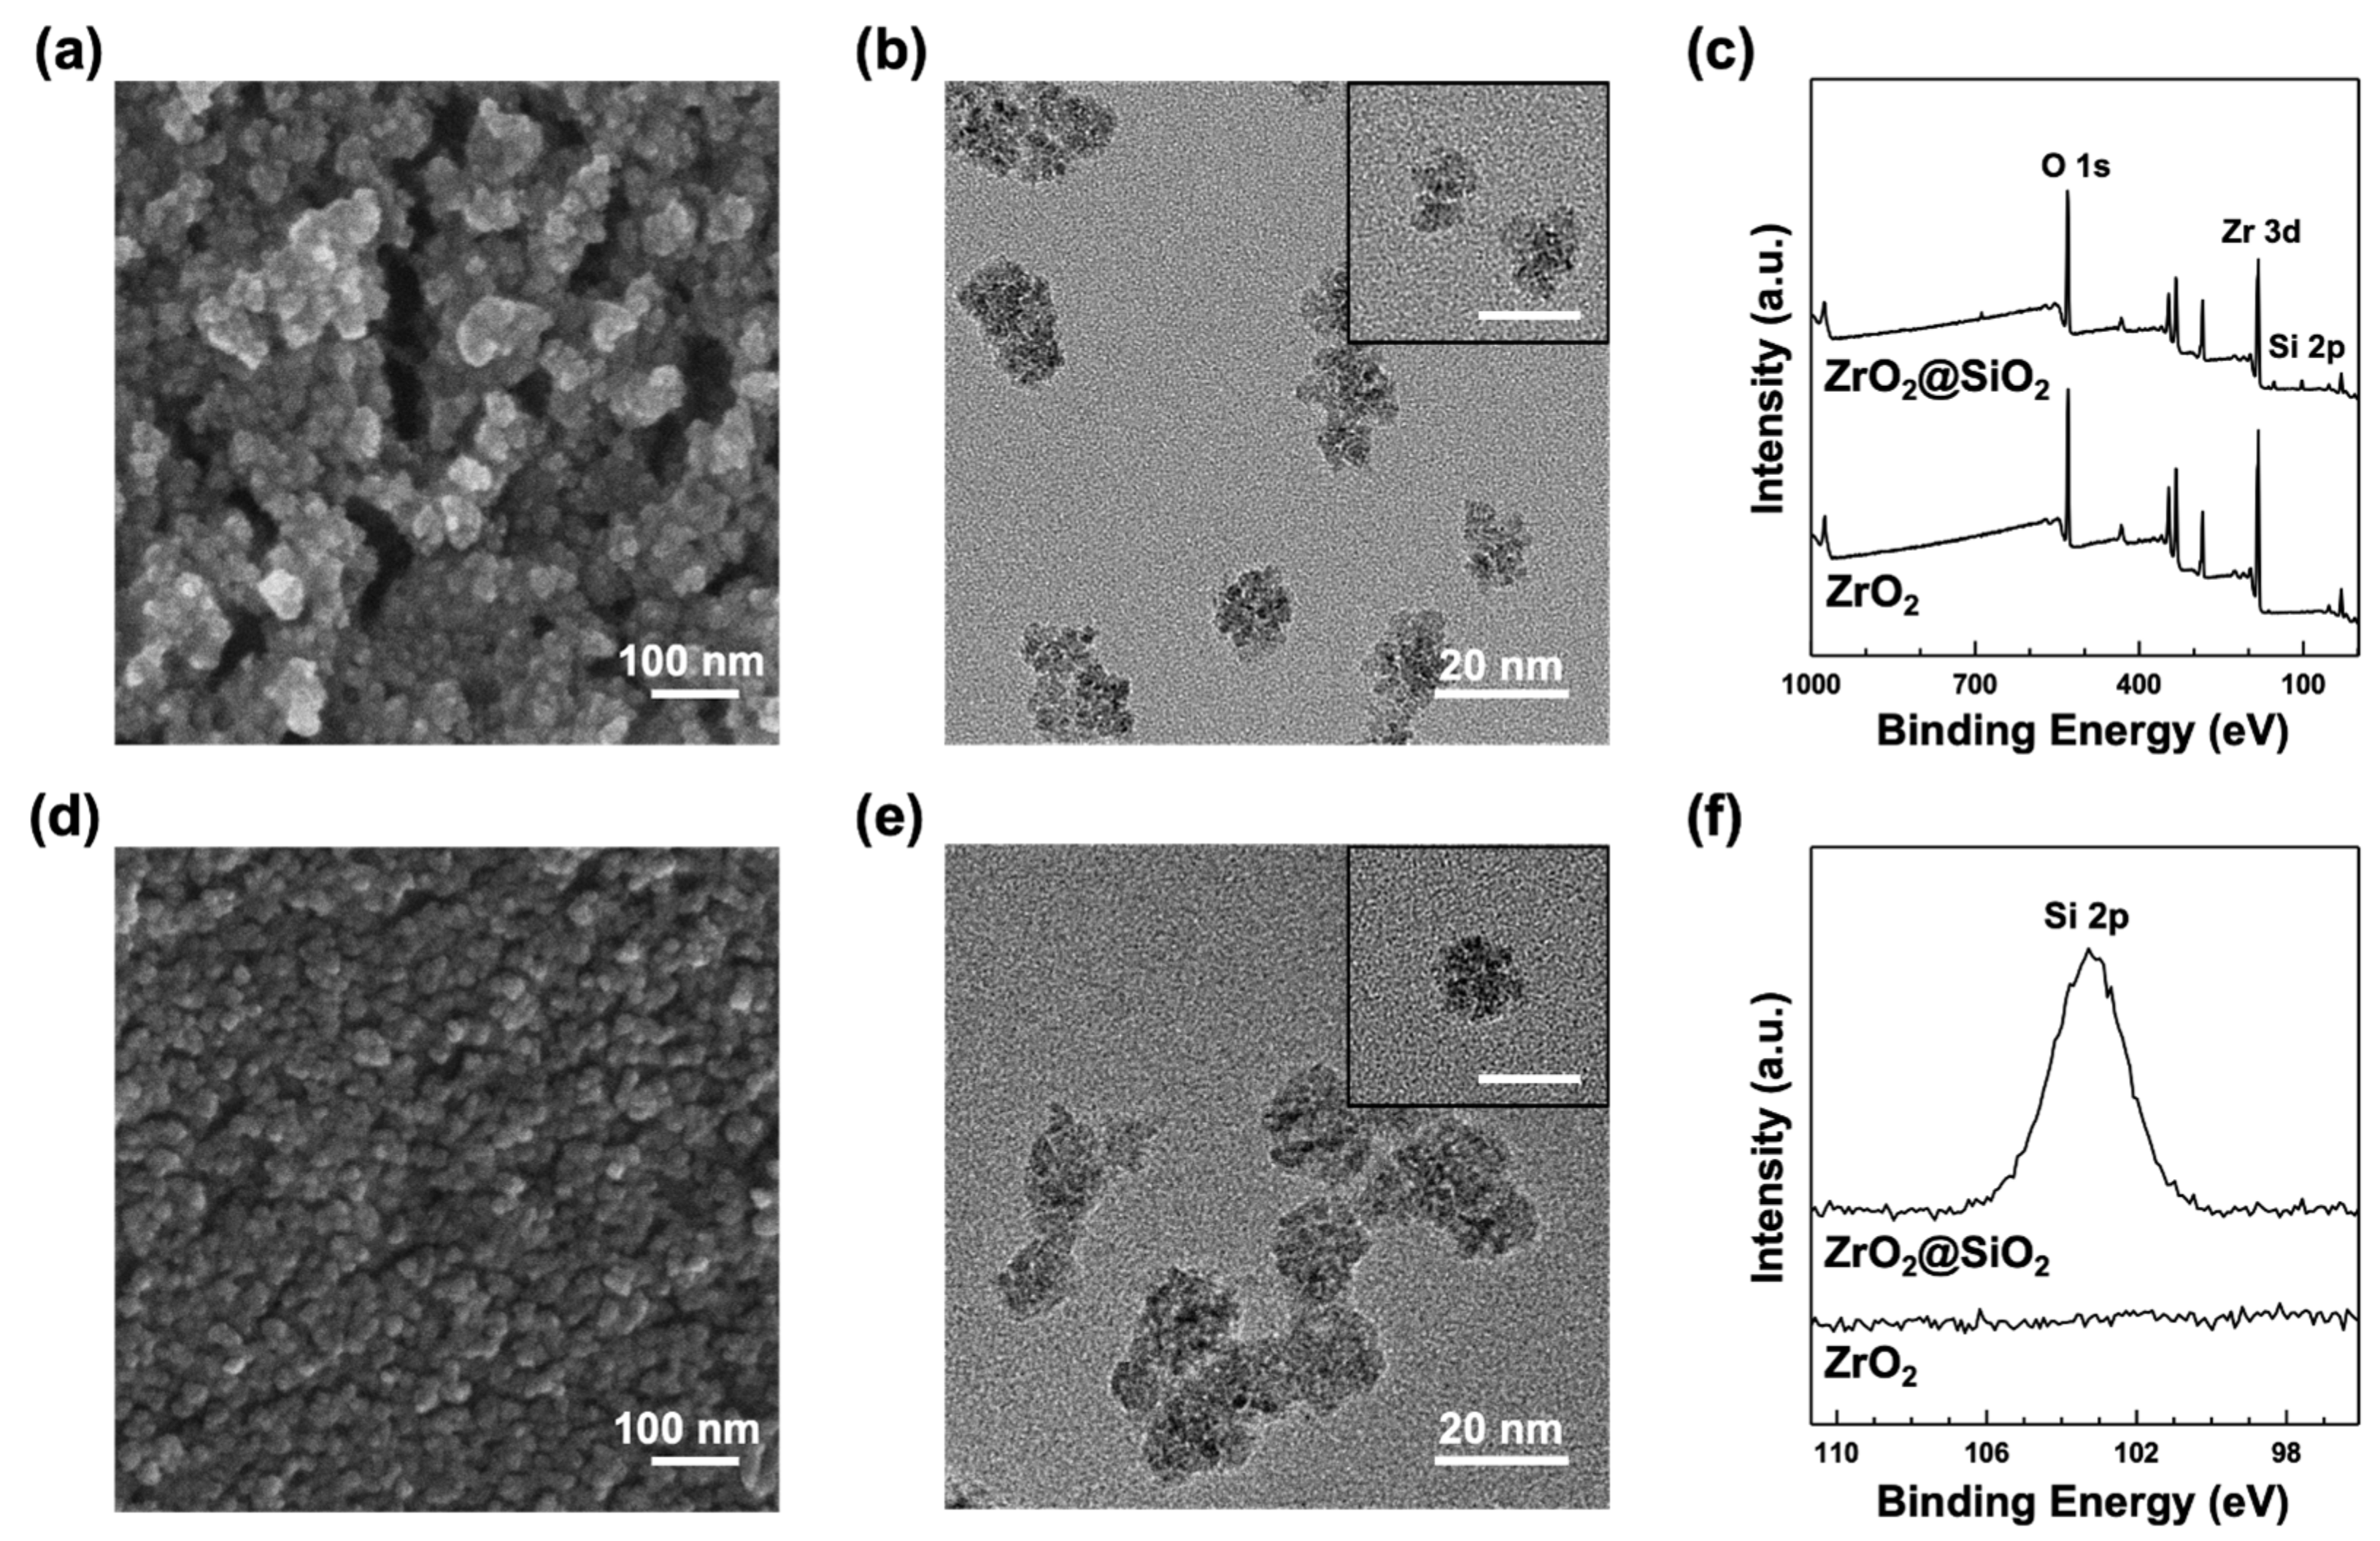
3.1. Material Characterization of ZrO2 and ZrO2@SiO2 NPs

The crystal structure of synthesized ZrO2 NPs was identified as the tetragonal phase, as shown in Figure S1, with XRD analysis [37,38]. The morphologies of the ZrO2 and ZrO2@SiO2 NPs were investigated using SEM and TEM. As shown by SEM images (Figure 2a,d), the shapes of the ZrO2 NPs were relatively irregular compared to those of the ZrO2@SiO2 NPs. NPs were agglomerated and it was difficult to find individual units of NPs. In contrast, individual units of ZrO2@SiO2 NPs were easily found in the SEM image. From the TEM analysis, the diameters of ZrO2 and ZrO2@SiO2 NPs were measured to be 13.7 ± 3.1 nm (Figure 2b) and 16.3 ± 3.4 nm (Figure 2e), respectively. The SiO2 layer was approximately calculated from the radius difference of the ZrO2 NPs and ZrO2@SiO2 NPs as 1.3 ± 2.3 nm. In addition, TEM and EDX analysis showed that Zr and Si coexisted in ZrO2@SiO2 NPs (Figure 1b), indicating that the surface of ZrO2 NPs was modified with an nm-thick SiO2 layer with the Stöber method.
The elemental analysis of ZrO2 and ZrO2@SiO2 NPs was performed using XPS. The corresponding low- and high-resolution XPS spectra are shown in Figure 2c,f, respectively. ZrO2@SiO2 NPs exhibited peaks of Zr (10.2%), Si (5.5%), O (47.7%), and C (36.6%), with a Zr:Si atomic ratio of 1.9. Zr3d5/2 peaks in both NPs were detected at 182.6 and 182.7 eV, respectively, which were assigned to the binding energy of Zr4+. The peaks of O1s were detected at 530.6 and 531.9 eV, respectively, which were assigned to the binding energy of Zr–O [39]. No significant signal of Si2p was observed in the ZrO2 NPs; however, the ZrO2@SiO2 NPs showed the peak of Si2p at 103.3 eV, which was assigned to the binding energy of Si–O [39].

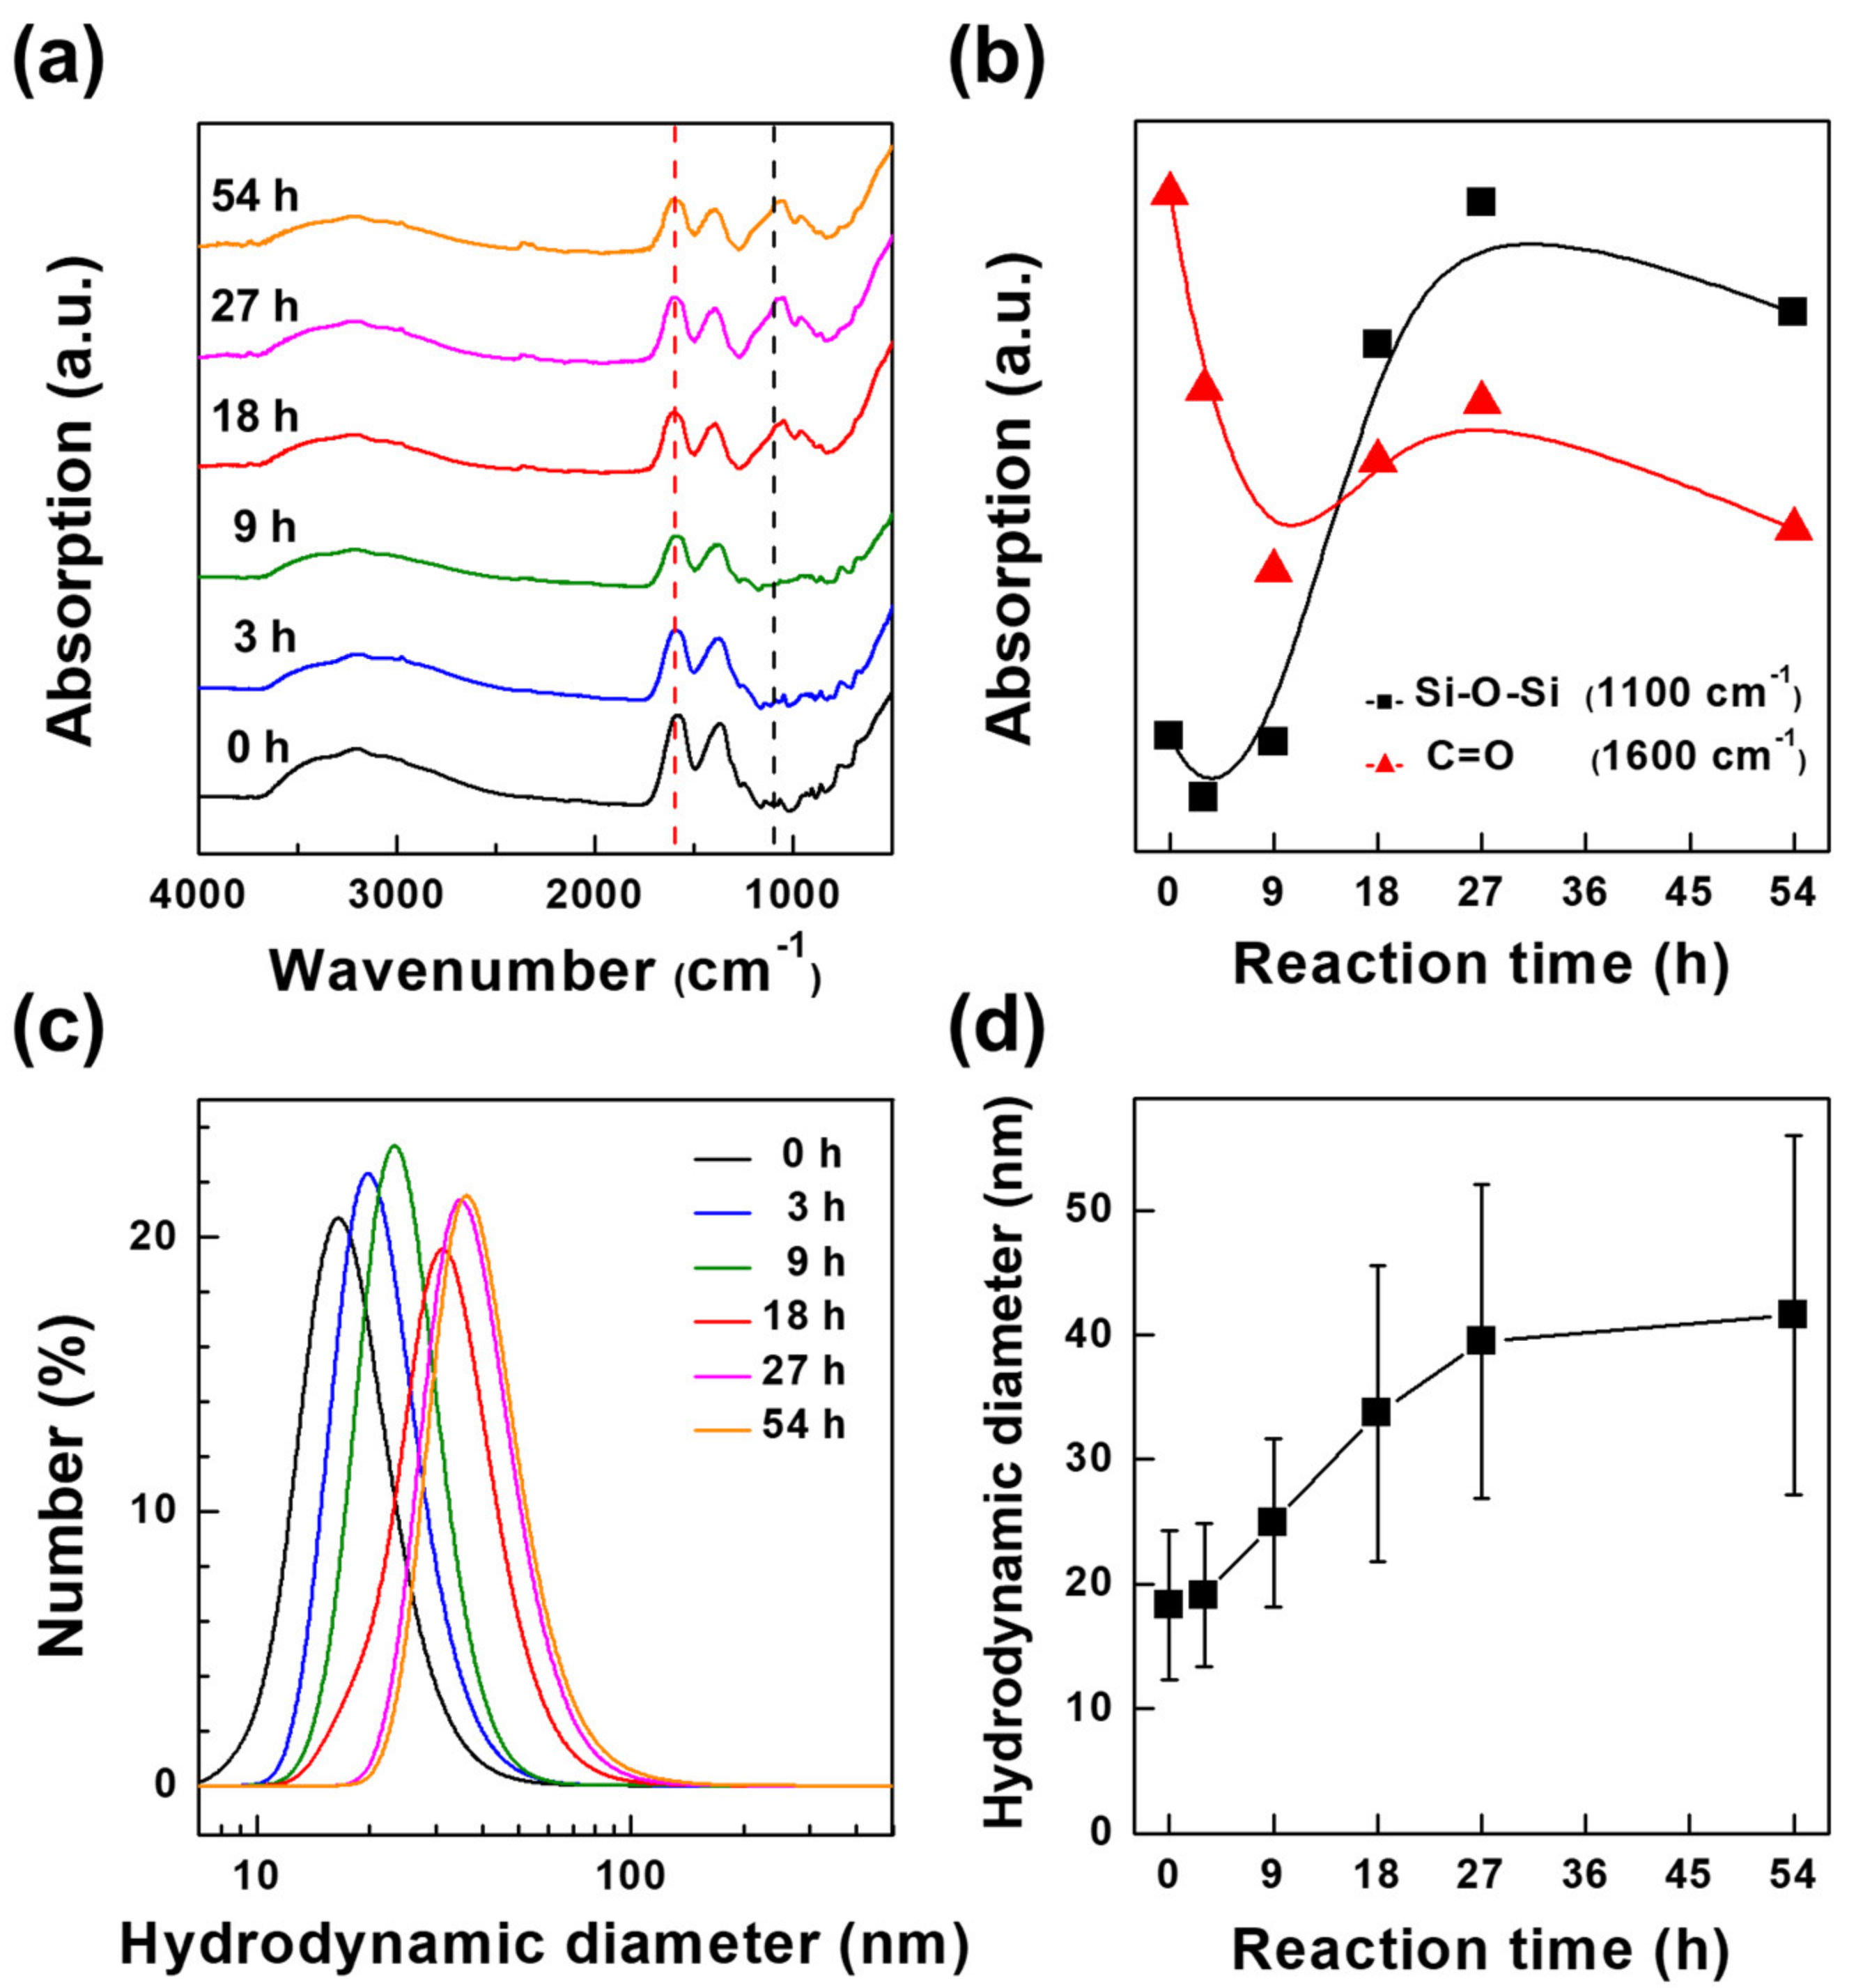
3.2. The Surface Modification of ZrO2 NPs with the SiO2 Layer Controlled by the Reaction Time

As described above, the surface modification of ZrO2 NPs with the SiO2 layer was controlled by varying the reaction time of the Stöber method [22]. FT-IR and DLS measurements were conducted to monitor the increase in the size of the ZrO2@SiO2 NPs as a result of the surface modification of the ZrO2 NPs with the SiO2 layer with the reaction time. The FT-IR spectra of the ZrO2@SiO2 NPs at different reaction times are shown in Figure 3a. Peak intensities observed at 1600 cm−1 and 1100 cm−1 can be attributed to the C=O stretching from residual citric acid on the ZrO2 NP surface and the Si–O–Si asymmetric stretching from SiO2, respectively [40,41]. As the reaction time increased, the absorption in the 1600 cm−1 region decreased, while the absorption in the 1100 cm−1 region increased, supporting the hypothesis that the growth of the SiO2 layer can be controlled by the reaction time (Figure 3b). DLS spectra of ZrO2@SiO2 NPs show that the hydrodynamic size of the ZrO2@SiO2 NPs gradually increased with the reaction time up to 27 h, as shown in Figure 3c,d. The hydrodynamic sizes of the ZrO2 NPs and ZrO2@SiO2 NPs were larger than the physical sizes of the NPs determined from TEM analysis (Figure 2b,e). This was because the hydrodynamic size included not only the physical size of the NPs but also the thickness of the double layer, composed of the stern layer and the diffusion layer, on the NPs [42]. The hydrodynamic size was used limitedly to describe the NP size and DLS analysis showed that the surface modification of ZrO2 NPs with a SiO2 layer could be reproducibly controlled using the reaction time [42].

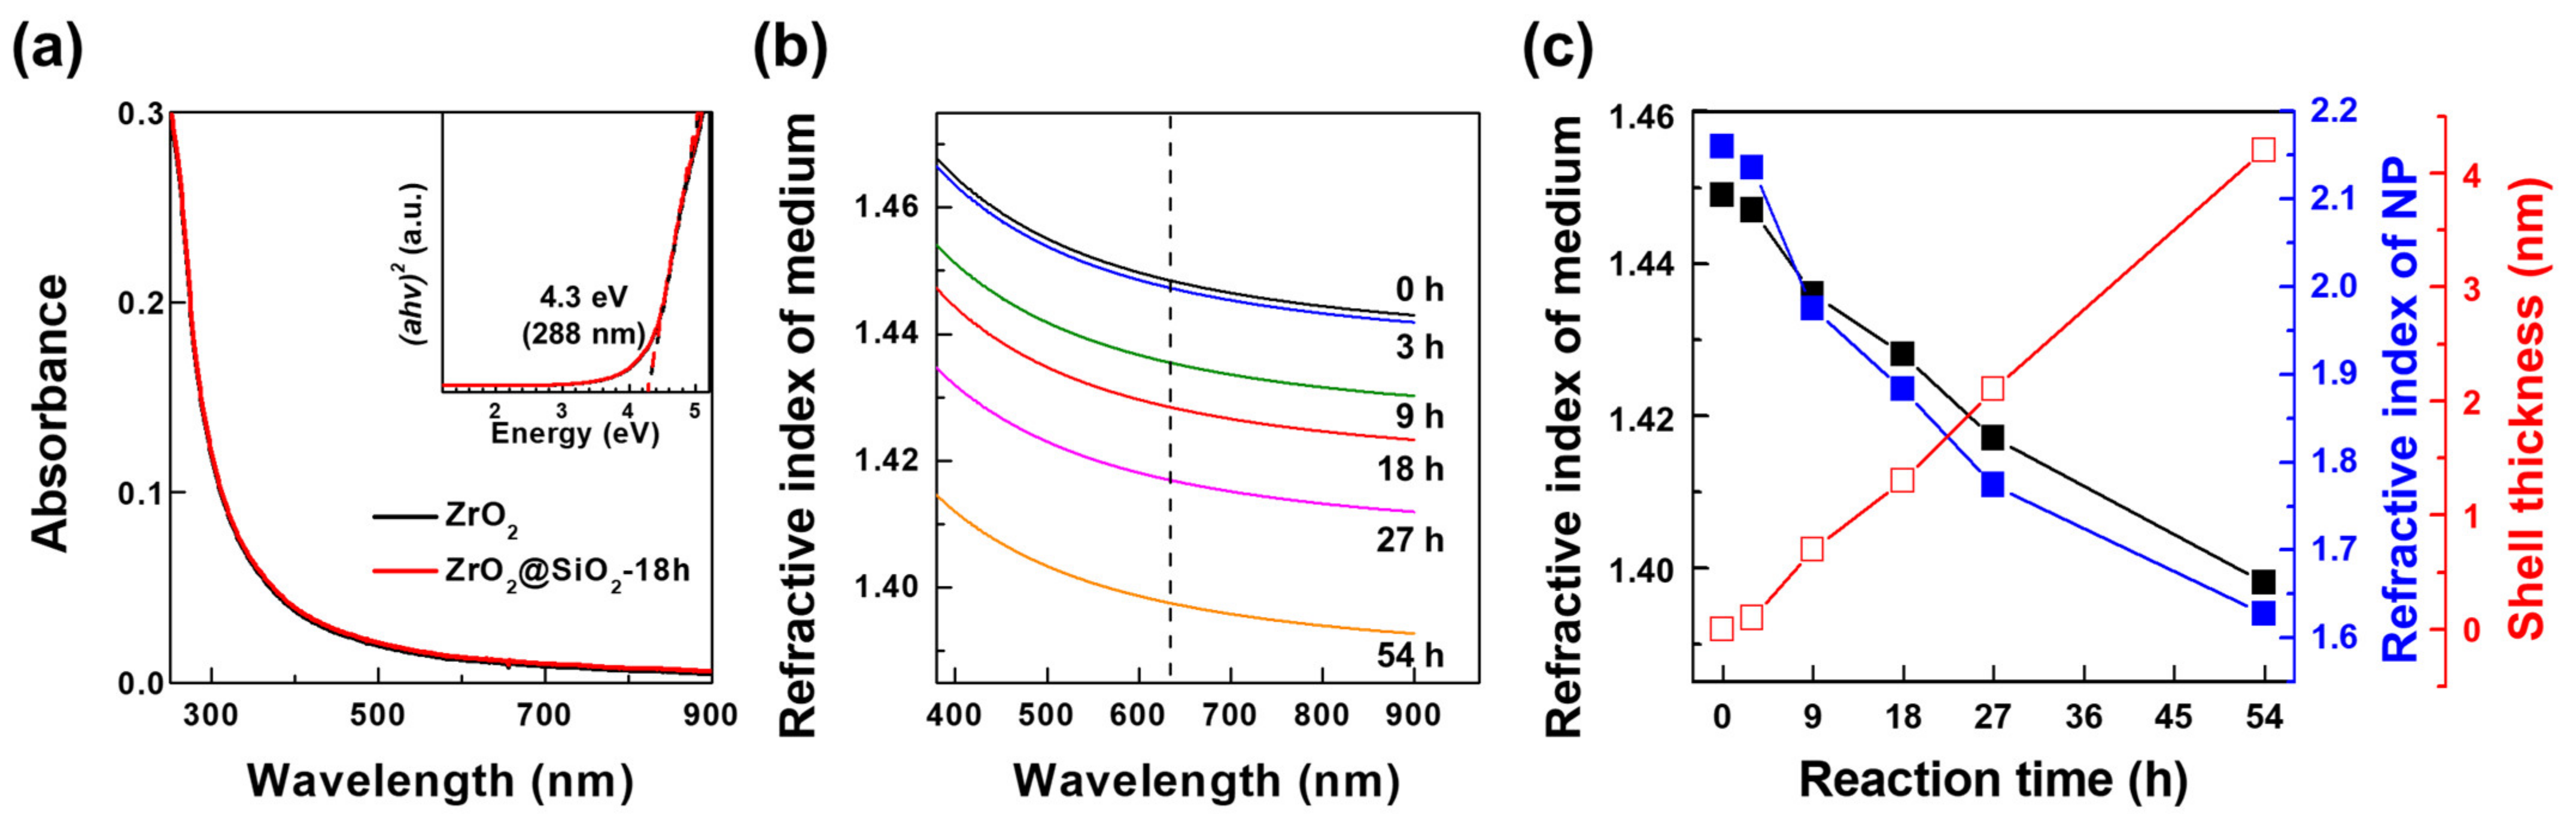
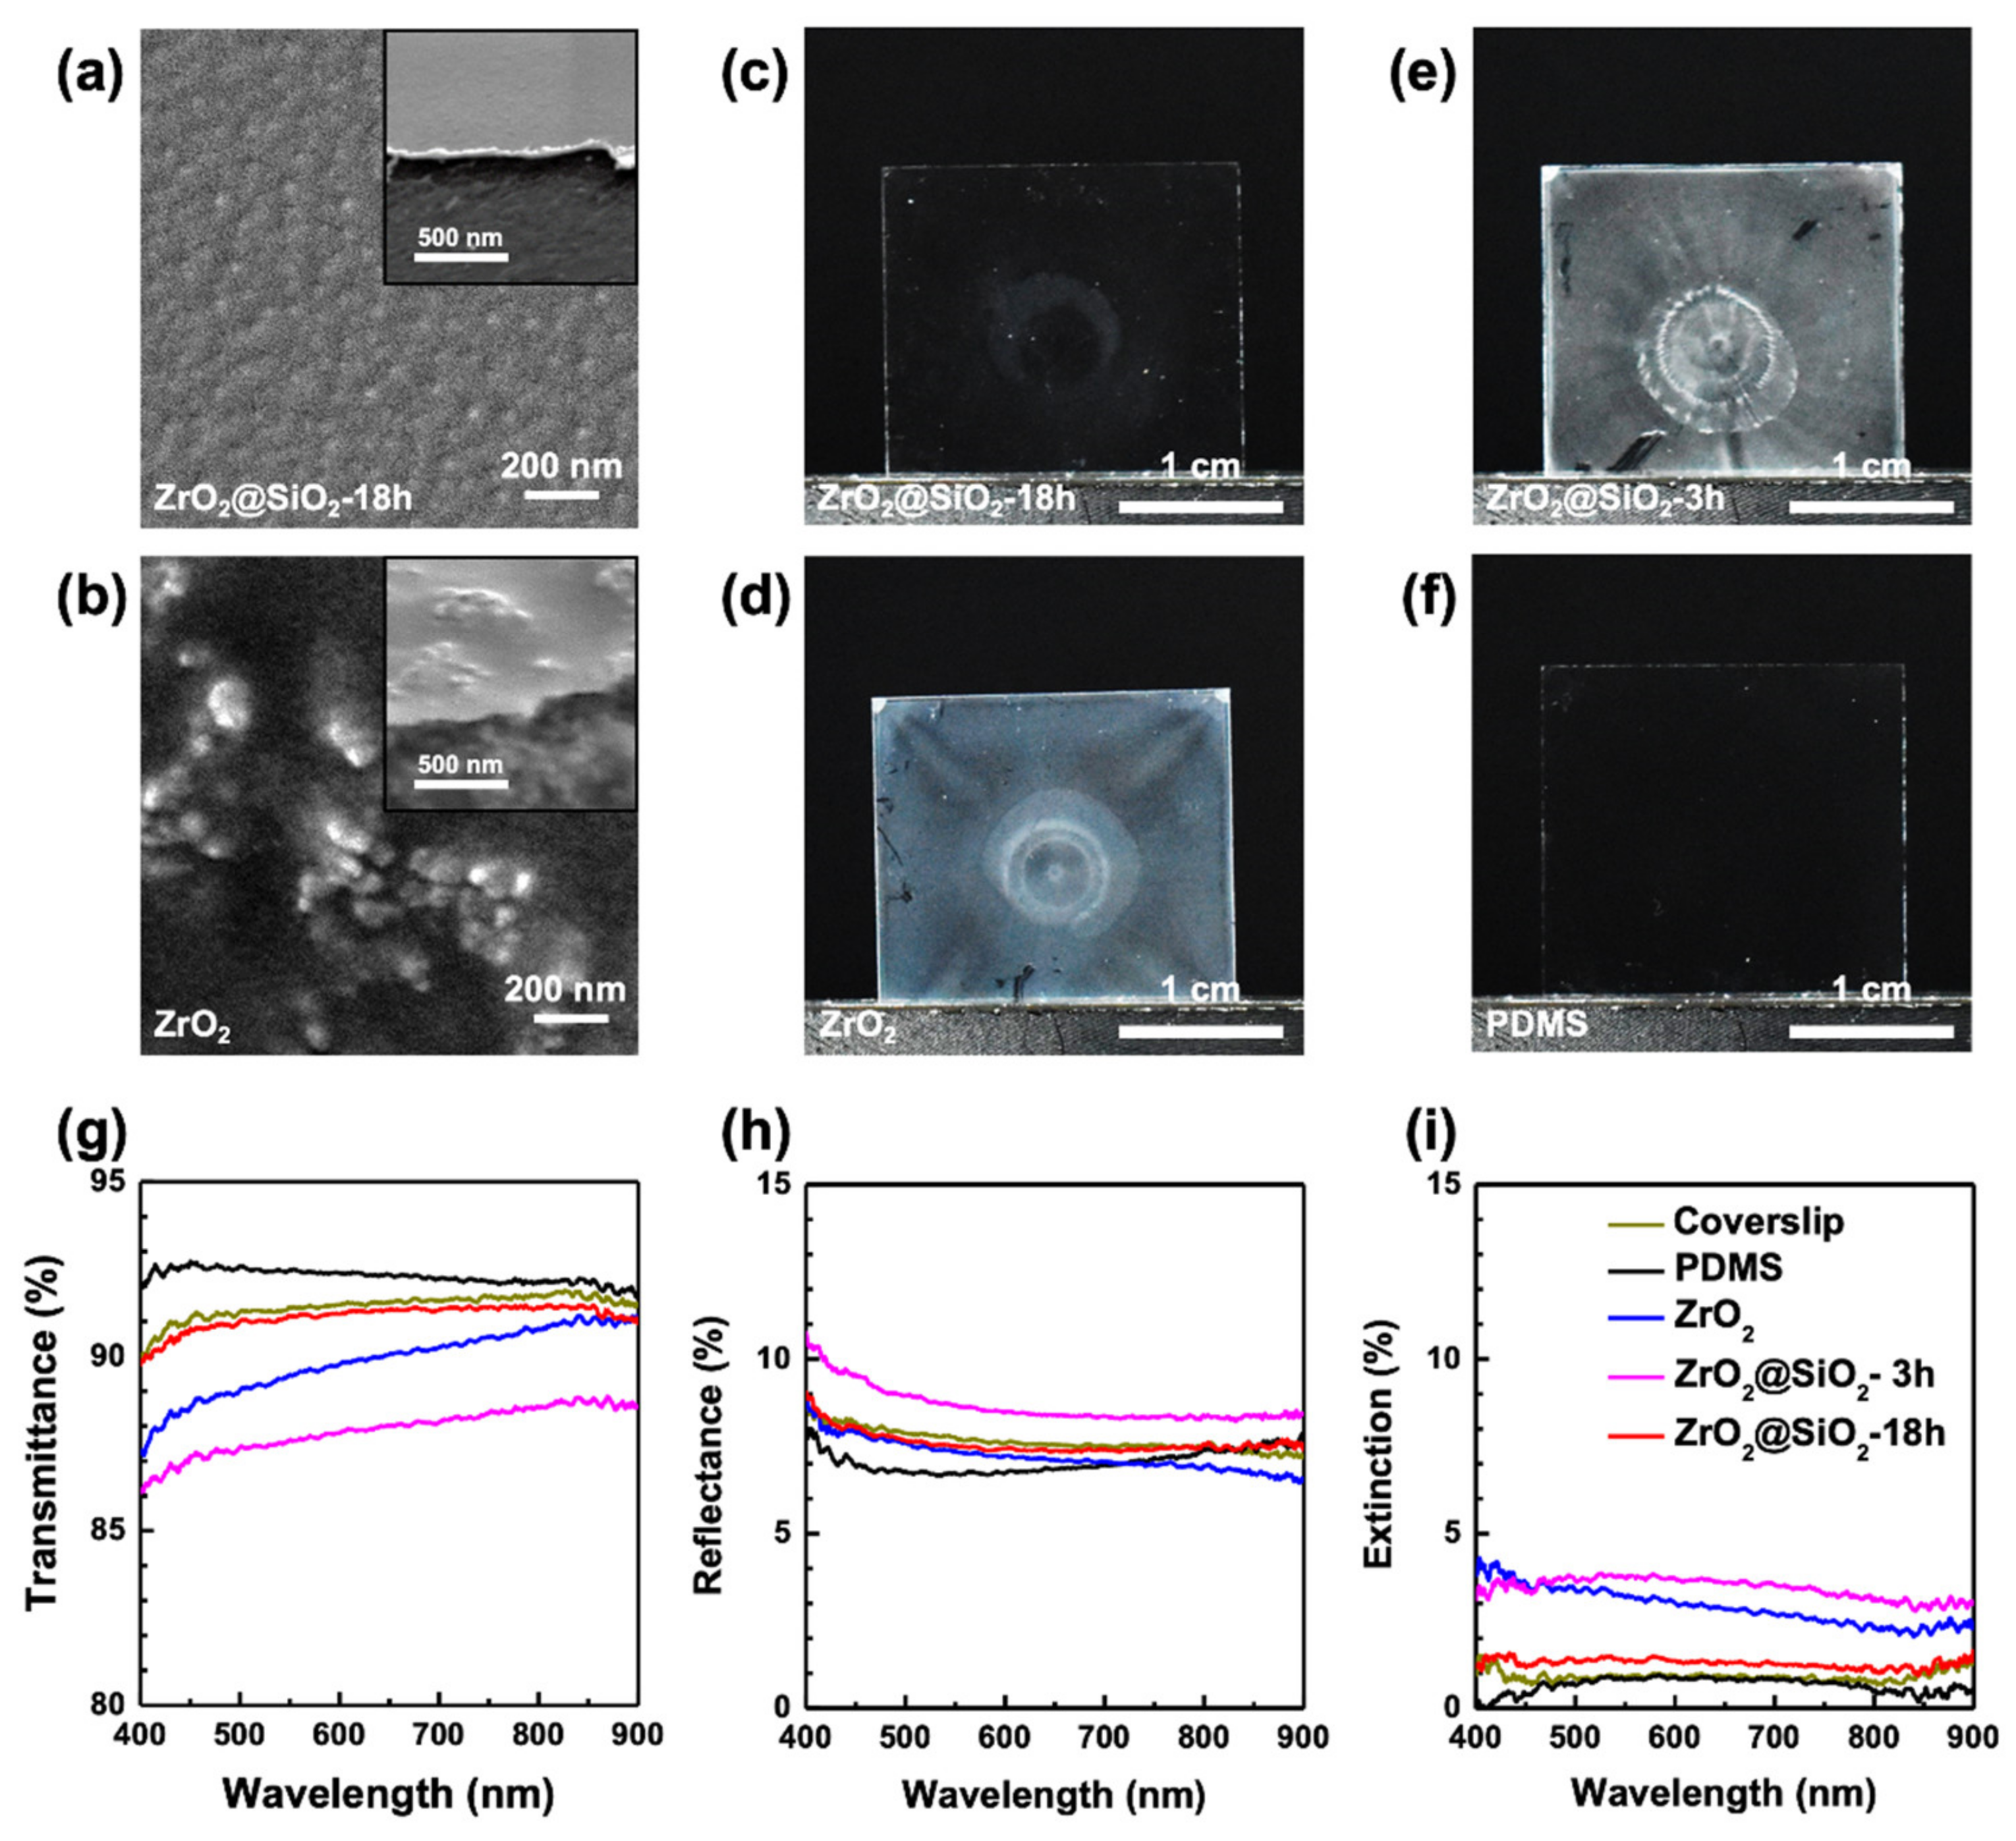
3.3. Optical Characterization of ZrO2 and ZrO2@SiO2 NPs

The effects of the surface modification of ZrO2 NPs with different reaction times on optical properties, including the transmittance and effective refractive index, were evaluated using UV-vis spectroscopy and ellipsometry (Figure 4). UV-vis spectra of aqueous solutions of ZrO2 and ZrO2@SiO2-18h NPs were obtained in the wavelength range from 250 to 900 nm (Figure 4a). The spectral features of the ZrO2 and ZrO2@SiO2 NP aqueous solutions were almost identical; hence, light absorption by the SiO2 layer was negligible. In both spectra, light absorption increased rapidly at below 300 nm, and the bandgap energy of 4.3 eV (288 nm) was determined from the Tauc plot (Figure 4a (inset)) [43]. Thus, the light absorption of NPs can be ignored in the visible range [44].
To determine the refractive index dispersions of the NP aqueous solutions, psi and delta values were measured with the ellipsometer and fitted using the Cauchy model. The Cauchy model is appropriate for describing the refractive index dispersion in the wavelength region where the light absorption is negligible, as shown in the following equation:
n λ = A + B λ 2 + C λ 4 ,
where A, B, and C are constants; λ is the wavelength; and n(λ) is the refractive index at a given wavelength [45]. The refractive index dispersions of the 50 wt% ZrO2@SiO2 NP aqueous solutions for each reaction time are shown in the wavelength range from 380 to 900 nm in Figure 4b. The refractive indices of each NP solution after 0, 3, 9, 18, 27, and 54 h were determined as 1.45, 1.45, 1.44, 1.43, 1.42, and 1.40 at λ = 633 nm, respectively (the black line in Figure 4c, Table 1) [34]. Among the various effective refractive index approximations, the effective medium approximation (Equation (3)) gave calculated values for the effective refractive indices of the NP solutions closest to the experimental values measured in the ellipsometry analysis (Figure S2) [34,46,47,48,49,50,51,52]. The effective medium approximation (Equation (3)) was used as a simple model to calculate the effective refractive indices of ZrO2@SiO2 NPs for each reaction time (the blue line in Figure 4c), considering the refractive index of bare ZrO2 NPs and a matrix (water) and the volume fraction of NPs in the solution (Figure S2, Table S1) [34,46,47,48,49]:
n e f f λ = φ n N P λ + 1 φ n m a t r i x λ ,
where nNP(λ), nmatrix(λ), and neff(λ) are the refractive indices of the NPs, matrix, and NP solution, respectively, at a given wavelength. φ is the volume fraction of NPs in the NP solution. φ values were calculated as 0.141, 0.144, 0.161, 0.175, 0.192, and 0.244 for reaction times of 0, 3, 9, 18, 27, and 54 h, respectively. The refractive indices of each of ZrO2@SiO2 NP solution for the reaction times of 0, 3, 9, 18, 27, and 54 h were calculated as 2.16, 2.14, 1.98, 1.88, 1.77, and 1.63, respectively [34]. The refractive indices of the ZrO2@SiO2 NPs decreased with the reaction time and the surface modification of the ZrO2 NPs. This was because the volume fraction of the high-refractive-index ZrO2 (n = 2.16) decreased relatively and that of the low-refractive-index SiO2 (n = 1.46) increased with the increasing reaction time during the surface modification of NPs, considering the same NP weight content in aqueous solutions. The shell thicknesses of the SiO2 layers of the ZrO2@SiO2 NPs for each reaction time of 0, 3, 9, 18, 27, and 54 h were calculated as 0.0, 0.1, 0.7, 1.3, 2.1, and 4.2 nm, respectively (the red line in Figure 4c) [34,46,47,48,49]. In particular, the calculated shell thickness of the ZrO2@SiO2 NPs for the reaction time of 18 h (ZrO2@SiO2-18h) was consistent with that given by the TEM analysis, as described above (Figure 2b,e).

3.4. Dispersibility of ZrO2@SiO2 NPs in PDMS

Since PDMS is a hydrophobic polymer matrix with a high molecular weight, surface modification is required for ZrO2 NPs, which have COO groups on the surface, to prevent the agglomeration of NPs in the PDMS matrix. ZrO2@SiO2 NPs can form chemical affinity with PDMS through the formation of bonds between the surficial Si–OH groups of NPs and PDMS chains [53,54,55]. Dispersion of ZrO2@SiO2 NPs in the PDMS matrix can be improved as the surfaces of the NPs are subjected to greater modification by the SiO2 layer. However, to maintain a high refractive index, the SiO2 layer for the ZrO2@SiO2 NPs should preferably be thin; therefore, determining the appropriate thickness of the SiO2 layer is essential to achieve both transparency and a high refractive index in the nanocomposite film.
ZrO2@SiO2-PDMS nanocomposite films were prepared by dispersing ZrO2@SiO2 NPs subjected to different reaction times in the PDMS matrix and curing the mixture on a glass coverslip, as described above. SEM images and digital photographs were compared for the nanocomposite films to identify the dispersion of ZrO2@SiO2 NPs according to the surface modification (Figure 5). Figure 5a,b show top-view and (inset) 70 degree SEM images of 50 wt% ZrO2-PDMS and ZrO2@SiO2-18h-PDMS, respectively. It was found that the surface modification of NPs using SiO2 inhibited the agglomeration of the ZrO2 NPs in PDMS and induced a uniform dispersion. In the case of ZrO2@SiO2-18h-PDMS, ZrO2@SiO2-18h NPs were dispersed without any recognizable agglomeration. However, in the case of ZrO2-PDMS, ZrO2 NPs were heavily agglomerated into several hundred nanometers. The change in transparency of the nanocomposite films according to the surface modification of the ZrO2 NPs is shown in digital photographs in Figure 5c–e. ZrO2-PDMS appeared opaque due to light scattering from the agglomeration of NPs (Figure 5d). ZrO2@SiO2-3h-PDMS also appeared opaque, indicating that the surface modification of the NPs was insufficient to achieve good dispersion in PDMS (Figure 5e). On the other hand, ZrO2@SiO2-18h-PDMS was transparent, to a similar degree as the PDMS, showing that NPs were well-dispersed in the matrix (Figure 5c,f); that is, unlike the ZrO2 and ZrO2@SiO2-3h NPs, the ZrO2@SiO2-18h NPs had a sufficiently thick SiO2 layer, leading to homogenous dispersion in PDMS.

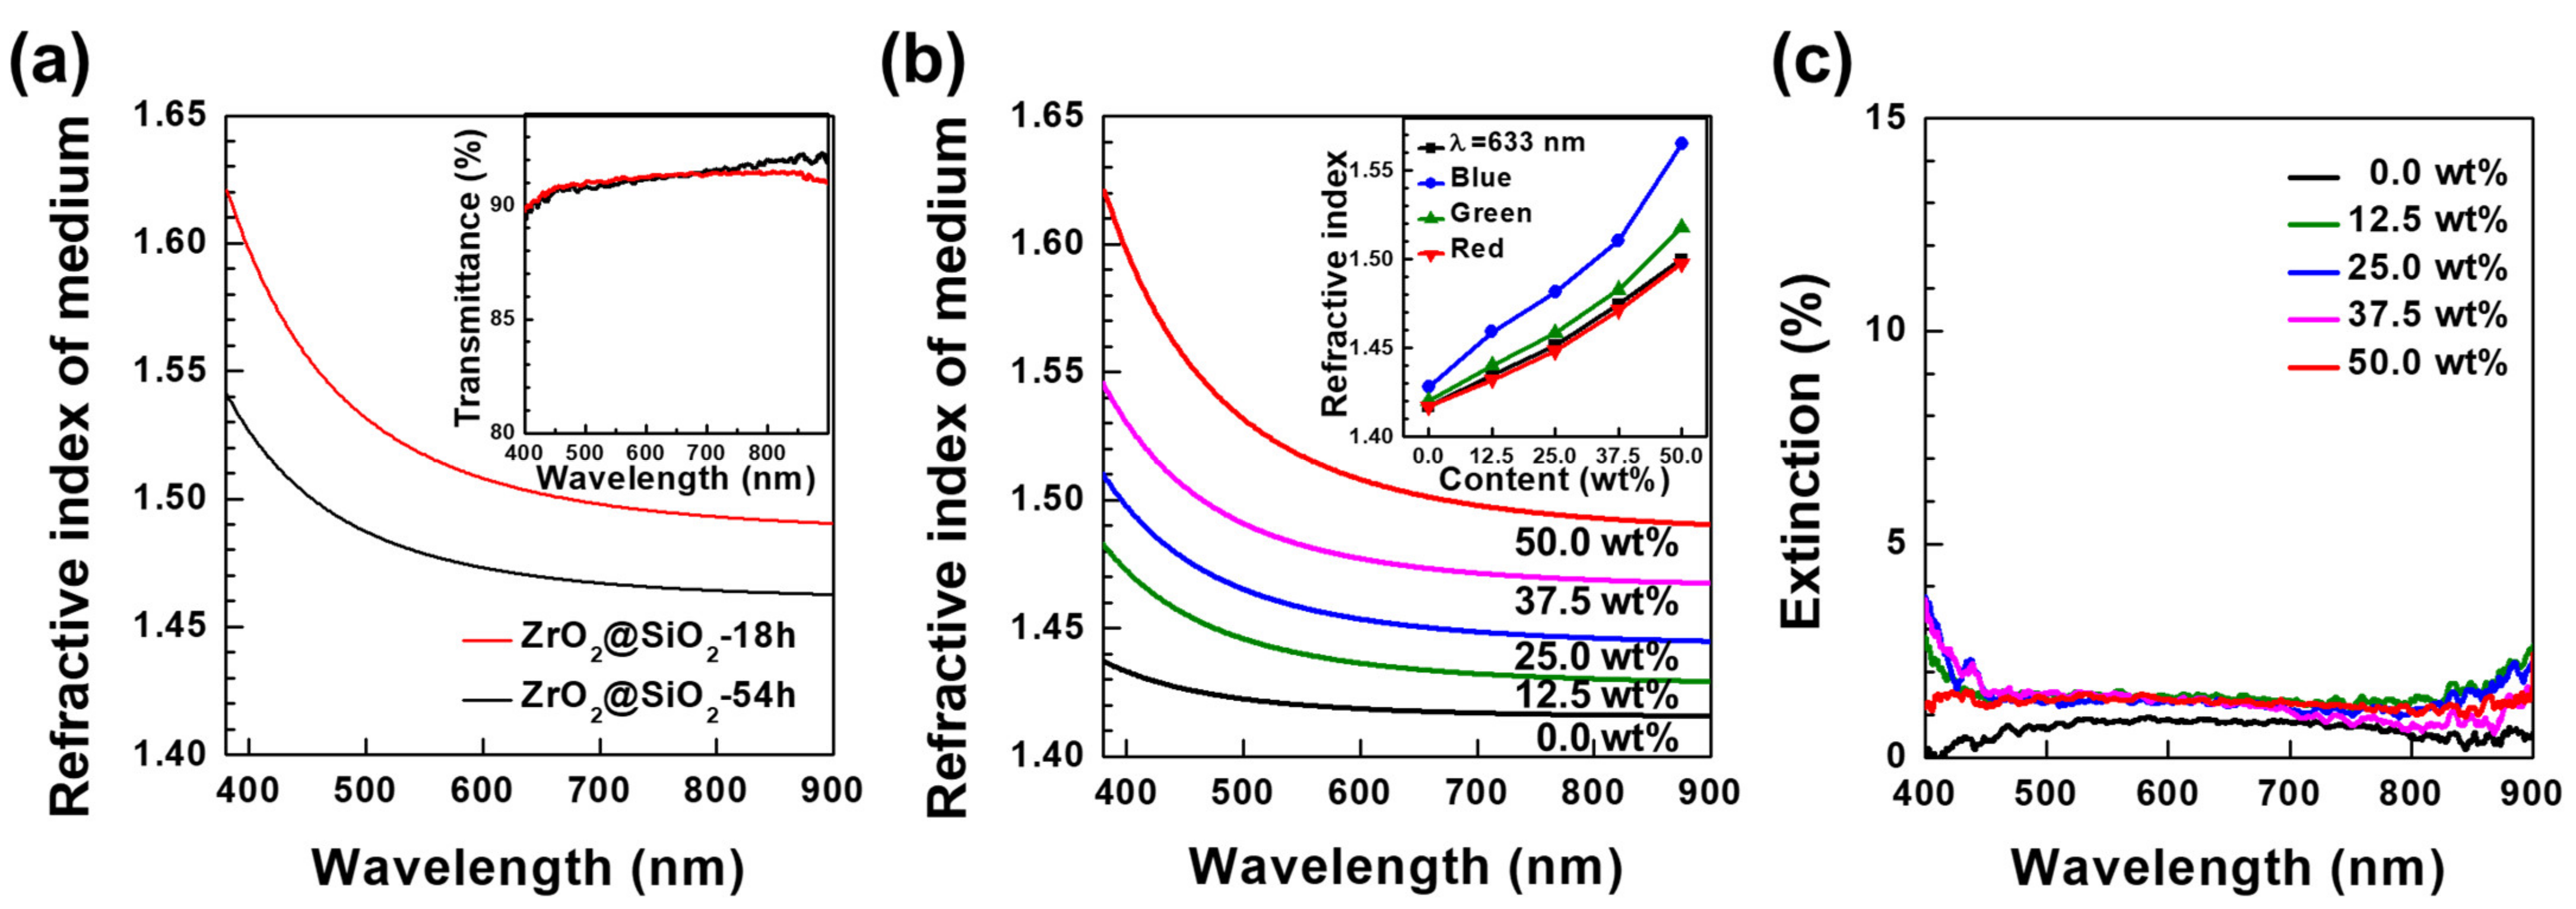
3.5. Optical Characterization of ZrO2@SiO2-PDMS

The optical properties of the nanocomposite films were characterized using the lab-built UV-vis spectrometer and the ellipsometer. The transmittance and reflectance spectra of the nanocomposite films were measured using films prepared on coverslips. The air was set to have a transmittance of 100%. The extinction spectra of the film were obtained as described in Equation (1). The transmittance, reflectance, and extinction spectra of 50 wt% ZrO2@SiO2-PDMS are shown in Figure 5g–i, respectively. Transmittances of the coverslip, PDMS, and ZrO2@SiO2-18h-PDMS (50 wt%) were, averaged in the wavelength region from 400 to 800 nm, 91.4%, 92.3%, and 91.1%, respectively (Figure 5g). These results were consistent with the digital photographs shown in Figure 5c,f. The reflectance value for the coverslip, PDMS, and ZrO2@SiO2-18h-PDMS were 7.7%, 7.1%, and 7.6%, respectively (Figure 5h). Extinction spectra were obtained based on the transmittance and reflectance to compare the opaqueness of the nanocomposite films. The extinction values of the coverslip, PDMS, and ZrO2@SiO2-18h-PDMS were 0.9%, 0.7%, and 1.3%, respectively (Figure 5i). In contrast, 50 wt% ZrO2-PDMS and ZrO2@SiO2-3h-PDMS exhibited higher extinction than 50 wt% ZrO2@SiO2-18h-PDMS owing to the large agglomerations of NPs.
Ellipsometry was performed to obtain the refractive index dispersion of the prepared nanocomposite films, as shown in Figure 6 and Figure S3. The refractive index of 50 wt% ZrO2-PDMS could not be obtained because of strong light scattering from the agglomeration of NPs. In the case of 50 wt% ZrO2@SiO2-3h-PDMS, the refractive index could only be measured in some locations. On the other hand, the refractive indices of both 50 wt% ZrO2@SiO2-18h-PDMS and ZrO2@SiO2-54h-PDMS could be measured in every location because NPs were well-dispersed without any hindrance from light scattering, as shown in Figure 6a. The difference between the refractive indices of ZrO2@SiO2-18h-PDMS and ZrO2@SiO2-54h-PDMS was 0.3 at 633 nm, which is consistent with the result shown in Figure 4c. The average transmittances of 50 wt% ZrO2@SiO2-18h-PDMS and ZrO2@SiO2-54h-PDMS were 91.1% and 91.3%, respectively; i.e., they had almost the same transmittance (Figure 6a (inset)). The Stöber method with the reaction time of 18 h was selected as optimal for the surface modification of ZrO2 NPs in this work because ZrO2@SiO2-18h-PDMS had excellent transmittance and high refractive indices.
Finally, the refractive index dispersions for ZrO2@SiO2-18h-PDMS were measured at different NP contents of 0.0, 12.5, 25.0, 37.5, and 50.0 wt%, as shown in Figure 6b. The refractive indices of ZrO2@SiO2-18h-PDMS with different NP contents were represented at a wavelength of 633 nm and at RGB colors selected according to the CIE 1931 color space; red—λ = 700 nm, green—λ = 546 nm, and blue—λ = 436 nm (Figure 6b (inset), Table S2) [56]. By changing the ZrO2@SiO2-18h NP content, the refractive index of the ZrO2@SiO2-18h-PDMS was adjusted from 1.42 to 1.60 in the visible-light region. The light extinction of ZrO2@SiO2-18h-PDMS was 1.5% or lower, indicating that ZrO2@SiO2-18h-PDMS achieved excellent transparency with all the studied NP contents (Figure 6c). Scratch resistance is one of the mechanical properties that the developed nanocomposite must obtain in order to be widely used as an advanced optical material. As shown by the scratch test depicted in Figure S5, the ZrO2@SiO2-18h-PDMS film seemed to have resistance similar to that of a bare PDMS film. It is necessary to improve the surface resistance and mechanical properties of the thin nanocomposite film through follow-up studies on the dispersion of ZrO2@SiO2 NPs in polymer matrixes that are harder than PDMS, including PET, epoxy, and acrylic resins.

4. Conclusions

We demonstrated that ZrO2 NPs could be stably and homogeneously dispersed in PDMS only after surface modification with a thin SiO2 layer using the simple Stöber method. We fabricated ZrO2@SiO2-PDMS nanocomposite films with adjustable refractive indices and excellent transparency. ZrO2 NPs were synthesized via hydrothermal synthesis, and their surface modification with a nanometer-thick SiO2 layer was effectively controlled by adjusting the reaction time of the Stöber method. By dispersing surface-modified ZrO2@SiO2-18h NPs in the PDMS, thin nanocomposite films with high refractive indices and excellent transparency were obtained. The ZrO2@SiO2-18h-PDMS nanocomposite films exhibited excellent transparency (91.1%), close to that of the coverslip (91.4%) in the visible region, and adjustable refractive indices (1.42–1.60) for the ZrO2@SiO2 NP content. ZrO2@SiO2-PDMS nanocomposite films may be useful in developing advanced optical devices based on simple synthesis and fabrication methods.

Supplementary Materials

The following supporting information can be downloaded from https://www.mdpi.com/article/10.3390/nano12142328/s1. Figure S1: XRD patterns of ZrO2 NPs; Figure S2: Refractive indices of ZrO2 NP aqueous solutions at λ = 633 nm with different reaction times; Table S1: Values from the literature for the refractive indices and density of ZrO2, SiO2, and water; Figure S3: Ellipsometric spectra of nanocomposite films; Table S2: Refractive indices of ZrO2@SiO2-18h-PDMS nanocomposite films prepared with different NP contents; Figure S4: Thicknesses of prepared nanocomposite and PDMS films; Figure S5: The scratch resistance tests for the ZrO2@SiO2-18h-PDMS nanocomposite film.

Author Contributions

Conceptualization, H.C., D.L. and I.Y.; investigation, H.C., D.L., S.H., H.K. and K.J.; writing—original draft preparation, H.C., D.L., C.K. and I.Y.; writing—review and editing, H.C., D.L., C.K. and I.Y.; Methodology, K.J.; supervision, C.K. and I.Y.; funding acquisition, C.K. and I.Y. All authors have read and agreed to the published version of the manuscript.

Funding

This work was supported by National Research Foundation of Korea (NRF) grants funded by the Korean government (NRF-2017M1A2A2087815, NRF-2018R1D1A1B07051197, NRF-2020R1A4A2002590, and NRF-2016R1A5A1012966). This work was also supported by the CNU Research Program funded by Chungnam National University.

Data Availability Statement

Data presented in this article are available upon request from the corresponding author.

Conflicts of Interest

The authors declare no conflict of interest.

References

  1. Loste, J.; Lopez-Cuesta, J.-M.; Billon, L.; Garay, H.; Save, M. Transparent polymer nanocomposites: An overview on their synthesis and advanced properties. Prog. Polym. Sci. 2019, 89, 133–158. [Google Scholar] [CrossRef]
  2. Pillay, V.; Seedat, A.; Choonara, Y.E.; du Toit, L.C.; Kumar, P.; Ndesendo, V.M.K. A Review of Polymeric Refabrication Techniques to Modify Polymer Properties for Biomedical and Drug Delivery Applications. AAPS PharmSciTech 2013, 14, 692–711. [Google Scholar] [CrossRef] [PubMed] [Green Version]
  3. Althues, H.; Henle, J.; Kaskel, S. Functional inorganic nanofillers for transparent polymers. Chem. Soc. Rev. 2007, 36, 1454–1465. [Google Scholar] [CrossRef] [PubMed]
  4. Li, S.; Lin, M.M.; Toprak, M.S.; Kim, D.K.; Muhammed, M. Nanocomposites of polymer and inorganic nanoparticles for optical and magnetic applications. Nano Rev. 2010, 1, 5214. [Google Scholar] [CrossRef] [PubMed]
  5. Qi, D.; Zhang, K.; Tian, G.; Jiang, B.; Huang, Y. Stretchable Electronics Based on PDMS Substrates. Adv. Mater. 2021, 33, 2003155. [Google Scholar] [CrossRef]
  6. Haque, S.M.; Ardila-Rey, J.A.; Umar, Y.; Rahman, H.; Mas’ud, A.A.; Muhammad-Sukki, F.; Albarracín, R. Polymeric Materials for Conversion of Electromagnetic Waves from the Sun to Electric Power. Polymers 2018, 10, 307. [Google Scholar] [CrossRef] [Green Version]
  7. Miranda, I.; Souza, A.; Sousa, P.; Ribeiro, J.; Castanheira, E.M.S.; Lima, R.; Minas, G. Properties and Applications of PDMS for Biomedical Engineering: A Review. J. Funct. Biomater. 2022, 13, 2. [Google Scholar] [CrossRef]
  8. Zhang, Y.; Zheng, J.; Fang, C.; Li, Z.; Zhao, X.; Li, Y.; Ruan, X.; Dai, Y. Enhancement of silicon-wafer solar cell efficiency with low-cost wrinkle antireflection coating of polydimethylsiloxane. Sol. Energy Mater. Sol. Cells 2018, 181, 15–20. [Google Scholar] [CrossRef]
  9. Choi, M.-C.; Kim, Y.; Ha, C.-S. Polymers for flexible displays: From material selection to device applications. Prog. Polym. Sci. 2008, 33, 581–630. [Google Scholar] [CrossRef]
  10. Koshelev, A.; Calafiore, G.; Piña-Hernandez, C.; Allen, F.I.; Dhuey, S.; Sassolini, S.; Wong, E.; Lum, P.; Munechika, K.; Cabrini, S. High refractive index Fresnel lens on a fiber fabricated by nanoimprint lithography for immersion applications. Opt. Lett. 2016, 41, 3423–3426. [Google Scholar] [CrossRef]
  11. Liu, J.-G.; Ueda, M. High refractive index polymers: Fundamental research and practical applications. J. Mater. Chem. 2009, 19, 8907–8919. [Google Scholar] [CrossRef]
  12. Jang, J.-Y.; Lee, H.-S.; Cha, S.; Shin, S.-H. Viewing angle enhanced integral imaging display by using a high refractive index medium. Appl. Opt. 2011, 50, B71–B76. [Google Scholar] [CrossRef] [PubMed]
  13. Novak, B.M. Hybrid Nanocomposite Materials—Between Inorganic Glasses and Organic Polymers. Adv. Mater. 1993, 5, 422–433. [Google Scholar] [CrossRef]
  14. Van de Hulst, H.C. Light Scattering by Small Particles; John Wiley & Sons Inc.: New York, NY, USA, 1957; p. 470. ISBN 978-0486642284. [Google Scholar]
  15. Hajji, P.; David, L.; Gerard, J.F.; Kaddami, H.; Pascault, J.P.; Vigier, G. Synthesis-Morphology-Mechanical Properties Relationships Of Polymer-Silica Nanocomposite Hybrid Materials. MRS Online Proc. Libr. 1999, 576, 357–362. [Google Scholar] [CrossRef]
  16. Hajji, P.; David, L.; Gerard, J.F.; Pascault, J.P.; Vigier, G. Synthesis, Structure, and Morphology of Polymer–Silica Hybrid Nanocomposites Based on Hydroxyethyl Methacrylate. J. Polym. Sci. B Polym. Phys. 1999, 37, 3172–3187. [Google Scholar] [CrossRef]
  17. Novak, B.M.; Davies, C. “Inverse” Organic-Inorganic Composite Materials. 2. Free-Radical Routes into nonshrinking sol-gel composites. Macromolecules 1991, 24, 5481–5483. [Google Scholar] [CrossRef]
  18. Wang, S.; Ahmad, Z.; Mark, J.E. A polyamide-silica composite prepared by the sol-gel process. Polym. Bull. 1993, 31, 323–330. [Google Scholar] [CrossRef]
  19. Matějka, L.; Dušek, K.; Pleŝtil, J.; Kříž, J.; Lednický, F. Formation and structure of the epoxy-silica hybrids. Polymer 1999, 40, 171–181. [Google Scholar] [CrossRef]
  20. Wei, Y.; Wang, W.; Yeh, J.-M.; Wang, B.; Yang, D.; Murray, J.K., Jr. Photochemical synthesis of polyacrylate-silica hybrid sol-gel materials catalyzed by photoacids. Adv. Mater. 1994, 6, 372–374. [Google Scholar] [CrossRef]
  21. Finsel, M.; Hemme, M.; Döring, S.; Rüter, J.S.V.; Dahl, G.T.; Krekeler, T.; Kornowski, A.; Ritter, M.; Weller, H.; Vossmeyer, T. Synthesis and thermal stability of ZrO2@SiO2 core-shell submicron particles. RSC Adv. 2019, 9, 26902–26914. [Google Scholar] [CrossRef] [Green Version]
  22. Yang, X.; Zhao, N.; Zhou, Q.; Cai, C.; Zhang, X.; Xu, J. Precise preparation of highly monodisperse ZrO2@SiO2 core-shell nanoparticles with adjustable refractive indices. J. Mater. Chem. 2013, 1, 3359–3366. [Google Scholar] [CrossRef]
  23. Zhang, Q.; Shen, J.; Wang, J.; Wu, G.; Chen, L. Sol-gel derived ZrO2-SiO2 highly refractive coatings. Int. J. Inorg. Chem. 2000, 2, 319–323. [Google Scholar] [CrossRef]
  24. Bai, A.; Song, H.; He, G.; Li, Q.; Yang, C.; Tang, L.; Yu, Y. Facile synthesis of core-shell structured ZrO2@SiO2 via a modified Stöber method. Ceram. Int. 2016, 42, 7583–7592. [Google Scholar] [CrossRef]
  25. He, X.; Wang, Z.; Pu, Y.; Wang, D.; Tang, R.; Cui, S.; Wang, J.-X.; Chen, J.-F. High-gravity-assisted scalable synthesis of zirconia nanodispersion for light emitting diodes encapsulation with enhanced light extraction efficiency. Chem. Eng. Sci. 2019, 195, 1–10. [Google Scholar] [CrossRef]
  26. Tao, P.; Li, Y.; Siegel, R.W.; Schadler, L.S. Transparent dispensible high-refractive index ZrO2/epoxy nanocomposites for LED encapsulation. J. Appl. Polym. Sci. 2013, 130, 3785–3793. [Google Scholar] [CrossRef]
  27. Cheema, T.A.; Lichtner, A.; Weichert, C.; Böl, M.; Garnweitner, G. Fabrication of transparent polymer-matrix nanocomposites with enhanced mechanical properties from chemically modified ZrO2 nanoparticles. J. Mater. Sci. 2012, 47, 2665–2674. [Google Scholar] [CrossRef]
  28. Hu, Y.; Gu, G.; Zhou, S.; Wu, L. Preparation and properties of transparent PMMA/ZrO2 nanocomposites using 2-hydroxyethyl methacrylate as a coupling agent. Polymer 2011, 52, 122–129. [Google Scholar] [CrossRef]
  29. Lee, S.; Shin, H.-J.; Yoon, S.-M.; Yi, D.K.; Choi, J.-Y.; Paik, U. Refractive index engineering of transparent ZrO2-polydimethylsiloxane nanocomposites. J. Mater. Chem. 2008, 18, 1751–1755. [Google Scholar] [CrossRef]
  30. Guschl, P.; McClintock, G. White Paper: Solvent-Free Formulations with Pixclear® ZrO2 for High-Refractive Index Films. Available online: www.pixelligent.com/white-papers/ (accessed on 10 May 2022).
  31. Wehrenberg, B.; Turakhia, D. White Paper: Utilizing Hansen Solubility Parameters for Formulation Optimization Using Pixclear® Zirconia Nanocrystals. Available online: www.pixelligent.com/white-papers/ (accessed on 10 May 2022).
  32. Guschl, P.; McClintock, G. White Paper: Solvent-Based Formulations with Pixclear® ZrO2 for High-Refractive Index Films. Available online: www.pixelligent.com/white-papers/ (accessed on 10 May 2022).
  33. Gupta, N.S.; Lee, K.-S.; Labouriau, A. Tuning Thermal and Mechanical Properties of Polydimethylsiloxane with Carbon Fibers. Polymers 2021, 13, 1141. [Google Scholar] [CrossRef]
  34. Arago, D.F.J.; Biot, J.B. Refractive properties of binary mixtures. Mém. Acad. Fr. 1806, 7–9. [Google Scholar]
  35. House, K.A.; House, J.E. Thermodynamics of dissolution of urea in water, alcohols, and their mixtures. J. Mol. Liq. 2017, 242, 428–432. [Google Scholar] [CrossRef]
  36. Kubo, S.; Diaz, A.; Tang, Y.; Mayer, T.S.; Khoo, I.C.; Mallouk, T.E. Tunability of the Refractive Index of Gold Nanoparticle Dispersions. Nano Lett. 2007, 7, 3418–3423. [Google Scholar] [CrossRef]
  37. Gates-Rector, S.; Blanton, T. The Powder Diffraction File: A Quality Materials Characterization Database. Power Diffr. 2019, 34, 352–360. [Google Scholar] [CrossRef] [Green Version]
  38. Bumajdad, A.; Nazeer, A.A.; Sagheer, F.A.; Nahar, S.; Zaki, M.I. Controlled Synthesis of ZrO2 Nanoparticles with Tailored Size, Morphology and Crystal Phases via Organic/Inorganic Hybrid Films. Sci. Rep. 2018, 8, 3695. [Google Scholar] [CrossRef] [PubMed] [Green Version]
  39. Moulder, J.F.; Stickle, W.F.; Sobol, P.E.; Bomben, K.D. References. In Handbook of X-ray Photoelectron Spectroscopy; Chastian, J., King, R.C., Jr., Eds.; Physical Electronics, Inc.: Eden Prairie, MN, USA, 1995; pp. 44, 56, 108. ISBN 0-9648124-1-X. [Google Scholar]
  40. Nalbandian, L.; Patrikiadou, E.; Zaspalis, V.; Patrikidou, A.; Hatzidaki, E.; Papandreou, C.N. Magnetic Nanoparticles in Medical Diagnostic Applications: Synthesis, Characterization and Proteins Conjugation. Curr. Nanosci. 2016, 12, 455–468. [Google Scholar] [CrossRef]
  41. Zhang, Q.; Zhang, T.; Ge, J.; Yin, Y. Permeable Silica Shell through Surface-Protected Etching. Nano Lett. 2008, 8, 2867–2871. [Google Scholar] [CrossRef] [PubMed]
  42. Maguire, C.M.; Rösslein, M.; Wick, P.; Prina-Mello, A. Characterisation of particles in solution—A perspective on light scattering and comparative technologies. Sci. Technol. Adv. Mater. 2018, 19, 732–745. [Google Scholar] [CrossRef]
  43. Tauc, J.; Grigorovici, R.; Vancu, A. Optical Properties and Electronic Structure of Amorphous Germanium. Phys. Status Solidi B 1966, 15, 627–637. [Google Scholar] [CrossRef]
  44. Liu, Y.C.; Tung, S.K.; Hsieh, J.H. Influence of annealing on optical properties and surface structure of ZnO thin films. J. Cryst. Growth 2006, 287, 105–111. [Google Scholar] [CrossRef]
  45. Tompkins, H.G.; Hilfiker, J.N. Spectroscopic Ellipsometry: Practical Application to Thin Film Characterization; Brundle, C.R., Ed.; Momentum Press: New York, NY, USA, 2016; ISBN 978-1-60650-727-8. [Google Scholar]
  46. Jõgiaas, T.; Kull, M.; Seemen, H.; Ritslaid, P.; Kukli, K.; Tamm, A. Optical and mechanical properties of nanolaminates of zirconium and hafnium oxides grown by atomic layer deposition. J. Vac. Sci. Technol. A 2020, 38, 022406. [Google Scholar] [CrossRef] [Green Version]
  47. Shukla, S.; Seal, S. Mechanisms of room temperature metastable tetragonal phase stabilization in zirconia. Int. Mater. Rev. 2005, 50, 45–64. [Google Scholar] [CrossRef]
  48. Dixit, C.K.; Bhakta, S.; Kumar, A.; Suib, S.L.; Rusling, J.F. Fast nucleation for silica nanoparticle synthesis using a sol-gel method. Nanoscale 2016, 8, 19662–19667. [Google Scholar] [CrossRef] [PubMed] [Green Version]
  49. Hale, G.M.; Querry, M.R. Optical Constants of Water in the 200-nm to 200-μm Wavelength Region. Appl. Opt. 1973, 12, 555–563. [Google Scholar] [CrossRef]
  50. Rouseel, P.J.; Vanhellemont, J.; Maes, H.E. Numerical aspects of the implementation of effective-medium approximation models in spectroscopic ellipsometry regression software. Thin Solid Films 1993, 234, 423–427. [Google Scholar] [CrossRef]
  51. Garnett, J.C.M. Colours in metal glasses and in metallic films. Philos. Trans. R. Soc. A 1904, 203, 385–420. [Google Scholar] [CrossRef] [Green Version]
  52. Garnett, J.C.M. Colours in metal glasses, in metallic films, and in metallic solutions II. Philos. Trans. R. Soc. A 1906, 205, 237–288. [Google Scholar] [CrossRef] [Green Version]
  53. Zhang, X.; Ye, H.; Xiao, B.; Yan, L.; Lv, H.; Jiang, B. Sol-Gel Preparation of PDMS/Silica Hybrid Antireflective Coatings with Controlled Thickness and Durable Antireflective Performance. J. Phys. Chem. C 2010, 114, 19979–19983. [Google Scholar] [CrossRef]
  54. Compoint, F.; Fall, D.; Piombini, H.; Belleville, P.; Montouillout, Y.; Duquennoy, M.; Ouaftouh, M.; Jenot, F.; Piwakowski, B.; Sanchez, C. Sol-gel-processed hybrid silica-PDMS layers for the optics of high-power laser flux systems. J. Mater. Sci. 2016, 51, 5031–5045. [Google Scholar] [CrossRef]
  55. Klonos, P.; Bolbukh, Y.; Koutsiara, C.S.; Zafeiris, K.; Kalogeri, O.D.; Sternik, D.; Derylo-Marczewska, A.; Tertykh, V.; Pissis, P. Morphology and molecular dynamics investigation of low molecular weight PDMS adsorbed onto Stöber, fumed, and sol-gel silica nanoparticles. Polymer 2018, 148, 1–13. [Google Scholar] [CrossRef]
  56. Guild, J. The colorimetric properties of the spectrum. Philos. Trans. R. Soc. A 1931, 230, 149–187. [Google Scholar] [CrossRef] [Green Version]
Figure 1. (a) Schematic illustration of surface modification of ZrO2 NPs using TEOS to prepare a transparent nanocomposite film with adjustable refractive index. (b) TEM-EDX images of ZrO2@SiO2 NPs indicating that the surface of ZrO2 NPs was modified with the SiO2 layer. (c) Photo of ZrO2@SiO2-PDMS nanocomposite film (100 nm thickness) containing 50 wt% ZrO2@SiO2 NPs.
Nanomaterials 12 02328 g001
Figure 2. (a) SEM and (b) TEM images of synthesized ZrO2 NPs. The inset shows a representative TEM image of an individual ZrO2 NP with a 20 nm scale. (d) SEM and (e) TEM images of ZrO2@SiO2 NPs. The inset shows a representative TEM image of an individual ZrO2@SiO2 NP with a 20 nm scale. (c) Low-resolution XPS spectra of ZrO2 and ZrO2@SiO2 NPs. (f) High-resolution XPS spectra of Si 2p for both ZrO2 and ZrO2@SiO2 NPs.
Nanomaterials 12 02328 g002
Figure 3. (a) FT-IR spectra of ZrO2@SiO2 NPs with different reaction times. Dashed lines indicate the peak positions corresponding to (black) Si–O–Si and (red) C=O bonds, respectively. (b) Changes in absorption intensities of ZrO2@SiO2 NPs according to the reaction time for (black) Si–O–Si and (red) C=O bonds. (c) Size distribution (hydrodynamic diameter) of ZrO2@SiO2 NPs with different reaction times, measured by DLS analysis. (d) Changes in mean hydrodynamic diameter of ZrO2@SiO2 NPs according to the reaction time. The error bar represents the standard deviation in the hydrodynamic diameters of the NPs.
Nanomaterials 12 02328 g003
Figure 4. (a) UV-vis absorption spectra of (black) ZrO2 and (red) ZrO2@SiO2-18h NPs. The inset shows the corresponding Tauc plots for (black) ZrO2 and (red) ZrO2@SiO2-18h NPs. (b) Refractive index dispersions of aqueous solutions of ZrO2@SiO2 NPs prepared with different reaction times. All solutions were prepared with 50 wt% NP content. (c) Refractive (black) indices (at λ = 633 nm) for ZrO2@SiO2 NP solutions with different reaction times and (red) calculated SiO2 layer thicknesses, as well the (blue) effective refractive indices of ZrO2@SiO2 NPs.
Nanomaterials 12 02328 g004
Figure 5. SEM images of (a) ZrO2@SiO2-18h-PDMS and (b) ZrO2-PDMS films. The inset shows 70 degree SEM images of the film edges of (a) ZrO2@SiO2-18h-PDMS and (b) ZrO2-PDMS films. Digital photos of (c) ZrO2@SiO2-18h-PDMS, (d) ZrO2-PDMS, (e) ZrO2@SiO2-3h-PDMS, and (f) PDMS films. All films were prepared with 100 nm thickness on Si substrates or coverslips with NP contents of 50 wt%. (g) Transmittance (T), (h) reflectance (R), and (i) extinction (E) spectra of corresponding films.
Nanomaterials 12 02328 g005
Figure 6. (a) Refractive index dispersions of (red) ZrO2@SiO2-18h-PDMS and (black) ZrO2@SiO2-54h-PDMS nanocomposite films. Films were prepared with particle contents of 50 wt%. The inset shows the transmittance spectra of the corresponding nanocomposite films. (b) Refractive index dispersions of ZrO2@SiO2-18h-PDMS films with different NP contents (0.0 to 50.0 wt%). The inset shows the refractive indices (at (black) λ = 633 nm and RGB wavelengths selected according to the CIE 1931 color space (blue—λ = 436 nm, green—λ = 546 nm, and red—λ = 700 nm) of the corresponding nanocomposite films. (c) Extinction spectra of the corresponding nanocomposite films.
Nanomaterials 12 02328 g006
Table 1. Refractive indices measured from ZrO2@SiO2 NP solutions with different reaction times and effective refractive indices, densities, and SiO2 layer thicknesses calculated for ZrO2@SiO2 NPs. All refractive indices are represented at the wavelength of λ = 633 nm (see Supplementary Materials for details).
Reaction Time (h)ZrO2@SiO2 NP SolutionZrO2@SiO2 NP
Refractive IndexRefractive Index aDensity a (g/mL)SiO2 Layer Thickness a (nm)
01.452.166.100.0
31.452.145.980.1
91.441.985.190.7
181.431.884.741.3
271.421.774.202.1
541.401.633.474.2
a Values were calculated using the diameter of ZrO2 NPs as determined by the TEM analysis (Figure 2) and the parameters given in Table S1.
Publisher’s Note: MDPI stays neutral with regard to jurisdictional claims in published maps and institutional affiliations.

