3.1. Catalyst Characterization
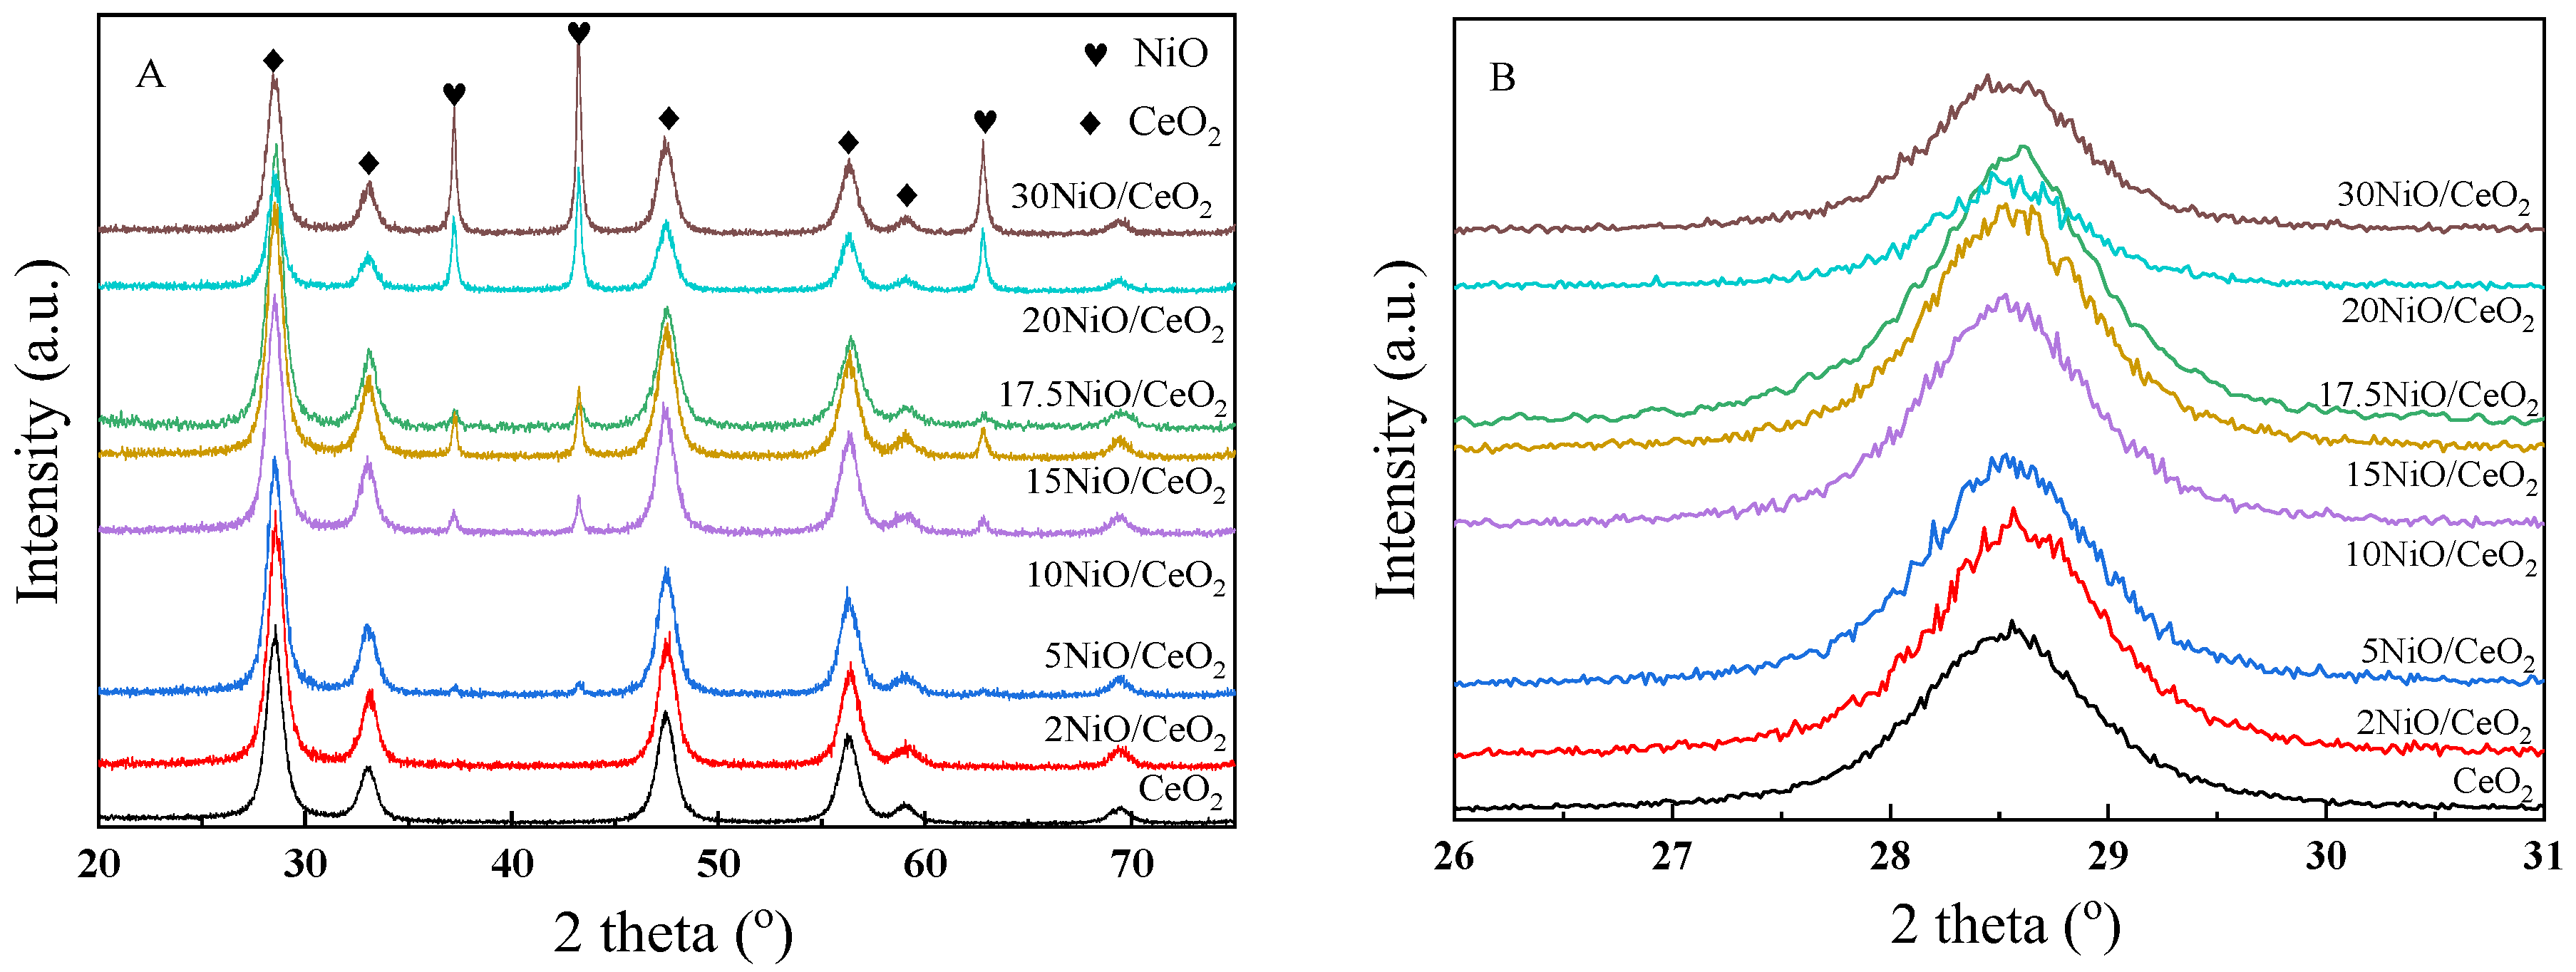
Figure 1 shows the XRD patterns of xNiO/CeO
2 samples with different Ni contents. As shown in
Figure 1A, after metal Ni loading, the CeO
2 support still maintained the crystal structure of fluorite cubic phase (JCPDS File 34-0394), similarly to pure CeO
2 [
21]. The enlarged pattern (shown in
Figure 1B) revealed that the diffraction peaks of the CeO
2 (111) crystal plane in xNiO/CeO
2 samples moved to a higher angle, indicating that the crystal cell parameters of CeO
2 shrank after Ni loading. This may have been due to the Ni
2+, with its smaller ionic radius (R = 0.72 nm), replacing Ce
4+ (R = 0.81 nm) in the CeO
2 lattice, which resulted in reductions in the cell parameters of CeO
2 [
22]. The average crystal sizes of NiO and CeO
2 in the xNiO/CeO
2 samples were calculated by the Scherrer formula, and the results are listed in
Table 1. Compared with pure CeO
2 support, the grain size of CeO
2 increased after Ni loading, which may have been caused by sintering during the thermal calcination or the lattice distortion of CeO
2 caused by Ni species [
23].
As shown in
Figure 1A, the XRD diffraction peaks at 37.0°, 43.0°, and 62.9° corresponded to the characteristic diffraction peaks of NiO’s (111), (200), and (220) crystal planes (JCPDS 47-1049), respectively. As Ni loading increased, the intensity of the NiO diffraction peak gradually increased, indicating that NiO particles aggregated on the surface of the catalyst and the grain size gradually grew. The particle sizes of NiO are also listed in
Table 1, revealing that as Ni loading increased, the particle size of NiO increased from about 10.1 nm to 35.1 nm. The change in NiO grain size led to a change in the interaction between NiO and CeO
2, which may have affected the reduction behavior of NiO and the structural difference of the catalyst surface.
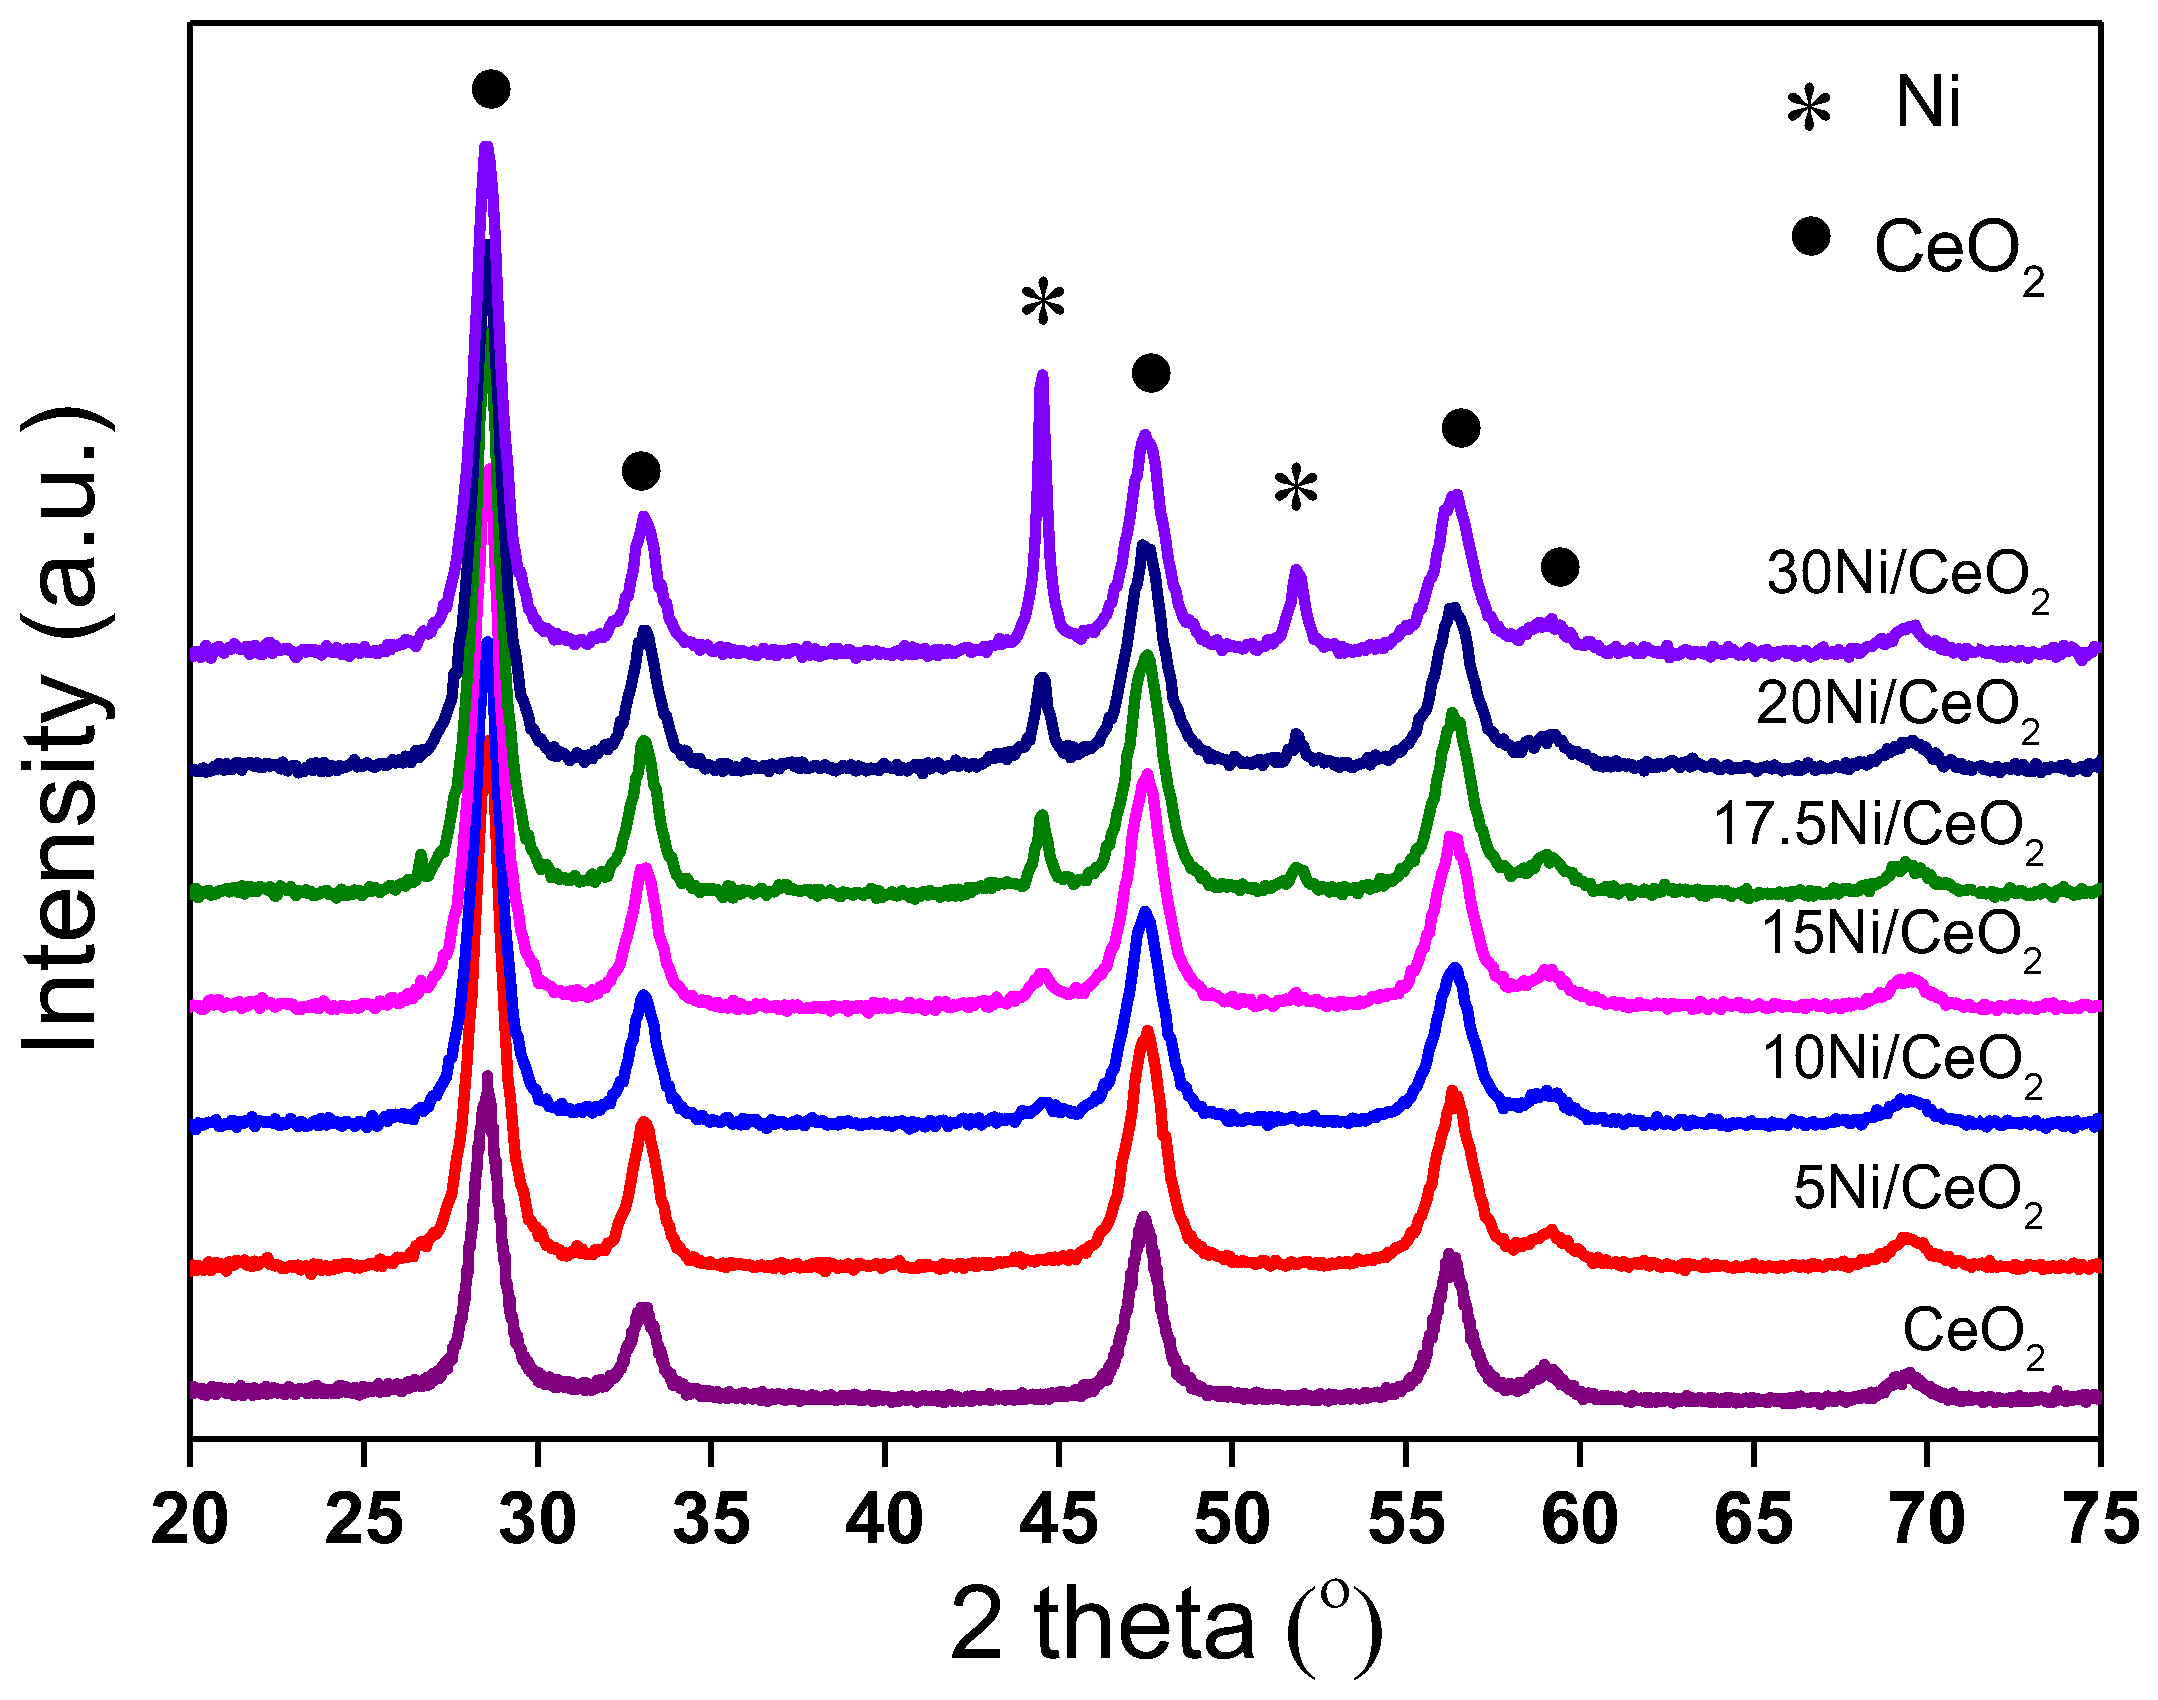
Figure 2 shows the XRD patterns of xNi/CeO
2 catalysts after reduction at 350 °C. As shown in
Figure 2, the CeO
2 support maintained a fluorite cubic structure after reduction, and the characteristic peak of NiO disappeared, while the characteristic diffraction peak of the Ni (111) plane appeared at 44.6° (JCPDS 01-1258), indicating that NiO was reduced to metallic Ni. However, for the 5Ni/CeO
2 catalyst, the diffraction peak of the metal Ni was not observed, which may have been due to the high dispersion of amorphous Ni species on the catalyst surface or the smaller particle size of Ni (<4 nm). The crystal sizes of Ni in xNi/CeO
2 catalysts with different loading content were calculated by the Scherrer formula and are listed in
Table 1. As the Ni loading content increased, the metal Ni aggregates on the surface of the catalyst increased, and the average grain size increased gradually from about 10.7 nm to 36.6 nm.
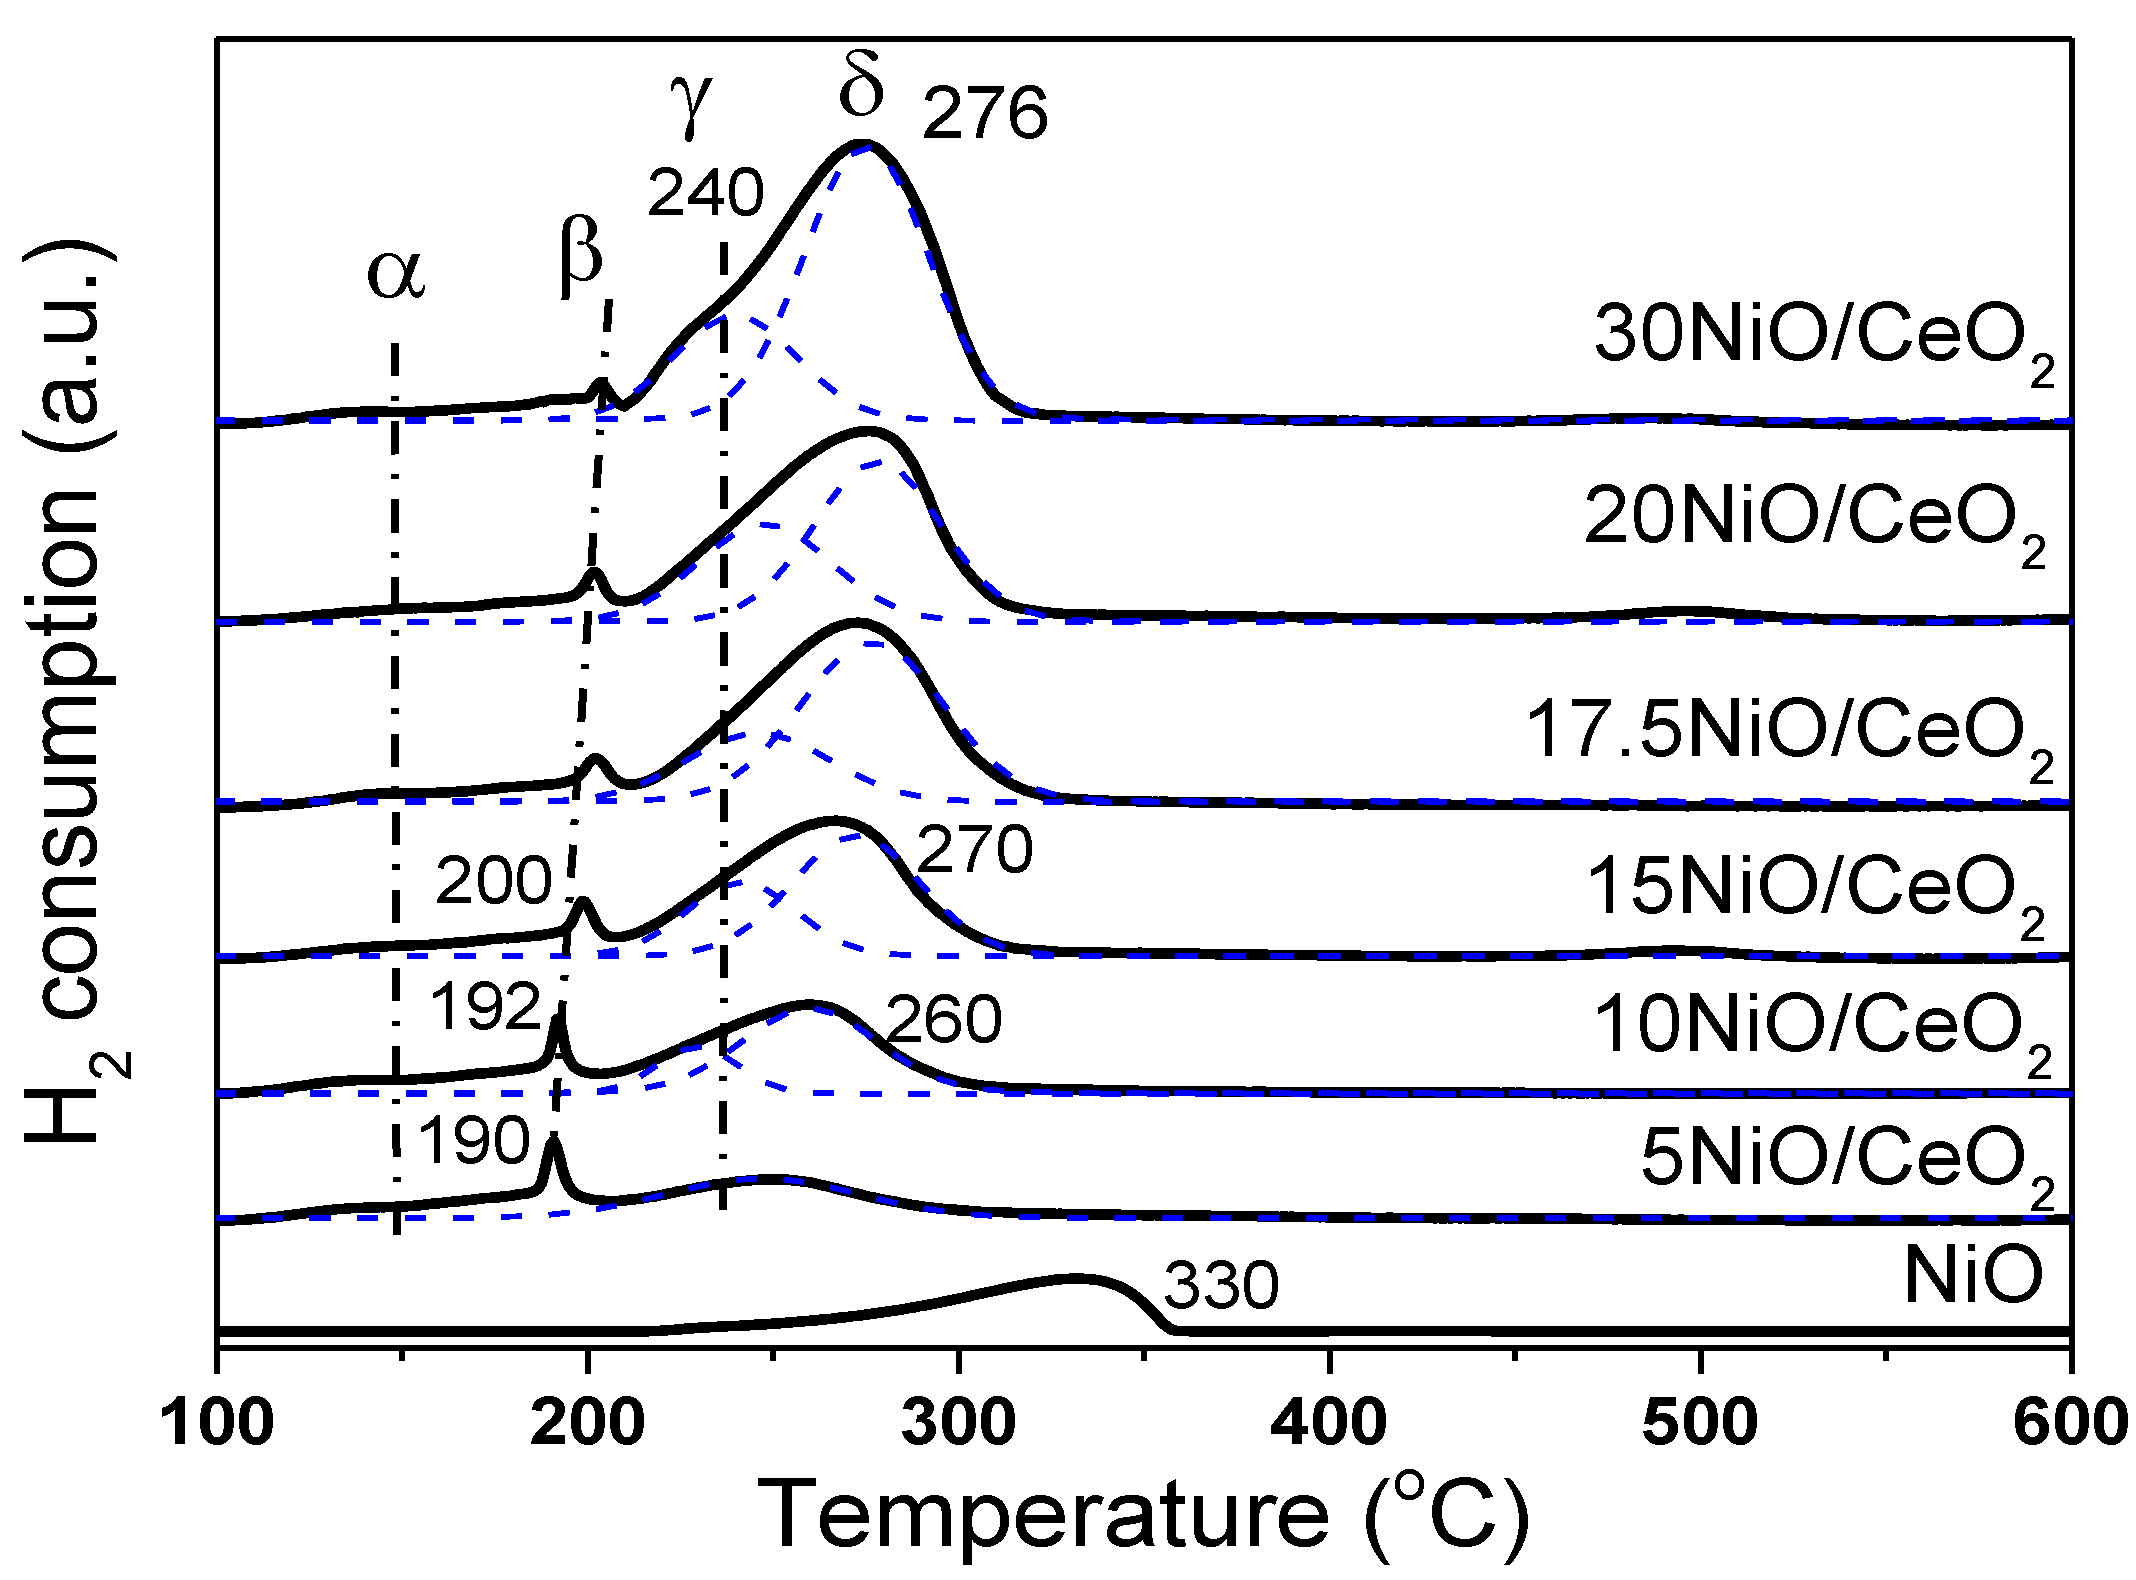
Figure 3 shows the H
2-TPR spectrum of xNiO/CeO
2 samples. The peaks of H
2 consumption, named α, β, γ, and δ, were well fitted through a Gauss-type function for these samples. The α peak showed lower intensity and a broader shape at about 150 °C, which was attributed to the reduction of oxygen species adsorbed on the surface of CeO
2 [
24,
25]. It has been reported that parts of Ni
2+ species could enter the CeO
2 lattice to replace Ce
4+, which resulted in the distortion of CeO
2 lattice and produced oxygen vacancies to balance charges [
24]. Raman results also confirmed that the loaded NiO species promoted the formation of oxygen vacancies on the CeO
2 surface (
Figure 4A). These oxygen vacancies could adsorb some small oxygen-containing molecules and generate reactive oxygen species, which can easily react with hydrogen [
25]. The sharp β peak of H
2 consumption at about 200 °C could be attributed to the H
2 depletion caused by the dissociation and adsorption of H
2 onto the oxygen vacancies or the Ni–Ce interface and the formation of OH groups on the surface. A similar result was found in Ni–Ce solid solution [
26]. As shown in
Figure 3, as Ni loading increased, the β peak gradually moves towards higher temperatures, and the peak intensity decreased, indicating that the increase in Ni content inhibited the dissociation and adsorption of H
2 on the oxygen vacancies or the Ni–Ce interface, which may have been caused by the excessive Ni species masking the oxygen vacancies on the surface.
In general, the reduction of NiO species occurs in the temperature range of 200–300 °C. The asymmetric reduction peaks of NiO were deconvolved into two peaks for H
2 consumption, which are labeled γ and δ, respectively. The γ peak at 240 °C was attributed to the reduction of highly dispersed NiO species closely linked to the CeO
2 support. The stronger metal–support interaction promoted the reduction of NiO at lower temperatures [
21]. The δ peak at high temperature (about 275 °C) was ascribed to the reduction of bulk NiO species aggregated on the CeO
2 surface. From
Figure 3, the reduction temperature of NiO species on the CeO
2 surface was lower than that of bulk NiO. This was mainly because loaded NiO, with smaller size and larger surface area, could more easily contact with H
2, which resulted in the lower reduction temperature. Moreover, oxygen vacancies and preferential reduced Ni species on the surface of CeO
2 support (at 240 °C) promoted the dissociation and activation of H
2, and the overflow of H atoms to NiO with large particle size was favorable to the reduction of NiO at low temperature. It should be noted that as Ni loading increased, the δ peak moved towards high temperatures. A possible reason for this is that the activation and migration of H
2 may have been inhibited because of the increase in NiO particle size and the decrease in oxygen vacancy, thus retarding the reduction of NiO at low temperatures.
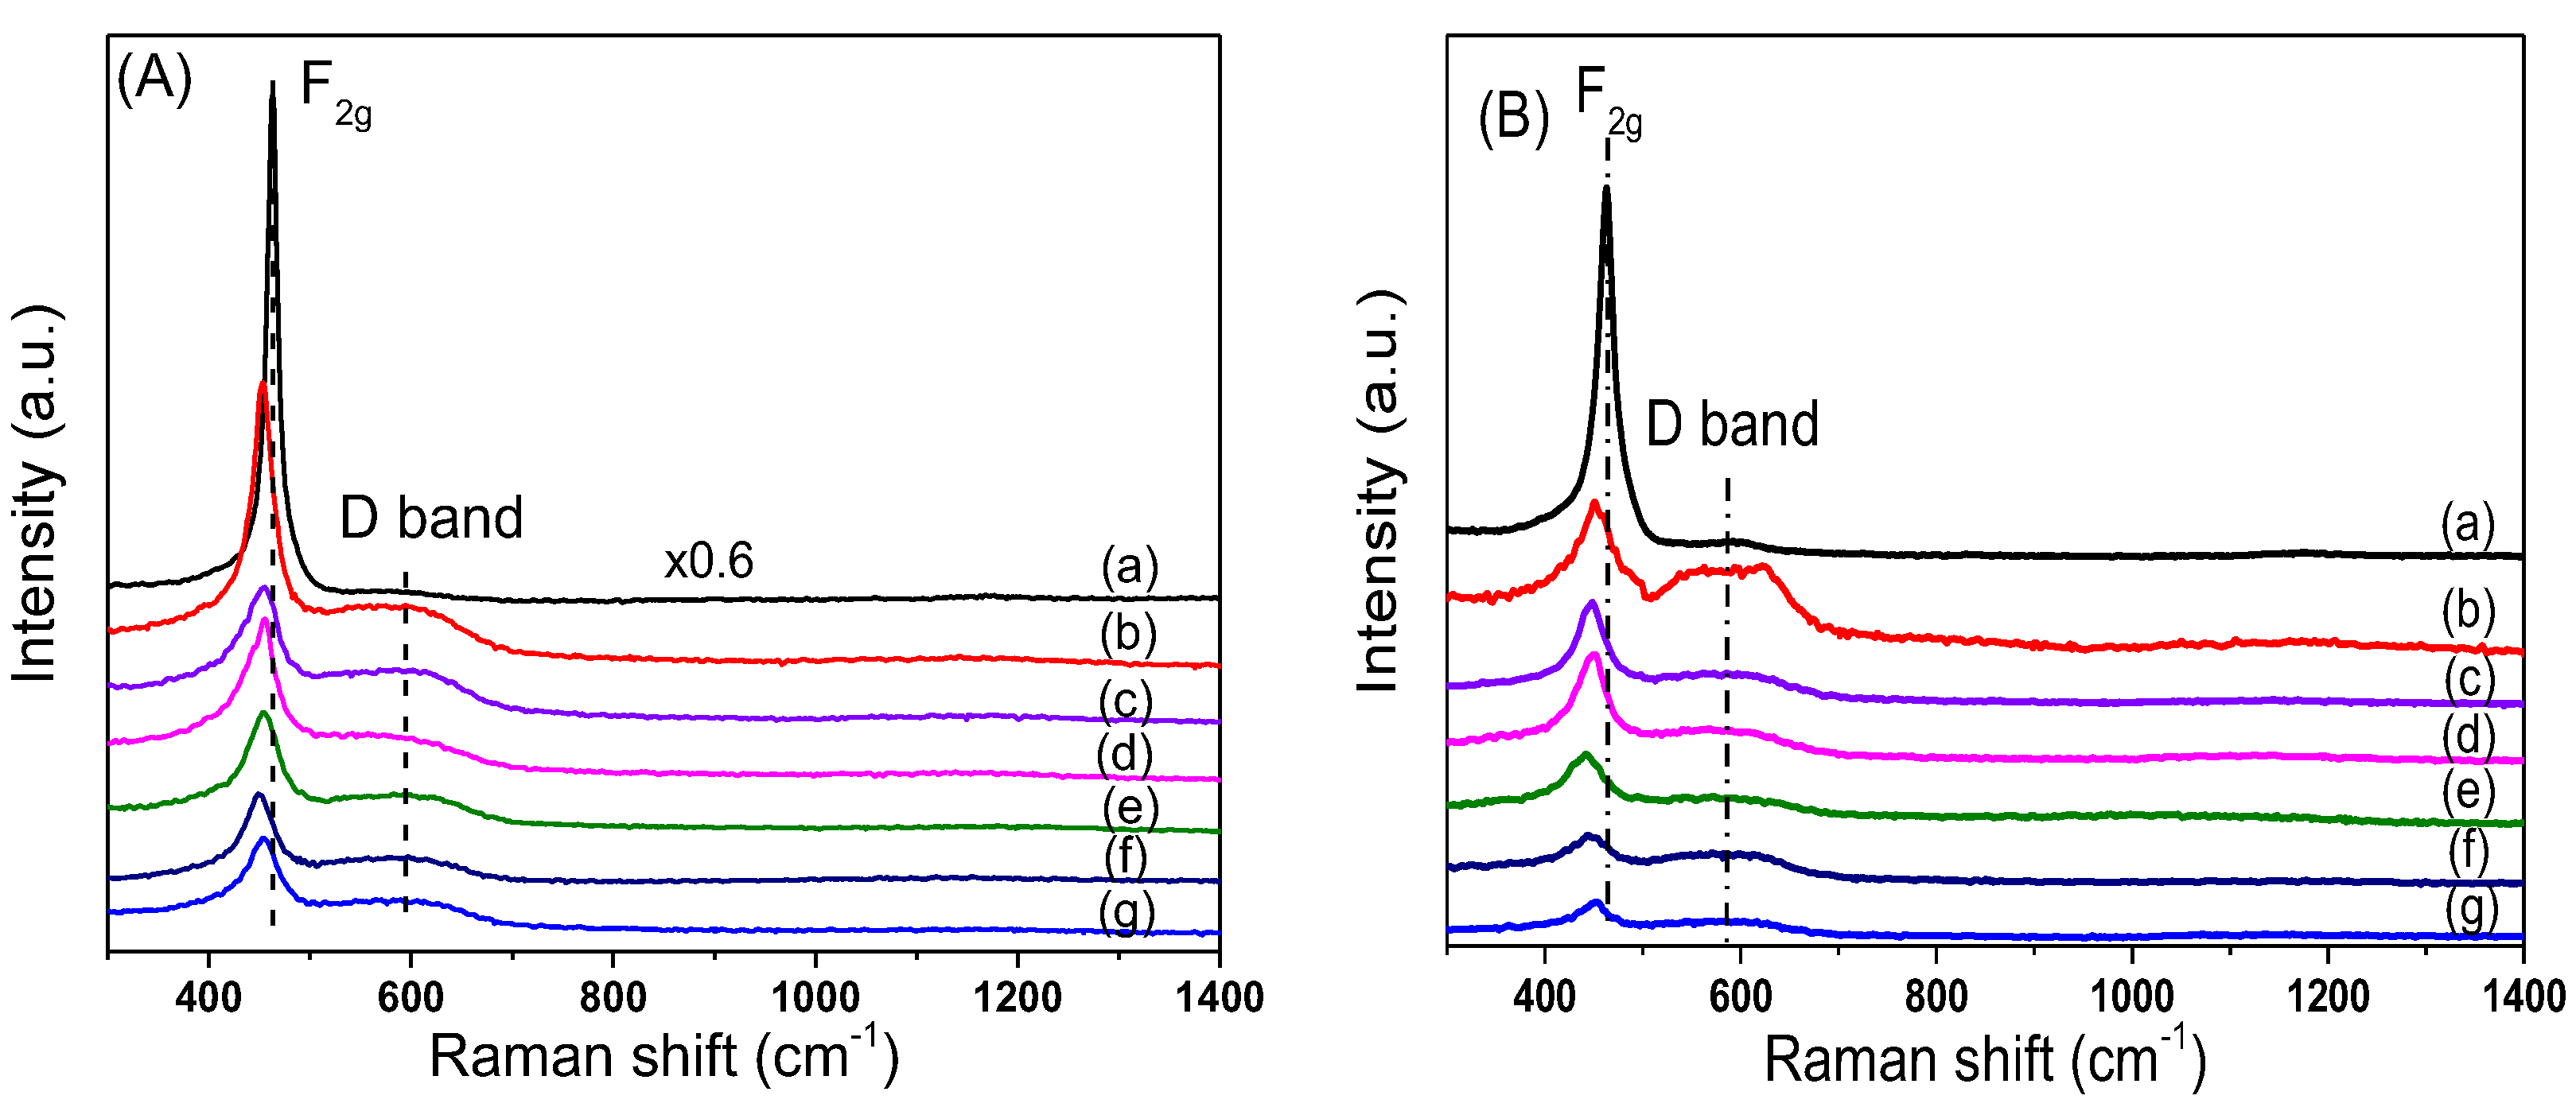
In order to study the effect of Ni loading on the surface structure of CeO
2, Raman characterizations for xNiO/CeO
2 samples were conducted, and the results are shown in
Figure 4. The Raman peak intensity of CeO
2 in the figure was 0.6 times that of the original peak intensity in order to facilitate comparison of results. For CeO
2 support, a strong Raman vibration peak was observed at 466 cm
−1, corresponding to the F2g vibration mode for the Ce–O bond in the cubic fluorite structure of CeO
2 [
27]. After the loading of NiO on the surface of CeO
2, the F2g peak intensity of CeO
2 decreased, the peak shape widened, and the peak position moved towards low wavelengths. This was because the strong interaction between NiO and CeO
2 led to lattice distortion of CeO
2, which reduced the symmetry of the Ce–O bond [
25]. Besides the F2g vibration peak, the Raman vibration peak at 600 cm
−1 was attributed to the vibration (D band) caused by defect sites on the CeO
2 surface [
25]. Compared with that of the pure CeO2 support, the peak intensity of the D band of the xNiO/CeO
2 sample increased significantly, indicating that the existence of NiO promoted the formation of oxygen vacancies on the CeO
2 surface. However, the vibration peak of NiO at 520 cm
−1 could not be observed and may be covered by the F2g vibration peak of CeO
2 [
26]. Raman spectrum results for the xNiO/CeO
2 catalyst after reduction are shown in
Figure 4B. Similarly to the xNiO/CeO
2 precursor, two Raman characteristic peaks were observed at 466 cm
−1 and 600 cm
−1, corresponding to the F2g vibration of Ce–O bond for cubic fluorite CeO
2 and the D-band vibration induced by surface defects, respectively [
25].
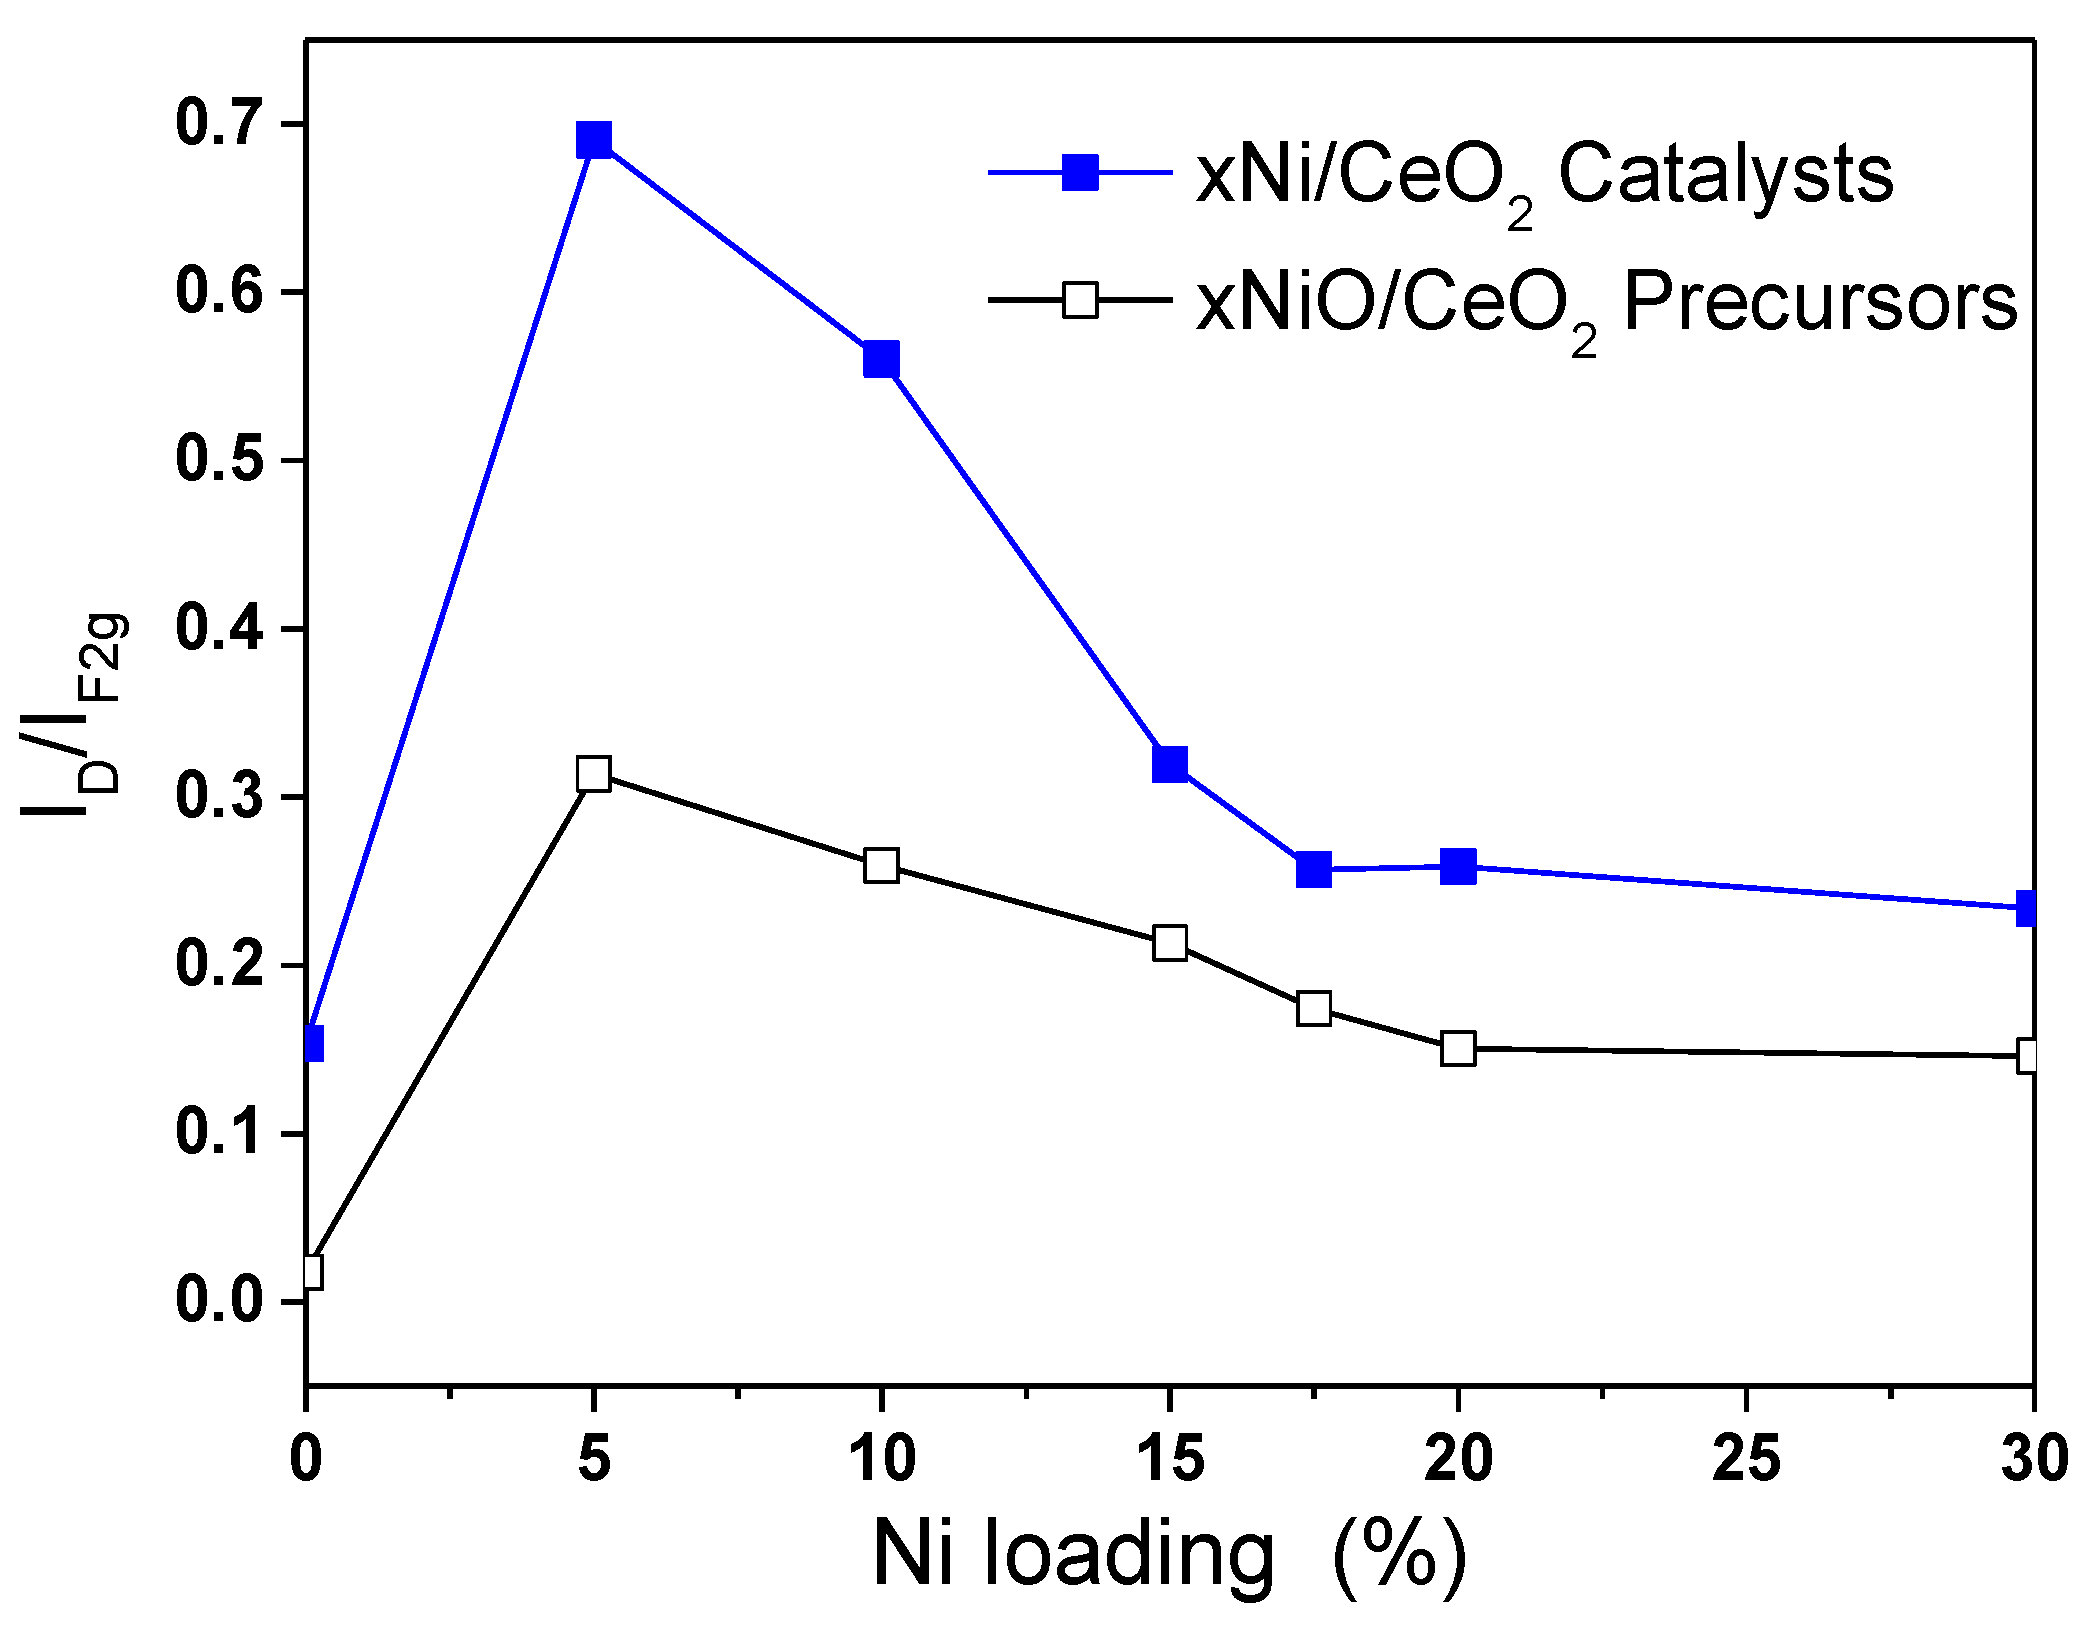
Figure 5 shows the variation trend of the I
D/I
F2g ratio with Ni content before and after reduction, which reflects the influence of Ni loading on the oxygen vacancy concentration on the catalyst surface [
20]. As shown in
Figure 5, the oxygen vacancy concentrations of all xNiO/CeO
2 samples loaded with Ni were higher than that of the CeO
2 support without Ni, which indicates that the addition of Ni was beneficial to the formation of oxygen vacancies on the surface of CeO
2. Among these NiO/CeO
2 samples, the I
D/I
F2g ratio of the 5NiO/CeO
2 sample is the highest, and then the I
D/I
F2g ratio decreased gradually as the Ni content increased, which means that the oxygen vacancy decreased as the Ni content increased. A possible reason for this is that the aggregation of NiO and the growth in particle size on the surface of CeO
2 weakened the interaction of NiO and CeO
2 and covered part of the oxygen vacancies on the surface, which resulted in a decrease in oxygen vacancies.
As shown in
Figure 5, compared with the xNiO/CeO
2 samples, the I
D/I
F2g ratios for the xNi/CeO
2 catalysts increased significantly after reduction, indicating that the oxygen vacancy concentrations on the surface of the xNi/CeO
2 catalysts increased obviously after H
2 reduction. The oxygen vacancy increments of 5Ni/CeO
2 and 10Ni/CeO
2 were significantly larger than those of other catalysts with higher Ni loading, which suggests that lower Ni content was beneficial to the formation of oxygen vacancies on the surface of the catalyst. When the loaded content of Ni was low, Ni species and CeO
2 were in close contact and interacted strongly each other, which could have promoted the reduction of the CeO
2 surface and facilitated the formation of oxygen vacancies on the surface. However, as Ni loading increased, the active Ni species began to aggregate and cover the surface of CeO
2, which weakened the Ni–CeO
2 interaction and inhibited the reduction of CeO
2 surface.
In order to further study the effect of Ni content on the surface species of Ni/CeO
2, five samples of CeO
2, 5Ni/CeO
2, 10Ni/CeO
2, 17.5Ni/CeO
2, and 30Ni/CeO
2 were characterized by the XPS technique.
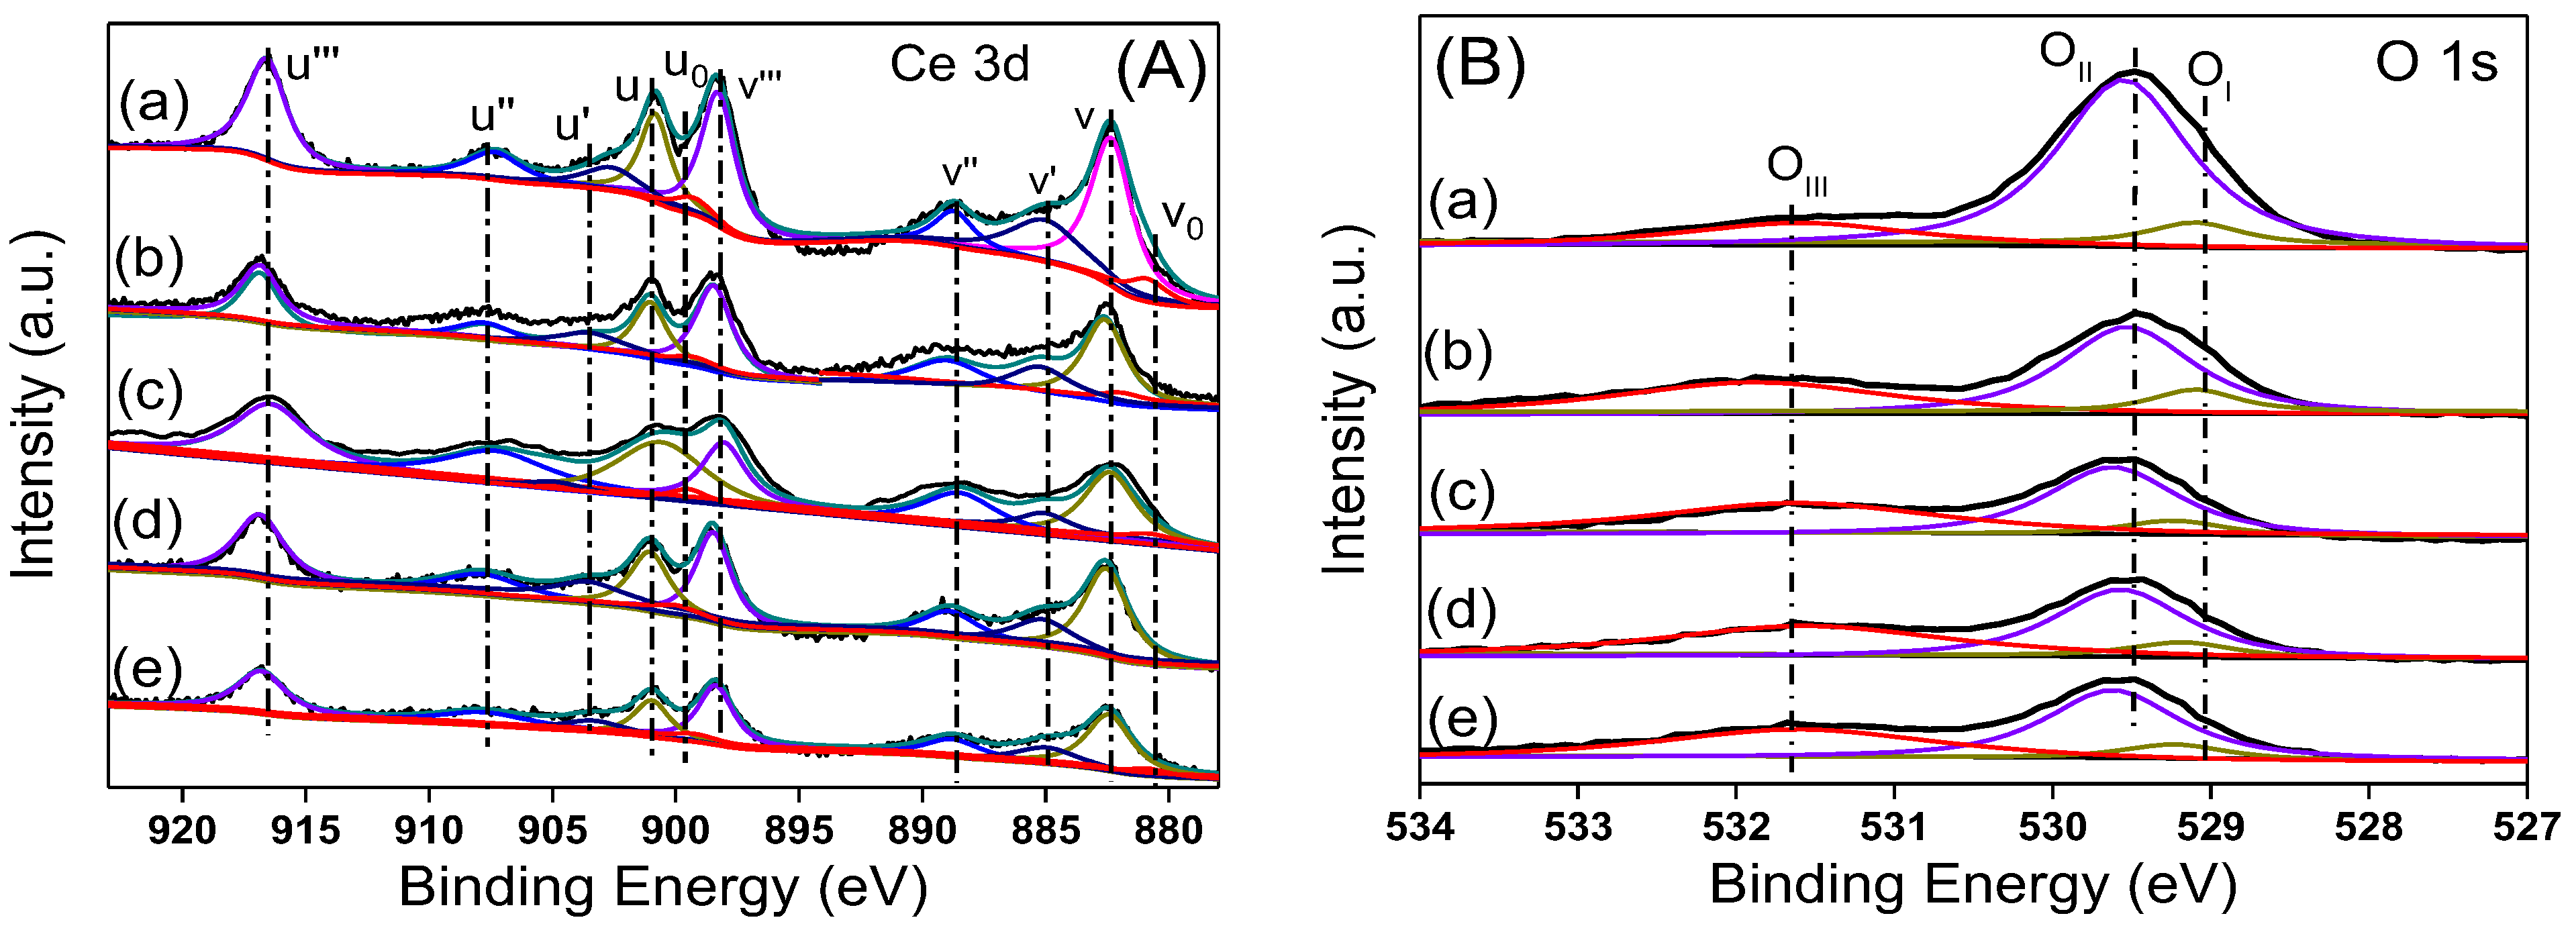
Figure 6A shows the Ce 3d XPS spectra of the catalyst. The peak of Ce is deconvolved into five groups of characteristic peaks according to the literature [
28,
29]. The three characteristic peaks labeled u and v, u’’ and v’’, and u’’’ and v’’’ belong to the XPS peaks of 3d
1/2 and 3d
5/2 of Ce
4+ 3d, while the two characteristic peaks of u’ and v’ and u
0 and v
0 belong to the 3d
1/2 and 3d
5/2 of Ce
3+ 3d. Compared with pure CeO
2, the XPS peak of Ce
4+ in the 5Ni/CeO
2 catalyst moved slightly towards the high-energy direction, indicating that the strong interaction between Ni and CeO
2 changed the electronic configuration of Ce on the surface. Similar phenomena were observed in Pt/CeO
2 and Cu/CeO
2 catalysts, and the peak shift of Ce
4+ should be caused by electron transfer from metal to CeO
2 [
30,
31]. According to the XPS peaks of Ce
3+ and Ce
4+, the concentration of Ce
3+ on the catalyst surface was estimated, and the results are listed in
Table 2. Per
Table 2, the amount of Ce
3+ on the surface of the 5Ni/CeO
2 catalyst was the highest among these samples. As the Ni loading amount increased, the amount of Ce
3+ on the surface gradually decreased and was even lower than that of pure CeO
2 after reduction for 17.5Ni/CeO
2 and 30Ni/CeO
2. This may have been caused by excessive Ni covering the Ce
3+ on the surface of the catalyst.
Figure 6B shows the O 1s XPS spectra of the reduced xNi/CeO
2 catalysts. After deconvolution, three groups of XPS peaks of O were observed, representing three types of O species. O
I and O
II represented O species with different coordination in the CeO
2 lattice, and O
III represented oxygen species adsorbed at defect sites on the catalyst surface. The O
I peak at 528.8 eV was the oxygen species coordinated with Ce
3+ in the CeO
2 lattice, while the O
II peak with slightly higher binding energy (529.4 eV) represented the oxygen species coordinated with Ce
4+ [
32]. The concentration of oxygen vacancies on the surface of the catalyst can be estimated by the ratio O
III/(O
I + O
II + O
III), and the results are listed in
Table 2. Per
Table 2, as the Ni content increased, the concentration of oxygen vacancies gradually decreased but was higher than that of the pure CeO
2, indicating that the introduction of Ni promotes the formation of oxygen vacancies on CeO
2 surface, which was consistent with the Raman results.
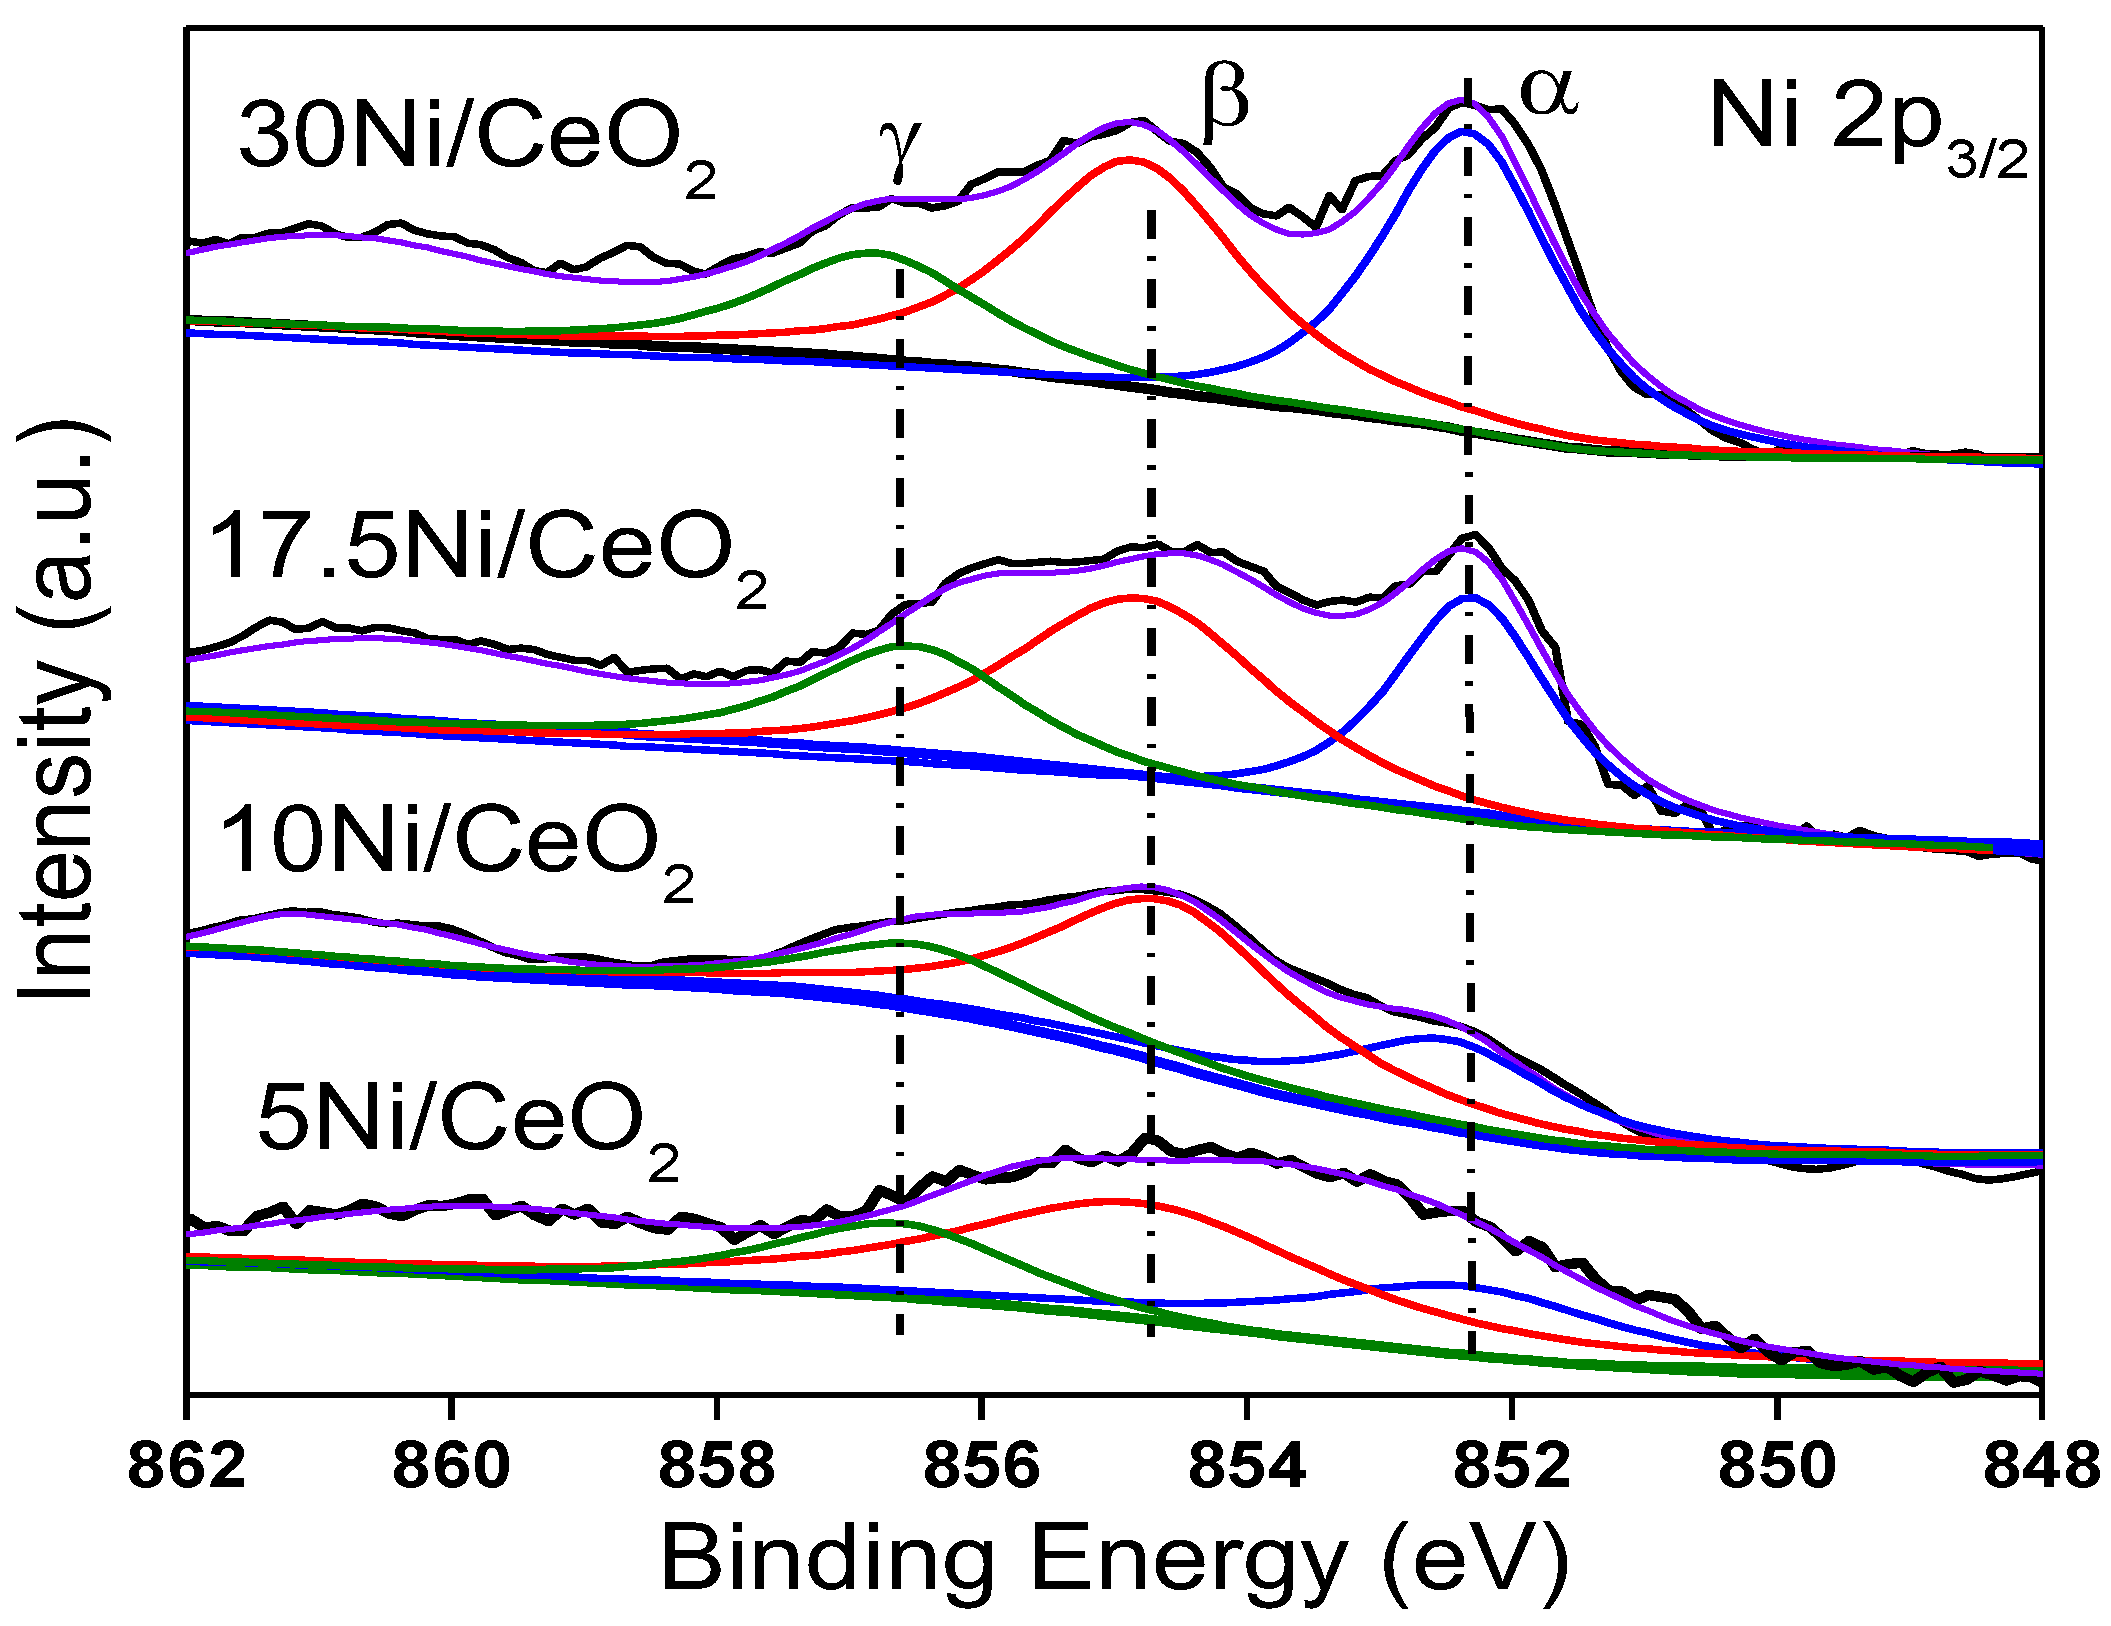
Figure 7 shows the XPS peaks of Ni 2
p3/2 for all catalysts. In addition to the satellite shake-up peak of Ni at about 861.0 eV, three fitting peaks represented three kinds of Ni species with different chemical states, namely α, β, and γ, which were assigned to Ni
0 (~852.4 eV), Ni
2+ (~854.7 eV), and Ni
3+ (~856.8 eV), respectively. Three kinds of Ni species coexisted on the surface of the Ni/CeO
2 catalysts. According to previous research [
30,
33,
34], highly dispersed Ni clusters can interact with CeO
2 support to generate the Ni–O–Ce structure, in which case the outer electrons of Ni would transfer to the 4f orbital of Ce through the Ni–O–Ce bond, which would result in the formation of Ni
2+ or Ni
δ+. Ni
3+ ions should come from Ni species that enter into the CeO
2 lattice and form a Ni
xCe
1−xO
2−y solid solution with CeO
2 [
35]. According to the peak area of different Ni species, the proportionate relationship among different Ni species was estimated, and the results are listed in
Table 2. From
Table 2, as Ni loading increased, the content of Ni
0 gradually increased, while the content of Ni
2+ gradually decreased. This was due to the fact that when the content of loaded Ni was low, the Ni particles with smaller size were highly dispersed on the surface of the catalyst and had stronger interaction with CeO
2 support, which made the outer electrons of Ni easily transfer to CeO
2, thus forming more Ni
2+. However, the increase in Ni loading led to the growth of the Ni particle size, which weakened the electron induction effect of CeO
2 on Ni and led to the decrease in Ni
2+ content. In addition, the relative content of Ni
3+ was relatively low for all xNi/CeO
2 catalysts, which means that only a small amount of Ni formed a Ni
xCe
1−xO
2−y solid solution with the CeO
2 support because of the limitation of the loading method (the impregnation method).
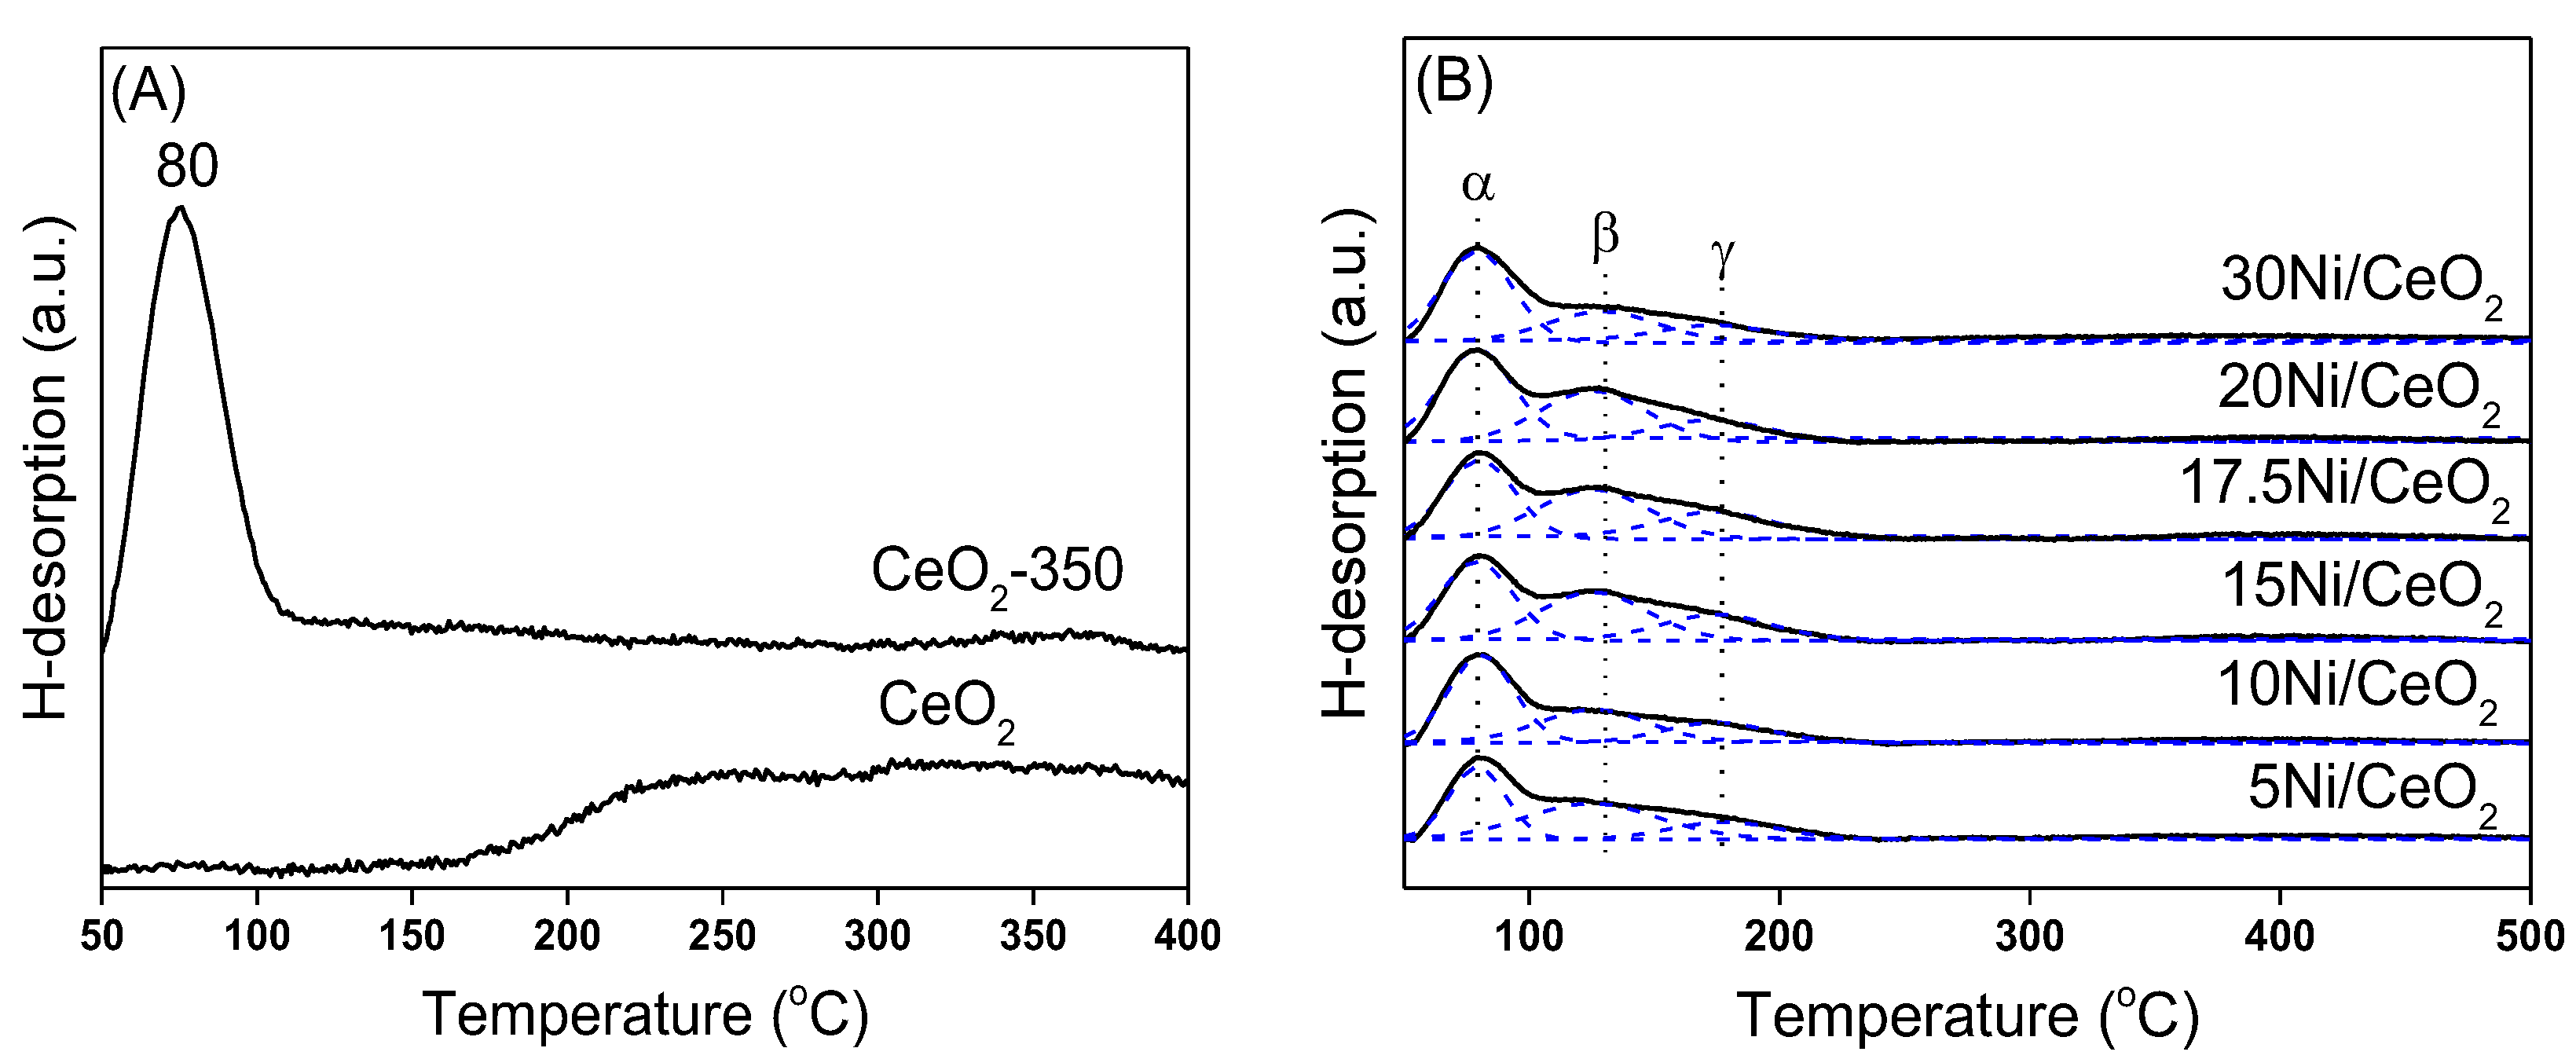
The H
2-TPD characterization results of the CeO
2 support and each catalyst are listed in
Figure 8. As shown in
Figure 8A, the CeO
2 support had the ability to activate and adsorb H
2 before and after reduction at 350 °C, and the oxygen vacancies had a great influence on the form of existence for the adsorption of H
2 [
36]. In order to further study the hydrogen species on CeO
2 surface, H
2-TPD combined with a mass spectrometer (MS) was used to detect the desorbed H
2 species.
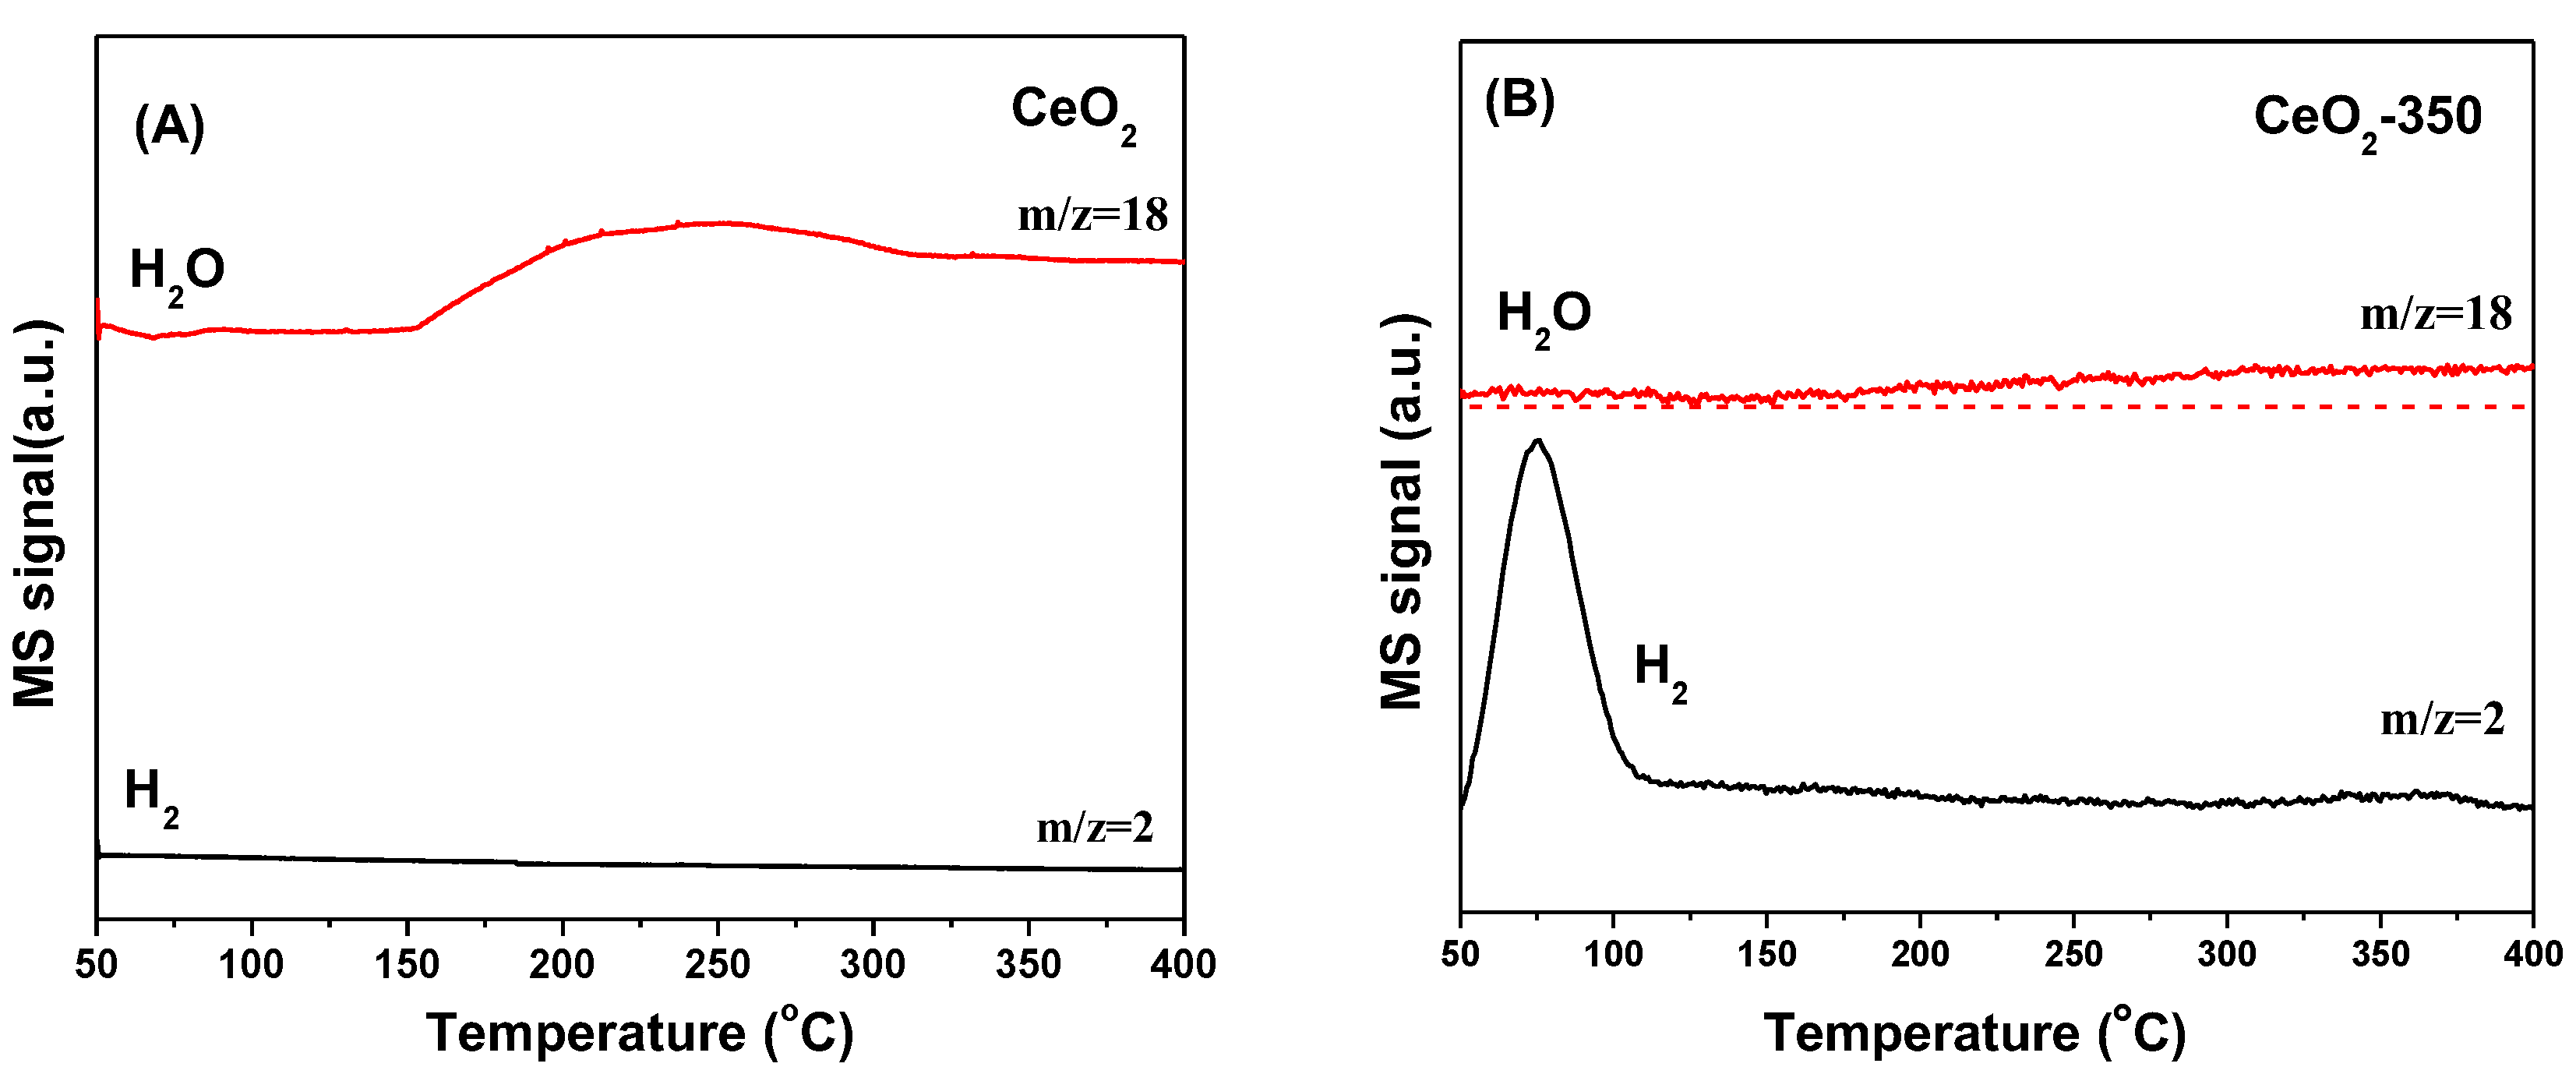
Figure 9A shows that H
2 was desorbed in the form of H
2O in the range of 150–400 °C on the surface of unreduced CeO
2 (labelled CeO
2), indicating that the adsorption of H
2 on the surface was irreversible, and OH groups were generated on the surface of the support. In contrast, as shown in
Figure 9B, on the surface of reduced CeO
2 (labelled CeO
2-350), the adsorbed atomic H was desorbed from the CeO
2 surface in the form of H
2 at about 80 °C, meaning that the oxygen vacancies on the surface of reduced CeO
2 were favorable for the reversible adsorption of H
2, which was consistent with literature reports [
37].
As shown in
Figure 8B, xNi/CeO
2 catalysts with different Ni loadings had similar H
2-TPD spectra. The desorption peak was fitted into three desorption peaks by the Gaussian method. The desorption peak (α peak) at about 80 °C was similar to the H
2 desorption peak of CeO
2 after reduction and was attributed to the desorption of H
2 from the support surface. The desorption peaks β and γ were attributed to the desorption of H
2 adsorbed on different Ni species. The β peak could be assigned to the H
2 desorption of Ni species at the Ni–CeO
2 interface. The strong interaction between Ni and CeO
2 support weakened the binding ability of Ni species to H
2 and then lowered the energy barrier of H
2 desorption. The desorption peak γ (at 178 °C) was assigned to the desorption of hydrogen species adsorbed on the surface of Ni in bulk phase, which was similar to the H
2 desorption on the Ni surface in Ni/Al
2O
3 and Ni/SiO
2 systems and indicated that the support had little influence on the H
2 adsorption capacity on Ni species here [
38]. It can be concluded that different Ni species on the xNi/CeO
2 surface had different adsorption and activation abilities for H
2.
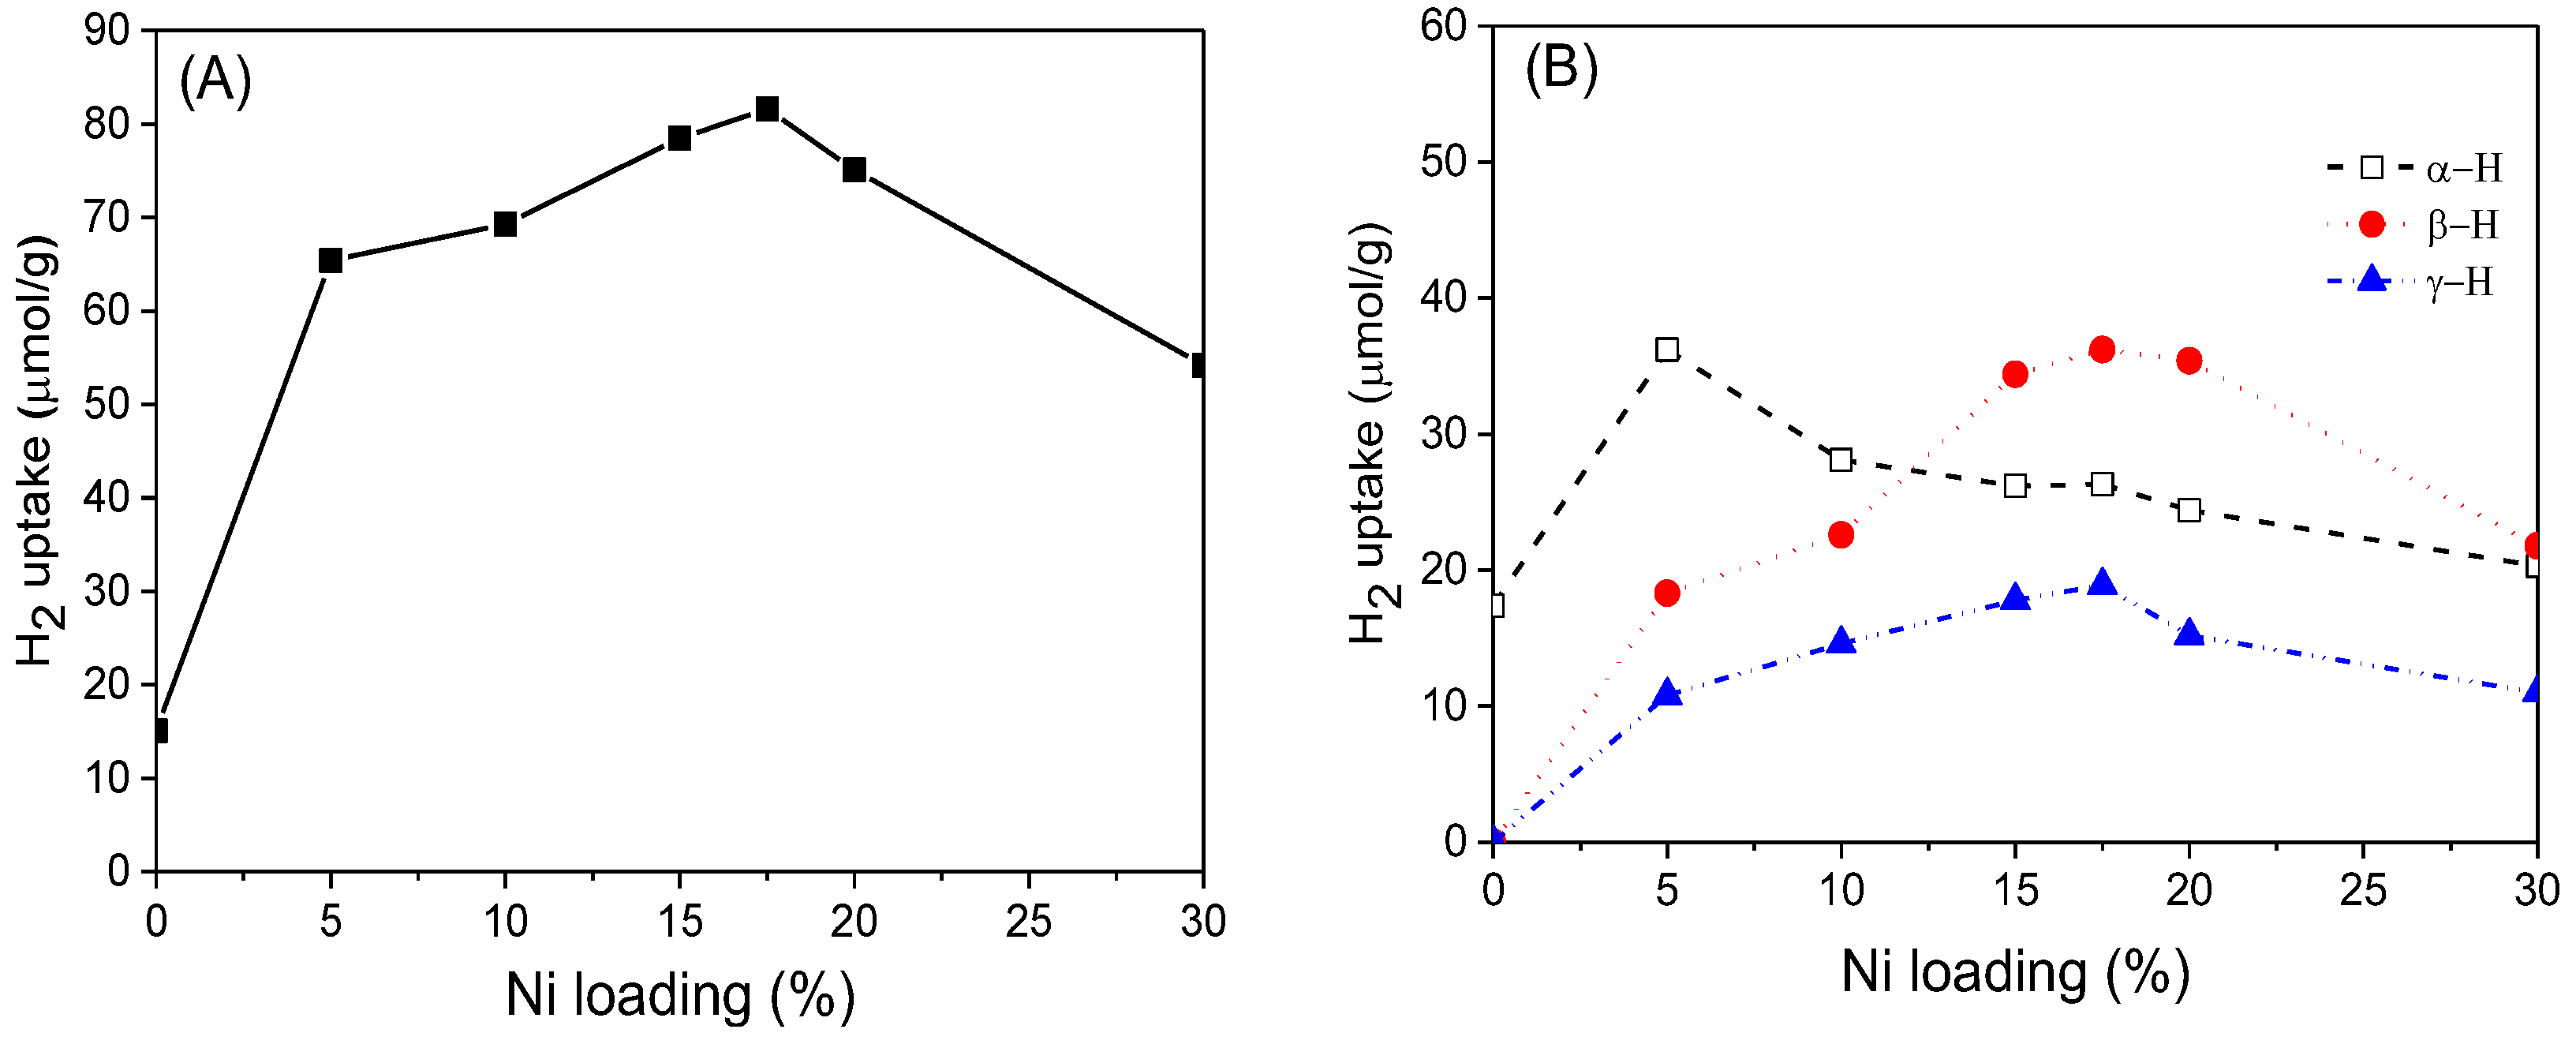
Based on H
2-TPD results, H
2 adsorption volumes at different active sites were estimated and correlated with Ni loading.
Figure 10A shows that compared with reduced CeO
2, the H
2 adsorption capacity of xNi/CeO
2 catalysts greatly increased, confirming that Ni was the center of adsorption and activation of H
2. For all xNi/CeO
2 catalysts, as the Ni loading increased, the amount of adsorbed H
2 on the catalyst first increased and then decreased gradually. A possible reason for this is that as the Ni loading increased, the Ni particles aggregated on the surface of CeO
2, and the grain size became larger, which may have reduced the number of active sites for H
2 adsorption.
Figure 10B shows that the peak area of α desorption for 5Ni/CeO
2 was the largest among the samples. The peak area of the other samples decreased as the Ni loading increased, which indicates that the 5Ni/CeO
2 catalyst possessed the highest concentration of oxygen vacancies for H
2 adsorption. According to Raman and XPS results, excessive Ni was not conducive to the formation of oxygen vacancies on the surface and inhibited the ability of oxygen vacancies to activate hydrogen [
39]. In addition, as the Ni loading increased, the peak areas of β and γ increased gradually in the beginning and then decreased obviously after 17.5Ni/CeO
2. The results showed that a proper amount of Ni loading was helpful to increase the number of active sites on the support surface, while an excessive amount of Ni loading may have led to the aggregation and growth of Ni species, which could reduce the surface area of Ni particles and the number of active sites on the surface.
3.2. Catalytic Performance
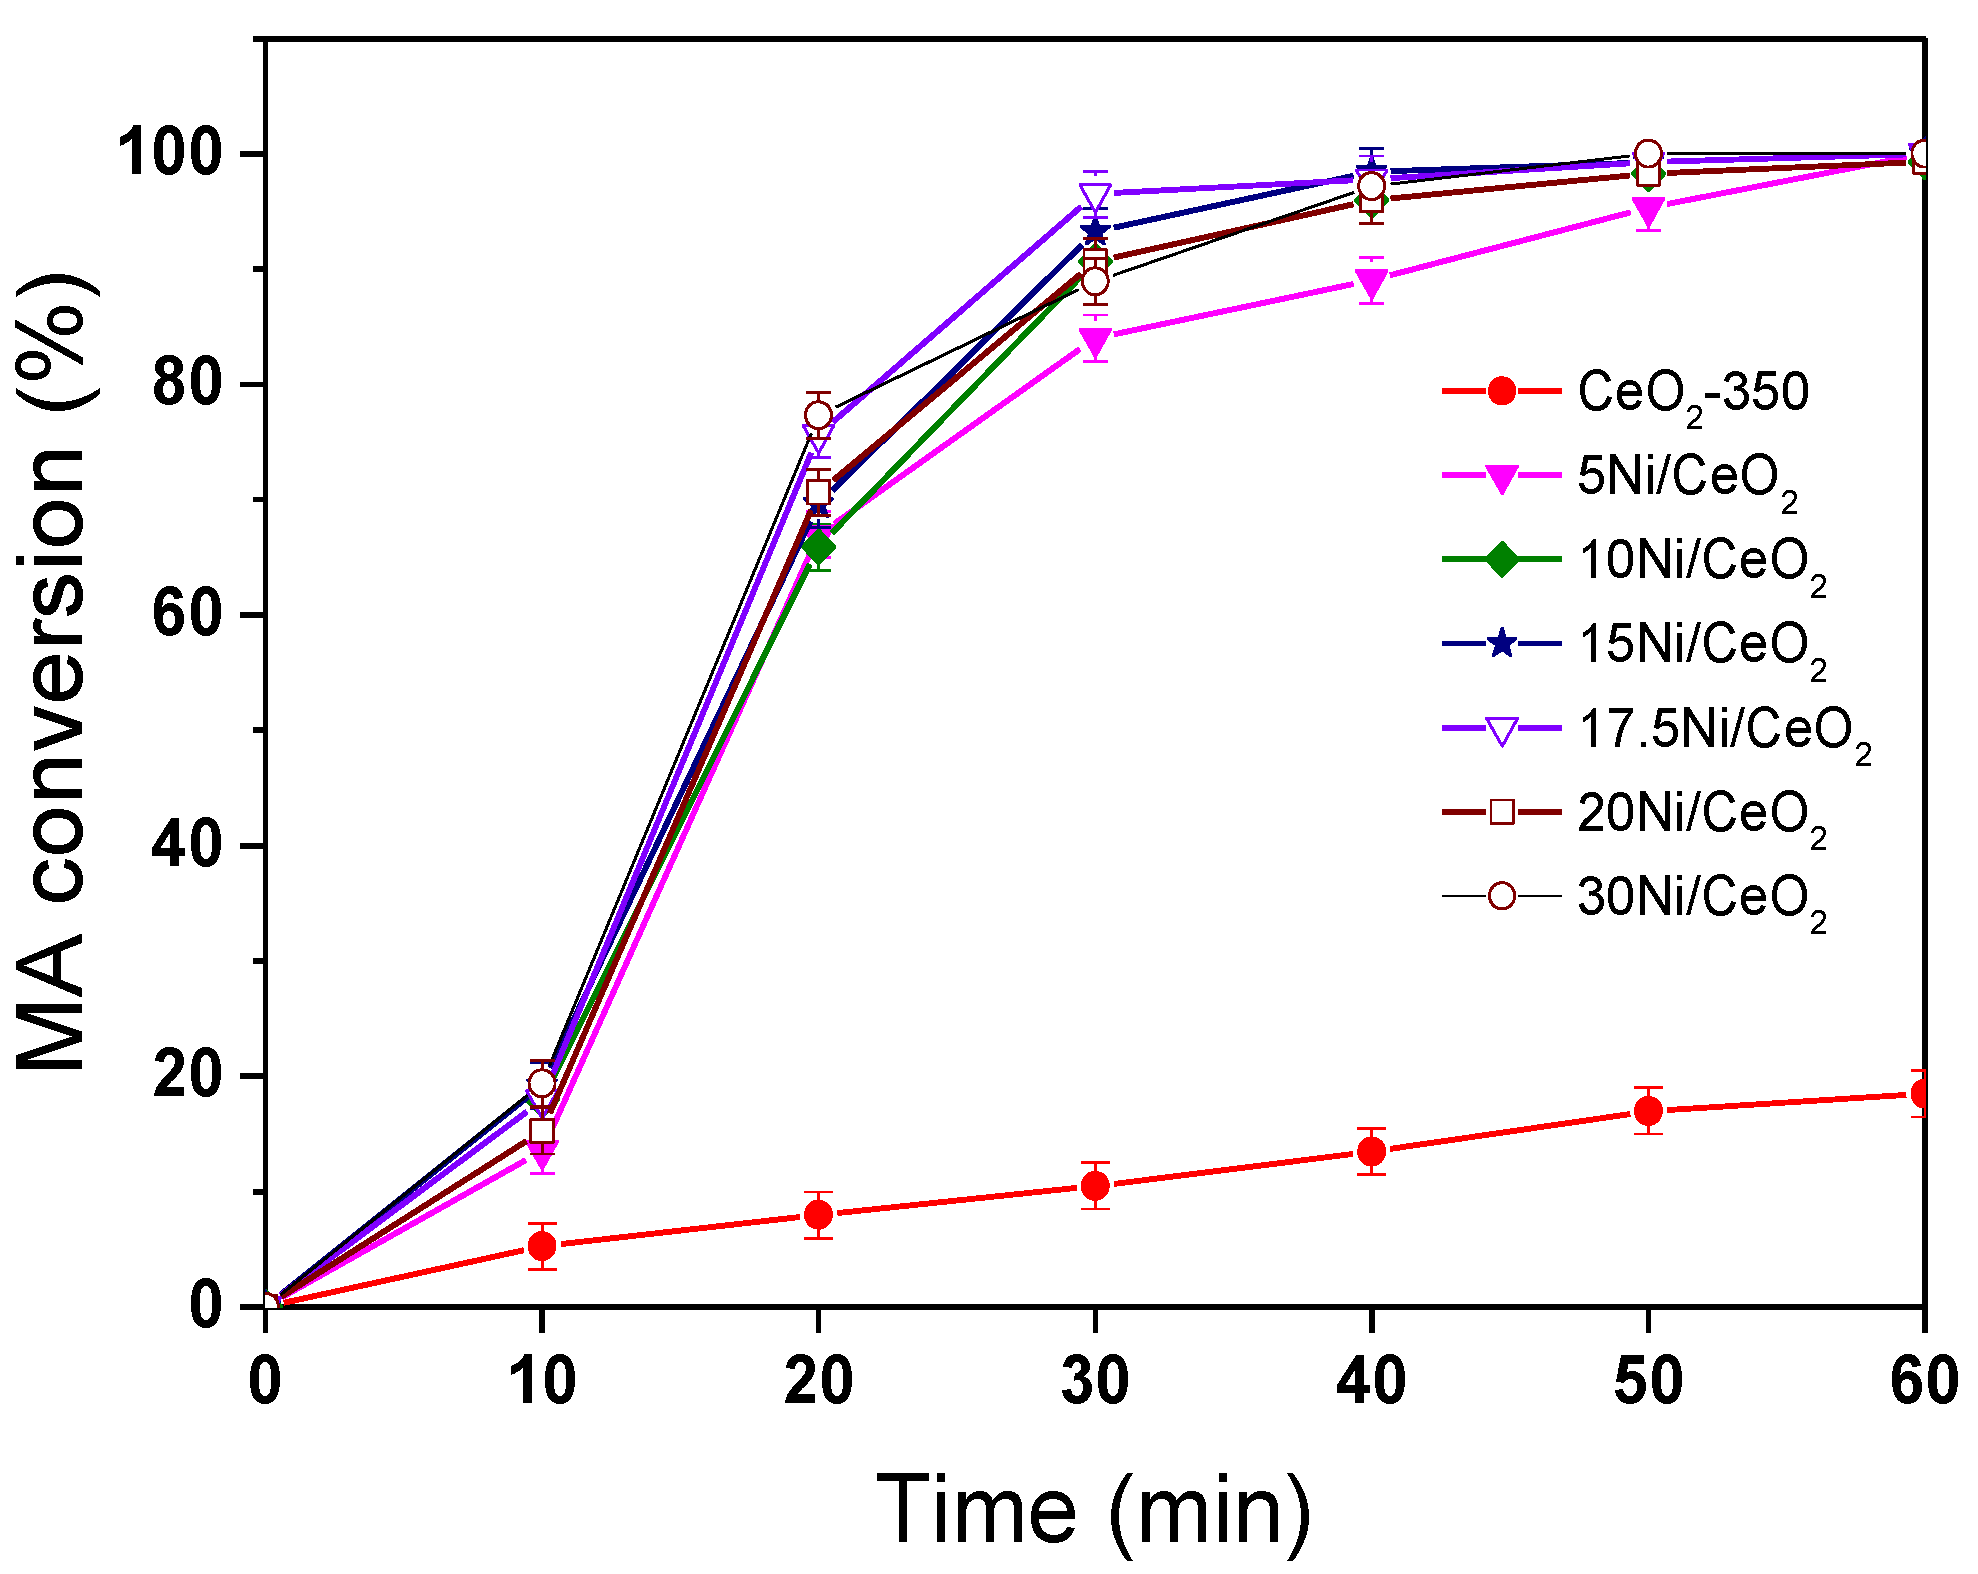
Figure 11 shows the conversion curves of maleic anhydride (MA) over xNi/CeO
2 catalysts and reduced CeO
2 support at 210 °C and 5 MPa. After a reaction time of 1 h, the conversion of MA for all xNi/CeO
2 catalysts was close to 100%, and the main product was succinic anhydride (SA), indicating that all xNi/CeO
2 catalysts showed high hydrogenation activity for the C=C bond. It is noteworthy that the reduced CeO
2 carrier also had a certain ability of MAH and that the conversion of MA was about 30% after 1 h under the same conditions. When Ni species were loaded on the surface of CeO
2, the activity of MA hydrogenation increased sharply, indicating that Ni was the main active site for the MAH reaction. For all xNi/CeO
2 catalysts, in the initial time, the catalytic activity for MAH increased gradually as Ni content increased until 17.5 wt%, and then the conversion of MA decreased slightly until 1 h.
In order to further investigate the C=C hydrogenation performance of xNi/CeO
2 catalysts, the turnover frequency values for MA to SA (TOF
MA→SA) over the active Ni were calculated and correlated with the oxygen vacancies, Ni species, and Ni loading content. As shown in
Figure 12, the TOF
MA→SA of the xNi/CeO
2 catalysts decreased as the Ni content increased, which was consistent with the change trend of oxygen vacancies on the surface, indicating that the oxygen vacancies of the catalyst also played an important role in the C=C hydrogenation of MA. According to H
2-TPR and H
2-TPD results, oxygen vacancies not only improved the dissociation and adsorption capacity of H
2 on the catalyst but promoted the diffusion of active H on the catalyst surface, providing more active H species for the hydrogenation reaction [
37]. Moreover, according to theoretical calculations, oxygen vacancies with rich electron structure can provide electrons to the active metal and enhance the electron-giving ability of the active metal, thus improving the C=C hydrogenation performance of the metal [
40]. For the xNi/CeO
2 catalytic system, it can be speculated that the synergistic effect between active metal Ni and oxygen vacancies (Ovac) could have improved the C=C hydrogenation performance of Ni.
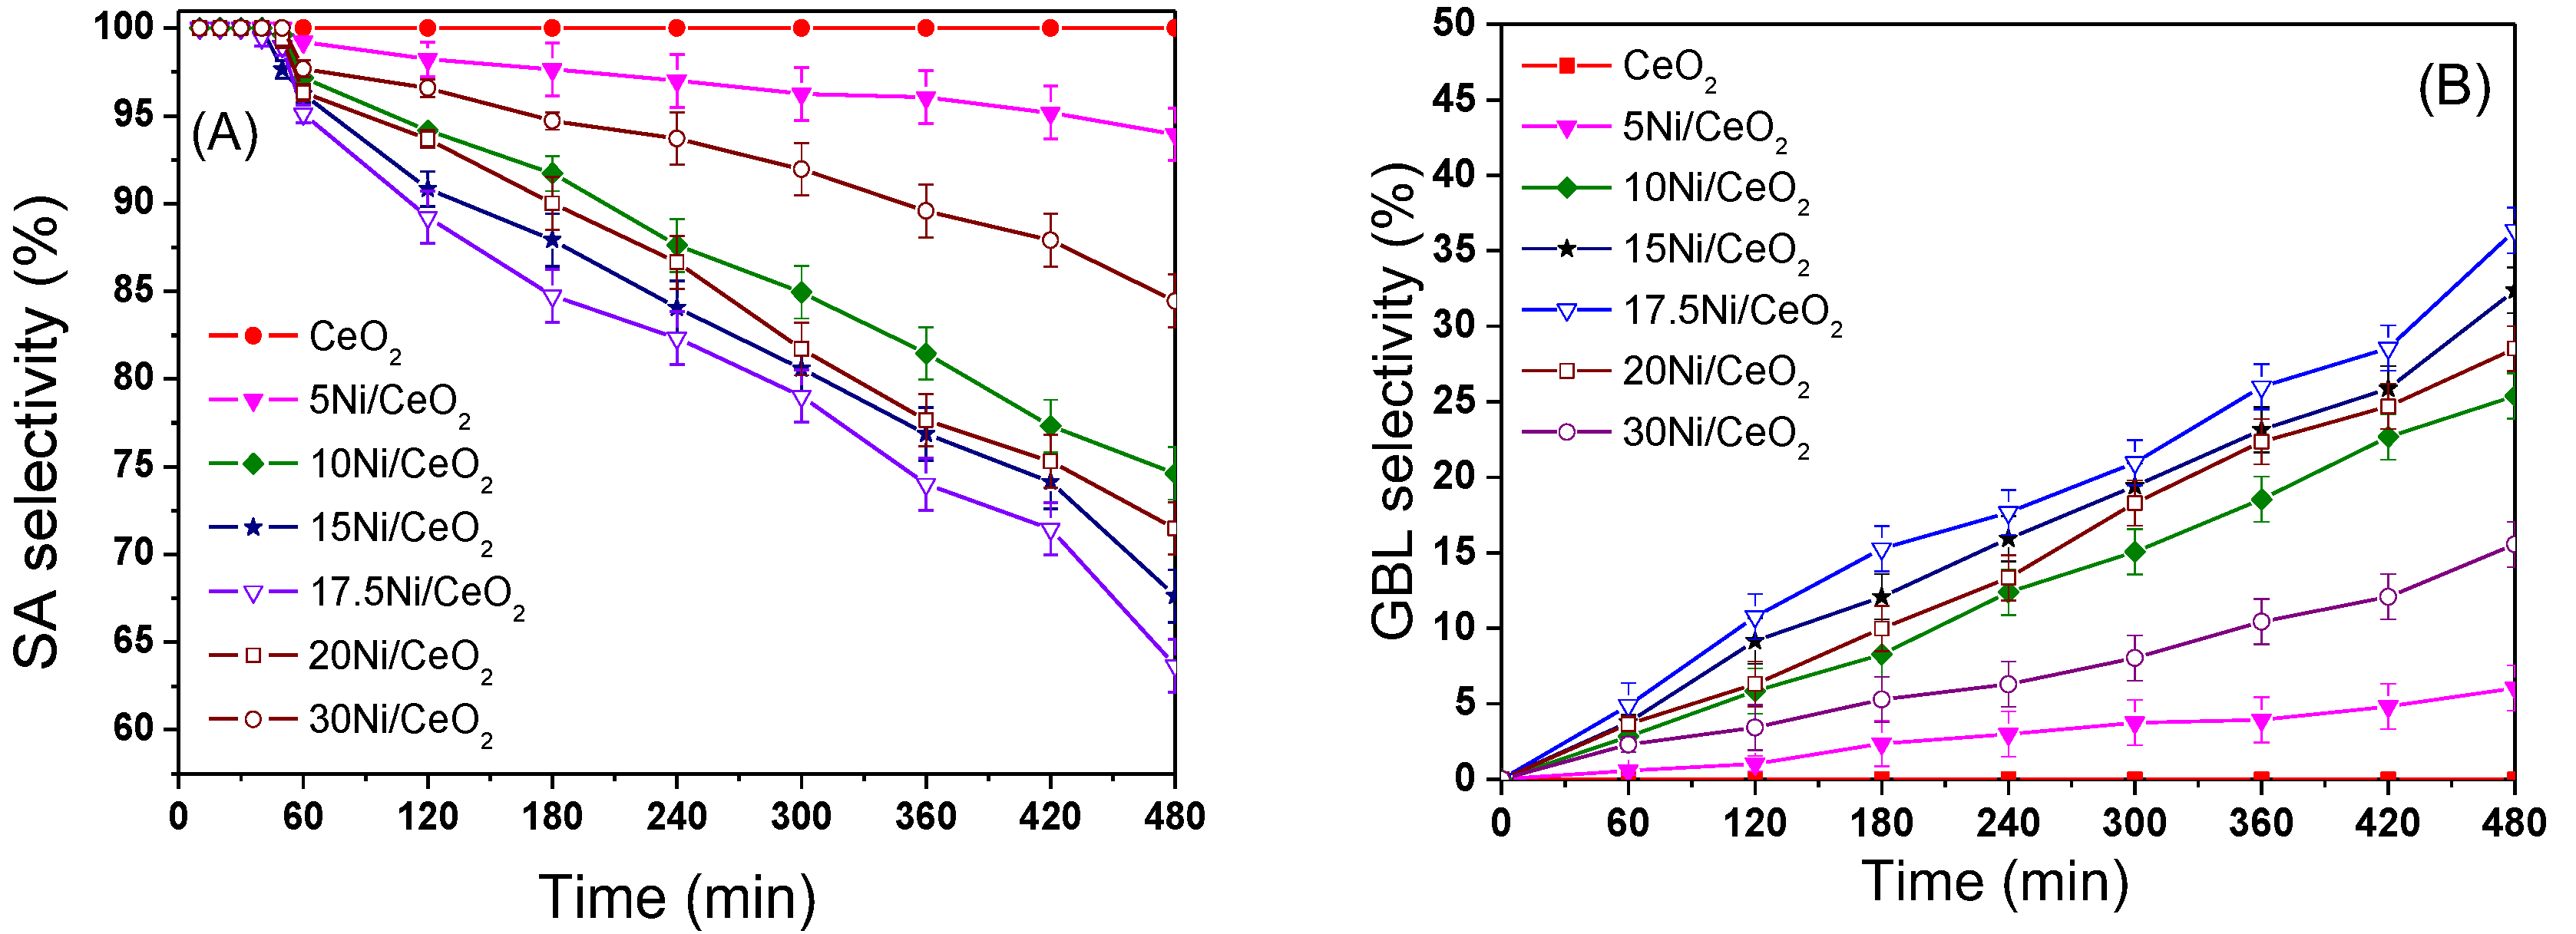
Figure 13A shows the trend of SA selectivity with reaction time on different catalysts. From
Figure 13A and B, the selectivity of SA for all xNi/CeO
2 catalysts was around 100% at the initial reaction time of 40 min and then decreased gradually while the selectivity of γ-butyrolactone (GBL) increased gradually. The selectivity of GBL on the 17.5Ni/CeO
2 catalyst was the highest (about 35.7%) after 8 h compared with the other xNi/CeO
2 catalysts. In addition, the selectivity of SA on the CeO
2 support remained at 100% within 8 h of the reaction, indicating that the CeO
2 support had almost no hydrogenation activity for the C=O bond. The above results identify that the metal Ni was the active center for the hydrogenation of SA to GBL and that the content of Ni loading significantly affected the C=O hydrogenation over the catalyst. As for the stability of the xNi/CeO
2 catalysts, it should be noted that all samples showed good stability in the hydrogenation process. After a reaction time of 1 h, the conversion of MA for all xNi/CeO
2 catalysts was close to 100%, and the catalysts kept their high catalytic performance. Furthermore, after five cycles of use, all the catalysts kept their high activity and selectivity, and there was no obvious decrease in either. In addition, the stability of the 17.5Ni/CeO
2 catalyst had no obvious change compared with other catalysts in the MAH process.
It has been reported that the metal Ni with certain grain size is the active center of hydrogenation of SA to GBL. Meyer et al. [
17] studied the effect of Ni loading on the hydrogenation of MA and found that Ni/SiO
2–Al
2O
3 catalyst had hydrogenation activity for C=O only when Ni loading was more than 8 wt%. They concluded that a certain size of Ni grain was the active center for the hydrogenation of SA to GBL. In this work, the selectivity of GBL also showed a strong dependence on the particle size of Ni. However, when the particle size of Ni exceeded a certain amount (17.5 nm), the hydrogenation activity of C=O started to decrease. For example, though the average sizes of Ni particles on the 20Ni/CeO
2 (18.9 nm) and 30Ni/CeO
2 catalysts (36.6 nm) were larger than that of the 17.5Ni/CeO
2 catalyst (17.5 nm), the selectivities of GBL were lower than that of 17.5Ni/CeO
2 (as shown in
Figure 13B).
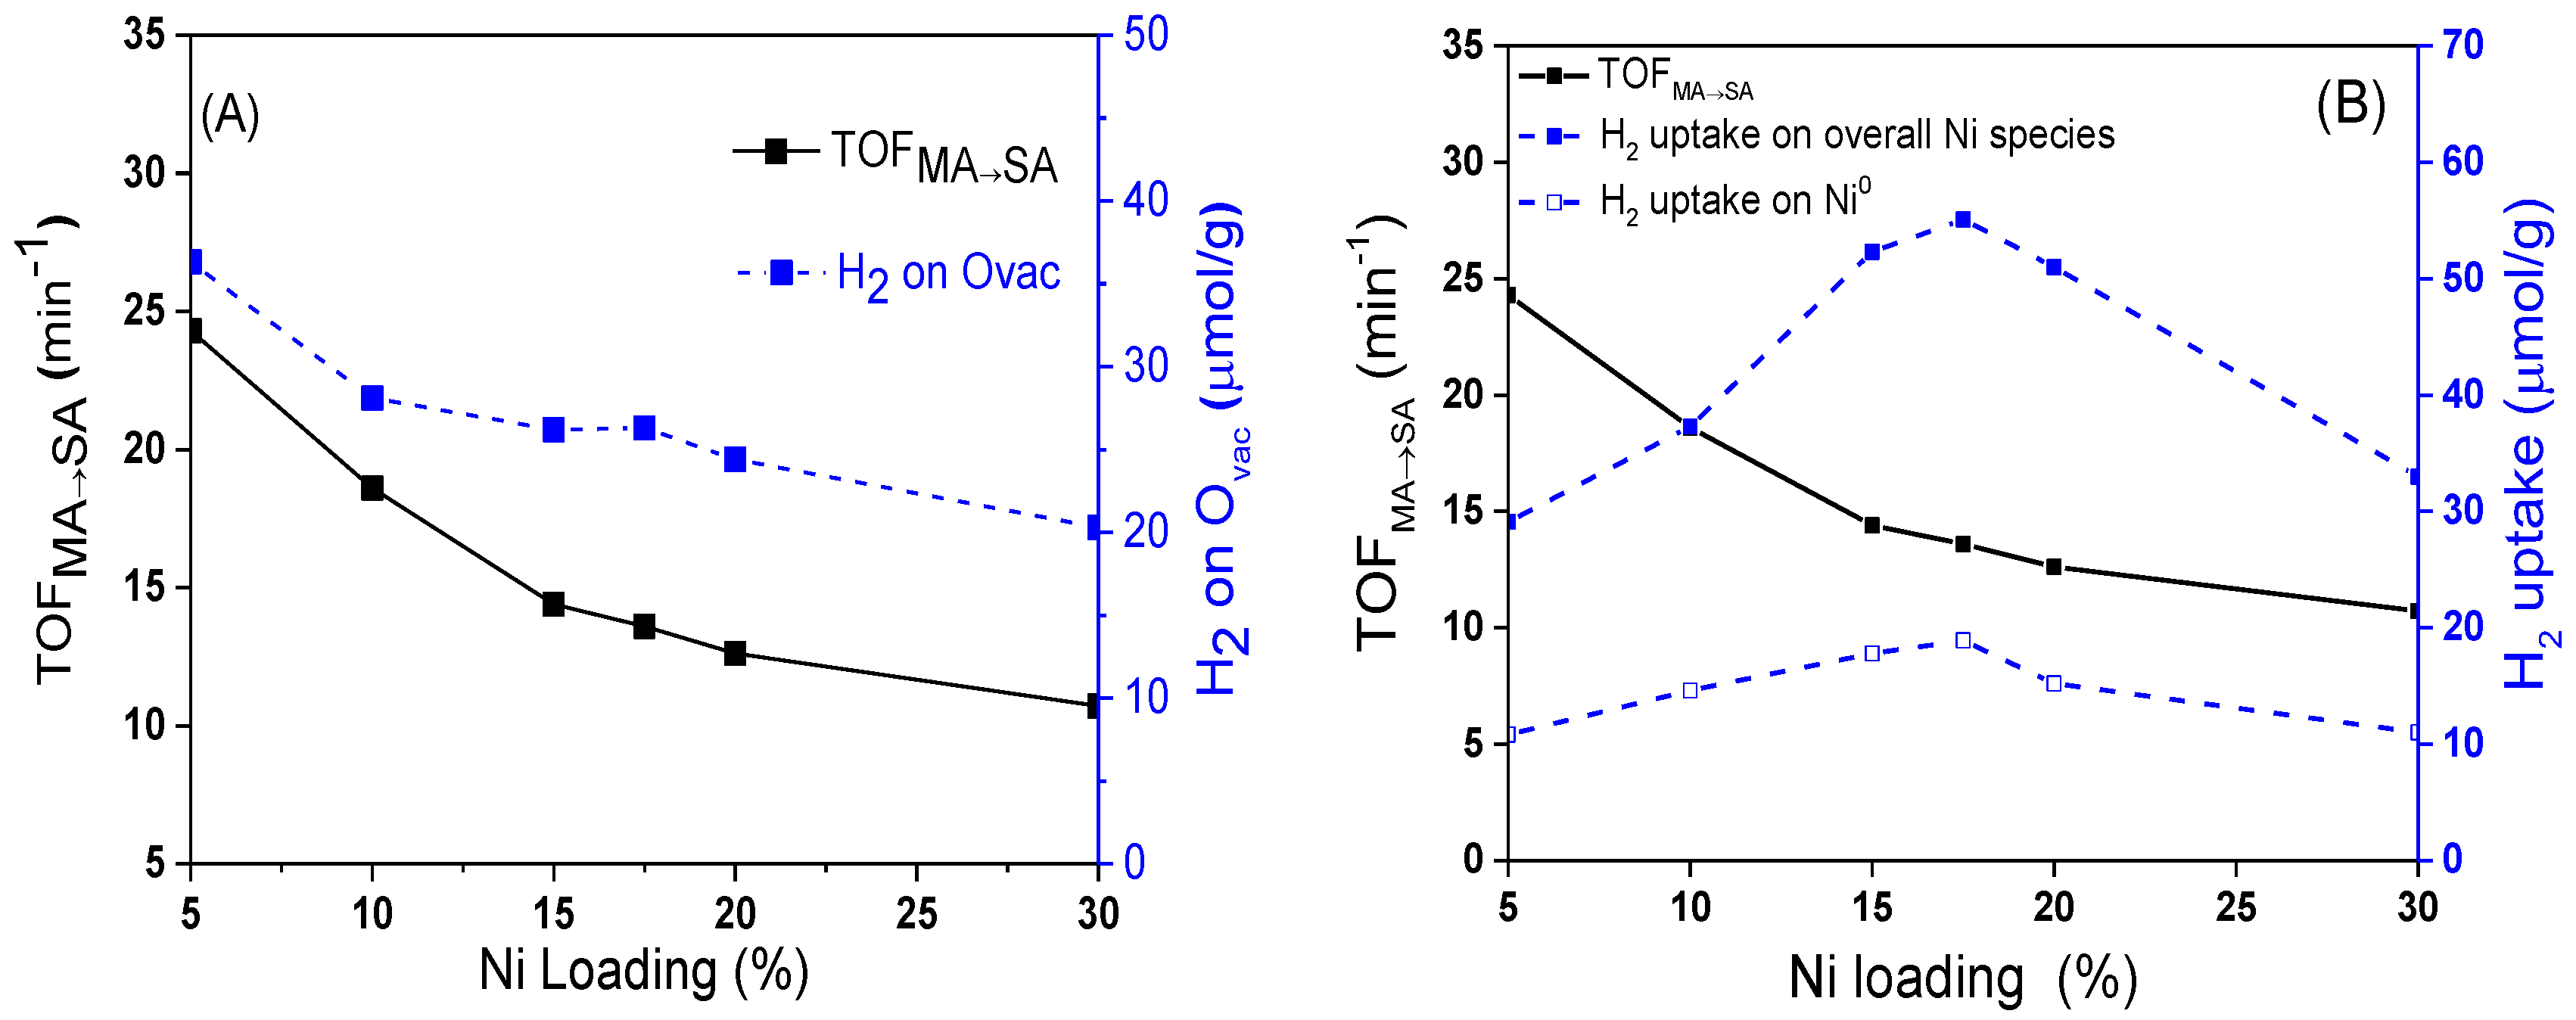
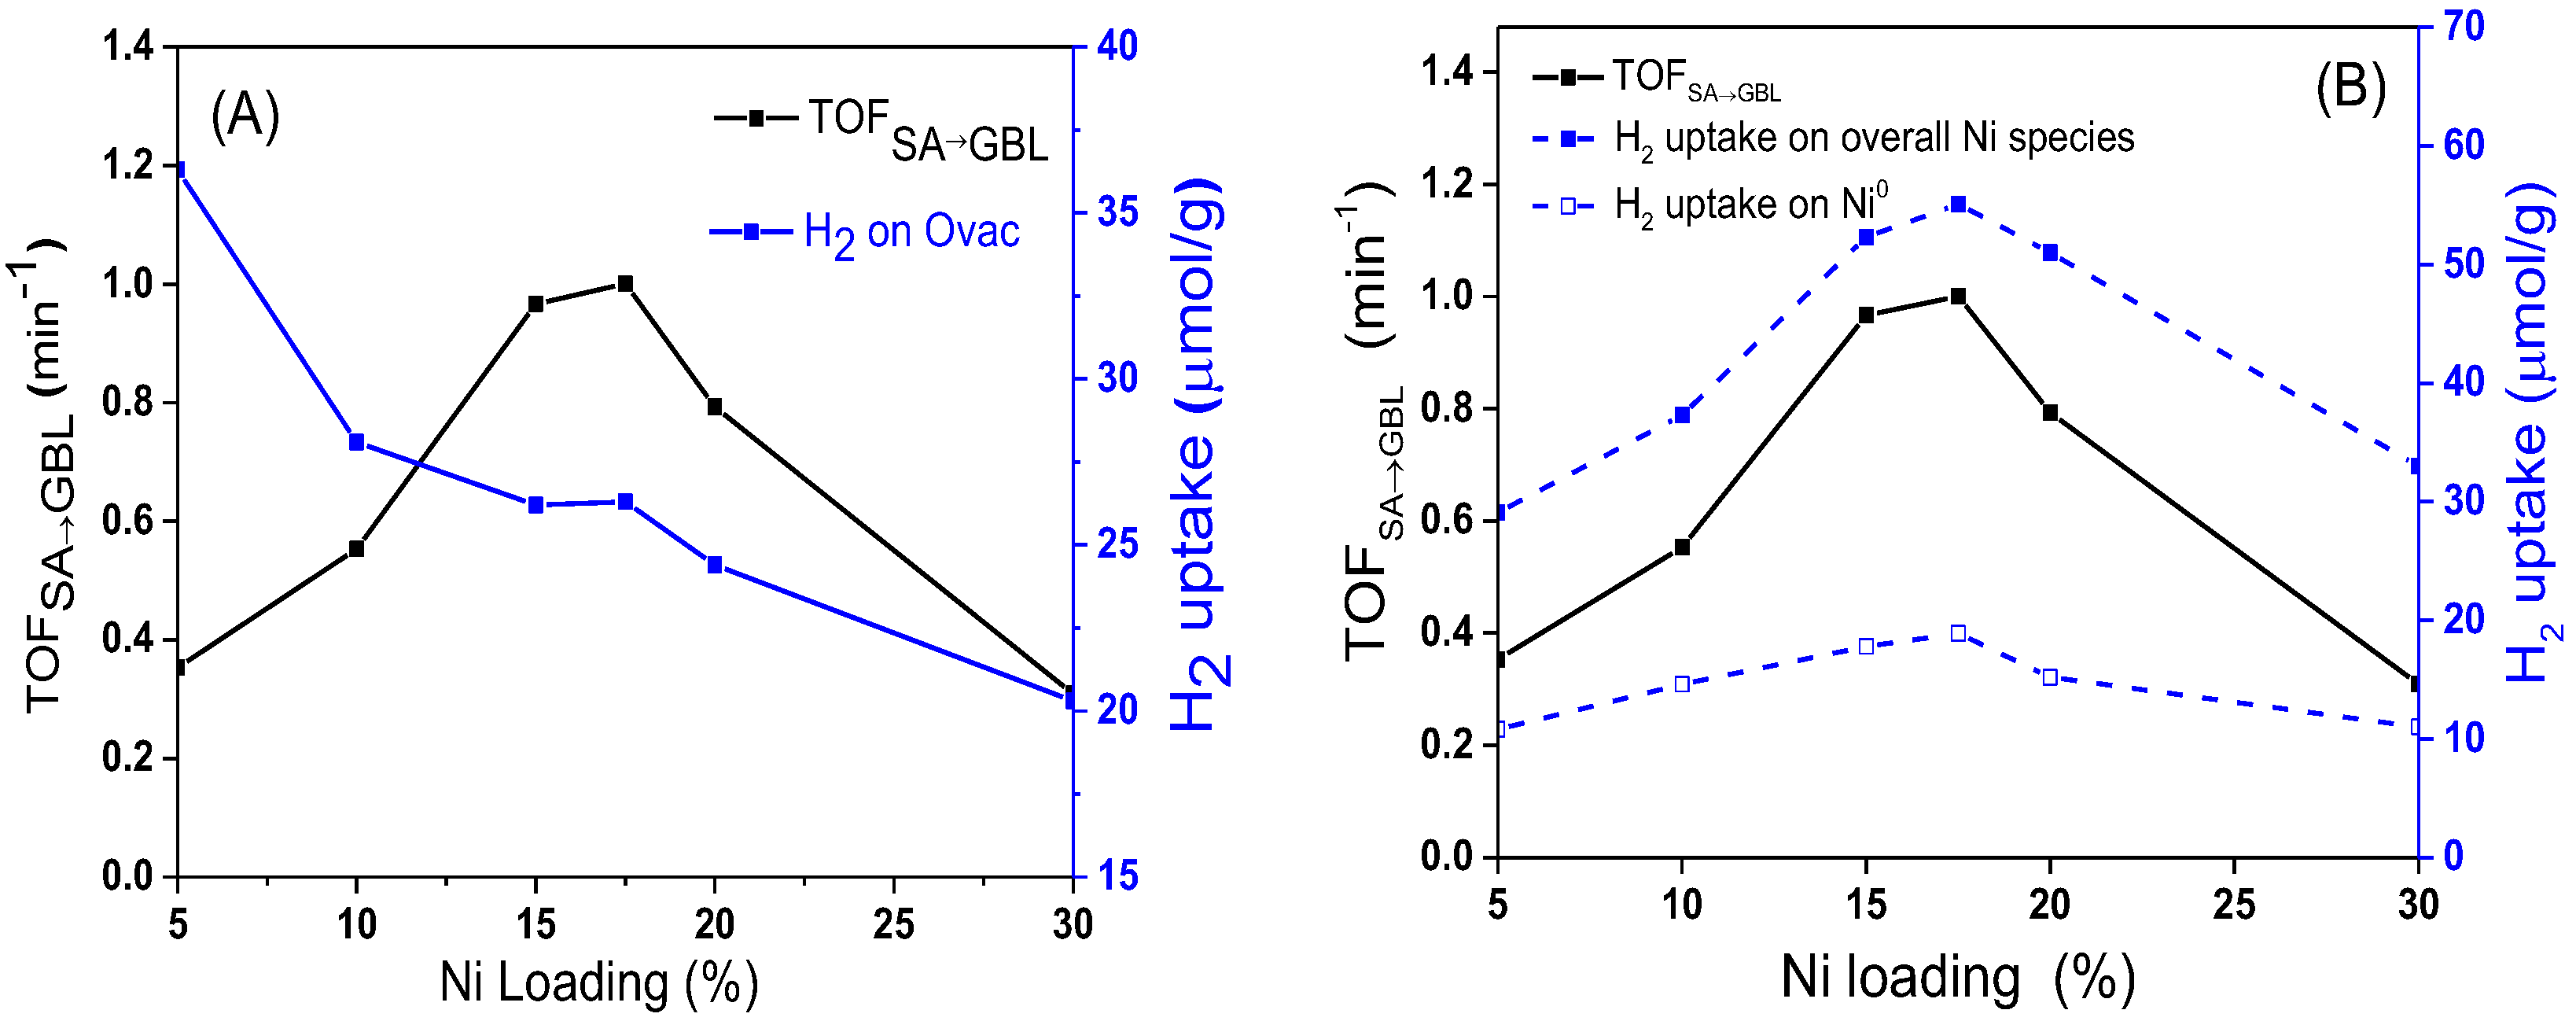
In order to understand deeply the influence of catalysts on the hydrogenation activity of C=O, the values of TOF
SA→GBL over different catalysts were calculated. As shown in
Figure 14, as the Ni loading increased, the value of TOF
SA→GBL gradually increased. When the content of Ni was 17.5 wt%, the value of TOF
SA→GBL reached the maximum. It then rapidly decreased as the Ni loading increased further. At the same time, the H
2 concentration adsorbed on Ovac decreased monotonously as the Ni loading increased. The volcanic curve for TOF
SA→GBL showed that the hydrogenation of SA to GBL was structure sensitive, which is quite different from the trend of TOF
MA→SA in
Figure 12A.
According to previous research [
41,
42,
43], for reducible supports, such as TiO
2 and CeO
2, the metal–support interface is considered to be the active site of C=O adsorption activation. It was found that the C=O functional groups could be adsorbed and polarized at the interfaces of Pt–TiOx and Ni–TiOx and that the catalytic activity of hydrogenation for crotonaldehyde to crotonyl alcohol was significantly improved [
41]. Because of strong interaction with the carrier, the electronic configuration for most of the metal particles at the interface was in an ionic state (such as Ni
2+ at the interface of Ni–TiO
2). These ionic metal particles could play the role of a Lewis acid and participate in the adsorption and activation of C=O functional groups [
42]. In addition, in the hydrogenation reaction of citral, a small amount of Ni
2+ at the Ni–TiO
2 interface promoted the adsorption and activation of C=O in the citral molecule and finally improved the selectivity of the hydrogenation of citral to citric alcohol [
41,
43].
As shown in
Figure 14B, the change trend of TOF
SA→GBL was consistent with the change in the total amount of H
2 adsorbed on the active sites of interface Ni and bulk Ni, which indicates that both the interfacial Ni and bulk Ni
0 could catalyze the hydrogenation reaction of the C=O bond. According to the characterization results of H
2-TPR, H
2-TPD, and XPS, the Ni species at the interface showed a valence state of Ni
δ+ because of the strong interaction with the CeO
2 support [
34]. Therefore, it can be inferred that Ni
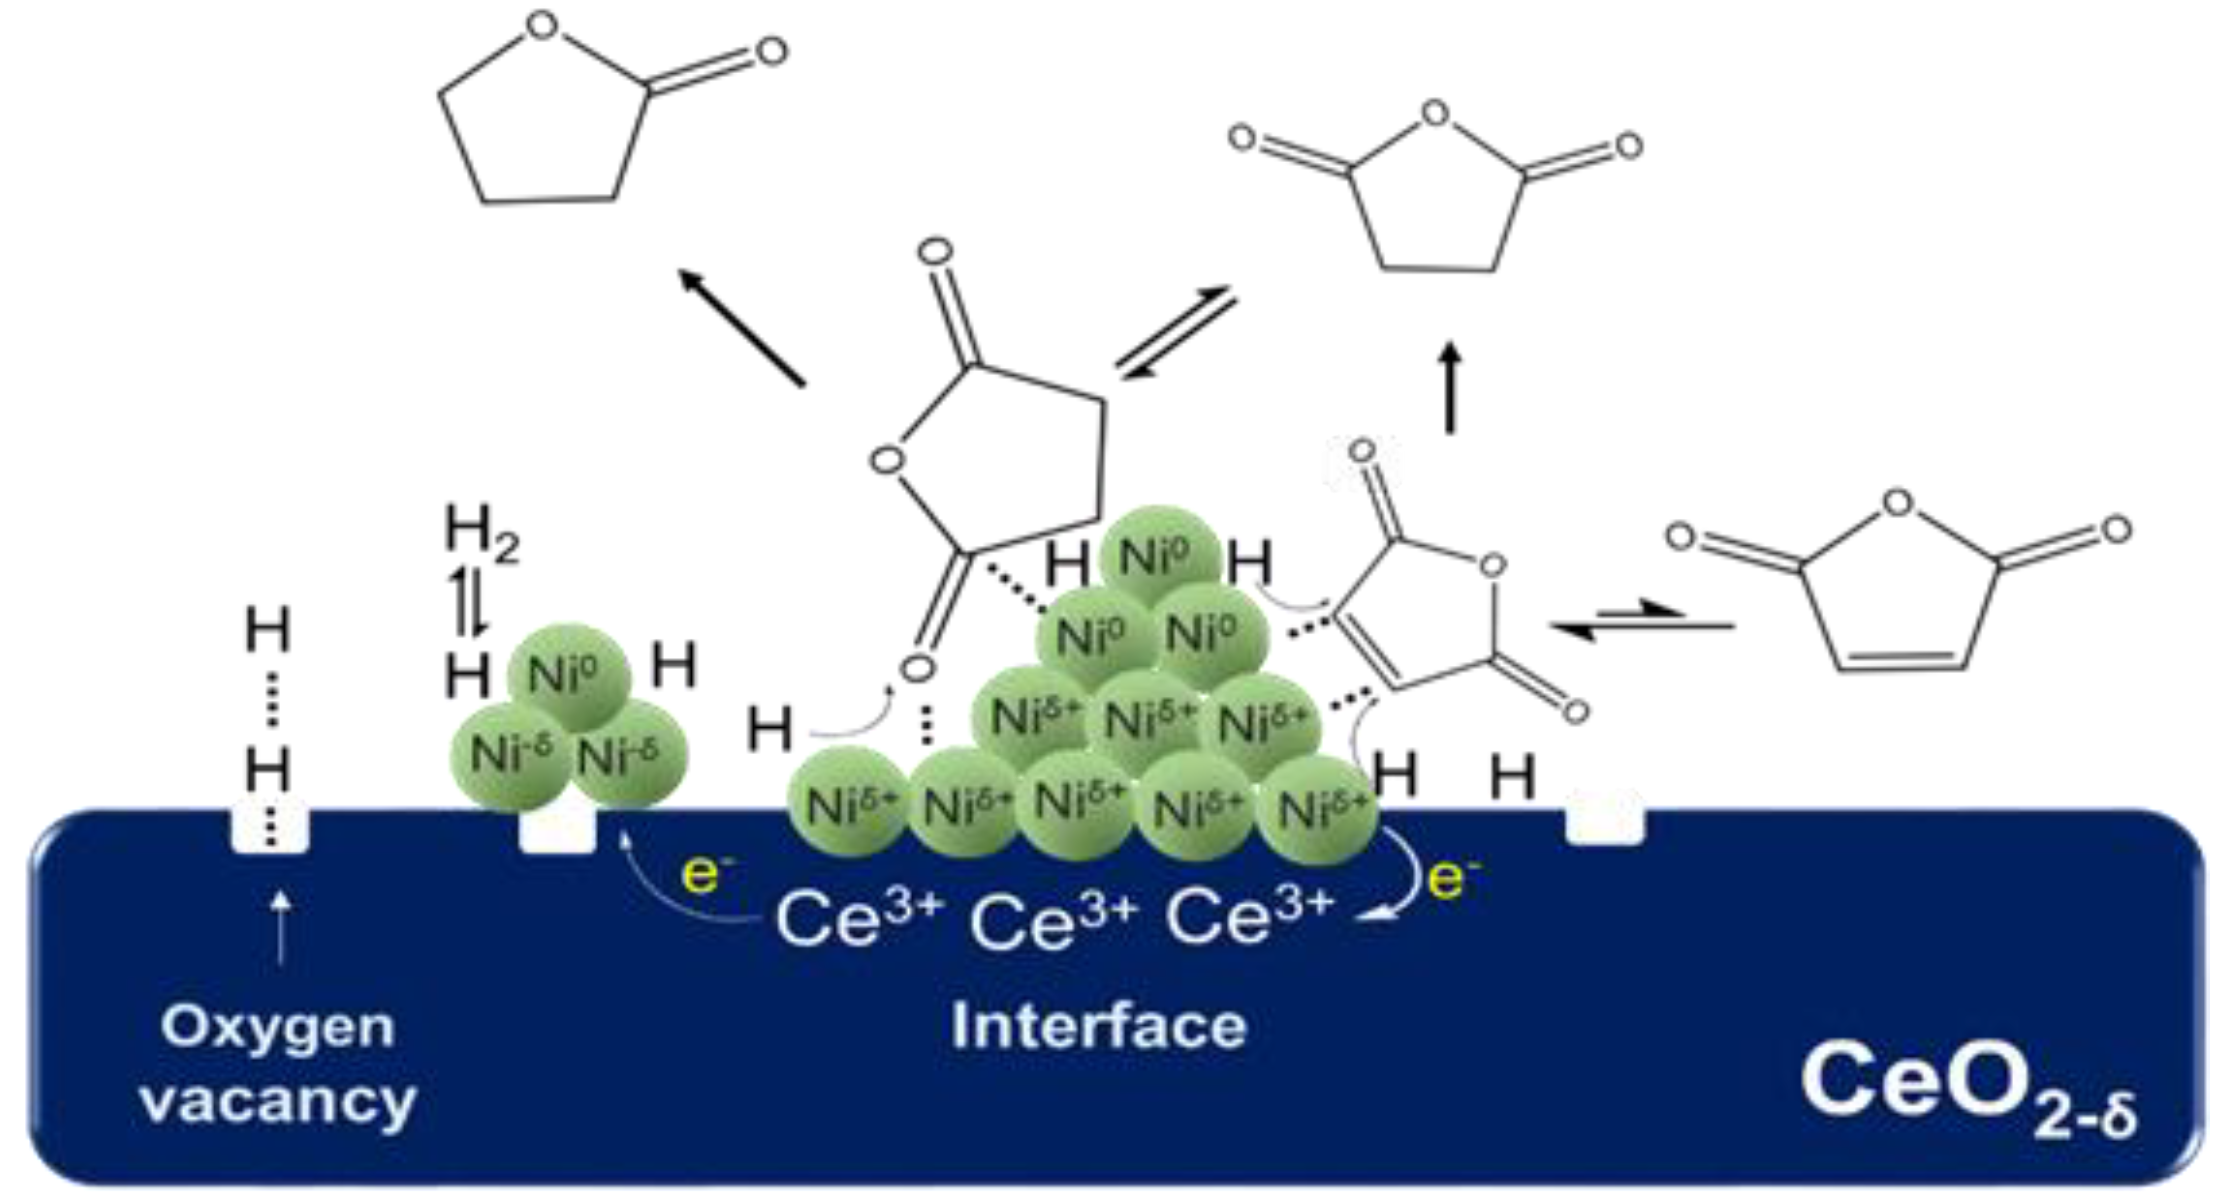
δ+ at the interface could also promote the adsorption of C=O on the catalyst surface as the Lewis acid site. Based on the catalytic effect of metal Ni on the adsorption and activation of C atoms in C=O and subsequent C–O bond breaking [
33], we propose the possible mechanism of the Ni
δ+–Ni
0 synergistic effect on the hydrogenation reaction of C=O. As shown in
Figure 15, first, the metal Ni
0 adsorbs and activates C atoms in the C=O functional group, and Ni
δ+ at the interface acts as a Lewis acid to synergistically activate O atoms. Second, the synergistic effect of Ni
δ+ and Ni
0 promotes the adsorption and activation of C=O, and the activated C=O group reacts with highly active hydrogen atoms on the surface of metal Ni, which results in the C=O bond hydrogenation and subsequent C–O fracture. According to this mechanism, if the particle size of Ni becomes larger, the distance between the top Ni
0 and the bottom Ni
δ+ increases, which weakens the synergistic activation for C=O by Ni
δ+–Ni
0. This constitutes a good explanation for the phenomenon in which the selectivity of GBL decreased as the average particle size of Ni increased beyond 17.5 nm.


