
Evaluation of a Model Photo-Caged Dehydropeptide as a Stimuli-Responsive Supramolecular Hydrogel

 , , , , and
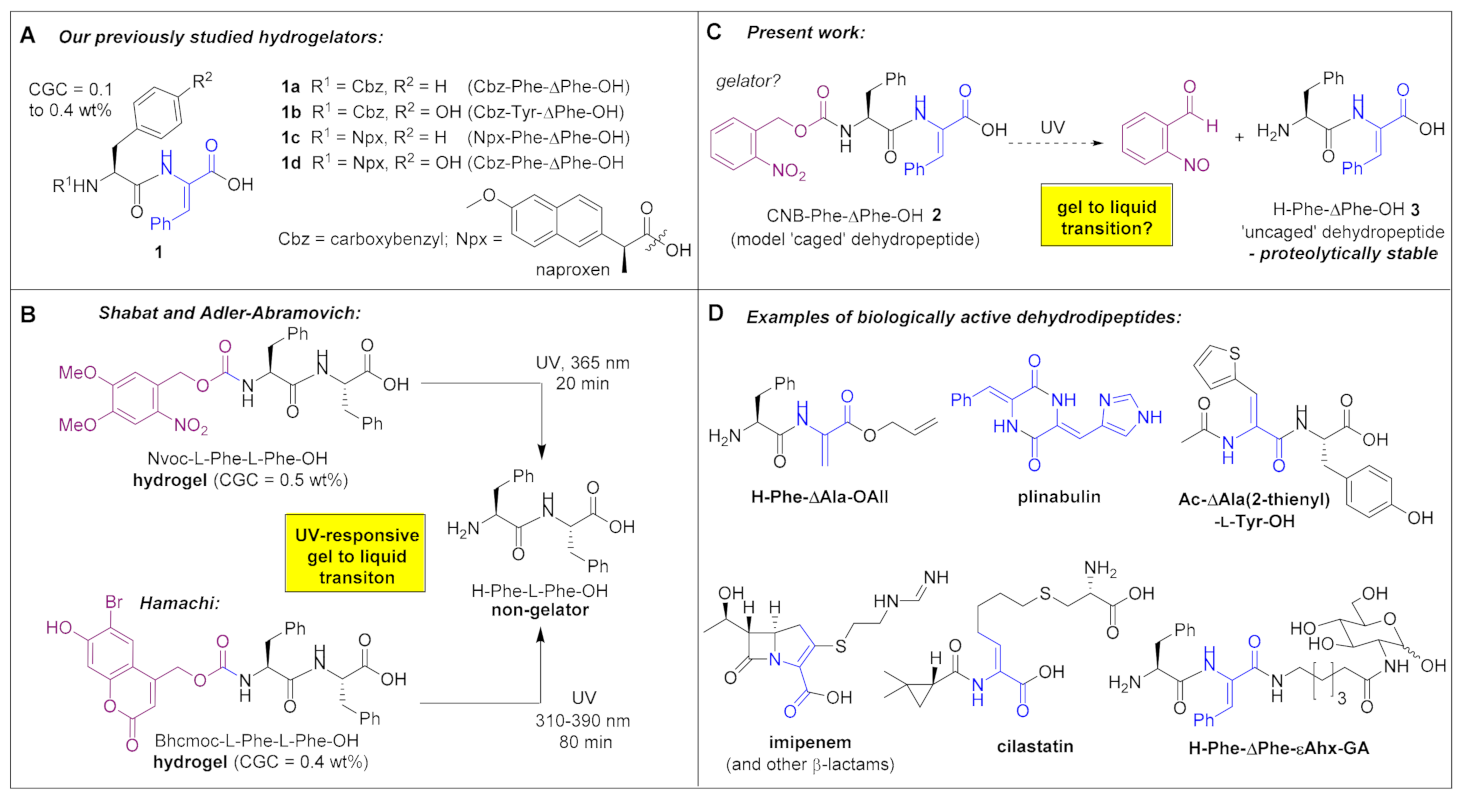
Abstract
:1. Introduction
2. Materials and Methods
2.1. Synthetic Chemistry
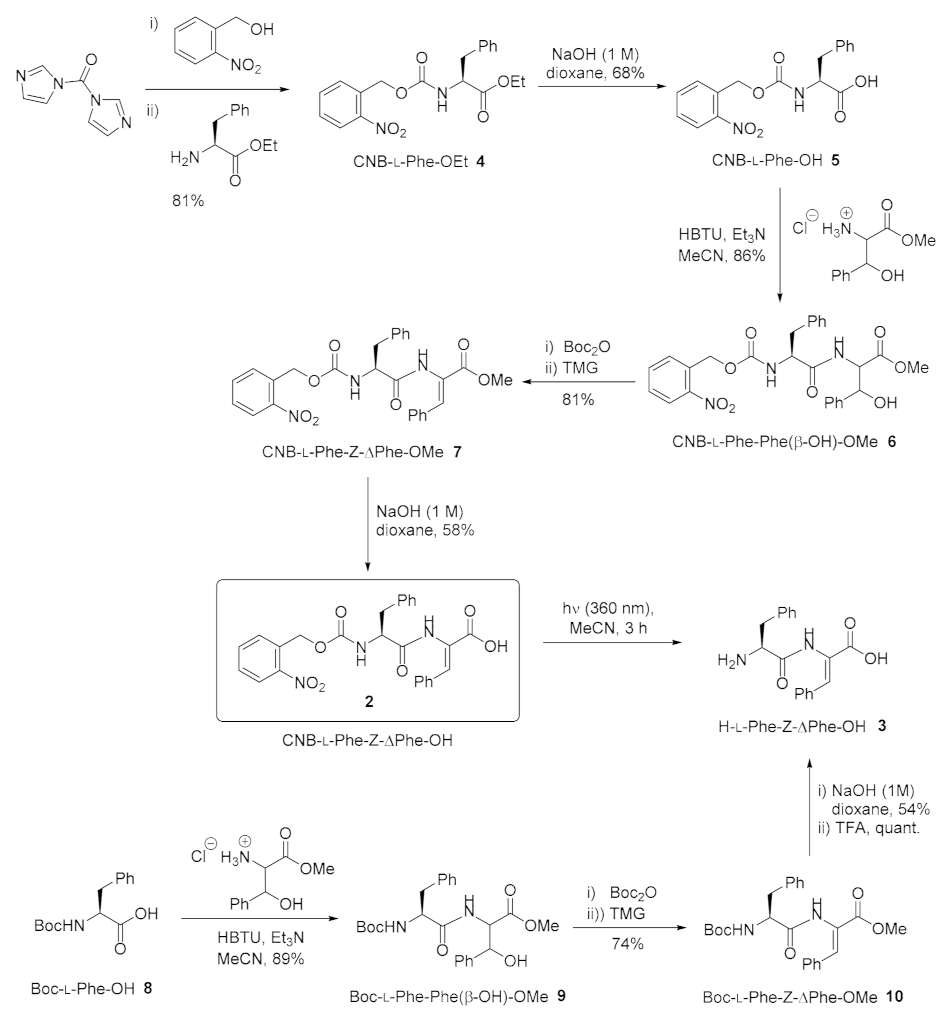
2.1.1. CNB-Phe-ΔPhe-OH (2)
2.1.2. H-Phe-ΔPhe-OH (3)
2.2. Gel Preparation and Determination of Critical Gelation Concentration
2.3. Gel-to-Sol Transition of the Gel of 6 under UV Irradiation
2.4. Studying Photo-Cleavage of 6 to Dipeptide 7 in the Gel State by HPLC
2.5. Studying Photo-Cleavage of 2 in Diluted Version of the Gel State by 1H NMR
2.6. Rheology
2.7. Assessment of the pH Dependence on Self-Assembly by Fluorescence Spectroscopy
2.8. Assessment of the Effect of Exposure to UV Light on Self-Assembly by Fluorescence Emission Spectroscopy
2.9. Scanning Transmission Electron Microscopy (STEM)
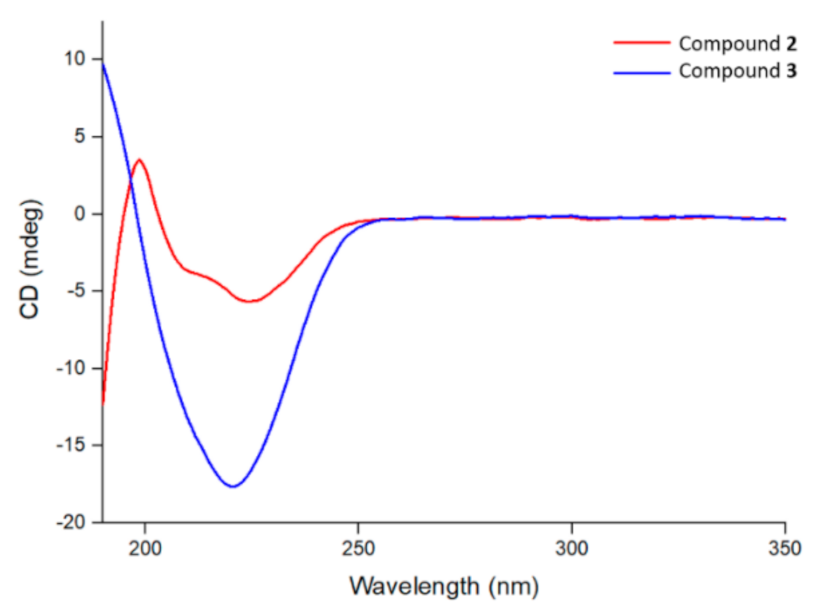
2.10. Circular Dichroism Spectroscopy
2.11. Cell Culture
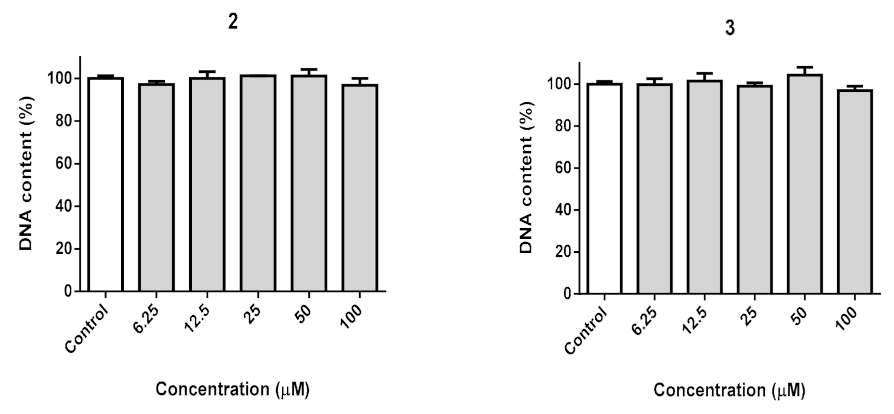
2.12. DNA Quantification
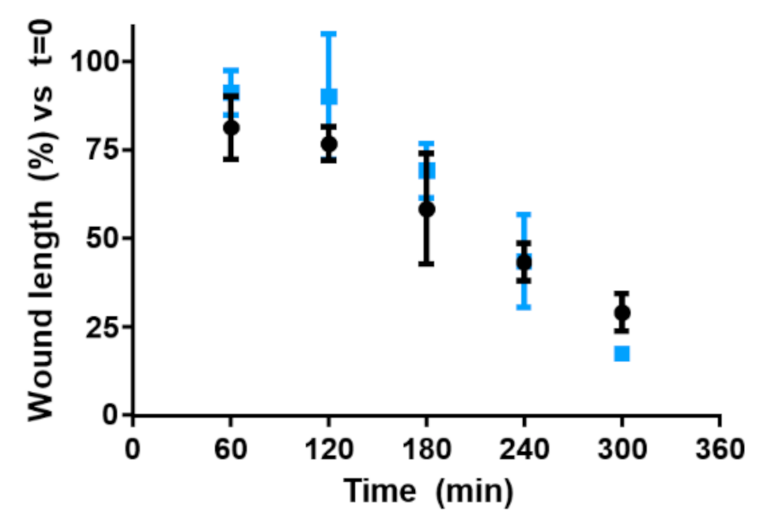
2.13. Wound Healing Assay
2.14. Statistical Analysis
2.15. Sustained Release Assays
3. Results
3.1. Chemical Synthesis of CNB-Phe-ΔPhe-OH (2) and H-Phe-ΔPhe-OH (3)
3.2. Gelation Study of CNB-Phe-ΔPhe-OH (2) and H-Phe-ΔPhe-OH (3)
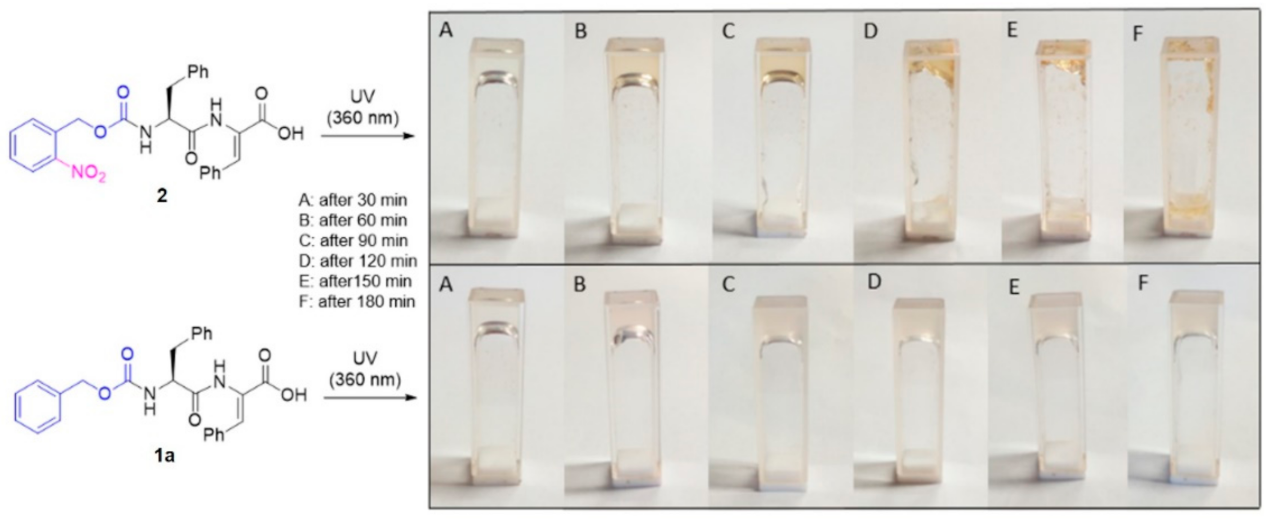
3.3. Visual Study of Gel-to-Sol Transition of CNB-Phe-ΔPhe-OH (2)
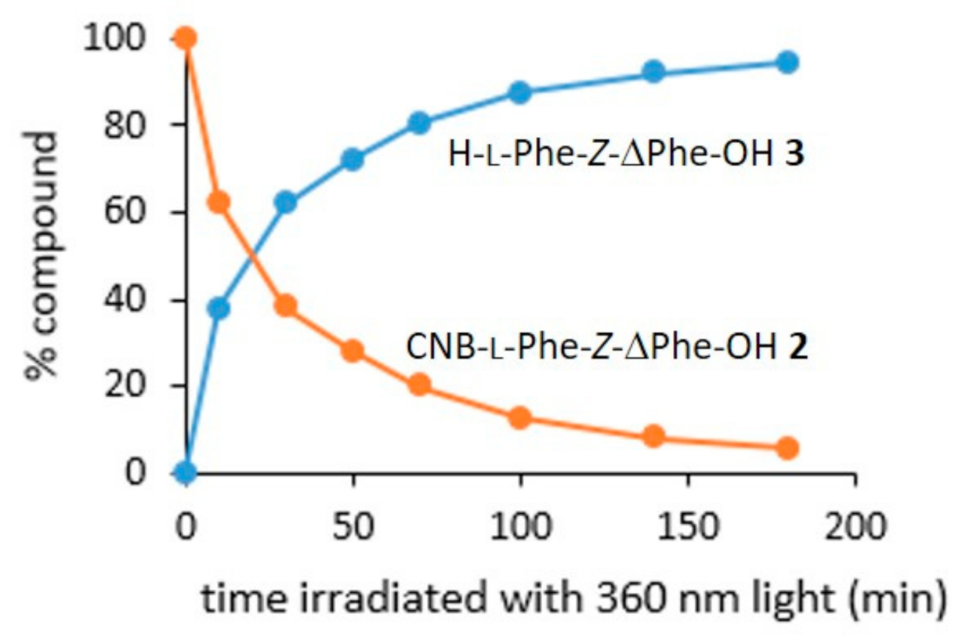
3.4. HPLC Study of the Time-Course of CNB-Phe-ΔPhe-OH (2) Conversion to H-Phe-ΔPhe-OH (3) under UV Light (360 nm) Exposure
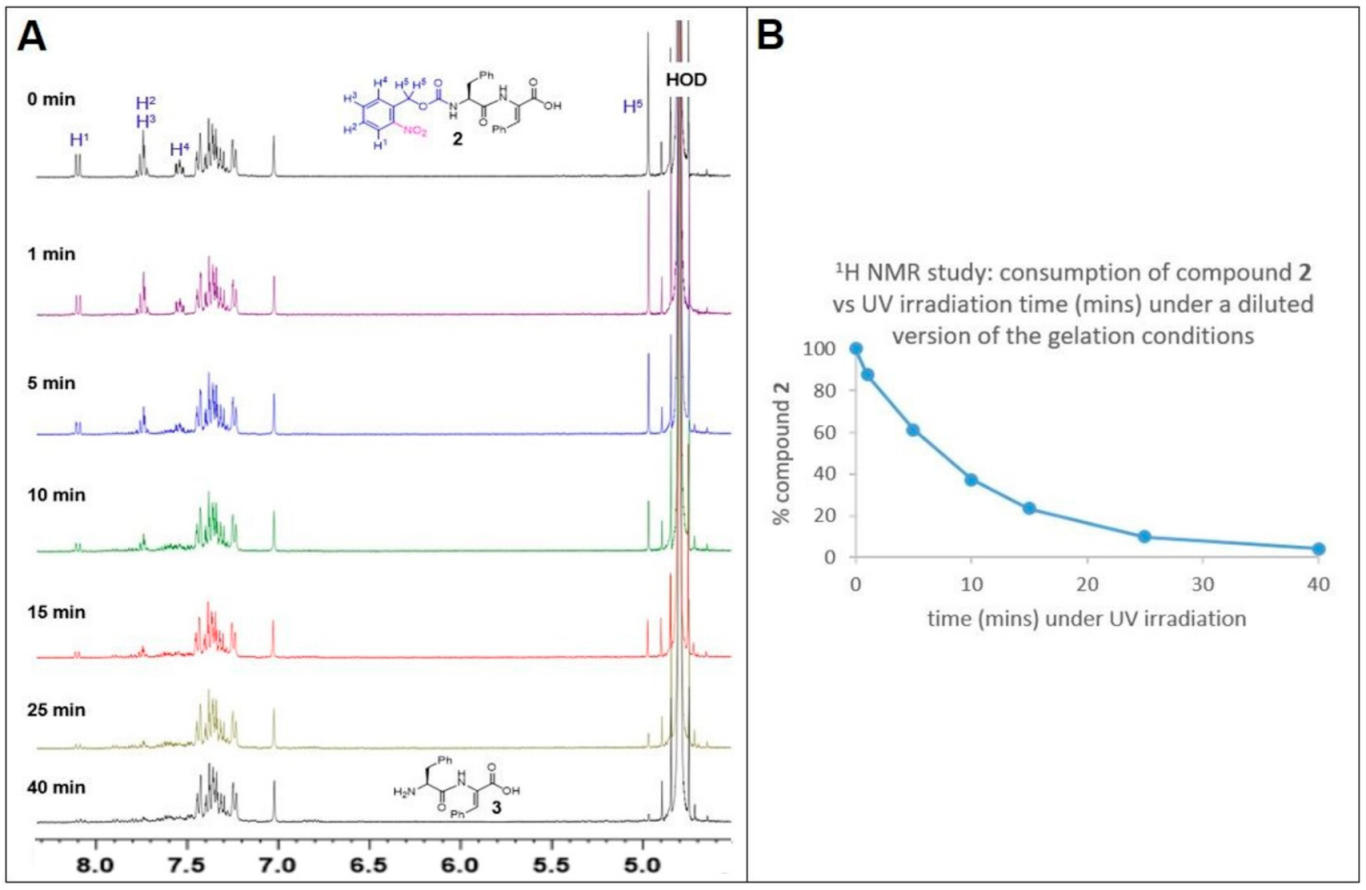
3.5. 1H NMR Study of the Time-Course of CNB-Phe-ΔPhe-OH (2) Conversion to H-Phe-ΔPhe-OH (3) under UV Light (360 nm) Exposure
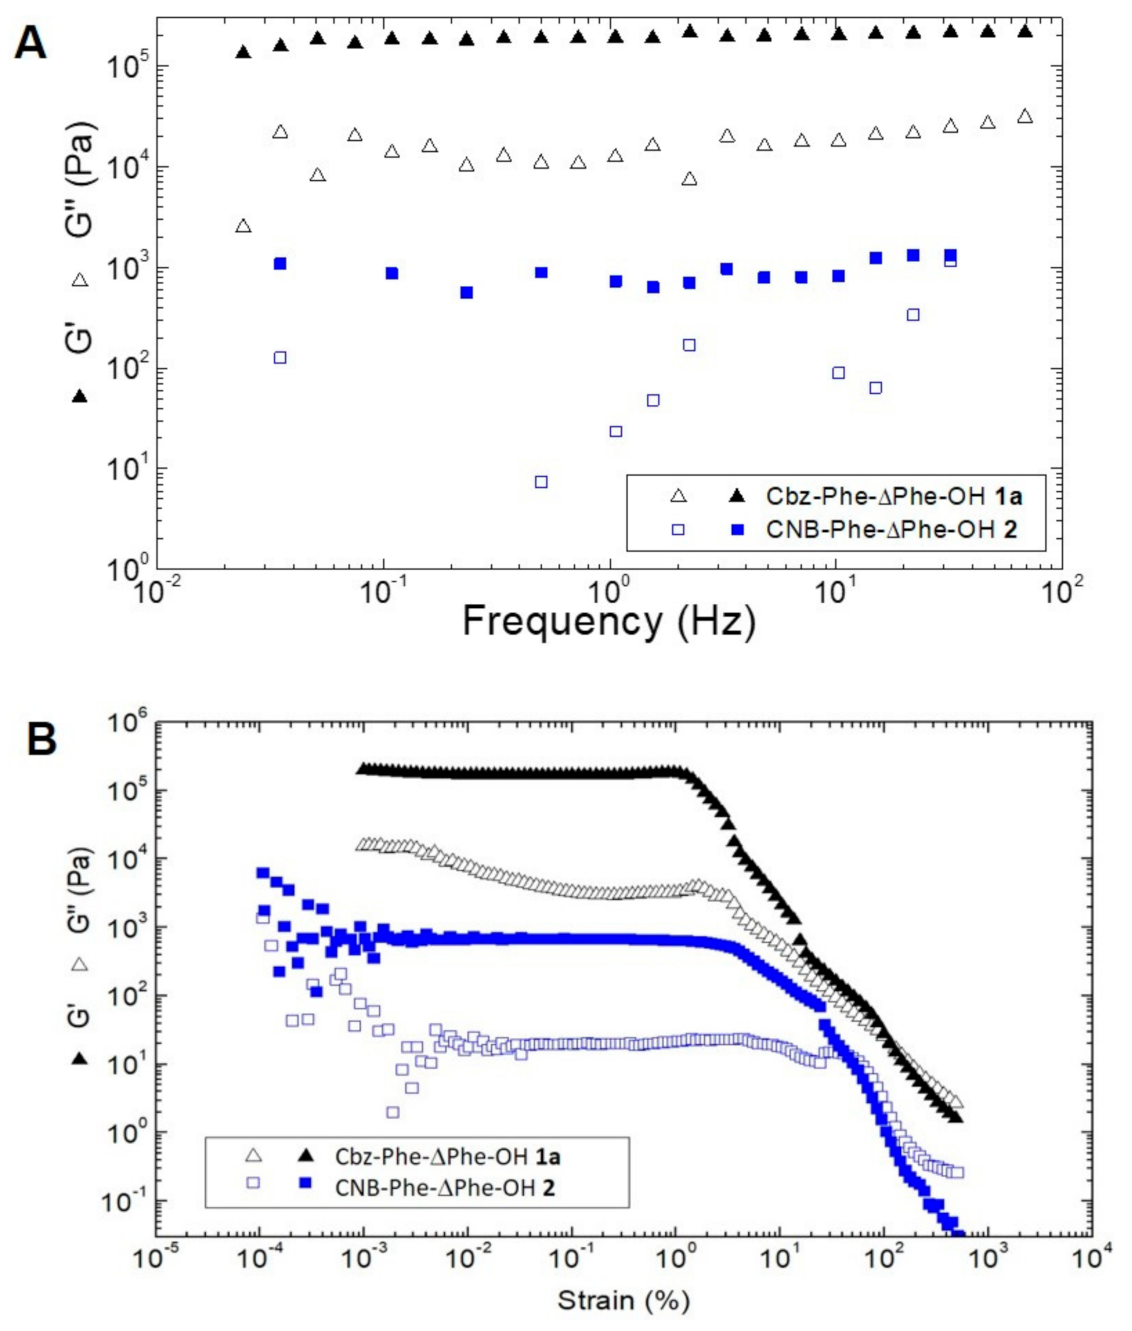
3.6. Rheological Study of CNB-Phe-ΔPhe-OH (2) and Comparison with Cbz-Phe-ΔPhe-OH (1a)
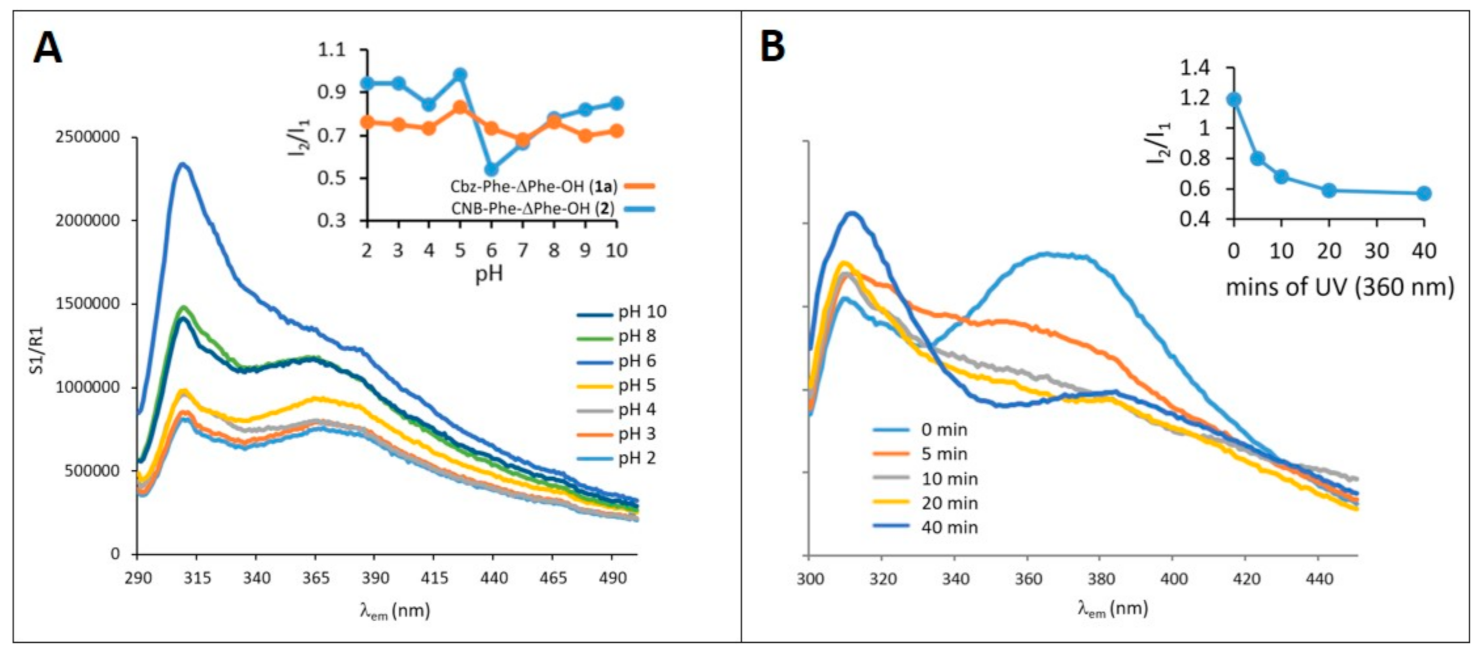
3.7. Effect of pH on Self-Assembly of CNB-Phe-ΔPhe-OH (2) and Comparison with Cbz-Phe-ΔPhe-OH (1a)
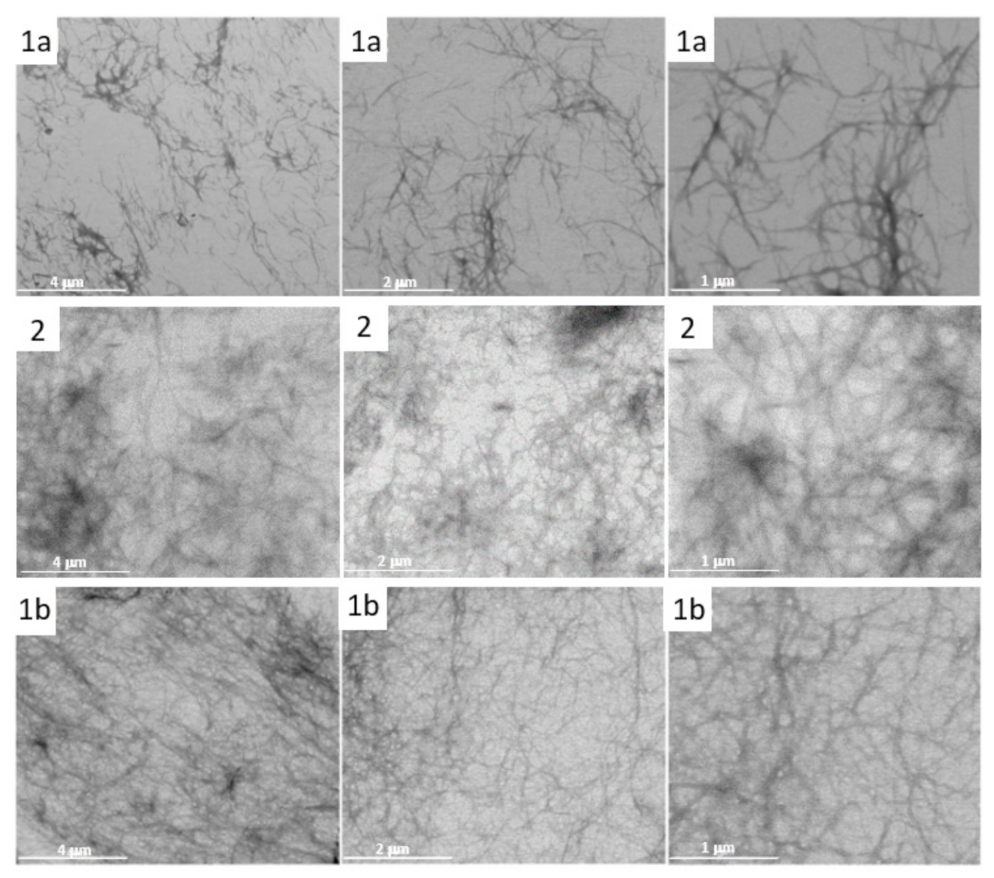
3.8. Studying the Nano/Micro Structure of CNB-Phe-ΔPhe-OH (2) Hydrogel by STEM
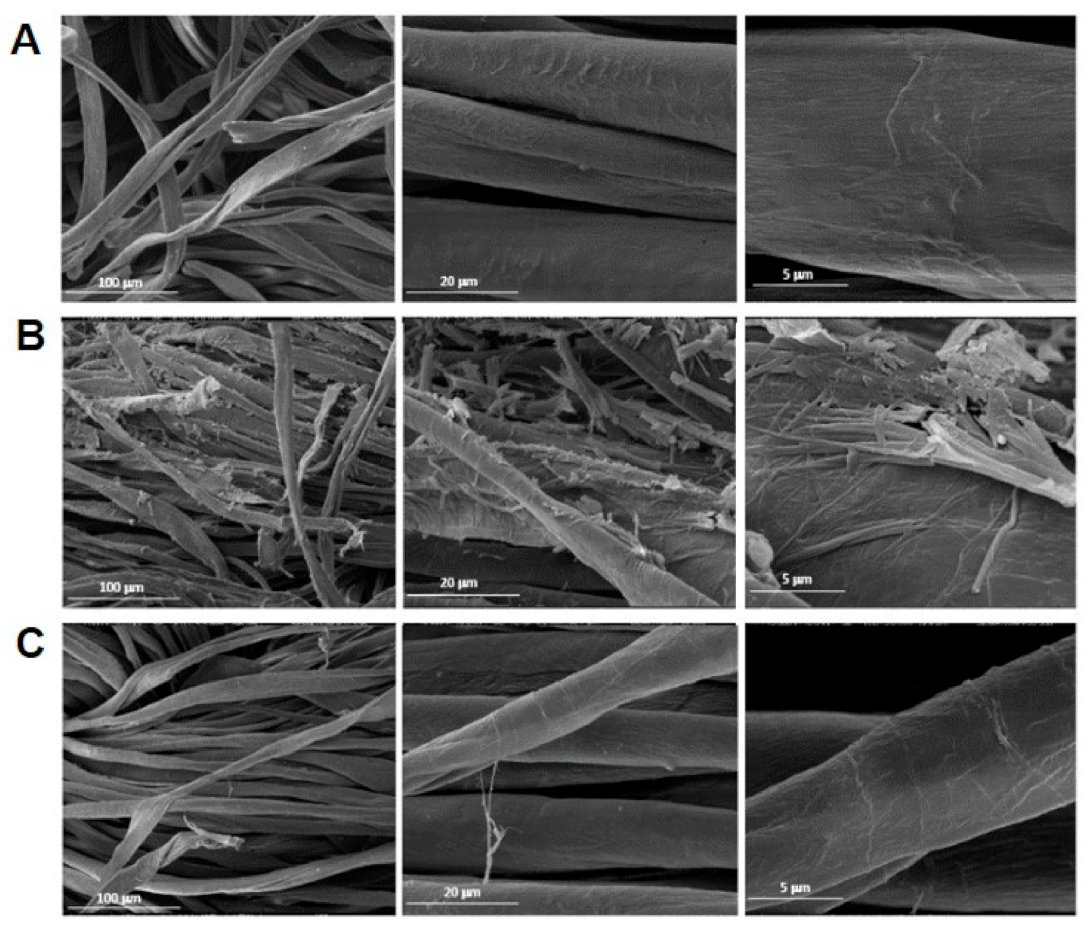
3.9. Studying the UV-Promoted Degradation the CNB-Phe-ΔPhe-OH (2) from Cotton Gauze Wound Dressing by STEM
3.10. Studying the Secondary Structure of CNB-Phe-ΔPhe-OH (2) and H-Phe-ΔPhe-OH (3) by Circular Dichroism Spectroscopy
3.11. Biocompatibility
3.12. In Vitro Drug Delivery Studies
4. Discussion
5. Conclusions
Supplementary Materials
Author Contributions
Funding
Data Availability Statement
Conflicts of Interest
Abbreviations
References
- Du, X.; Zhou, J.; Shi, J.; Xu, B. Supramolecular Hydrogelators and Hydrogels: From Soft Matter to Molecular Biomaterials. Chem. Rev. 2015, 115, 13165–13307. [Google Scholar] [CrossRef]
- Johnson, E.K.; Adams, D.J.; Cameron, P.J. Peptide based low molecular weight gelators. J. Mater. Chem. 2011, 21, 2024–2027. [Google Scholar] [CrossRef] [Green Version]
- Kim, B.J.; Yang, D.; Xu, B. Emerging Applications of Supramolecular Peptide Assemblies. Trends Chem. 2020, 2, 71–83. [Google Scholar] [CrossRef]
- Xian, S.; Webber, M.J. Temperature-responsive supramolecular hydrogels. J. Mater. Chem. B 2020, 8, 9197–9211. [Google Scholar] [CrossRef]
- Draper, E.R.; Adams, D.J. Controlling the Assembly and Properties of Low-Molecular-Weight Hydrogelators. Langmuir 2019, 35, 6506–6521. [Google Scholar] [CrossRef] [Green Version]
- Shy, A.N.; Kim, B.J.; Xu, B. Enzymatic Noncovalent Synthesis of Supramolecular Soft Matter for Biomedical Applications. Matter 2019, 1, 1127–1147. [Google Scholar] [CrossRef] [PubMed]
- Cai, Y.; Zheng, C.; Xiong, F.; Ran, W.; Zhai, Y.; Zhu, H.H.; Wang, H.; Li, Y.; Zhang, P. Recent Progress in the Design and Application of Supramolecular Peptide Hydrogels in Cancer Therapy. Adv. Healthc. Mater. 2020, 10, 2001239. [Google Scholar] [CrossRef] [PubMed]
- Simonson, A.W.; Aronson, M.R.; Medina, S.H. Supramolecular Peptide Assemblies as Antimicrobial Scaffolds. Molecules 2020, 25, 2751. [Google Scholar] [CrossRef] [PubMed]
- Liu, X.; Sun, X.; Liang, G. Peptide-based supramolecular hydrogels for bioimaging applications. Biomater. Sci. 2021, 9, 315–327. [Google Scholar] [CrossRef]
- Saunders, L.; Ma, P.X. Self-Healing Supramolecular Hydrogels for Tissue Engineering Applications. Macromol. Biosci. 2019, 19, 1800313. [Google Scholar] [CrossRef] [PubMed] [Green Version]
- Martin, A.D.; Thordarson, P. Beyond Fmoc: A review of aromatic peptide capping groups. J. Mater. Chem. B 2020, 8, 863–877. [Google Scholar] [CrossRef]
- Veloso, S.R.S.; Jervis, P.J.; Silva, J.F.G.; Hilliou, L.; Moura, C.; Pereira, D.M.; Coutinho, P.J.G.; Martins, J.A.; Castanheira, E.M.S.; Ferreira, P.M.T. Supramolecular ultra-short carboxybenzyl-protected dehydropeptide-based hydrogels for drug delivery. Mater. Sci. Eng. C 2021, 122, 111869. [Google Scholar] [CrossRef]
- Vilaça, H.; Castro, T.; Costa, F.M.G.; Melle-Franco, M.; Hilliou, L.; Hamley, I.W.; Castanheira, E.M.S.; Martins, J.A.; Ferreira, P.M.T. Self-assembled RGD dehydropeptide hydrogels for drug delivery applications. J. Mater. Chem. B 2017, 5, 8607–8617. [Google Scholar] [CrossRef] [PubMed] [Green Version]
- Vilaça, H.; Hortelão, A.C.L.; Castanheira, E.M.S.; Queiroz, M.-J.R.P.; Hilliou, L.; Hamley, I.W.; Martins, J.A.; Ferreira, P.M.T. Dehydrodipeptide Hydrogelators Containing Naproxen N-Capped Tryptophan: Self-Assembly, Hydrogel Characterization, and Evaluation as Potential Drug Nanocarriers. Biomacromolecules 2015, 16, 3562–3573. [Google Scholar] [CrossRef]
- Vilaça, H.; Pereira, G.; Castro, T.G.; Hermenegildo, B.F.; Shi, J.; Faria, T.Q.; Micaêlo, N.; Brito, R.M.M.; Xu, B.; Castanheira, E.M.S.; et al. New self-assembled supramolecular hydrogels based on dehydropeptides. J. Mater. Chem. B 2015, 3, 6355–6367. [Google Scholar] [CrossRef]
- Veloso, S.R.S.; Martins, J.A.; Hilliou, L.; Amorim, C.O.; Amaral, V.S.; Almeida, B.G.; Jervis, P.J.; Moreira, R.; Pereira, D.M.; Coutinho, P.J.G.; et al. Dehydropeptide-based plasmonic magnetogels: A supramolecular composite nanosystem for multimodal cancer therapy. J. Mater. Chem. B 2020, 8, 45–64. [Google Scholar] [CrossRef]
- Moreira, R.; Jervis, P.J.; Carvalho, A.; Ferreira, P.M.T.; Martins, J.A.; Valentão, P.; Andrade, P.B.; Pereira, D.M. Biological Evaluation of Naproxen–Dehydrodipeptide Conjugates with Self-Hydrogelation Capacity as Dual LOX/COX Inhibitors. Pharmaceutics 2020, 12, 122. [Google Scholar] [CrossRef] [PubMed] [Green Version]
- Roth-Konforti, M.E.; Comune, M.; Halperin-Sternfeld, M.; Grigoriants, I.; Shabat, D.; Adler-Abramovich, L. UV Light–Responsive Peptide-Based Supramolecular Hydrogel for Controlled Drug Delivery. Macromol. Rapid Commun. 2018, 39, 1800588. [Google Scholar] [CrossRef] [PubMed]
- Zhou, Z.; Yi, Q.; Xia, T.; Yin, W.; Kadi, A.A.; Li, J.; Zhang, Y. A photo-degradable supramolecular hydrogel for selective delivery of microRNA into 3D-cultured cells. Org. Biomol. Chem. 2017, 15, 2191–2198. [Google Scholar] [CrossRef]
- Jervis, P.J.; Amorim, C.; Pereira, T.; Martins, J.A.; Ferreira, P.M.T. Exploring the properties and potential biomedical applications of NSAID-capped peptide hydrogels. Soft Matter 2020, 16, 10001–10012. [Google Scholar] [CrossRef] [PubMed]
- Sharma, K.; Aaghaz, S.; Shenmar, K.; Jain, R. Short Antimicrobial Peptides. Recent Pat. Antiinfect. Drug Discov. 2018, 13, 12–52. [Google Scholar] [CrossRef]
- Cheetham, A.G.; Chakroun, R.W.; Ma, W.; Cui, H. Self-assembling prodrugs. Chem. Soc. Rev. 2017, 46, 6638–6663. [Google Scholar] [CrossRef] [PubMed]
- Tavakoli, S.; Klar, A.S. Advanced Hydrogels as Wound Dressings. Biomolecules 2020, 10, 1169. [Google Scholar] [CrossRef] [PubMed]
- Shah, A.; Malik, M.S.; Khan, G.S.; Nosheen, E.; Iftikhar, F.J.; Khan, F.A.; Shukla, S.S.; Akhter, M.S.; Kraatz, H.-B.; Aminabhavi, T.M. Stimuli-responsive peptide-based biomaterials as drug delivery systems. Chem. Eng. J. 2018, 353, 559–583. [Google Scholar] [CrossRef]
- Lu, H.; Yuan, L.; Yu, X.; Wu, C.; He, D.; Deng, J. Recent advances of on-demand dissolution of hydrogel dressings. Burn. Trauma 2018, 6, 35. [Google Scholar] [CrossRef] [Green Version]
- Wu, H.; Qin, Z.; Yu, X.; Li, J.; Lv, H.; Yang, X. On-demand removable hydrogels based on photolabile cross-linkings as wound dressing materials. J. Mater. Chem. B 2019, 7, 5669–5676. [Google Scholar] [CrossRef]
- Kloxin, A.M.; Tibbitt, M.W.; Anseth, K.S. Synthesis of photodegradable hydrogels as dynamically tunable cell culture platforms. Nat. Protoc. 2010, 5, 1867–1887. [Google Scholar] [CrossRef] [Green Version]
- Yoshii, T.; Ikeda, M.; Hamachi, I. Two-Photon-Responsive Supramolecular Hydrogel for Controlling Materials Motion in Micrometer Space. Angew. Chem. Int. Ed. 2014, 53, 7264–7267. [Google Scholar] [CrossRef]
- Ikeda, M.; Tanida, T.; Yoshii, T.; Hamachi, I. Rational Molecular Design of Stimulus-Responsive Supramolecular Hydrogels Based on Dipeptides. Adv. Mater. 2011, 23, 2819–2822. [Google Scholar] [CrossRef]
- Carvalho, A.; Gallo, J.; Pereira, D.M.; Valentão, P.; Andrade, P.B.; Hilliou, L.; Ferreira, P.M.T.; Bañobre-López, M.; Martins, J.A. Magnetic Dehydrodipeptide-Based Self-Assembled Hydrogels for Theragnostic Applications. Nanomaterials 2019, 9, 541. [Google Scholar] [CrossRef] [Green Version]
- Zhang, Z.-Q.; Song, S.-C. Multiple hyperthermia-mediated release of TRAIL/SPION nanocomplex from thermosensitive polymeric hydrogels for combination cancer therapy. Biomaterials 2017, 132, 16–27. [Google Scholar] [CrossRef] [PubMed]
- Zhu, J.; Han, H.; Ye, T.-T.; Li, F.-X.; Wang, X.-L.; Yu, J.-Y.; Wu, D.-Q. Biodegradable and pH Sensitive Peptide Based Hydrogel as Controlled Release System for Antibacterial Wound Dressing Application. Molecules 2018, 23, 3383. [Google Scholar] [CrossRef] [Green Version]
- Li, J.; Xing, R.; Bai, S.; Yan, X. Recent advances of self-assembling peptide-based hydrogels for biomedical applications. Soft Matter 2019, 15, 1704–1715. [Google Scholar] [CrossRef] [PubMed]
- Abul-Haija, Y.M.; Ulijn, R.V. Chapter 6 Enzyme-Responsive Hydrogels for Biomedical Applications. In Hydrogels in Cell-Based Therapies; The Royal Society of Chemistry: Cambridge, UK, 2014; pp. 112–134. [Google Scholar]
- Sedlačík, T.; Studenovská, H.; Rypáček, F. Enzymatic degradation of the hydrogels based on synthetic poly(α-amino acid)s. J. Mater. Sci. Mater. Med. 2011, 22, 781–788. [Google Scholar] [CrossRef]
- Makowski, M.; Lenartowicz, P.; Oszywa, B.; Jewgiński, M.; Pawełczak, M.; Kafarski, P. Synthesis of dehydrodipeptide esters and their evaluation as inhibitors of cathepsin C. Med. Chem. Res. 2015, 24, 3157–3165. [Google Scholar] [CrossRef] [Green Version]
- Blayney, D.W.; Bazhenova, L.; Lloyd, G.K.; Huang, L.; Mohanlal, R. Plinabulin, a Novel Small Molecule That Ameliorates Chemotherapy-Induced Neutropenia, Is Administered on the Same Day of Chemotherapy and Has Anticancer Efficacy. Blood 2016, 128, 2508. [Google Scholar] [CrossRef]
- Schorlemmer, H.-U.; Opitz, W.; Etschenberg, E.; Bitter-Suermann, D.; Hadding, U. Killing of Tumor Cells in Vitro by Macrophages from Mice Treated with Synthetic Dehydrodipeptides. Cancer Res. 1979, 39, 1847–1853. [Google Scholar]
- Balfour, J.A.; Bryson, H.M.; Brogden, R.N. Imipenem/Cilastatin. Drugs 1996, 51, 99–136. [Google Scholar] [CrossRef]
- Mahato, M.; Arora, V.; Pathak, R.; Gautam, H.K.; Sharma, A.K. Fabrication of nanostructures through molecular self-assembly of small amphiphilic glyco-dehydropeptides. Mol. Biosyst. 2012, 8, 1742–1749. [Google Scholar] [CrossRef]
- Panda, J.J.; Mishra, A.; Basu, A.; Chauhan, V.S. Stimuli Responsive Self-Assembled Hydrogel of a Low Molecular Weight Free Dipeptide with Potential for Tunable Drug Delivery. Biomacromolecules 2008, 9, 2244–2250. [Google Scholar] [CrossRef]
- Thota, C.K.; Yadav, N.; Chauhan, V.S. A novel highly stable and injectable hydrogel based on a conformationally restricted ultrashort peptide. Sci. Rep. 2016, 6, 31167. [Google Scholar] [CrossRef] [Green Version]
- Wang, P. Photolabile Protecting Groups: Structure and Reactivity. Asian J. Org. Chem. 2013, 2, 452–464. [Google Scholar] [CrossRef]
- Rajasekharan Pillai, V.N. Photoremovable Protecting Groups in Organic Synthesis. Synthesis 1980, 1980, 1–26. [Google Scholar] [CrossRef]
- Perrin, B.D. Buffers for pH and Metal Ion Control; Springer: London, UK, 1974. [Google Scholar]
- Schneider, C.A.; Rasband, W.S.; Eliceiri, K.W. NIH Image to ImageJ: 25 years of image analysis. Nat. Methods 2012, 9, 671–675. [Google Scholar] [CrossRef] [PubMed]
- Abraham, B.L.; Toriki, E.S.; Tucker, N.D.J.; Nilsson, B.L. Electrostatic interactions regulate the release of small molecules from supramolecular hydrogels. J. Mater. Chem. B 2020, 8, 6366–6377. [Google Scholar] [CrossRef]
- Vaillard, V.A.; González, M.; Perotti, J.P.; Grau, R.J.A.; Vaillard, S.E. Method for the synthesis of N-alkyl-O-alkyl carbamates. Rsc Adv. 2014, 4, 13012–13017. [Google Scholar] [CrossRef]
- Kokubo, T.; Takadama, H. How useful is SBF in predicting in vivo bone bioactivity? Biomaterials 2006, 27, 2907–2915. [Google Scholar] [CrossRef]
- Liu, J.; Zheng, H.; Poh, P.S.P.; Machens, H.-G.; Schilling, A.F. Hydrogels for Engineering of Perfusable Vascular Networks. Int. J. Mol. Sci. 2015, 16, 15997–16016. [Google Scholar] [CrossRef]
- Rubinstein, M.; Colby, R.H. Polymer Physics; Oxford University Press: New York, NY, USA, 2003. [Google Scholar]
- Doi, M.; Kuzuu, Y. Non-linear elasticity of rod-like macromolecules in condensed state. J. Polym. Sci. 1980, 18, 409–419. [Google Scholar]
- Greenfield, N.J. Applications of circular dichroism in protein and peptide analysis. Trac Trends Anal. Chem. 1999, 18, 236–244. [Google Scholar] [CrossRef]
- Shi, Y.; Truong, V.X.; Kulkarni, K.; Qu, Y.; Simon, G.P.; Boyd, R.L.; Perlmutter, P.; Lithgow, T.; Forsythe, J.S. Light-triggered release of ciprofloxacin from an in situ forming click hydrogel for antibacterial wound dressings. J. Mater. Chem. B 2015, 3, 8771–8774. [Google Scholar] [CrossRef] [PubMed]


Publisher’s Note: MDPI stays neutral with regard to jurisdictional claims in published maps and institutional affiliations. |
© 2021 by the authors. Licensee MDPI, Basel, Switzerland. This article is an open access article distributed under the terms and conditions of the Creative Commons Attribution (CC BY) license (http://creativecommons.org/licenses/by/4.0/).
Share and Cite
Jervis, P.J.; Hilliou, L.; Pereira, R.B.; Pereira, D.M.; Martins, J.A.; Ferreira, P.M.T. Evaluation of a Model Photo-Caged Dehydropeptide as a Stimuli-Responsive Supramolecular Hydrogel. Nanomaterials 2021, 11, 704. https://doi.org/10.3390/nano11030704
Jervis PJ, Hilliou L, Pereira RB, Pereira DM, Martins JA, Ferreira PMT. Evaluation of a Model Photo-Caged Dehydropeptide as a Stimuli-Responsive Supramolecular Hydrogel. Nanomaterials. 2021; 11(3):704. https://doi.org/10.3390/nano11030704
Chicago/Turabian StyleJervis, Peter J., Loic Hilliou, Renato B. Pereira, David M. Pereira, José A. Martins, and Paula M. T. Ferreira. 2021. "Evaluation of a Model Photo-Caged Dehydropeptide as a Stimuli-Responsive Supramolecular Hydrogel" Nanomaterials 11, no. 3: 704. https://doi.org/10.3390/nano11030704