
Accelerated Synthesis of Graphene Oxide from Graphene

 ,
,  ,
,
Abstract
:1. Introduction
2. Materials and Methods
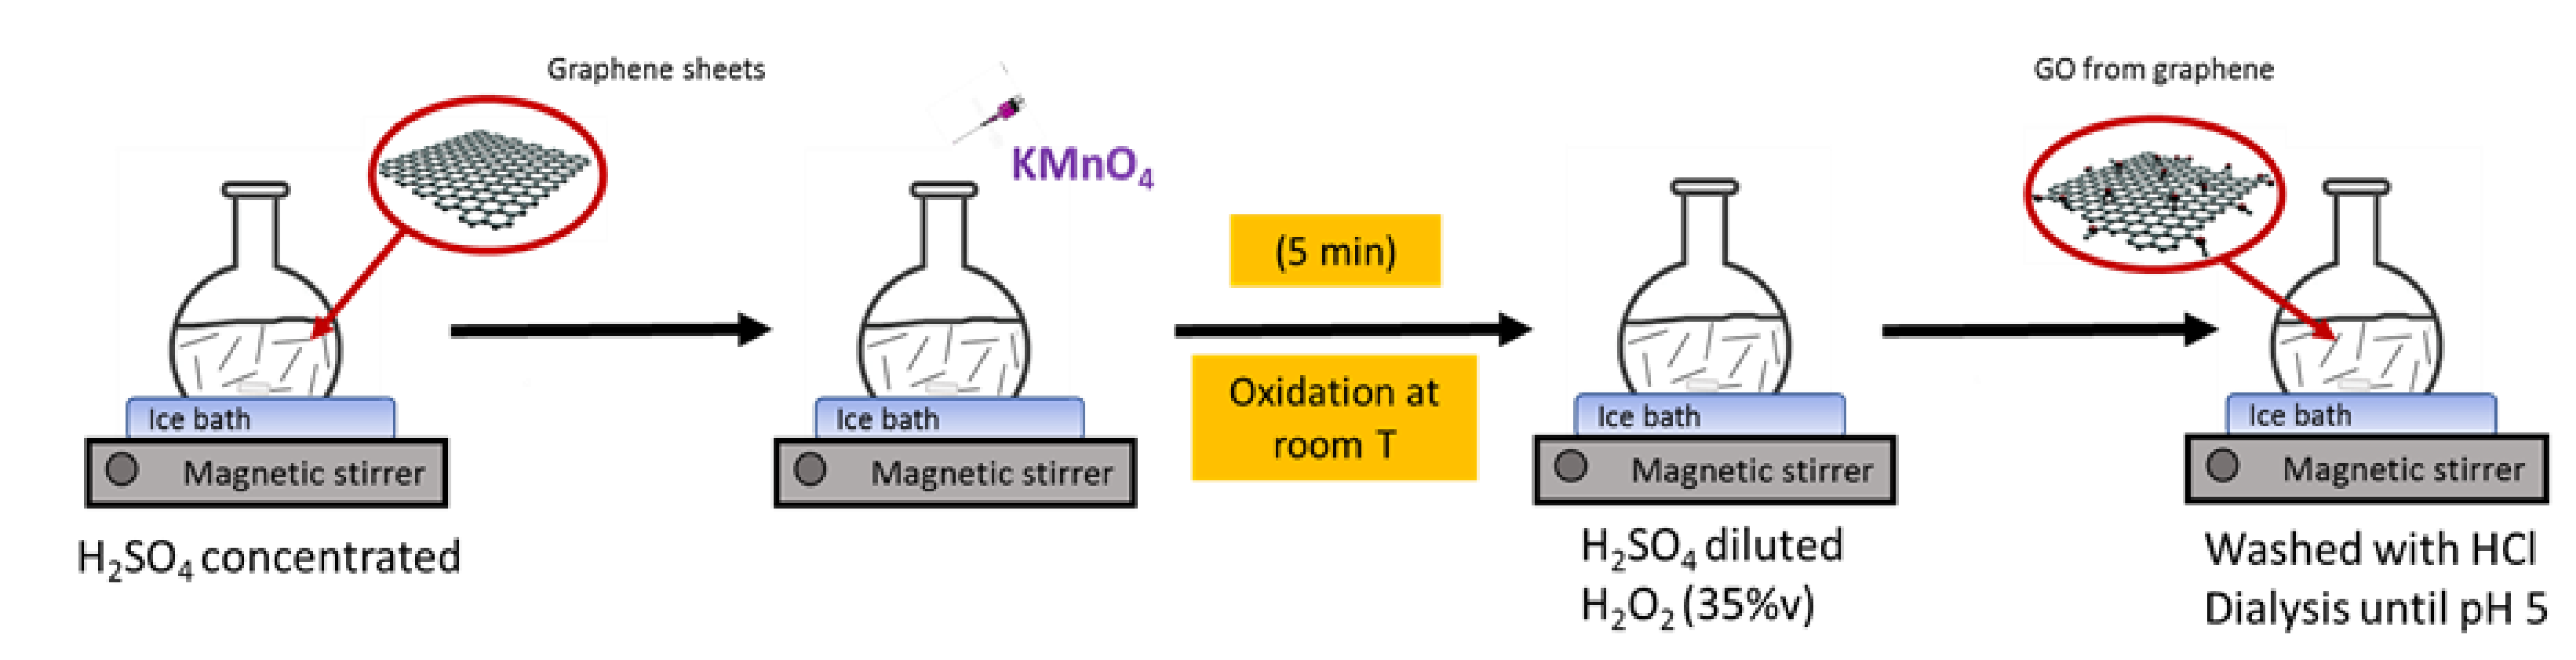
2.1. Synthesis of Graphene Oxide Obtained Directly from Graphene
2.2. Commercial Graphene Oxide
2.3. Characterization Techniques
2.4. Computational Methods
3. Results
4. Discussion
5. Conclusions
Supplementary Materials
Author Contributions
Funding
Conflicts of Interest
References
- Chen, D.; Feng, H.; Li, J. Graphene oxide: Preparation, functionalization, and electrochemical applications. Chem. Rev. 2012, 112, 6027–6053. [Google Scholar] [CrossRef]
- Yang, G.; Zhu, C.; Du, D.; Zhu, J.; Lin, Y. Graphene-like two-dimensional layered nanomaterials: Applications in biosensors and nanomedicine. Nanoscale 2015, 7, 14217–14231. [Google Scholar] [CrossRef]
- Kim, S.; Hwang, S.W.; Kim, M.-K.; Shin, D.Y.; Shin, D.H.; Kim, C.O.; Yang, S.B.; Park, J.H.; Hwang, E.; Choi, S.-H.; et al. Anomalous Behaviors of Visible Luminescence from Graphene Quantum Dots: Interplay between Size and Shape. ACS Nano 2012, 6, 8203–8208. [Google Scholar] [CrossRef]
- Samorì, P.; Kinloch, I.A.; Feng, X.; Palermo, V. Graphene-based nanocomposites for structural and functional applications: Using 2-dimensional materials in a 3-dimensional world. 2D Mater. 2015, 2, 030205. [Google Scholar] [CrossRef] [Green Version]
- Chen, J.; Yao, B.; Li, C.; Shi, G. An improved Hummers method for eco-friendly synthesis of graphene oxide. Carbon 2013, 64, 225–229. [Google Scholar] [CrossRef]
- Guerrero-Contreras, J.; Caballero-Briones, F. Graphene oxide powders with different oxidation degree, prepared by synthesis variations of the Hummers method. Mater. Chem. Phys. 2015, 153, 209–220. [Google Scholar] [CrossRef]
- Peng, L.; Xu, Z.; Liu, Z.; Wei, Y.; Sun, H.; Li, Z.; Zhao, X.; Gao, C. An iron-based green approach to 1-h production of single-layer graphene oxide. Nat. Commun. 2015, 6, 1–9. [Google Scholar] [CrossRef] [PubMed] [Green Version]
- Pei, S.; Wei, Q.; Huang, K.; Cheng, H.M.; Ren, W. Green synthesis of graphene oxide by seconds timescale water electrolytic oxidation. Nat. Commun. 2018, 9, 1–10. [Google Scholar] [CrossRef] [Green Version]
- Marcano, D.C.; Kosynkin, D.V.; Berlin, J.M.; Sinitskii, A.; Sun, Z.; Slesarev, A.; Alemany, L.B.; Lu, W.; Tour, J.M. Improved synthesis of graphene oxide. ACS Nano 2010, 4, 4806–4814. [Google Scholar] [CrossRef]
- Cui, X.; Zhang, C.; Hao, R.; Hou, Y. Liquid-phase exfoliation, functionalization and applications of graphene. Nanoscale 2011, 3, 2118–2126. [Google Scholar] [CrossRef]
- Kauling, A.P.; Seefeldt, A.T.; Pisoni, D.P.; Pradeep, R.C.; Bentini, R.; Oliveira, R.V.B.; Novoselov, K.S.; Castro Neto, A.H. The Worldwide Graphene Flake Production. Adv. Mater. 2018, 30, 1803784. [Google Scholar] [CrossRef]
- Mitoma, N.; Nouchi, R.; Tanigaki, K. Photo-oxidation of graphene in the presence of water. J. Phys. Chem. C 2013, 117, 1453–1456. [Google Scholar] [CrossRef] [Green Version]
- Islam, A.E.; Kim, S.S.; Rao, R.; Ngo, Y.; Jiang, J.; Nikolaev, P.; Naik, R.; Pachter, R.; Boeckl, J.; Maruyama, B. Photo-thermal oxidation of single layer graphene. RSC Adv. 2016, 6, 42545–42553. [Google Scholar] [CrossRef]
- Giannozzi, P.; Andreussi, O.; Brumme, T.; Bunau, O.; Buongiorno Nardelli, M.; Calandra, M.; Car, R.; Cavazzoni, C.; Ceresoli, D.; Cococcioni, M.; et al. Advanced capabilities for materials modelling with Quantum ESPRESSO. J. Phys. Condens. Matter 2017, 29, 465901. [Google Scholar] [CrossRef] [Green Version]
- Perdew, J.P.; Burke, K.; Ernzerhof, M. Generalized Gradient Approximation Made Simple. Phys. Rev. Lett. 1997, 78, 1396. [Google Scholar] [CrossRef] [Green Version]
- Singh, A.V.; Maharjan, R.-S.; Kanase, A.; Siewert, K.; Rosenkranz, D.; Singh, R.; Laux, P.; Luch, A. Machine-Learning-Based Approach to Decode the Influence of Nanomaterial Properties on Their Interaction with Cells. ACS Appl. Mater. Interfaces 2021, 13, 1943–1955. [Google Scholar] [CrossRef] [PubMed]
- Rappe, A.M.; Rabe, K.M.; Kaxiras, E.; Joannopoulos, J.D. Optimized pseudopotentials. Phys. Rev. B 1990, 41, 1227–1230. [Google Scholar] [CrossRef]
- Troullier, N.; Martins, J.L. Efficient pseudopotentials for plane-wave calculations. Phys. Rev. B 1991, 43, 1993–2006. [Google Scholar] [CrossRef]
- Monkhorst, H.J.; Pack, J.D. Special points for Brillouin-zone integrations. Phys. Rev. B 1976, 13, 5188–5192. [Google Scholar] [CrossRef]
- Carvalho, A.; Costa, M.C.F.; Marangoni, V.S.; Ng, P.R.; Nguyen, H.T.L.; Castro Neto, A.H. The Degree of Oxidation of Graphene Oxide. Nanomaterials. (accepted).
- Si, Y.; Samulski, E.T. Synthesis of water soluble graphene. Nano Lett. 2008, 8, 1679–1682. [Google Scholar] [CrossRef]
- Yang, M.; Moriyama, S.; Higuchi, M. Selective edge modification in graphene and graphite by chemical oxidation. J. Nanosci. Nanotechnol. 2014, 14, 2974–2978. [Google Scholar] [CrossRef]
- Mermoux, M.; Chabre, Y.; Rousseau, A. FTIR and 13C NMR study of graphite oxide. Carbon 1991, 29, 469–474. [Google Scholar] [CrossRef]
- Hontoria-Lucas, C.; López-Peinado, A.J.; López-González, J.d.D.; Rojas-Cervantes, M.L.; Martín-Aranda, R.M. Study of oxygen-containing groups in a series of graphite oxides: Physical and chemical characterization. Carbon 1995, 33, 1585–1592. [Google Scholar] [CrossRef]
- Malard, L.M.; Pimenta, M.A.; Dresselhaus, G.; Dresselhaus, M.S. Raman spectroscopy in graphene. Phys. Rep. 2009, 473, 51–87. [Google Scholar] [CrossRef]
- López-Díaz, D.; López Holgado, M.; García-Fierro, J.L.; Velázquez, M.M. Evolution of the Raman Spectrum with the Chemical Composition of Graphene Oxide. J. Phys. Chem. C 2017, 121, 20489–20497. [Google Scholar] [CrossRef]
- Basu, S.; Bhattacharyya, P. Recent developments on graphene and graphene oxide based solid state gas sensors. Sensors Actuators B Chem. 2012, 173, 1–21. [Google Scholar] [CrossRef]
- Yang, Q.-D.; Li, J.; Cheng, Y.; Li, H.-W.; Guan, Z.; Yu, B.; Tsang, S.-W. Graphene oxide as an efficient hole-transporting material for high-performance perovskite solar cells with enhanced stability. J. Mater. Chem. A 2017, 5, 9852–9858. [Google Scholar] [CrossRef]
- Hazra, S.; Basu, S. Graphene-Oxide Nano Composites for Chemical Sensor Applications. C 2016, 2, 12. [Google Scholar] [CrossRef]
- Zheng, H.; Ji, Z.; Roy, K.R.; Gao, M.; Pan, Y.; Cai, X.; Wang, L.; Li, W.; Chang, C.H.; Kaweeteerawat, C.; et al. Engineered Graphene Oxide Nanocomposite Capable of Preventing the Evolution of Antimicrobial Resistance. ACS Nano 2019, 13, 11488–11499. [Google Scholar] [CrossRef]
- Eng, A.Y.S.; Chua, C.K.; Pumera, M. Facile labelling of graphene oxide for superior capacitive energy storage and fluorescence applications. Phys. Chem. Chem. Phys. 2016, 18, 9673–9681. [Google Scholar] [CrossRef] [PubMed]
- Yi, J.; Choe, G.; Park, J.; Lee, J.Y. Graphene oxide-incorporated hydrogels for biomedical applications. Polym. J. 2020, 52, 823–837. [Google Scholar] [CrossRef]


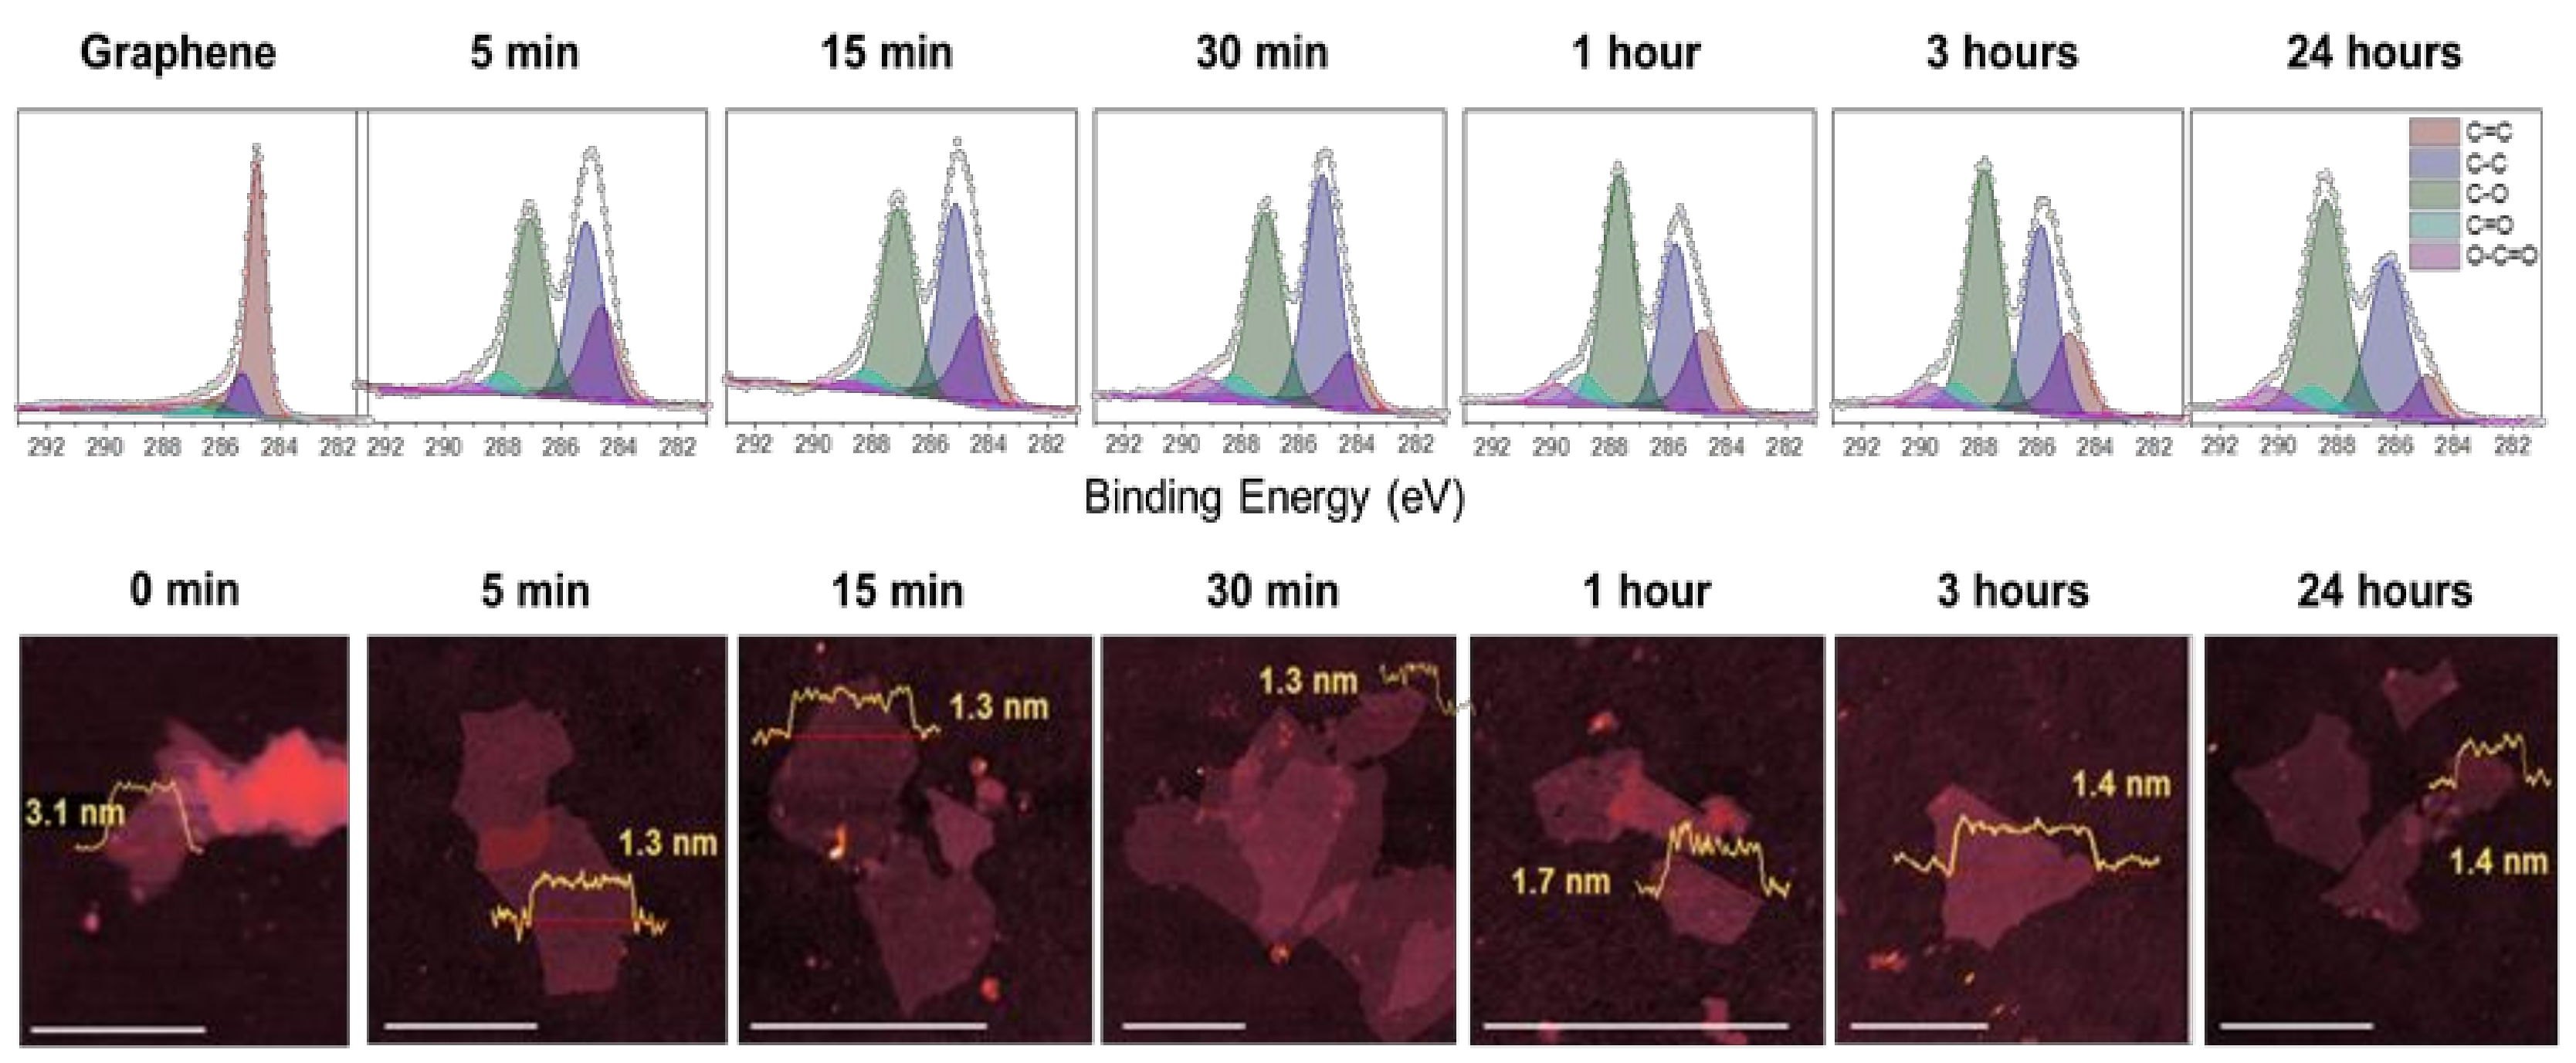
| Material | C=C (sp2) | C–C (sp3) | C–O | C=O | O–C=O | π → π * |
|---|---|---|---|---|---|---|
| Graphene | 284.76 (81.8%) | 285.30 (10.5%) | 286.24 (2.8%) | 286.99 (1.4%) | 287.77 (0.7%) | 290.90 (2.8%) |
| GO 5 min | 284.6 (26.7%) | 285.15 (33.6%) | 287.08 (33.5%) | 288.17 (4.0%) | 289.10 (2.1%) | |
| GO 15 min | 284.41 (26.3%) | 285.15 (35.7%) | 287.11 (33.3%) | 288.18 (3.4%) | 288.86 (1.3%) | |
| GO 30 min | 284.47 (23.8%) | 285.25 (36.8%) | 287.15 (31.6%) | 288.07 (4.5%) | 289.17 (3.3%) | |
| GO 1 h | 284.82 (22.1%) | 285.77 (29.4%) | 287.71 (40.4%) | 288.93 (4.9%) | 289.86 (3.2%) | |
| GO 3h | 284.89 (21.7%) | 285.89 (31.5%) | 287.83 (39.9%) | 288.85 (3.6%) | 289.68 (3.3%) | |
| GO 24 h | 284.94 (9.4%) | 286.26 (34.3%) | 288.39 (46.6%) | 288.79 (5.3%) | 290.26 (4.4%) | |
| c-GO I | 284.32 (23.6%) | 285.03 (33.3%) | 286.94 (28.5%) | 287.41 (10.9%) | 288.34 (3.7%) | |
| c-GO II | 284.81 (19.0%) | 285.67 (26.0%) | 287.55 (45.1%) | 288.59 (6.7%) | 289.49 (3.2%) |
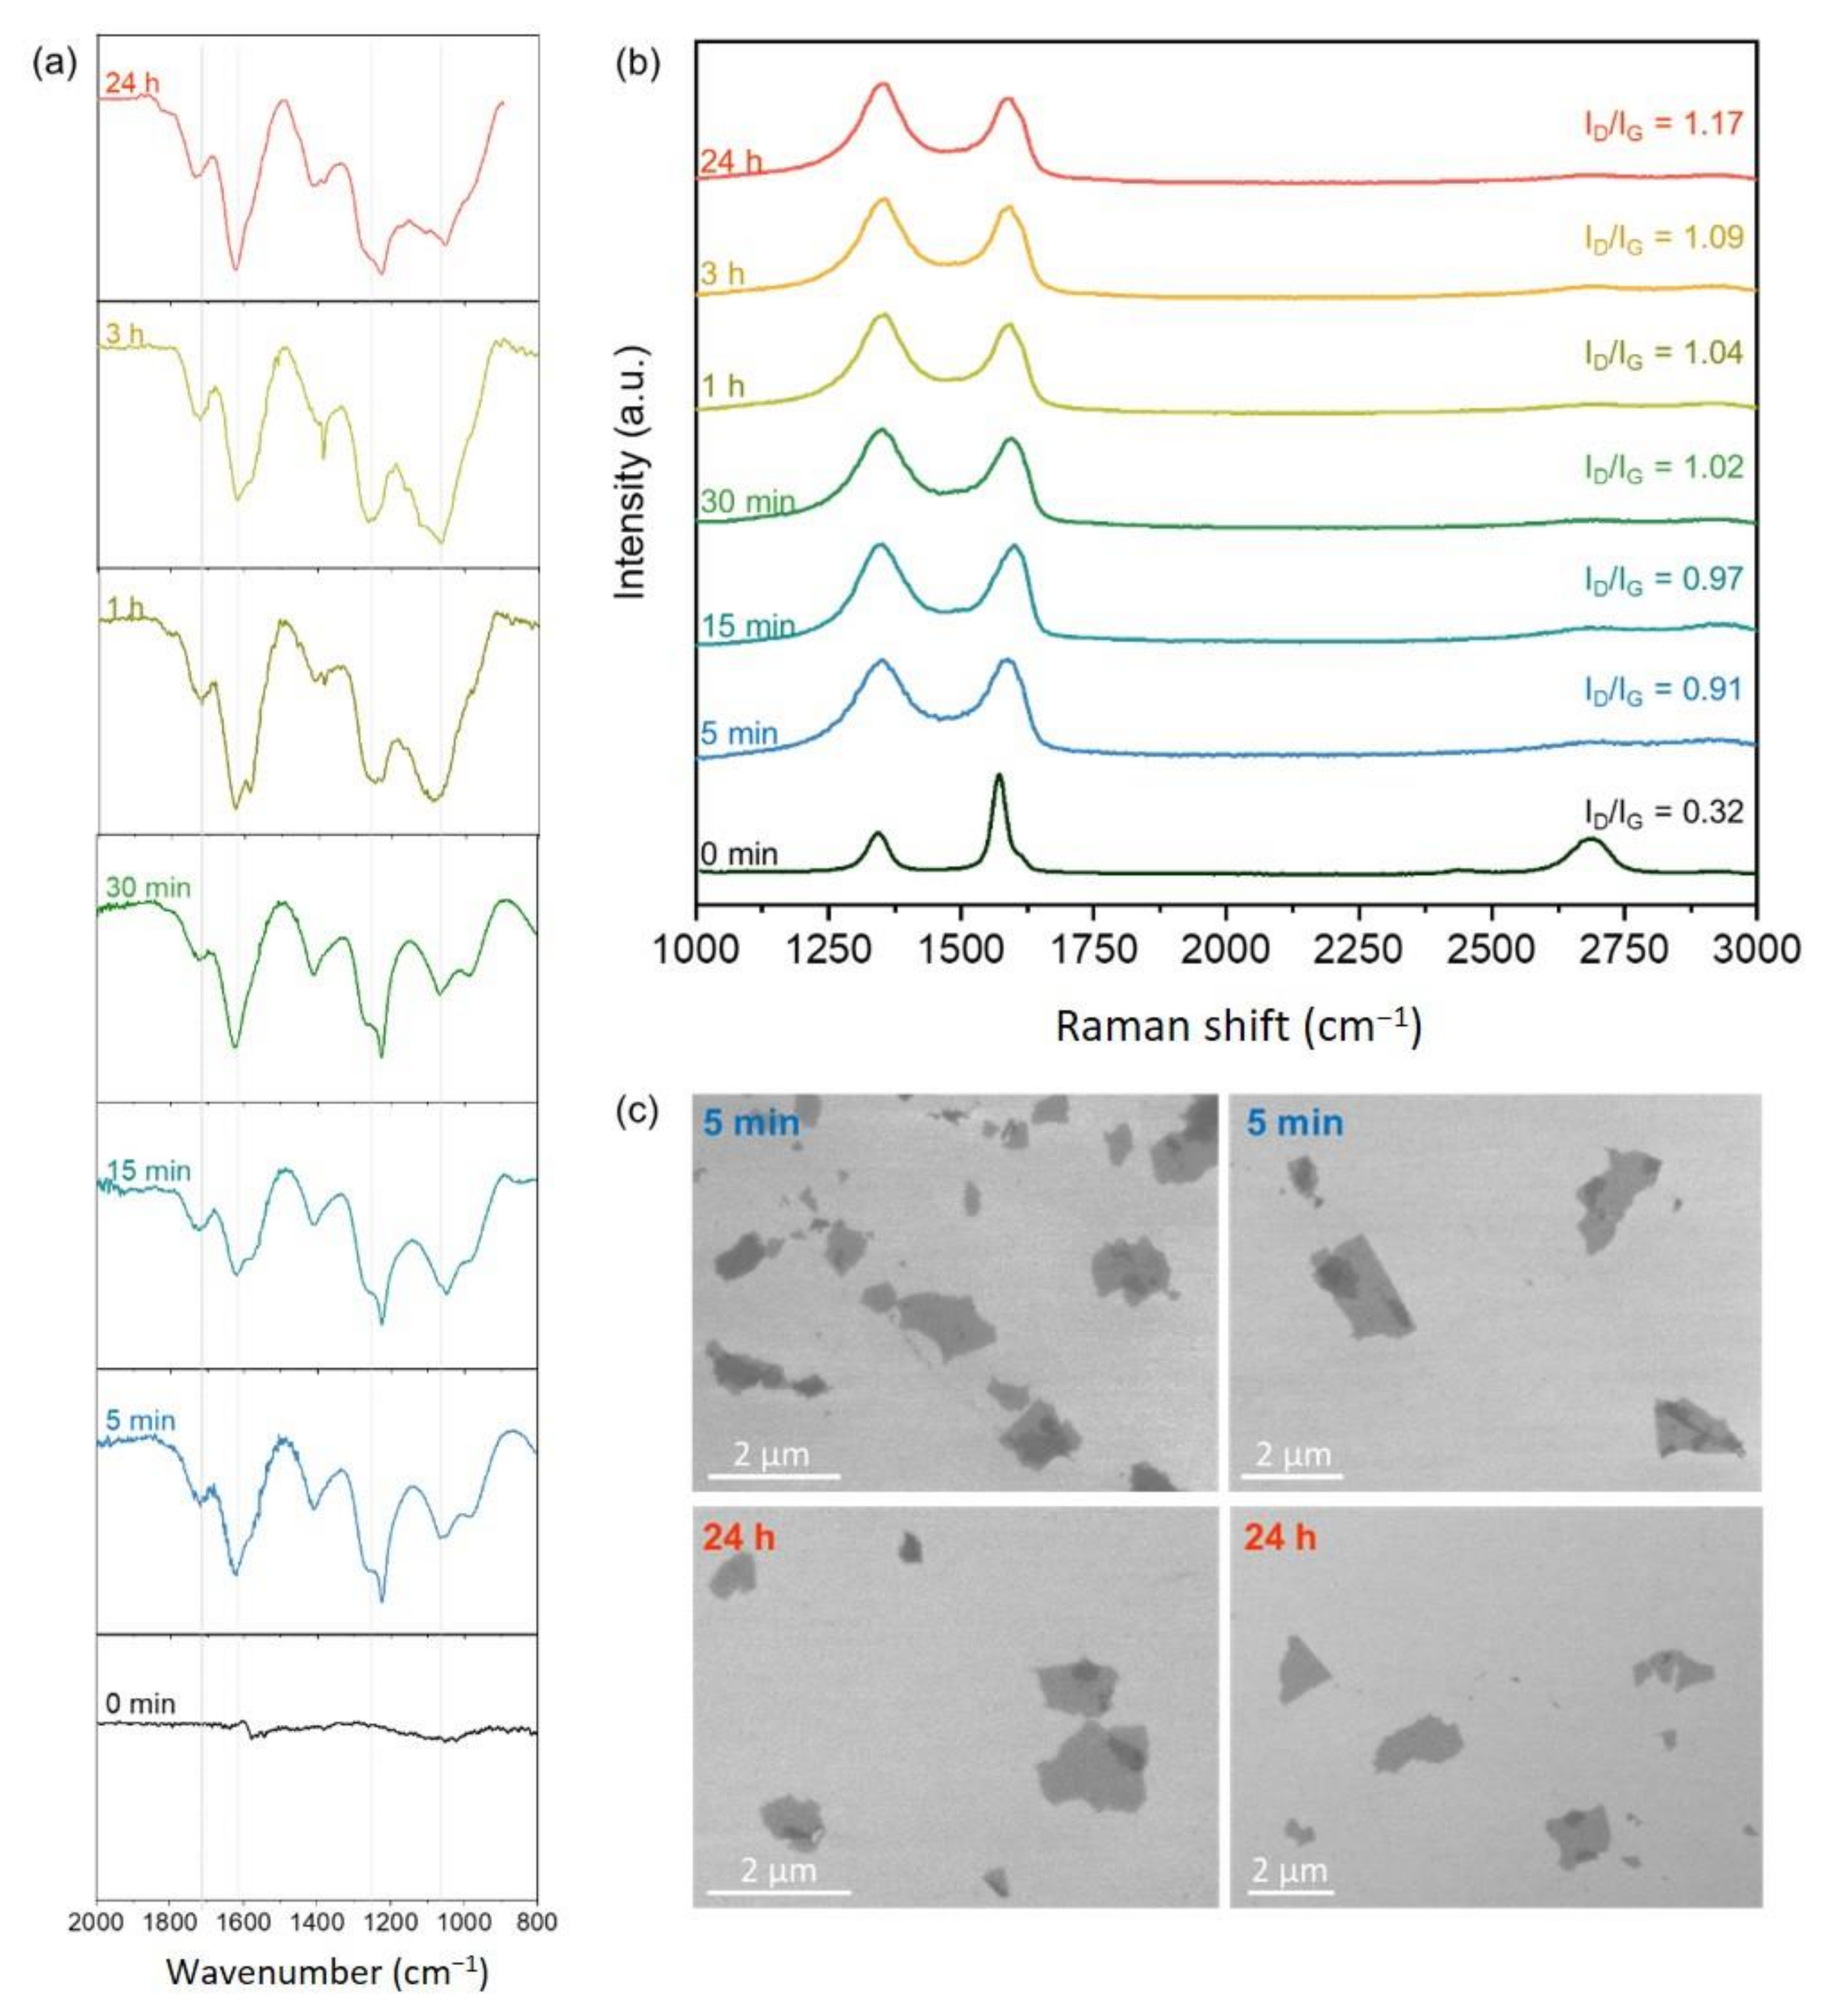
| Material | D Band | G Band | ID/IG | ||
|---|---|---|---|---|---|
| Center | FWHM | Center | FWHM | ||
| Graphene | 1343.3 ± 0.4 | 54.8 ± 1.0 | 1570.5 ± 0.2 | 26.6 ± 0.3 | 0.32 |
| GO 5 min | 1355.5 ± 1.0 | 166.0 ± 3.0 | 1578.3 ± 1.0 | 101.0 ± 2.0 | 0.91 |
| GO 15 min | 1345.5 ± 1.0 | 145.0 ± 3.0 | 1587.0 ± 1.0 | 101.0 ± 2.0 | 0.97 |
| GO 30 min | 1352.5 ± 1.0 | 175.0 ± 3.0 | 1584.9 ± 0.9 | 102.0 ± 2.0 | 1.02 |
| GO 1 h | 1354.1 ± 1.0 | 167.2 ± 2.0 | 1582.5 ± 0.8 | 98.8 ± 2.0 | 1.04 |
| GO 3 h | 1354.9 ± 1.0 | 164.0 ± 2.0 | 1582.8 ± 0.9 | 98.5 ± 2.0 | 1.09 |
| GO 24 h | 1352.4 ± 1.0 | 162.0 ±2.0 | 1581.0 ± 0.8 | 100.8 ± 2.0 | 1.17 |
| c-GO I | 1368.5 ± 1.0 | 171.9 ± 3.0 | 1585.0 ± 0.7 | 105.7 ± 1.0 | 1.00 |
| c-GO II | 1365.5 ± 3.0 | 154.5 ± 8.0 | 1584.5 ± 2.0 | 108.9 ± 1.0 | 0.89 |
Publisher’s Note: MDPI stays neutral with regard to jurisdictional claims in published maps and institutional affiliations. |
© 2021 by the authors. Licensee MDPI, Basel, Switzerland. This article is an open access article distributed under the terms and conditions of the Creative Commons Attribution (CC BY) license (http://creativecommons.org/licenses/by/4.0/).
Share and Cite
Costa, M.C.F.; Marangoni, V.S.; Ng, P.R.; Nguyen, H.T.L.; Carvalho, A.; Castro Neto, A.H. Accelerated Synthesis of Graphene Oxide from Graphene. Nanomaterials 2021, 11, 551. https://doi.org/10.3390/nano11020551
Costa MCF, Marangoni VS, Ng PR, Nguyen HTL, Carvalho A, Castro Neto AH. Accelerated Synthesis of Graphene Oxide from Graphene. Nanomaterials. 2021; 11(2):551. https://doi.org/10.3390/nano11020551
Chicago/Turabian StyleCosta, Mariana C. F., Valeria S. Marangoni, Pei Rou Ng, Hang T. L. Nguyen, Alexandra Carvalho, and A. H. Castro Neto. 2021. "Accelerated Synthesis of Graphene Oxide from Graphene" Nanomaterials 11, no. 2: 551. https://doi.org/10.3390/nano11020551