
Towards the Development of Antioxidant Cerium Oxide Nanoparticles for Biomedical Applications: Controlling the Properties by Tuning Synthesis Conditions


 , ,
, ,  , and
, and
Abstract
:1. Introduction
2. Materials and Methods
2.1. Materials
2.2. Synthesis of Alkylamine Coated CeO2-NPs
2.3. Functionalization of CeO2-NPs with Sodium Oleate
2.4. Wide-Angle X-ray Diffraction Analysis (XRD)
2.5. Dynamic Light Scattering (DLS)
2.6. Transmission Electron Microscope (TEM)
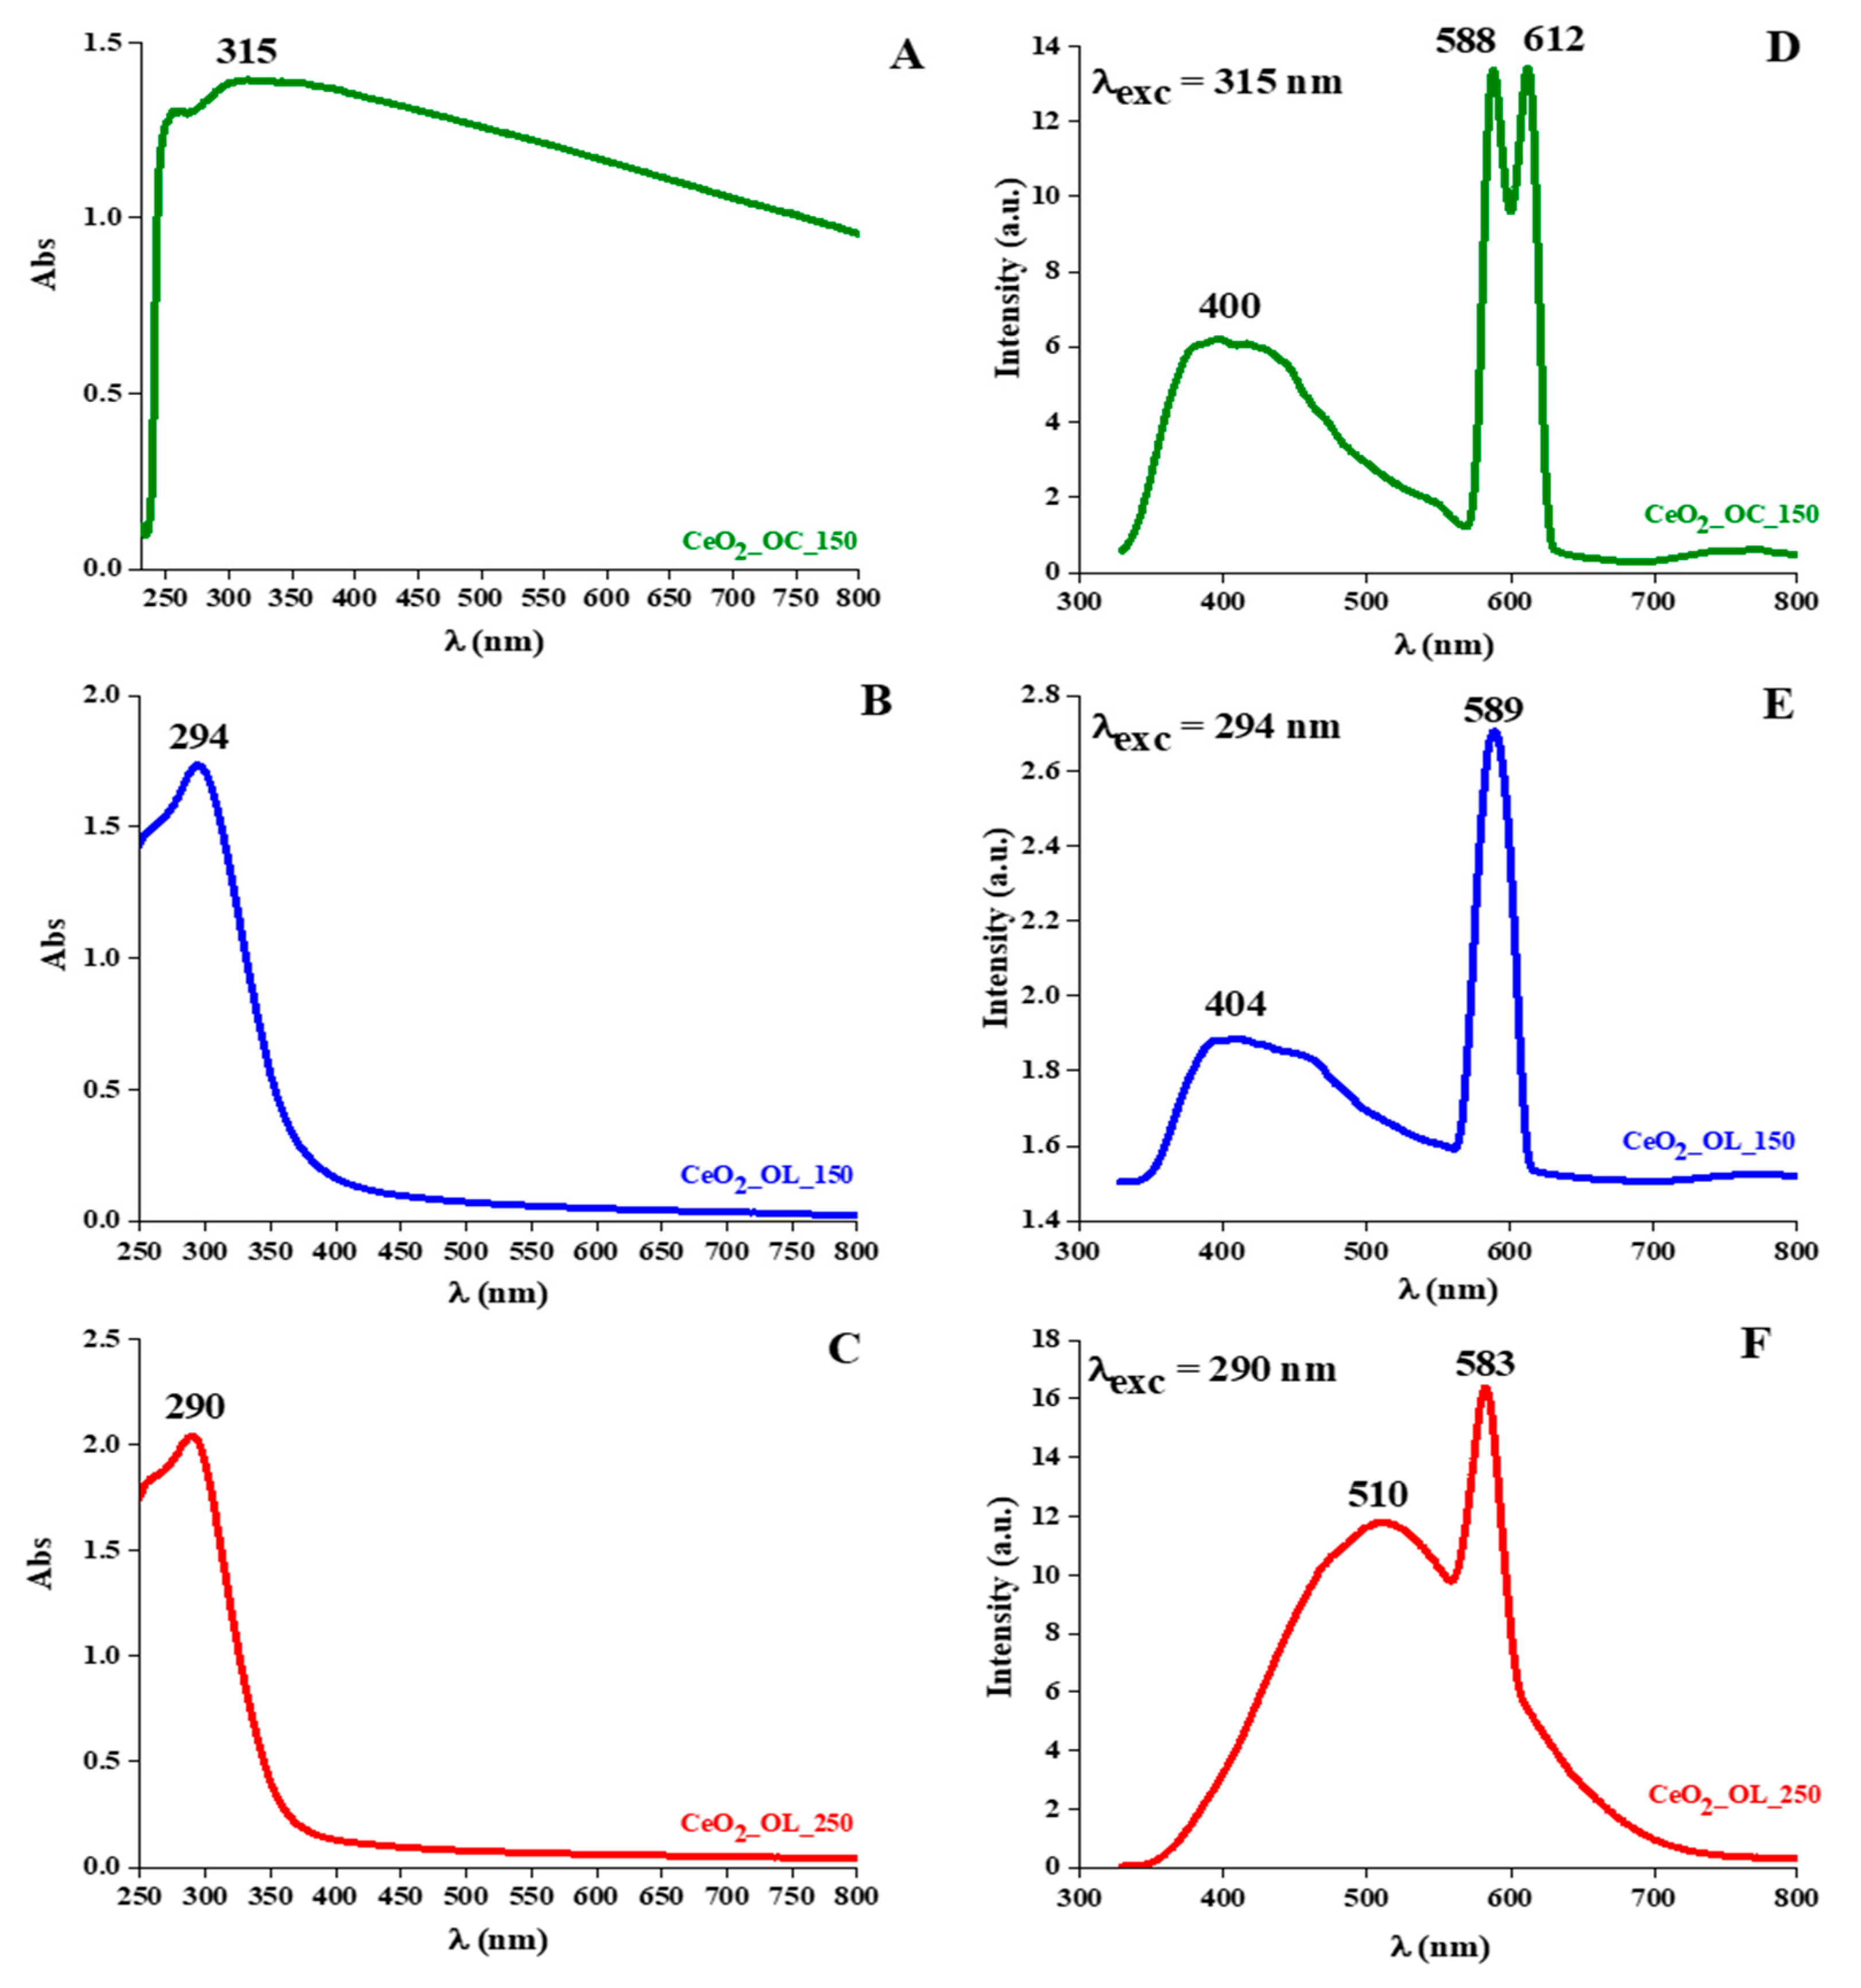
2.7. UV-Visible Spectroscopy
2.8. Fluorescence Spectroscopy
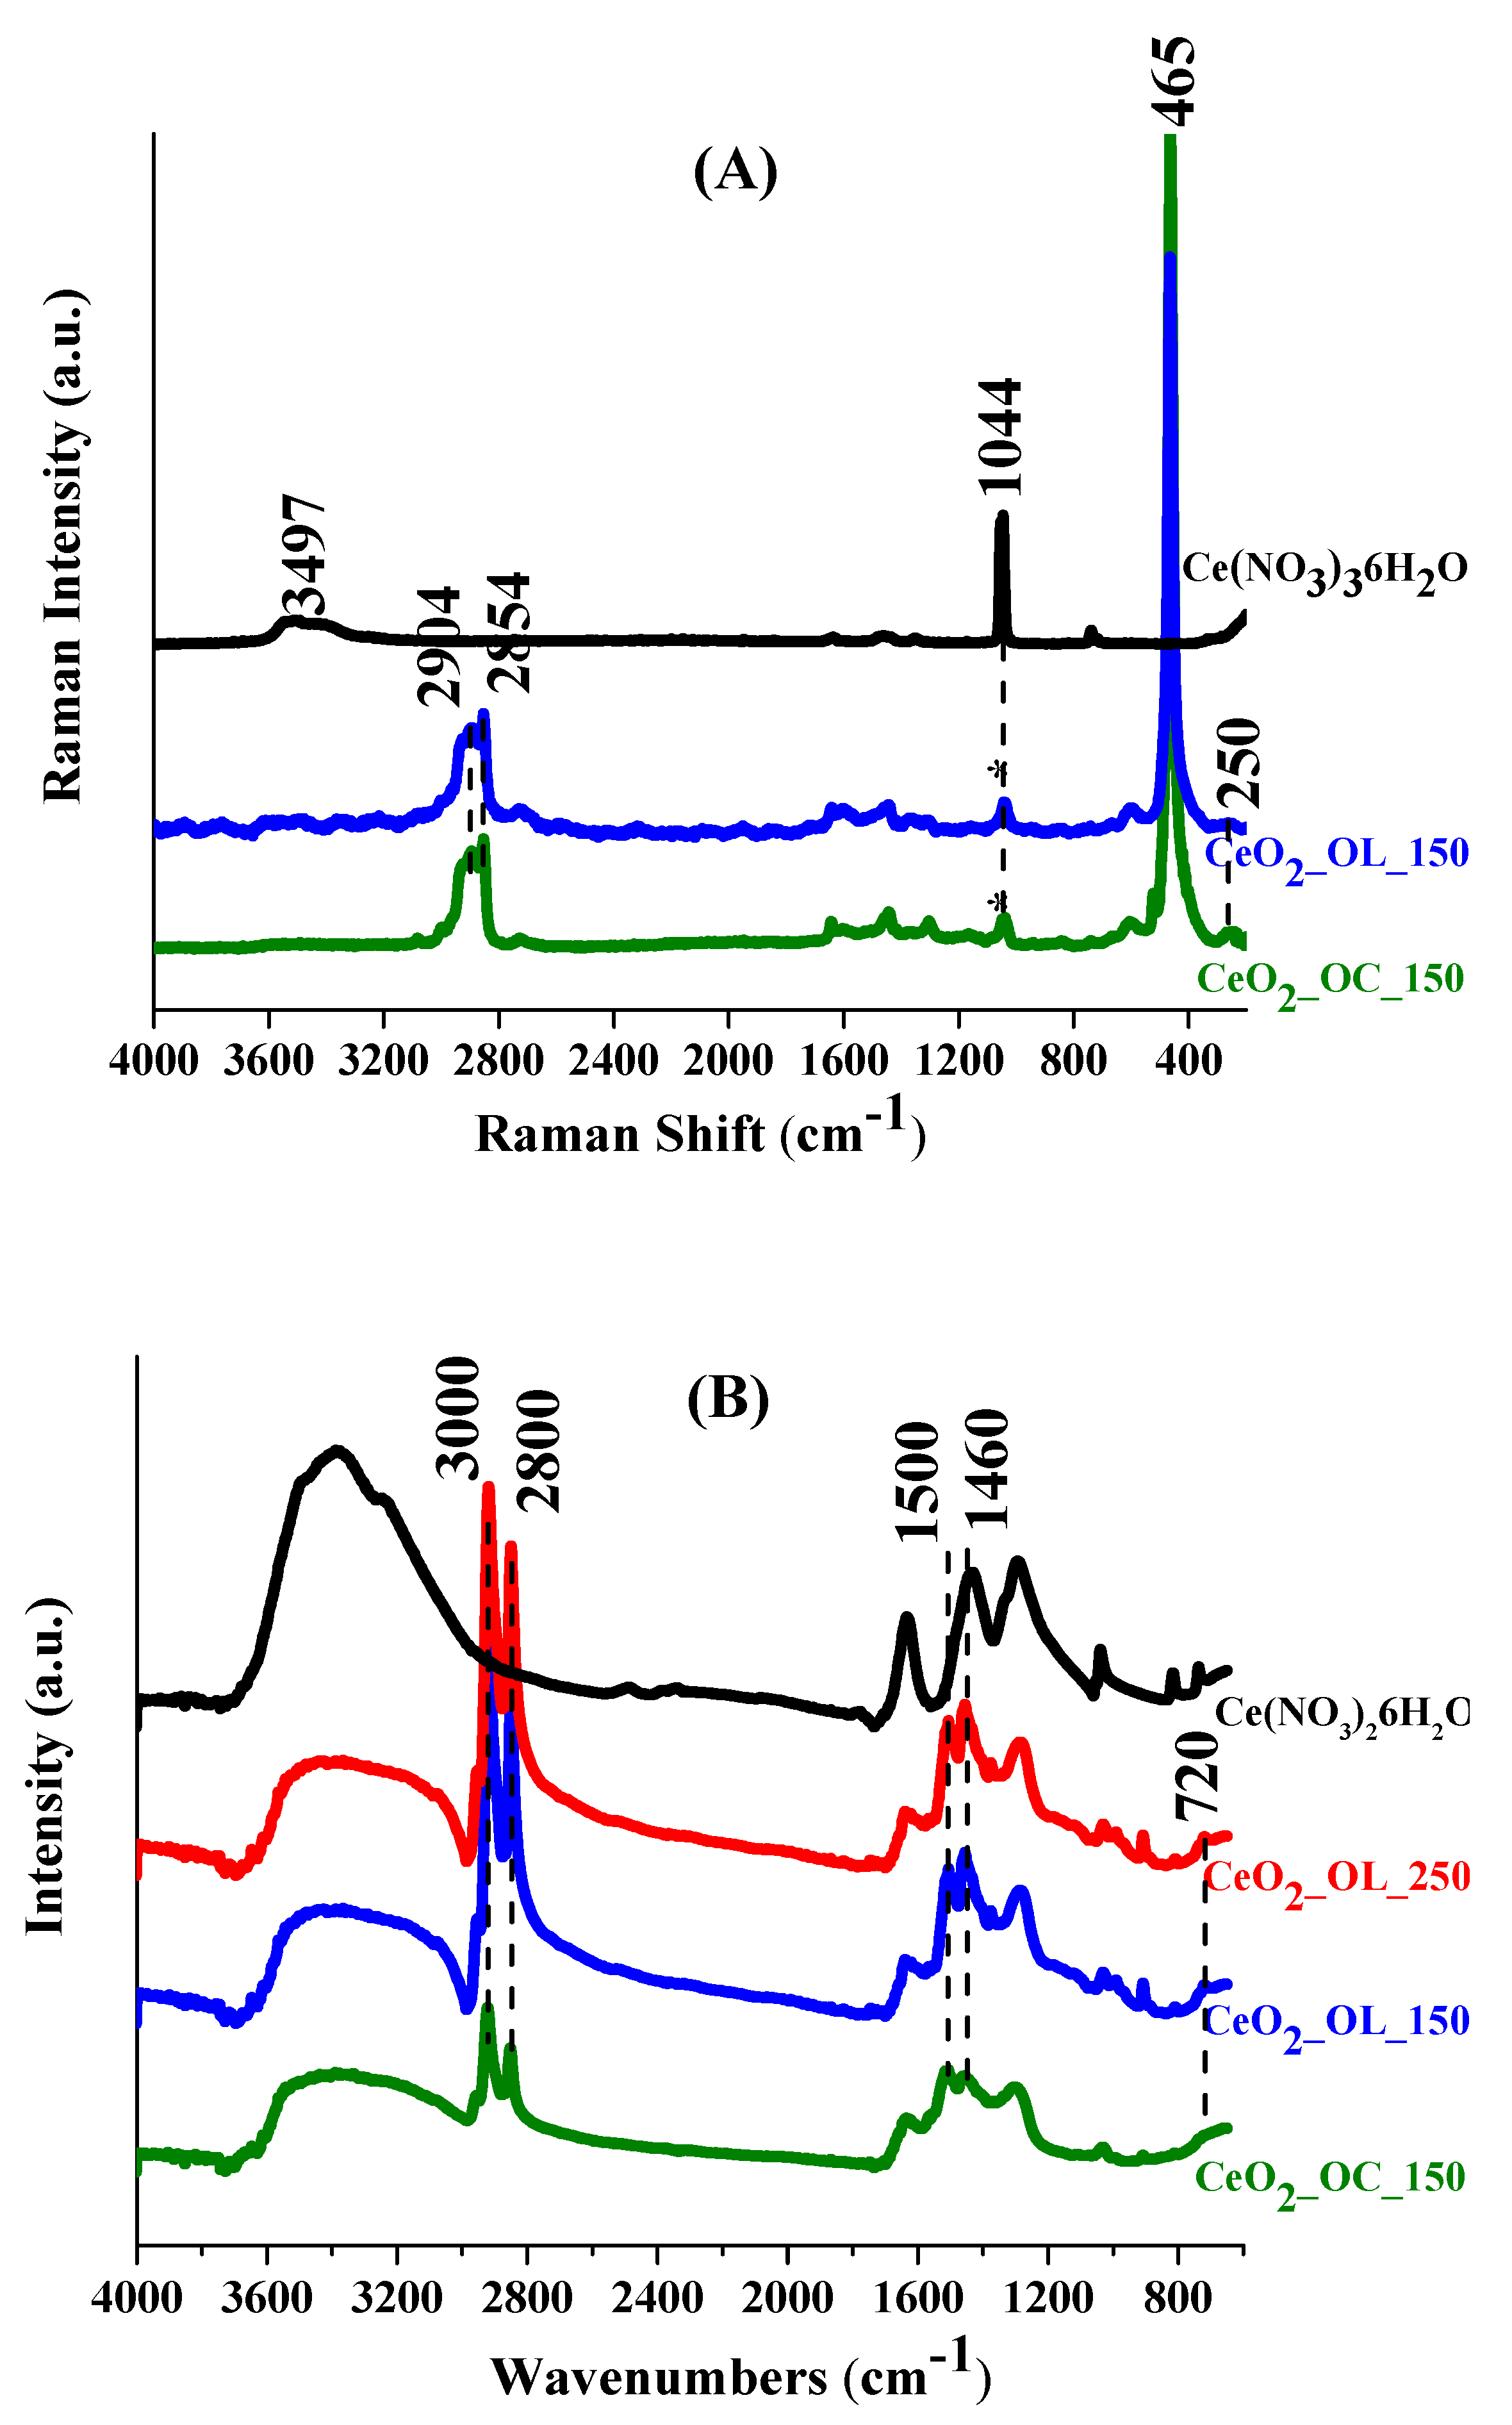
2.9. Raman Spectroscopy
2.10. FTIR Spectroscopy
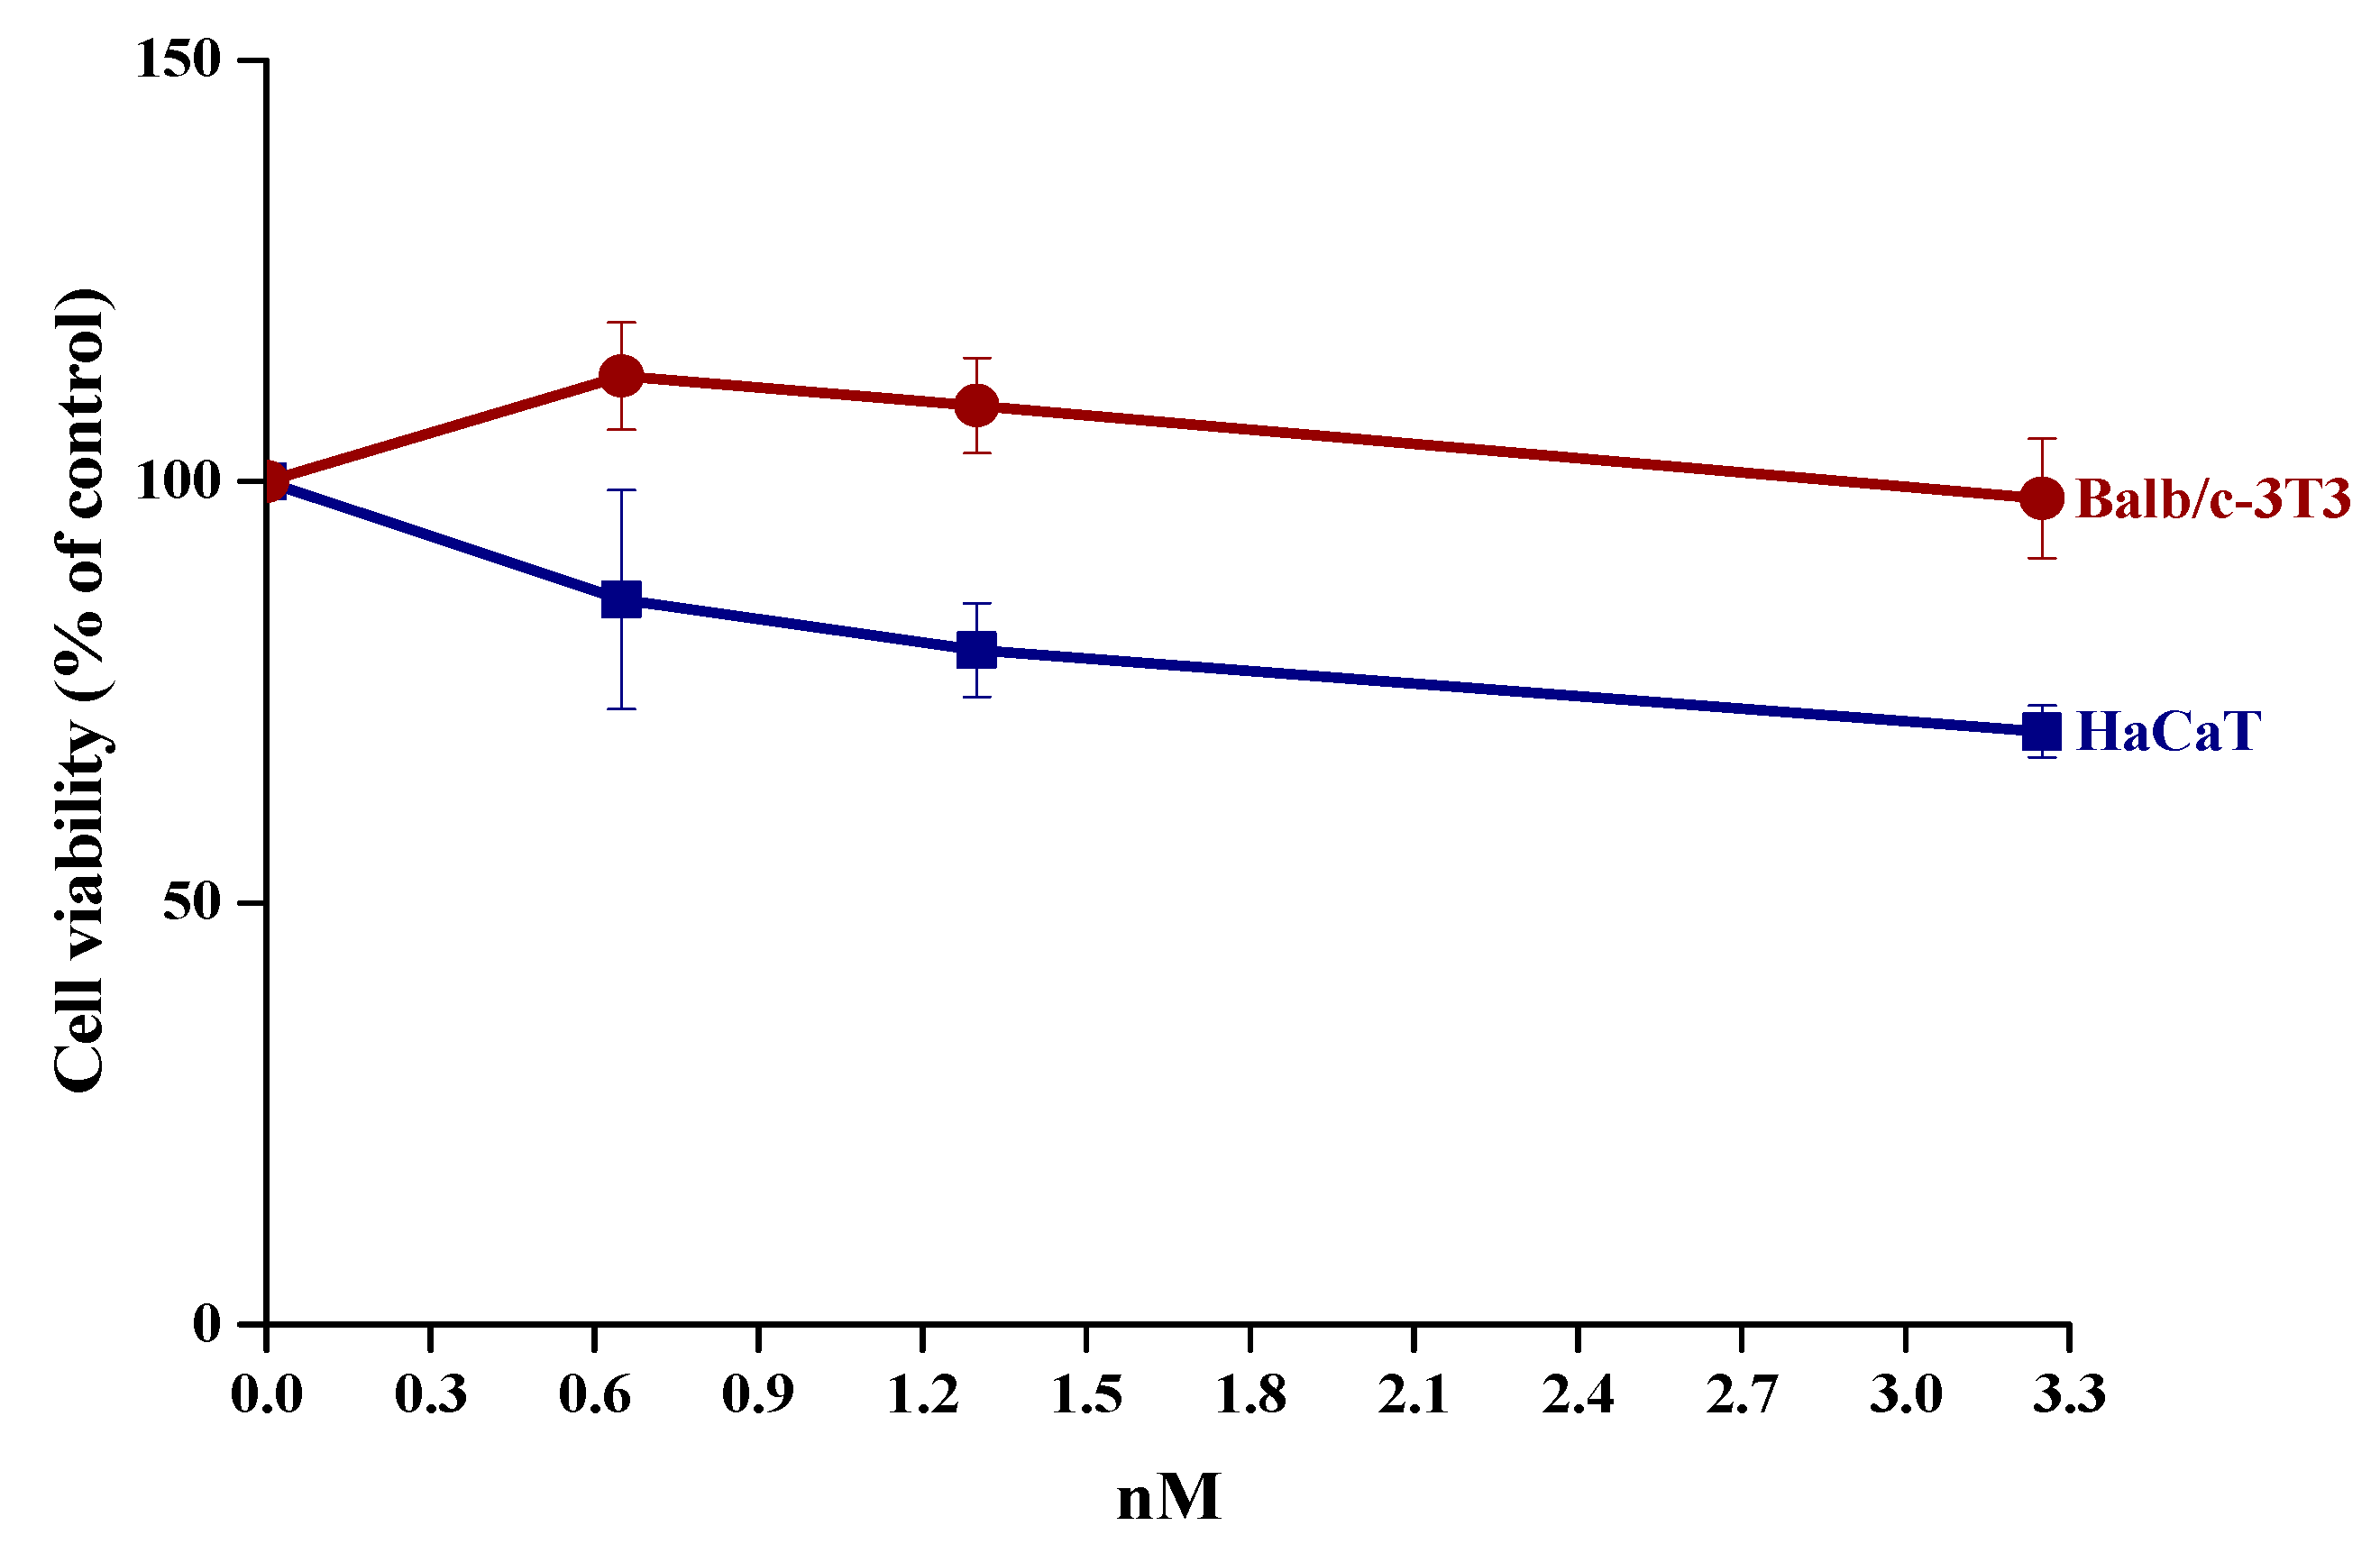
2.11. Cell Culture and MTT Assay
2.12. DCFDA Assay
3. Results
3.1. NP Characterization
3.2. Coating Characterization
3.3. Spectroscopic Properties
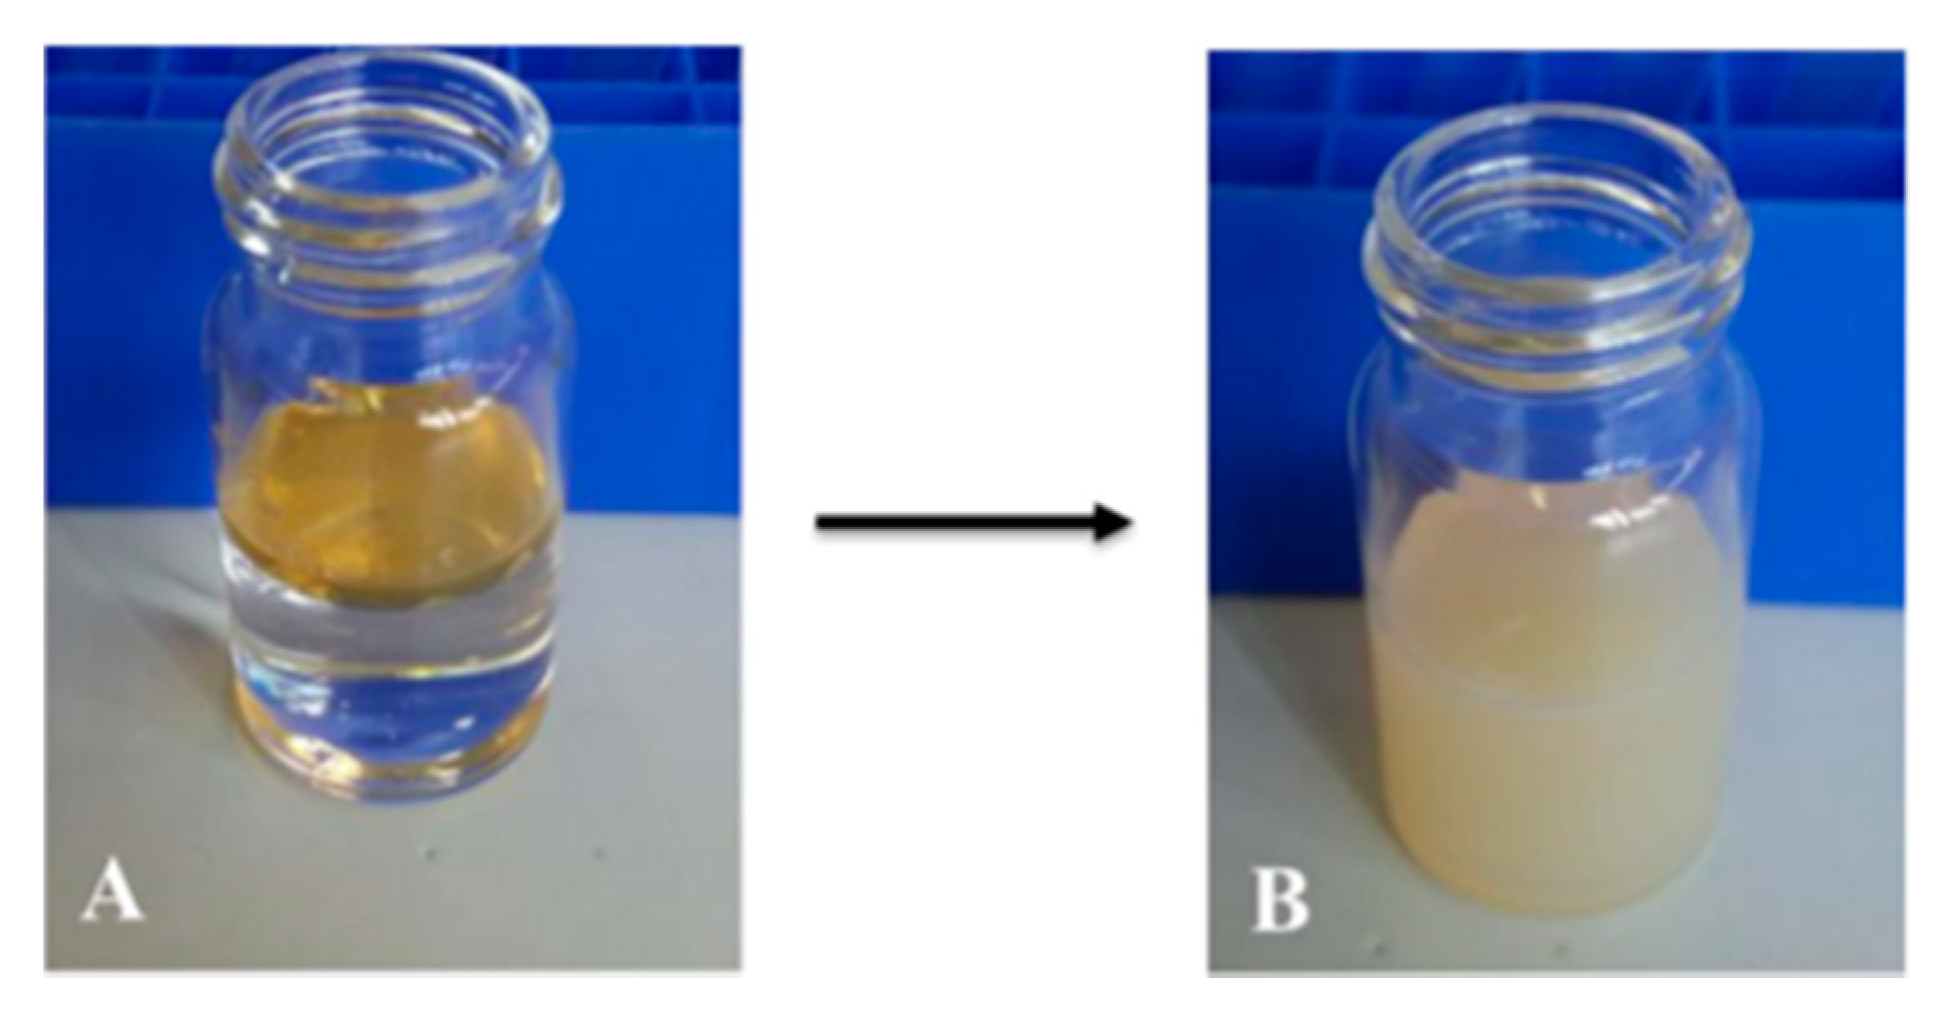
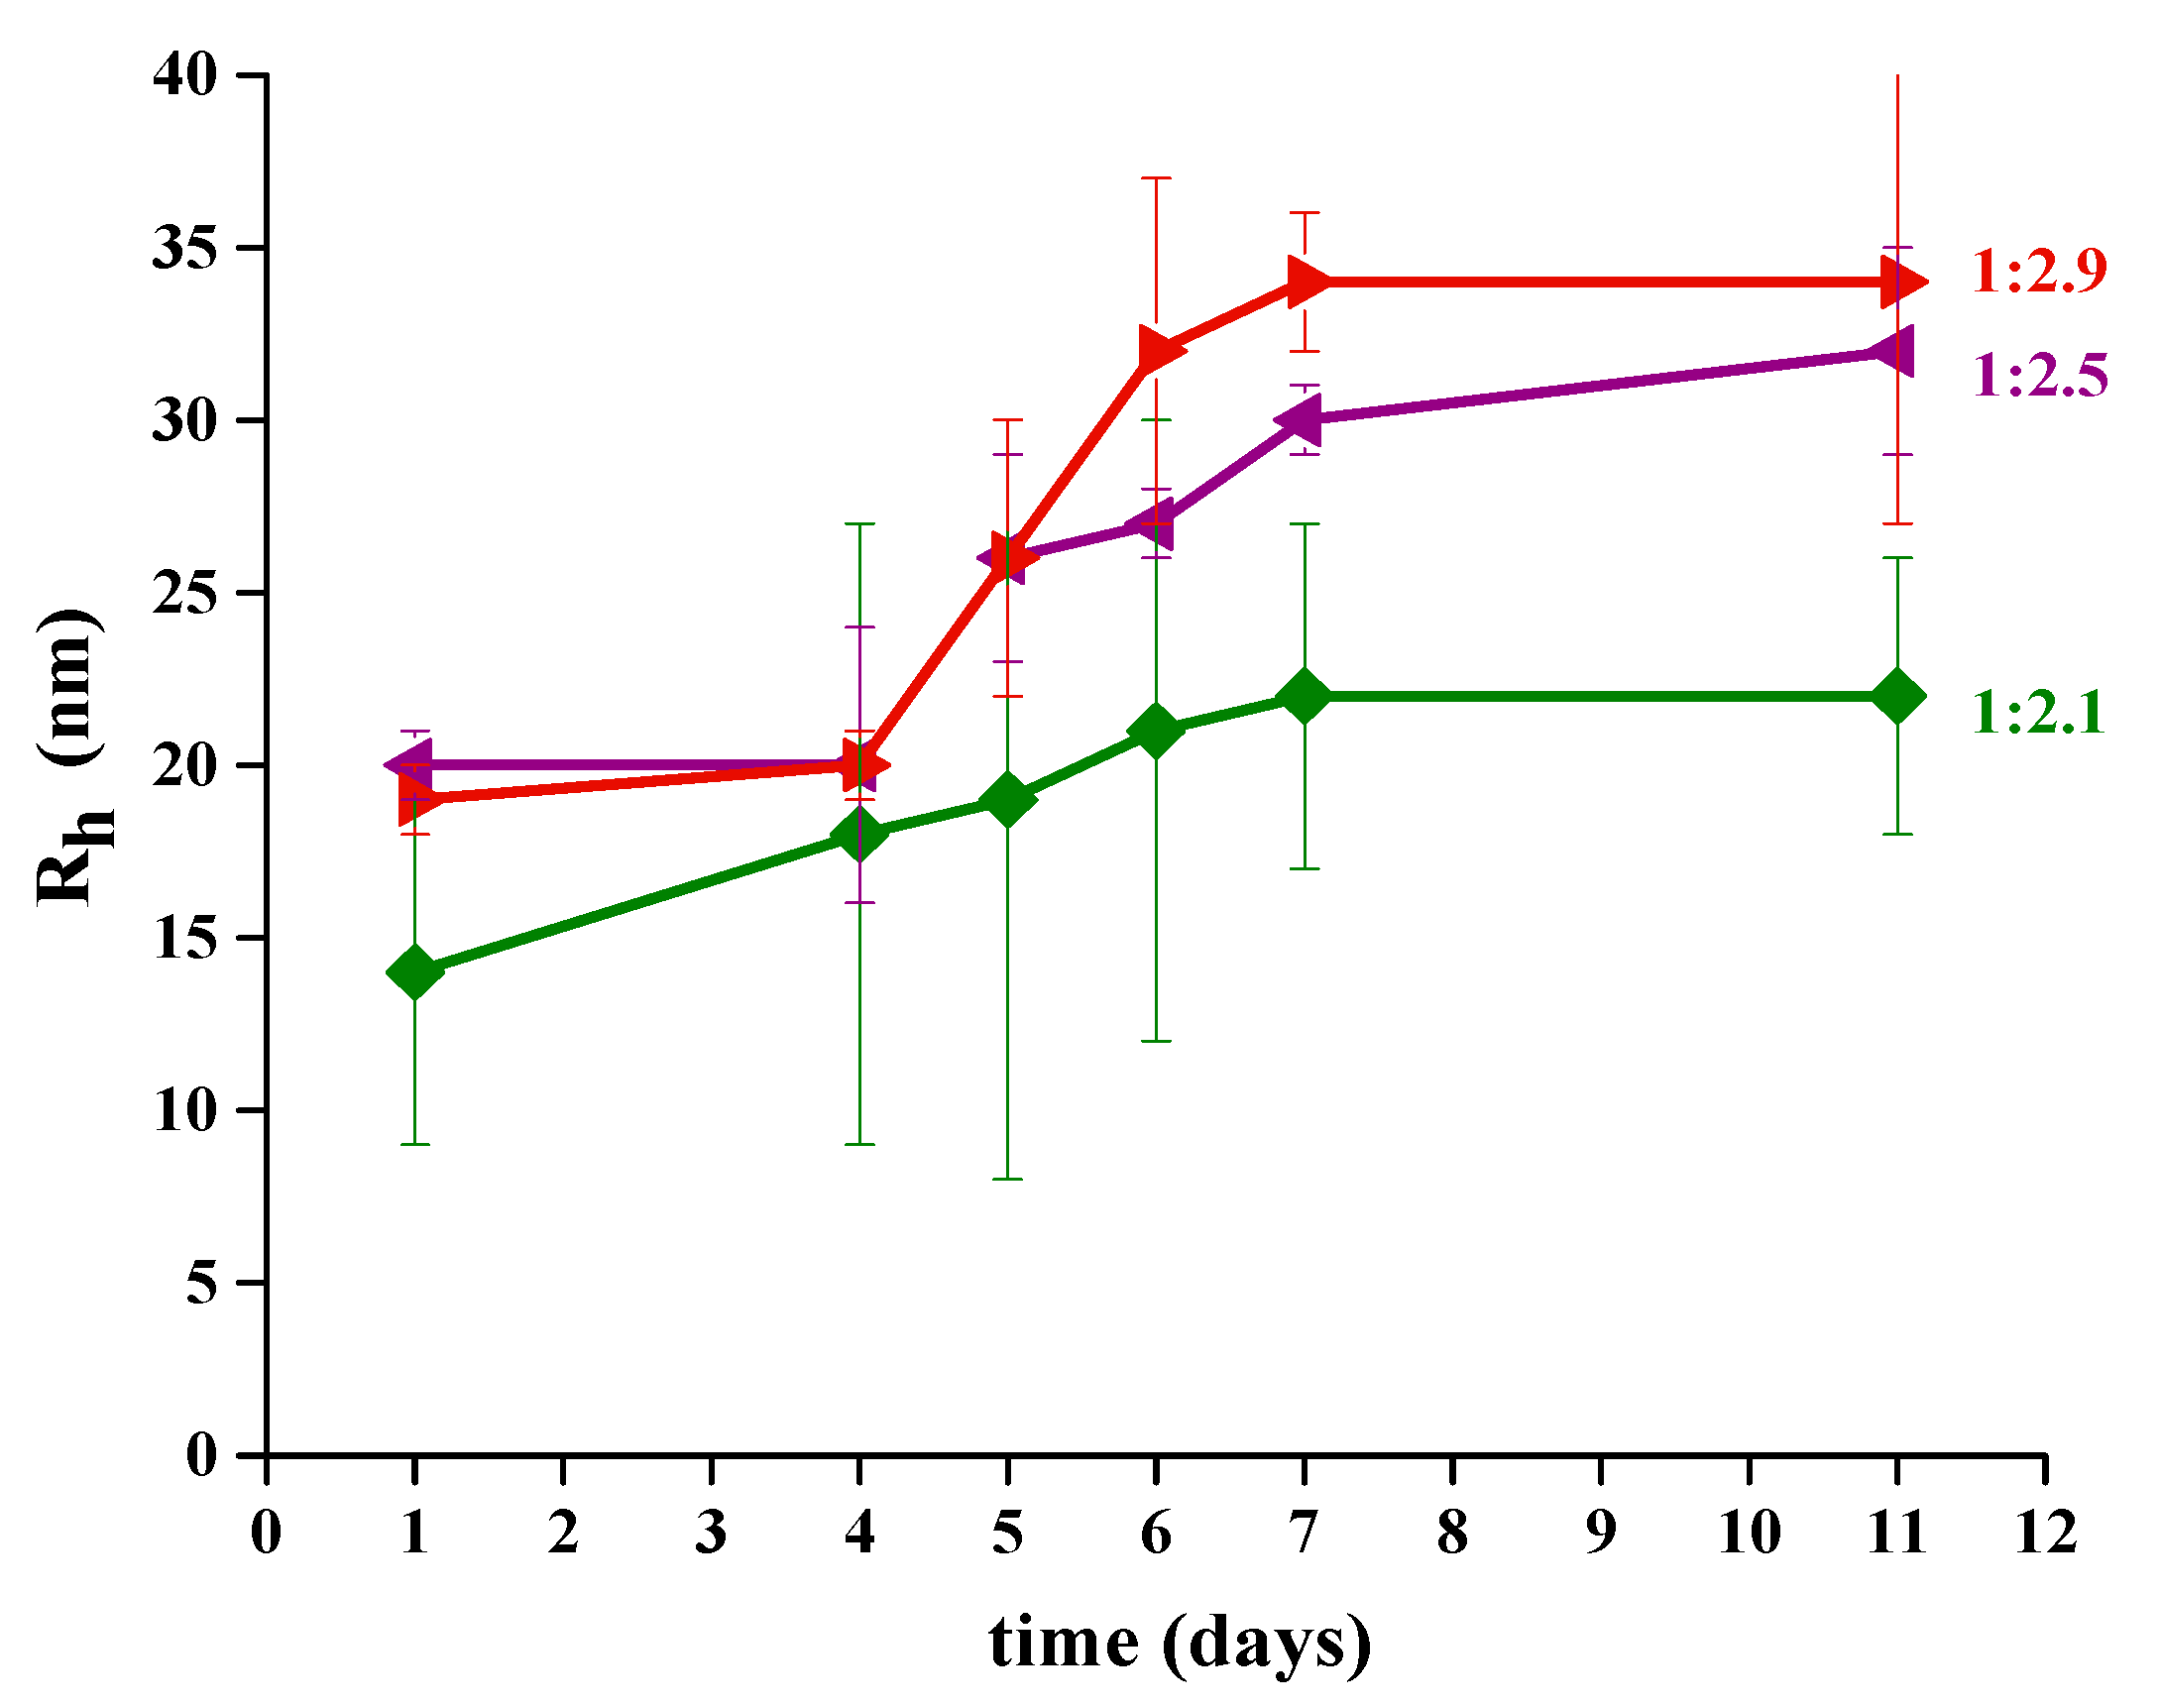
3.4. Functionalization of CeO2-NPs with Sodium Oleate
3.5. Evaluation of Biocompatibility of NaOl/CeO2-NPs on Eukaryotic Cells
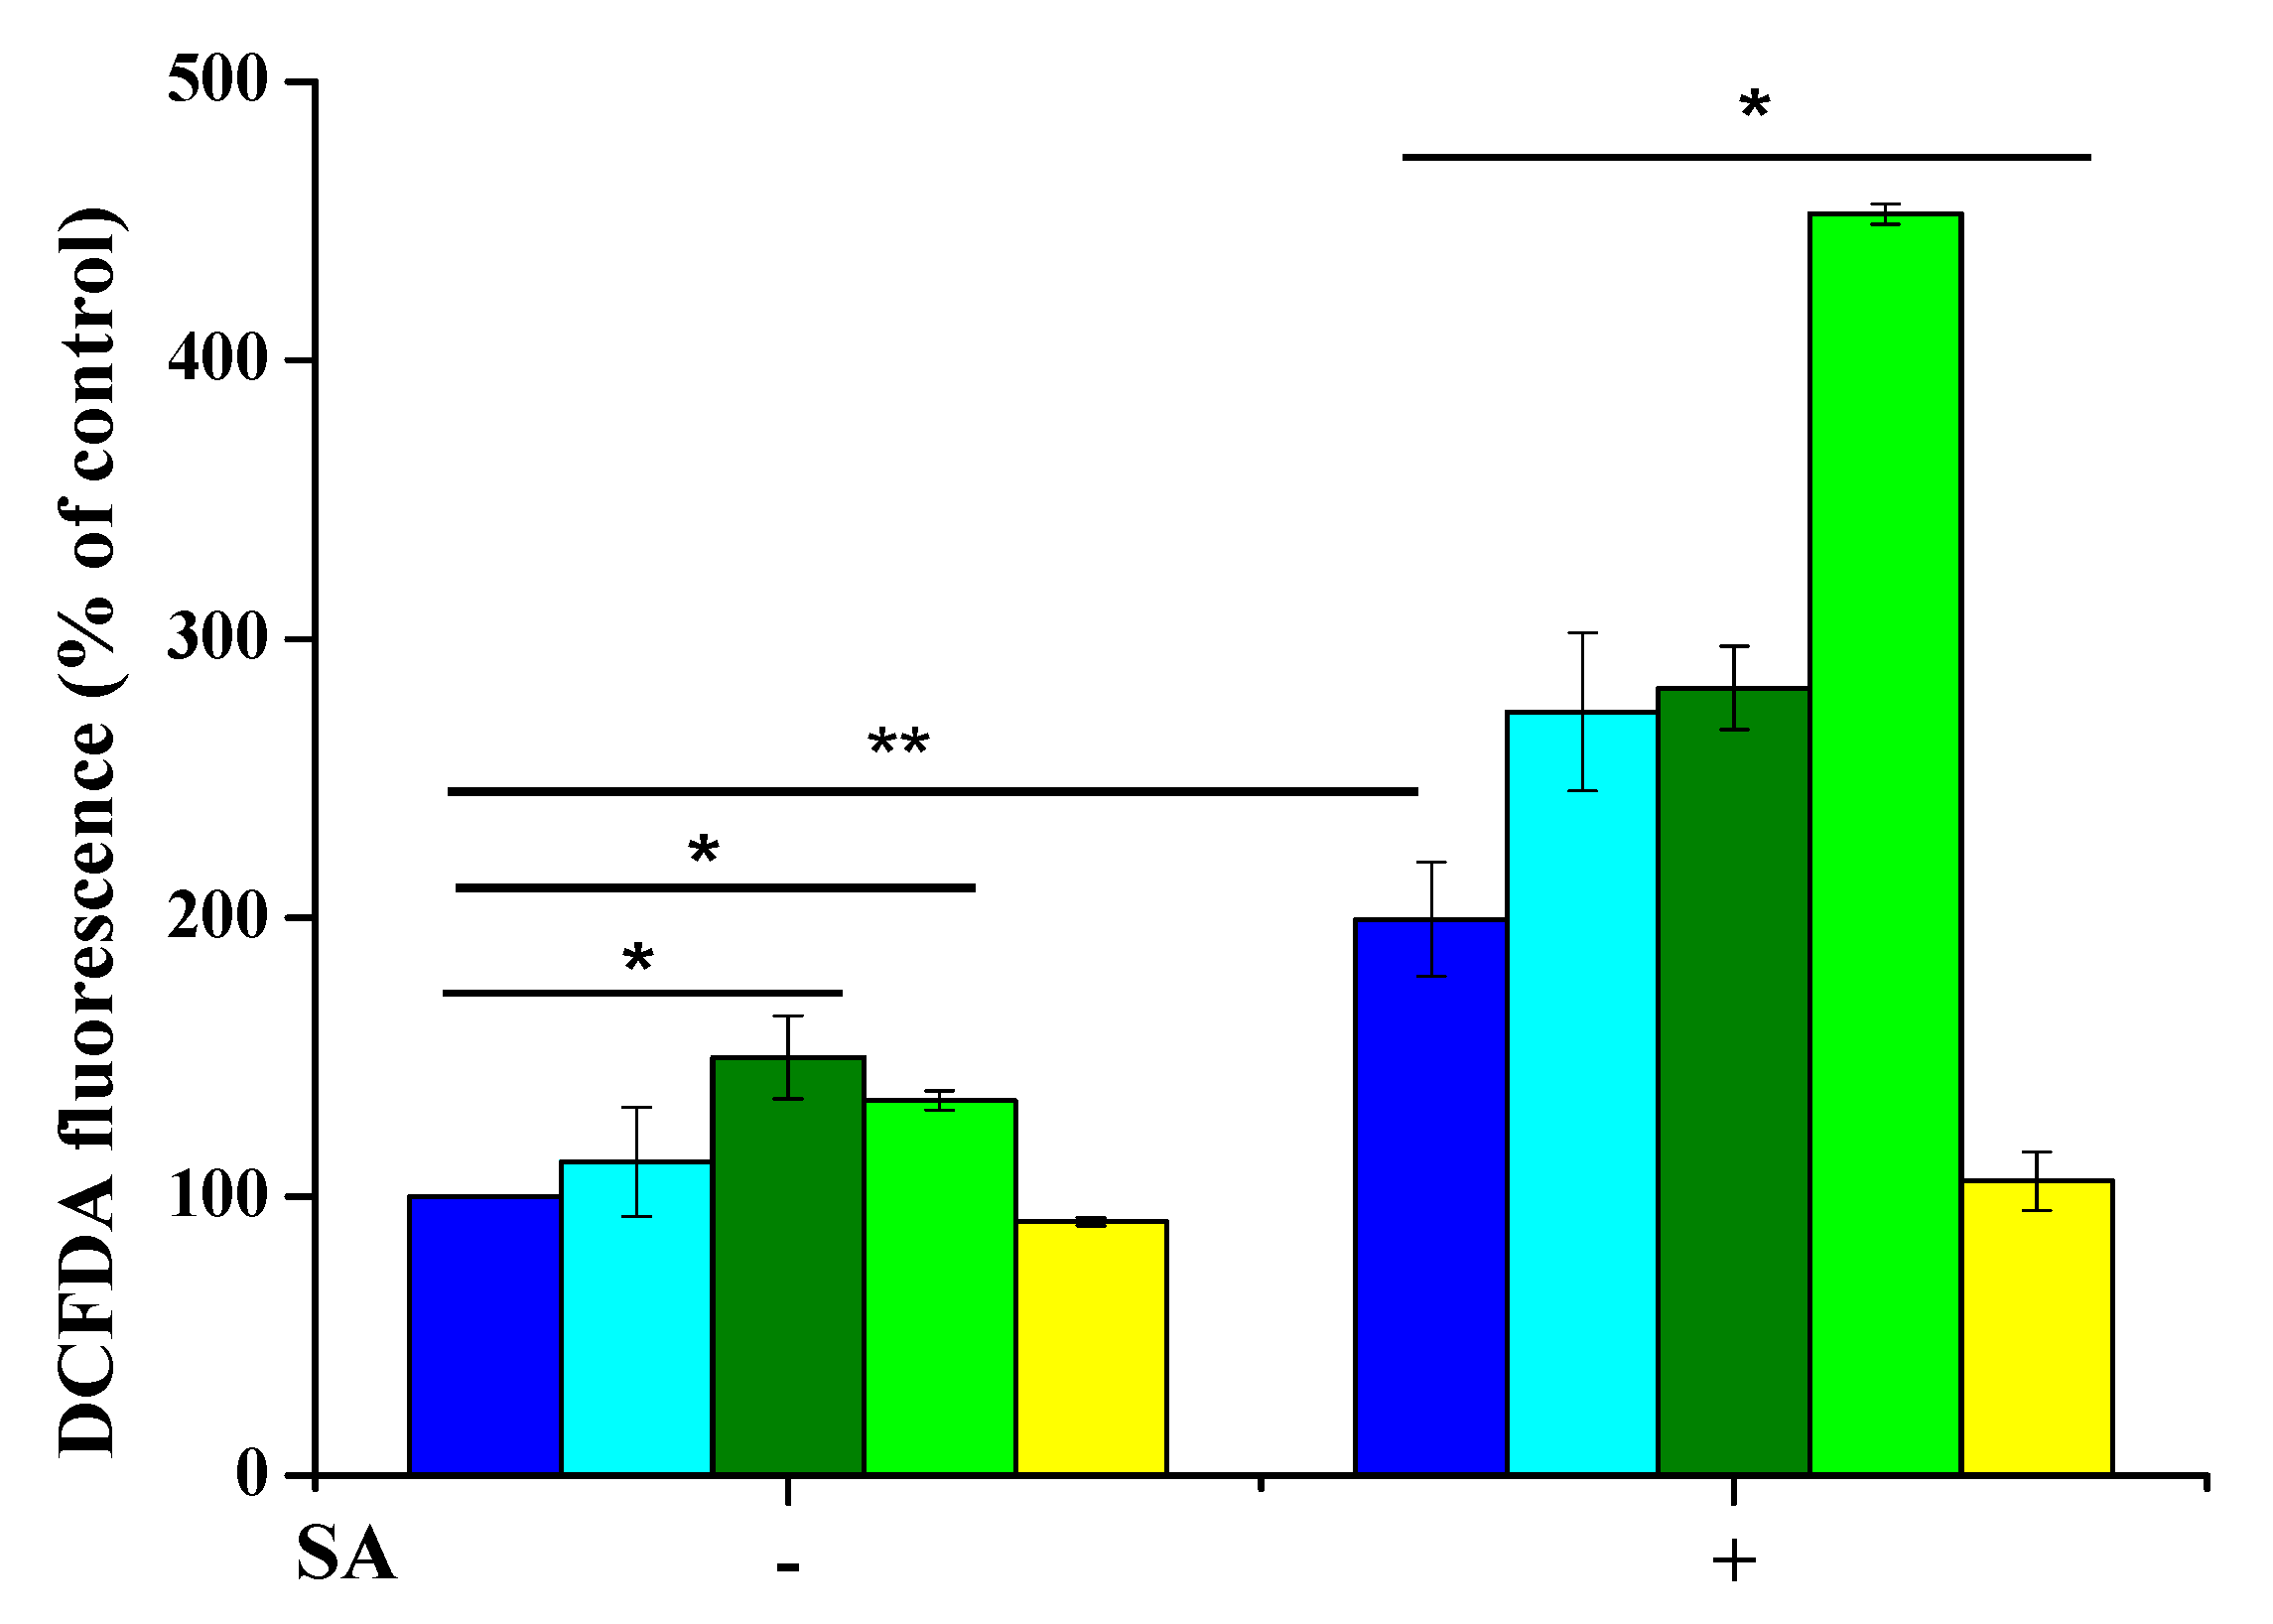
3.6. Determination of Intracellular ROS Levels
4. Discussion
5. Conclusions
Supplementary Materials
Author Contributions
Funding
Data Availability Statement
Conflicts of Interest
References
- Heckert, E.G.; Karakoti, A.S.; Seal, S.; Self, W.T. The role of cerium redox state in SOD mimetic activity of nanoceria. Biomaterials 2008, 29, 2705–2709. [Google Scholar] [CrossRef] [Green Version]
- Farahmandjou, M.; Zarinkamar, M.; Firoozabadi, T.P. Synthesis of cerium oxide (CeO2) nanoparticles using simple CO-precipitation method. Rev. Mex. Física 2016, 62, 496–499. [Google Scholar]
- Rajeshkumar, S.; Naik, P. Synthesis and biomedical application of cerium oxide nanoparticles—A review. Biotechnol. Rep. 2018, 17, 1–5. [Google Scholar] [CrossRef] [PubMed]
- Mullins, D.R. The surface chemistry of cerium oxide. Surf. Sci. Rep. 2015, 70, 42–85. [Google Scholar] [CrossRef] [Green Version]
- Liyin, H.; Yumin, S.; Lanhong, J.; Shikao, S. Recent advances of cerium oxide nanoparticles in synthesis, luminescence and biomedical studies: A review. J. Rare Earths 2015, 33, 791–799. [Google Scholar]
- Yamashita, M.; Kameyama, K.; Yabe, S.; Yoshida, S.; Fujishiro, Y.; Kawai, T.; Sato, T. Synthesis and microstructure of calcia doped ceria as UV filters. J. Mater. Sci. 2002, 37, 683–687. [Google Scholar] [CrossRef]
- Montini, T.; Melchionna, M.; Monai, M.; Fornasiero, P. Fundamentals and catalytic applications of CeO2-based materials. Chem. Rev. 2016, 116, 5987–6041. [Google Scholar] [CrossRef]
- Armini, S.; De Messemaeker, J.; Whelan, C.M.; Moinpour, M.; Maex, K. Composite polymer core-ceria shell abrasive particles during oxide CMP: A defectivity study. J. Electrochem. Soc. 2008, 155, H653–H660. [Google Scholar] [CrossRef]
- Mei, Z.; Xidong, W.; Fuming, W.; Wenchao, L. Oxygen sensitivity of nano CeO2 coating TiO2 materials. Sen. Actuators B 2003, 92, 167–170. [Google Scholar] [CrossRef]
- Auffan, M.; Rose, J.; Orsiere, T.; De Meo, M.; Thill, A.; Zeyons, O.; Proux, O.; Masion, A.; Chaurand, P.; Spalla, O.; et al. CeO2 nanoparticles induce DNA damage towards human dermal fibroblasts in vitro. Nanotoxicology 2009, 3, 161–171. [Google Scholar] [CrossRef]
- Gao, Y.; Chen, K.; Ma, J.I.; Gao, F. Cerium oxide nanoparticles in cancer. OncoTargets Ther. 2014, 7, 835–840. [Google Scholar] [CrossRef] [Green Version]
- Nyoka, M.; Choonara, Y.E.; Kumar, P.; Kondiah, P.P.D.; Pillay, V. Synthesis of cerium oxide nanoparticles using various methods: Implications for biomedical applications. Nanomaterials 2020, 10, 242. [Google Scholar] [CrossRef] [PubMed] [Green Version]
- Wu, J.; Wand, X.; Wang, Q.; Lou, Z.; Li, S.; Zhy, Y.; Qin, L.; Wei, H. Nanomaterials with enzyme-like characteristics (nanozymes): Next generation artificial enzymes. Chem. Soc. Rev. 2019, 48, 1004–1076. [Google Scholar]
- Walkey, C.; Das, S.; Seal, S.; Erlichman, J.; Heckman, K.; Ghibelli, L.; Traversa, E.; McGinnis, J.F.; Self, W.T. Catalytic properties and biomedical applications of cerium oxide nanoparticles. Environ. Sci. Nano 2015, 2, 33–53. [Google Scholar] [CrossRef] [PubMed]
- Dhall, A.; Self, W. Cerium oxide nanoparticles: A brief review of their synthesis methods and biomedical applications. Antioxidants 2018, 7, 97. [Google Scholar] [CrossRef] [Green Version]
- Kwon, H.J.; Shin, K.; Soh, M.; Chang, H.; Kim, J.; Lee, J.; Ko, G.; Kim, B.H.; Kim, D.; Hyeon, T. Large-scale synthesis and medical applications of uniform-sized metal oxide nanoparticles. Adv. Mater. 2018, 30, 1–24. [Google Scholar] [CrossRef] [PubMed]
- Spezzanti, G.; Fant, K.; Ahniyaz, A.; Lundin-Johnson, M.; Hensen, E.J.M.; Langermans, H.; Hofmann, J.P. Synthesis, physicochemical characterization, and cytotoxicity assessment of CeO2 nanoparticles with different morphologies. Eur. J. Inorg. Chem. 2017, 3184–3190. [Google Scholar] [CrossRef]
- Lee, S.S.; Song, W.; Cho, M.; Puppala, H.L.; Nguyen, P.; Zhu, H.; Segatori, L.; Colvin, V.L. Antioxidant properties of cerium oxide nanocrystals as a function of nanocrystal diameter and surface coating. ACS Nano 2013, 7, 9693–9703. [Google Scholar] [CrossRef]
- Calvache-Muñoz, J.; Prado, F.A.; Rodriguez-Páez, J.E. Cerium oxide nanoparticles: Synthesis, characterization and tentative mechanism of particle formation. Colloids Surf. A 2017, 529, 146–159. [Google Scholar] [CrossRef]
- Caputo, F.; Mameli, M.; Sienkiewicz, A.; Licoccia, S.; Stellacci, F.; Ghibelli, L.; Traversa, E. A novel synthetic approach of cerium oxide nanoparticles with improved biomedical activity. Nature 2017, 7, 4636. [Google Scholar] [CrossRef] [Green Version]
- Hirst, S.M.; Karakoti, A.S.; Tyler, R.D.; Sriranganathan, N.; Seal, S.; Reilly, C.M. Anti-inflammatory properties of cerium oxide nanoparticles. Small 2009, 5, 2848–2856. [Google Scholar] [CrossRef]
- Ali, D.; Alarifi, S.; Alkahtani, S.; Alkahtane, A.A.; Almalik, A. Cerium oxide nanoparticles induce oxidative stress and genotoxicity in human skin melanoma cells. Cell Biochem. Biophys. 2015, 71, 1643–1651. [Google Scholar] [CrossRef] [PubMed]
- Sadowska-Bartosz, I.; Bartosz, G. Redox nanoparticles: Synthesis, properties and perspectives of use for treatment of neurodegenerative diseases. J. Nanobiotechnol. 2018, 16, 87. [Google Scholar] [CrossRef] [PubMed] [Green Version]
- Grulke, E.; Reed, K.; Beck, M.; Huang, X.; Cormack, A.; Seal, S. Nanoceria: Factor affecting its pro-oxidant and anti-oxidant properties. Environ. Sci. Nano 2014, 1, 429–444. [Google Scholar] [CrossRef]
- Karakoti, A.; Singh, S.; Dowding, J.M.; Seal, S.; Self, W.T. Redox-active radical scavenging nanomaterials. Chem. Soc. Rev. 2010, 39, 4422–4432. [Google Scholar] [CrossRef]
- Heuer-Jungemann, A.; Feliu, N.; Bakaimi, I.; Hamalv, M.; Alkilany, A.; Chakraborty, I.; Masood, A.; Casula, M.F.; Kostopoulou, A.; Oh, E.; et al. The role of ligands in the chemical synthesis and applications of inorganic nanoparticles. Chem. Rev. 2019, 119, 4819–4880. [Google Scholar] [CrossRef] [Green Version]
- Clemons, T.D.; Kerr, R.H.; Joos, A. Multifunctional magnetic nanoparticles: Design, synthesis, and biomedical applications. Compr. Nanosci. Nanotechnol. 2019, 3, 193–210. [Google Scholar]
- Wu, W.; Jiang, C.Z.; Roy, V.A.L. Designed synthesis and surface engineering strategies of magnetic iron oxide nanoparticles for biomedical applications. Nanoscale 2016, 8, 19421–19474. [Google Scholar] [CrossRef] [PubMed]
- Huang, L.; Liao, M.; Chen, S.; Demillo, V.G.; Dupre, S.A.; Zhu, X.; Publicover, N.G.; Hunter, K.W., Jr. A polymer encapsulation approach to prepare zwitterion-like, biocompatible quantum dots with wide pH and ionic stability. J. Nanopart. Res. 2014, 16, 1–9. [Google Scholar] [CrossRef] [Green Version]
- Zhao, Y.; Döhler, D.; Lv, L.; Binder, W.H.; Landfester, K.; Crespy, D. Facile phase-separation approach to encapsulate functionalized polymers in core-shell nanoparticles. Macromol. Chem. Phys. 2014, 215, 198–204. [Google Scholar] [CrossRef]
- Luchini, A.; Vitiello, G.; Rossi, F.; De Ballesteros, O.R.; Radulescu, A.; D’Errico, G.; Montesarchio, D.; Fernández, C.d.J.; Paduano, L. Developing functionalized Fe3O4-Au nanoparticles: A physico-chemical insight. Phys. Chem. Chem. Phys. 2015, 17, 6087–6097. [Google Scholar] [CrossRef] [PubMed]
- Dong, A.; Ye, X.; Chen, J.; Kang, Y.; Gordon, T.; Kikkawa, J.M.; Murray, C.B. A generalized ligand-exchange strategy enabling sequential surface functionalization of colloidal nanocrystals. J. Am. Chem. Soc. 2011, 4, 998–1006. [Google Scholar] [CrossRef] [PubMed]
- Liu, Y.; Chen, T.; Wu, C.; Qiu, L.; Hu, R.; Li, J.; Cansiz, S.; Zhang, L.; Cui, C.; Zhu, G.; et al. Facile surface functionalization of hydrophobic magnetic nanoparticles. J. Am. Chem. Soc. 2014, 136, 12552–12555. [Google Scholar] [CrossRef] [PubMed]
- Wei, H.; Insin, N.; Lee, J.; Han, H.; Cordero, J.M.; Liu, W.; Bawendi, M.G. Compact Zwitterion-Coated Iron Oxide Nanoparticles for Biological Applications. Nano Lett. 2012, 12, 22–25. [Google Scholar] [CrossRef] [PubMed] [Green Version]
- Woehrle, G.H.; Brown, L.O.; Hutchison, J.E. Thiol-functionalized, 1.5nm gold nanoparticles through ligand exchange reactions: Scope and mechanism of ligand exchange. J. Am. Chem. Soc. 2005, 127, 2172–2183. [Google Scholar] [CrossRef]
- Tso, C.; Zhung, C.; Shih, Y.; Tseng, Y.; Wu, S.; Doong, R. Stability of metal oxide nanoparticles in aqueous solutions. Water Sci. Technol. 2010, 61, 127–133. [Google Scholar] [CrossRef] [PubMed] [Green Version]
- Keller, A.A.; Wang, H.; Zhou, D.; Lenihan, H.S.; Cherr, G.; Cardinale, B.J.; Miller, R.; Ji, Z. Stability and aggregation of metal oxide nanoparticles in natural aqueous matrices. Environ. Sci. Technol. 2010, 44, 1962–1967. [Google Scholar] [CrossRef]
- Oriekhova, O.; Stoll, S. Stability of uncoated and fulvic acids coated manufactured CeO2 nanoparticles in various conditions: From ultrapure to natural Lake Geneva waters. Sci. Total Environ. 2016, 562, 327–334. [Google Scholar] [CrossRef]
- Zhang, Y.; Chen, Y.; Westerhoff, P.; Hristovski, K.; Crittenden, J.C. Stability of commercial metal oxide nanoparticles in water. Water Res. 2008, 42, 2204–2212. [Google Scholar] [CrossRef]
- Luchini, A.; D’Errico, G.; Leone, S.; Vaezi, Z.; Bortolotti, A.; Stella, L.; Vitiello, G.; Paduano, L. Structural organization of lipid-functionalized-Au nanoparticles. Colloids Surf. B 2018, 168, 2–9. [Google Scholar] [CrossRef] [Green Version]
- Vaccaro, M.; Mangiapia, G.; Paduano, L.; Gionalino, E.; Accardo, A.; Tesauro, D.; Morelli, G. Structural and relaxometric characterization of peptide aggregates containing gadolinium complexes as potential selective contrast agents in MRI. Chem. Phys. Chem. 2007, 8, 2526–2538. [Google Scholar] [CrossRef]
- Luchini, A.; Irace, C.; Santamaria, R.; Montesarchio, D.; Heenan, R.K.; Szekely, N.; Flori, A.; Menichetti, L.; Paduano, L. Phosphocholine-decorated superparamagnetic iron oxide nanoparticles: Defining the structure and probing in vivo applications. Nanoscale 2016, 8, 10078–10086. [Google Scholar] [CrossRef] [PubMed]
- Perfetti, M.; Gallucci, N.; Russo Krauss, I.; Radulescu, A.; Pasini, S.; Holderer, O.; D’Errico, G.; Vitiello, G.; Bianchetti, G.O.; Paduano, L. Revealing the aggregation mechanism, structure, and internal dynamic of poly (vinyl alcohol) microgel prepared through liquid-liquid phase separation. Macromolecules 2020, 53, 852–861. [Google Scholar] [CrossRef]
- Spanier, J.E.; Robinson, R.D.; Zhang, F.; Chan, S.W.; Herman, I.P. Size-dependent properties of CeO2-y nanoparticles as studied by Raman scattering. Phys. Rev. B 2001, 64, 245407/1–8. [Google Scholar] [CrossRef] [Green Version]
- Lee, Y.; He, G.; Akey, A.J.; Si, R.; Flytzani-Stephanopoulos, M.; Herman, I.P. Raman analysis of mode softening in nanoparticles CeO2-δ and Au-CeO2-δ during CO oxidation. J. Am. Chem. Soc. 2011, 133, 12952–12955. [Google Scholar] [CrossRef]
- Filtschew, A.; Hofmann, K.; Hess, C. Ceria and its defect structure: New insights from a combined spectroscopic approach. J. Phys. Chem. C 2016, 120, 6694–6703. [Google Scholar] [CrossRef]
- Gao, Y.; Zhao, X.; Yin, P.; Gao, F. Size-dependent Raman shifts for nanocrystals. Sci. Rep. 2016, 6, 20539. [Google Scholar] [CrossRef]
- Prieur, D.; Bonani, W.; Popa, K.; Walter, O.; Kriegsman, K.W.; Engelhard, M.H.; Guo, X.; Eloirdi, R.; Gouder, T.; Beck, A.; et al. Size dependence of lattice parameter and electronic structure in CeO2 nanoparticles. Inorg. Chem. 2020, 59, 5760–5767. [Google Scholar] [CrossRef]
- Schilling, C.; Hofmann, A.; Hess, C.; Ganduglia-Pirovano, M.V. Raman spectra of polycrystalline CeO2: A density functional theory study. J. Phys. Chem. C 2017, 121, 20834–20849. [Google Scholar] [CrossRef]
- Li, H.; Zhang, P.; Li, G.; Lu, J.; Wu, Q.; Gu, Y. Stress measurement for nonstoichiometric ceria films based on Raman spectroscopy. J. Alloys Compd. 2016, 682, 132–137. [Google Scholar] [CrossRef]
- Sobeh, M.; Youssef, F.S.; Esmat, A.; Petruk, G.; El-Khatib, A.H.; Monti, D.M.; Ashour, M.L.; Wink, M. High resolution UPLC-MS/MS profiling of polyphenolics in the methanol extract of Syzygium samarangense leaves and its hepatoprotective activity in rats with CCl4-induced hepatic damage. Food Chem. Toxicol. 2018, 113, 145–153. [Google Scholar] [CrossRef] [PubMed]
- Petruk, G.; Donadio, G.; Lanzilli, M.; Isticato, R.; Monti, D.M. Alternative use of Bacillus subtilis spores: Protection against environmental oxidative stress in human normal keratinocytes. Sci. Rep. 2018, 8, 1745. [Google Scholar] [CrossRef] [PubMed]
- Girija, D.; Bhojya Naik, S.; Sudhamani, C.N.; Vinay Kumar, B. Cerium oxide nanoparticles- a green, reusable, and highly efficient heterogeneous catalyst for the synthesis of Polyhydroquinolines under solvent-free conditions. Arch. Appl. Sci. Res. 2011, 3, 373–382. [Google Scholar]
- Okuda, M.; Suzumoto, Y.; Yamashita, I. Bioinspired synthesis of homogenous cerium oxide nanoparticles and two- or three- dimensional nanoparticle arrays using protein supramolecules. Cryst. Growth Des. 2011, 11, 2540–2545. [Google Scholar] [CrossRef]
- Jayakumar, G.; Albert Irudayaraj, A.; Dhayal Raj, A. Particle size effect on the properties of cerium oxide (CeO2) nanoparticles synthesized by hydrothermal method. MMSE J. 2017, 9, 1–6. [Google Scholar]
- Rahdar, A.; Beyzaei, H.; Askari, F.; Kyzas, G.Z. Gum-based cerium oxide nanoparticles for antimicrobial assay. Appl. Phys. A 2020, 126, 1–9. [Google Scholar] [CrossRef]
- Mokkelbost, T.; Kaus, I.; Grande, T.; Einarsrud, M. Combustion synthesis and characterization of nanocrystalline CeO2-based powders. Chem. Mater. 2004, 16, 5489–5494. [Google Scholar] [CrossRef]
- Römer, I.; Briffa, S.M.; Dasilva, Y.A.R.; Hapiuk, D.; Trouillet, V.; Palmer, R.E.; Valsami-Jones, E. Impact of particle size, oxidation state and capping agent of different cerium dioxide nanoparticles on the phosphate-induced transformations at different pH and concentration. PLoS ONE 2019, 14, e0217483. [Google Scholar] [CrossRef] [PubMed]
- Baranov, D.; Lynch, M.J.; Curtis, A.C.; Carollo, A.R.; Douglass, C.R.; Mateo-Tejada, A.M.; Jonas, D.M. Purification of Oleylamine for Materials Synthesis and Spectroscopic Diagnostics for trans Isomers. Chem. Mater. 2019, 31, 1223–1230. [Google Scholar] [CrossRef] [Green Version]
- Uekawa, N.; Ueta, M.; Wu, Y.J.; Kakegawa, K. Characterization of CeO2 fine particles prepared by the homogeneous precipitation method with a mixed solution of ethylene glycol and polyethylene glycol. Mater. Res. 2004, 19, 1087–1092. [Google Scholar] [CrossRef]
- Dovzhenko, D.S.; Ryabchuk, S.V.; Rakovich, Y.P.; Nabiev, I.R. Light-matter interaction in the strong coupling regime: Configurations, conditions, and applications. Nanoscale 2018, 10, 3589–3605. [Google Scholar] [CrossRef]
- Khitrova, G.; Gibbs, H.M.; Kira, M.; Koch, S.W.; Scherer, A. Vacuum Rabi splitting in semiconductors. Nat. Phys. 2006, 2, 81–90. [Google Scholar] [CrossRef]
- Manuel, A.P.; Kirkey, A.; Mahdi, N.; Shankar, K. Plexcitonics-fundamental principles and optoelectronic applications. J. Mater. Chem. C 2019, 7, 1821–1853. [Google Scholar] [CrossRef]
- Ding, S.J.; Nan, F.; Liu, X.L.; Hao, Z.H.; Zhou, L.; Zeng, J.; Xu, H.X.; Zhang, W.; Wang, Q.Q. Plasmon-modulated excitation-dependent fluorescence from activated CTAB molecules strongly coupled to gold nanoparticles. Sci. Rep. 2017, 7, 43282. [Google Scholar] [CrossRef] [Green Version]
- Balci, F.M.; Sarisozen, S.; Polat, N.; Balci, S. Colloidal nanodisk shaped plexcitonic nanoparticles with large Rabi splitting energies. J. Phys. Chem. 2019, 123, 26571–26576. [Google Scholar] [CrossRef]
- Savasta, S.; Saija, R.; Ridolfo, A.; Di Stefano, O.; Denti, P.; Borghese, F. Nanopolaritons: Vacuum Rabi splitting with a single quantum dot in the center of a dimer nanoantenna. ACS Nano 2010, 4, 6369–6376. [Google Scholar] [CrossRef] [PubMed] [Green Version]
- Jiang, Y.; Mei, Y.; Zou, Y.; Zuo, Y.; Du, S. Intracavity cold atomic ensemble with high optical depth. Rev. Sci. Instrum. 2019, 90, 1–7. [Google Scholar] [CrossRef] [PubMed]
- Arumugam, A.; Karthikeyan, C.; Haja Hameed, A.S.; Gopinath, K.; Gowri, S.; Karthika, V. Synthesis of cerium oxide nanoparticles using Gloriosa superba L. leaf extract and their structural, optical and antibacterial properties. Mater. Sci. Eng. C 2015, 49, 408–415. [Google Scholar] [CrossRef] [PubMed]
- Wang, G.; Mu, Q.; Chen, T.; Wang, Y. Synthesis, characterization and photoluminescence of CeO2 nanoparticles by a facile method at room temperature. J. Alloys Compd. 2010, 493, 202–207. [Google Scholar] [CrossRef]
- Luchini, A.; Heenan, R.K.; Paduano, L.; Vitiello, G. Functionalized SPIONs: The surfactant nature modulates the self-assembly and cluster formation. Phys. Chem. Chem. Phys. 2016, 18, 18441–18449. [Google Scholar] [CrossRef]
- Russo Krauss, I.; Picariello, A.; Vitiello, G.; De Santis, A.; Koutsioubas, A.; Houston, J.E.; Fragneto, G.; Paduano, L. Interaction with human serum proteins reveals biocompatibility of phosphocholine-functionalized SPIONs and formation of albumin-decorated nanoparticles. Langmuir 2020, 36, 8777–8791. [Google Scholar] [CrossRef] [PubMed]


| OC_150 | OL_150 | OL_250 | |
|---|---|---|---|
| Temperature (°C) | 150 | 150 | 250 |
| Capping agent (mL) | 1.98 | 3.95 | 3.95 |
| Molar Ratio NPs:(NaOl × 10−6) | CeO2_OL_250 NPs in Chloroform (mL) | Sodium Oleate (g) | Water (mL) |
|---|---|---|---|
| 1:2.1 | 1.25 | 0.024 | 10 |
| 1:2.5 | 1.50 | 0.024 | 10 |
| 1:2.9 | 1.75 | 0.024 | 10 |
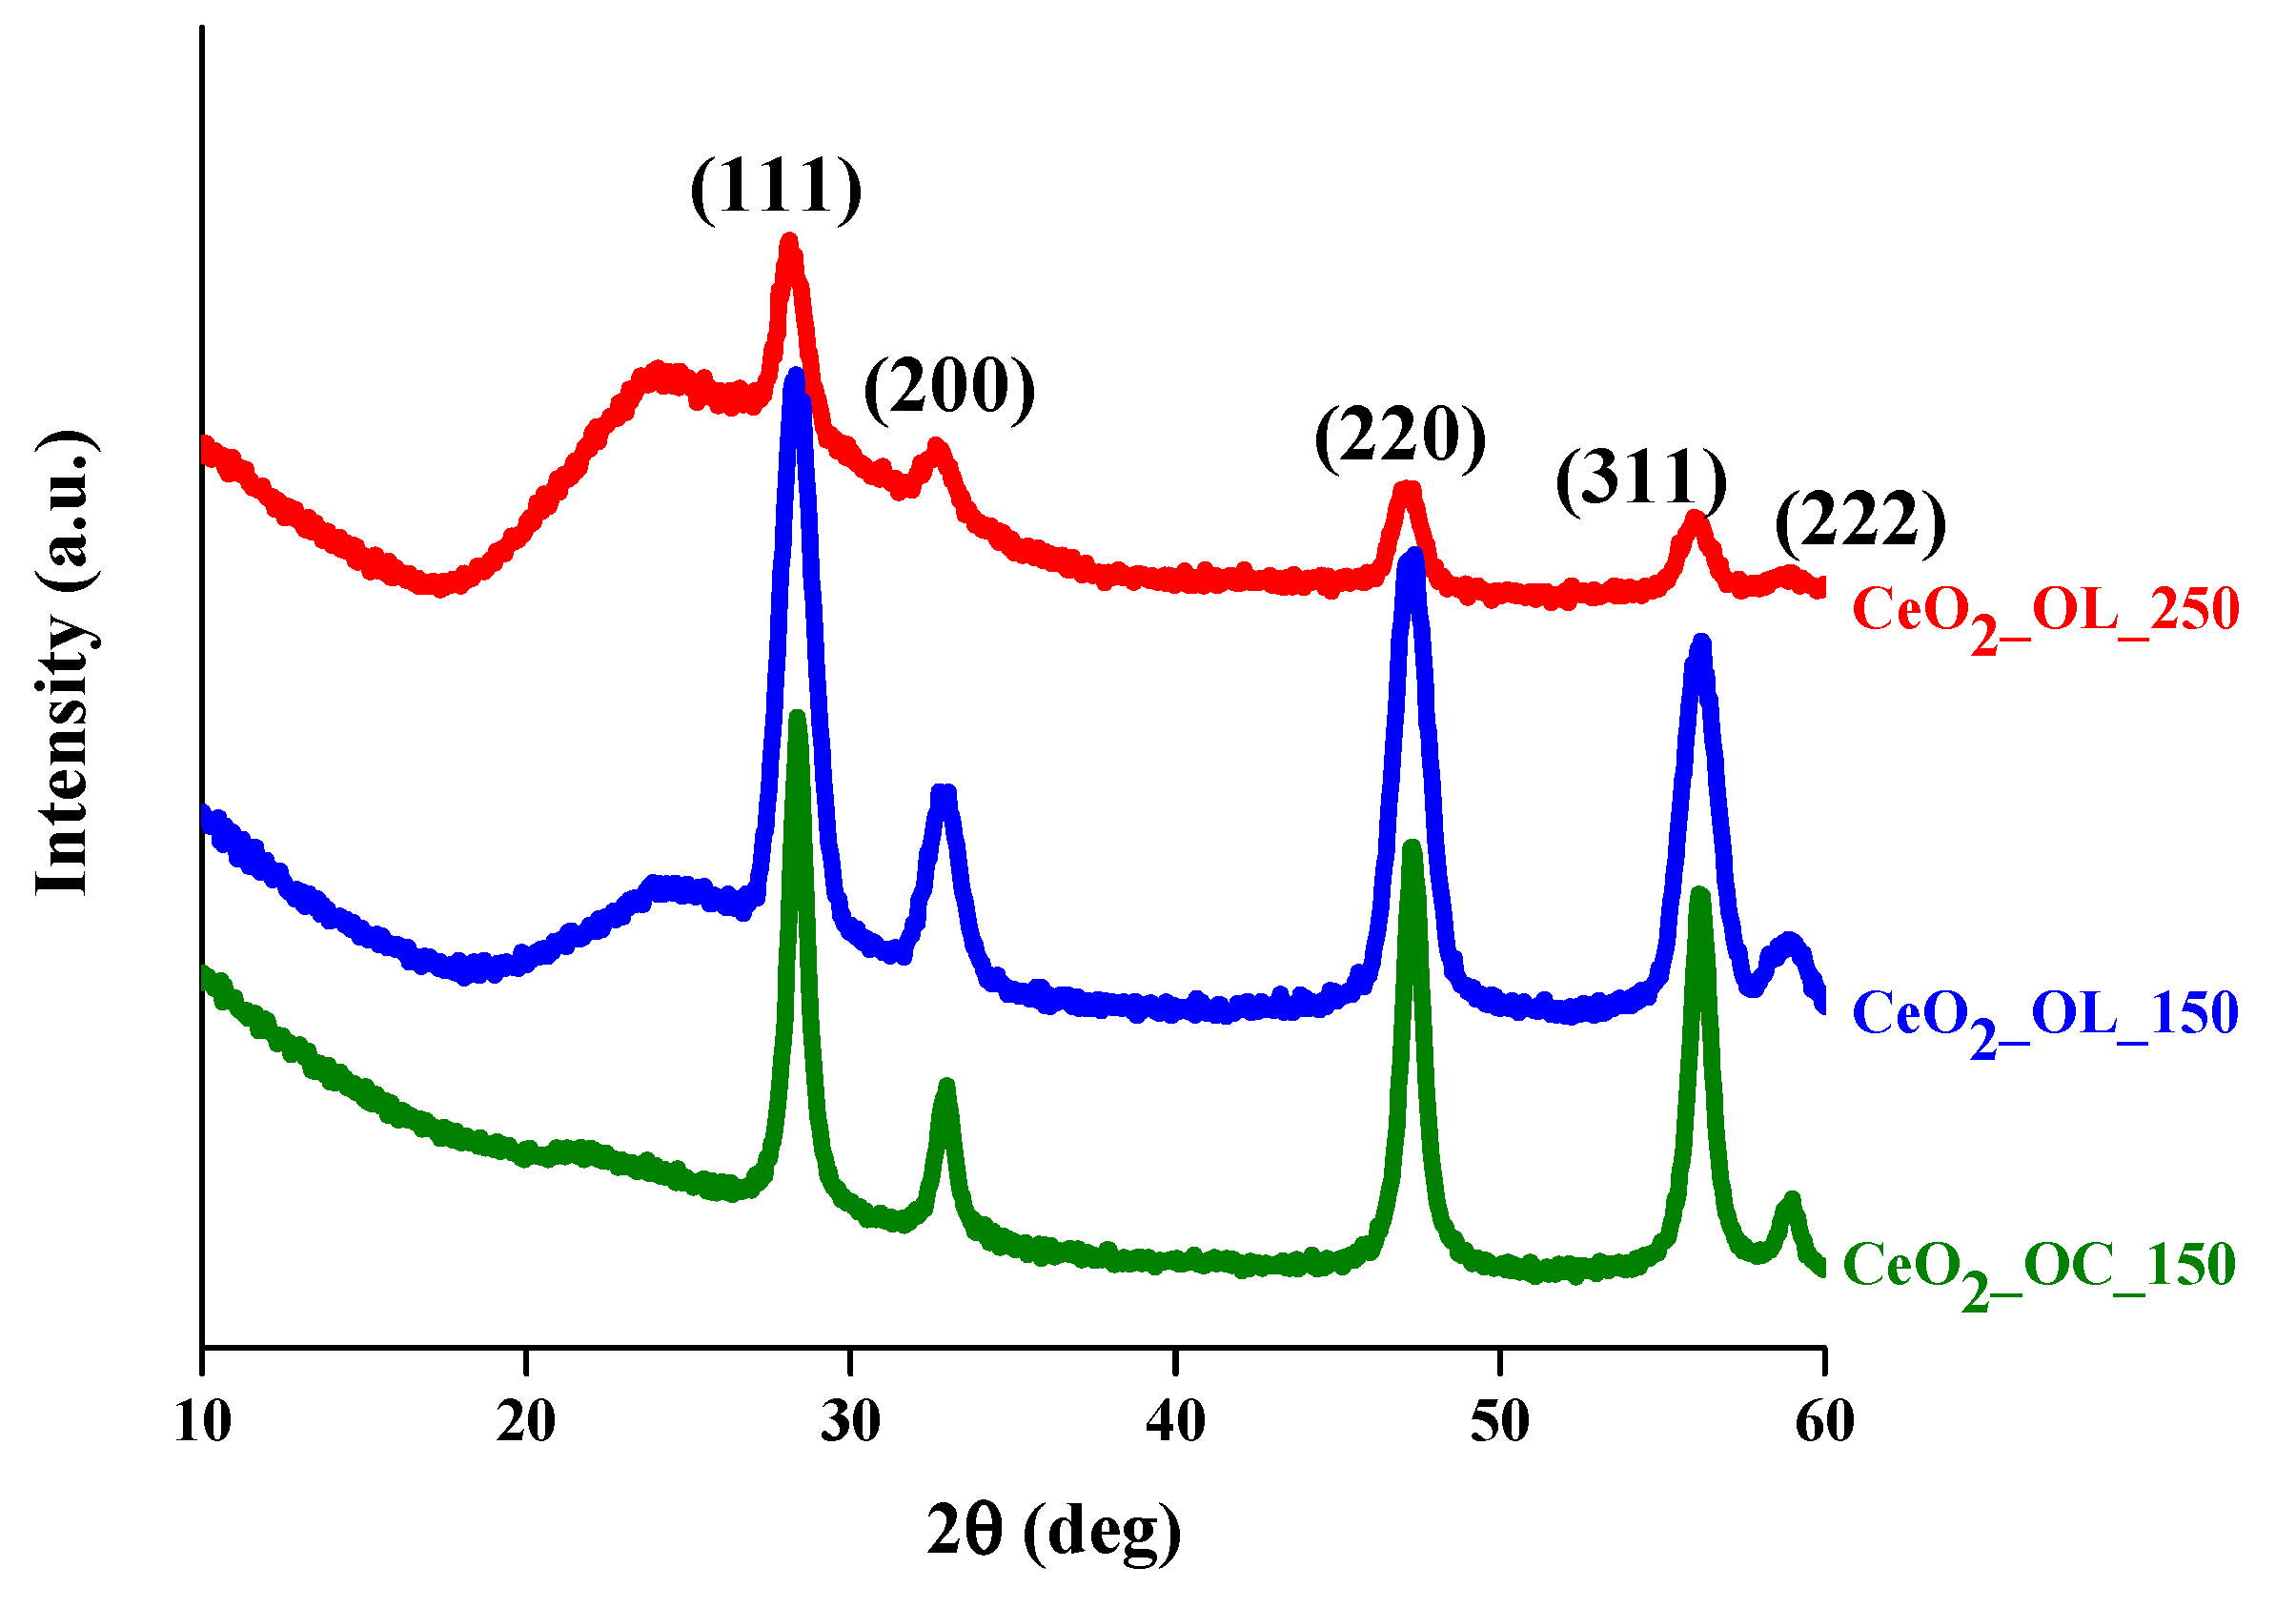
| (111) | (200) | (220) | (311) | (222) | |
|---|---|---|---|---|---|
| CeO2_OC_150 | 28.31° | 32.98° | 47.20° | 56.18° | 58.92° |
| CeO2_OL_150 | 28.31° | 32.83° | 47.20° | 56.18° | 58.92° |
| CeO2_OL_250 | 28.16° | 32.69° | 47.20° | 56.03° | 58.92° |
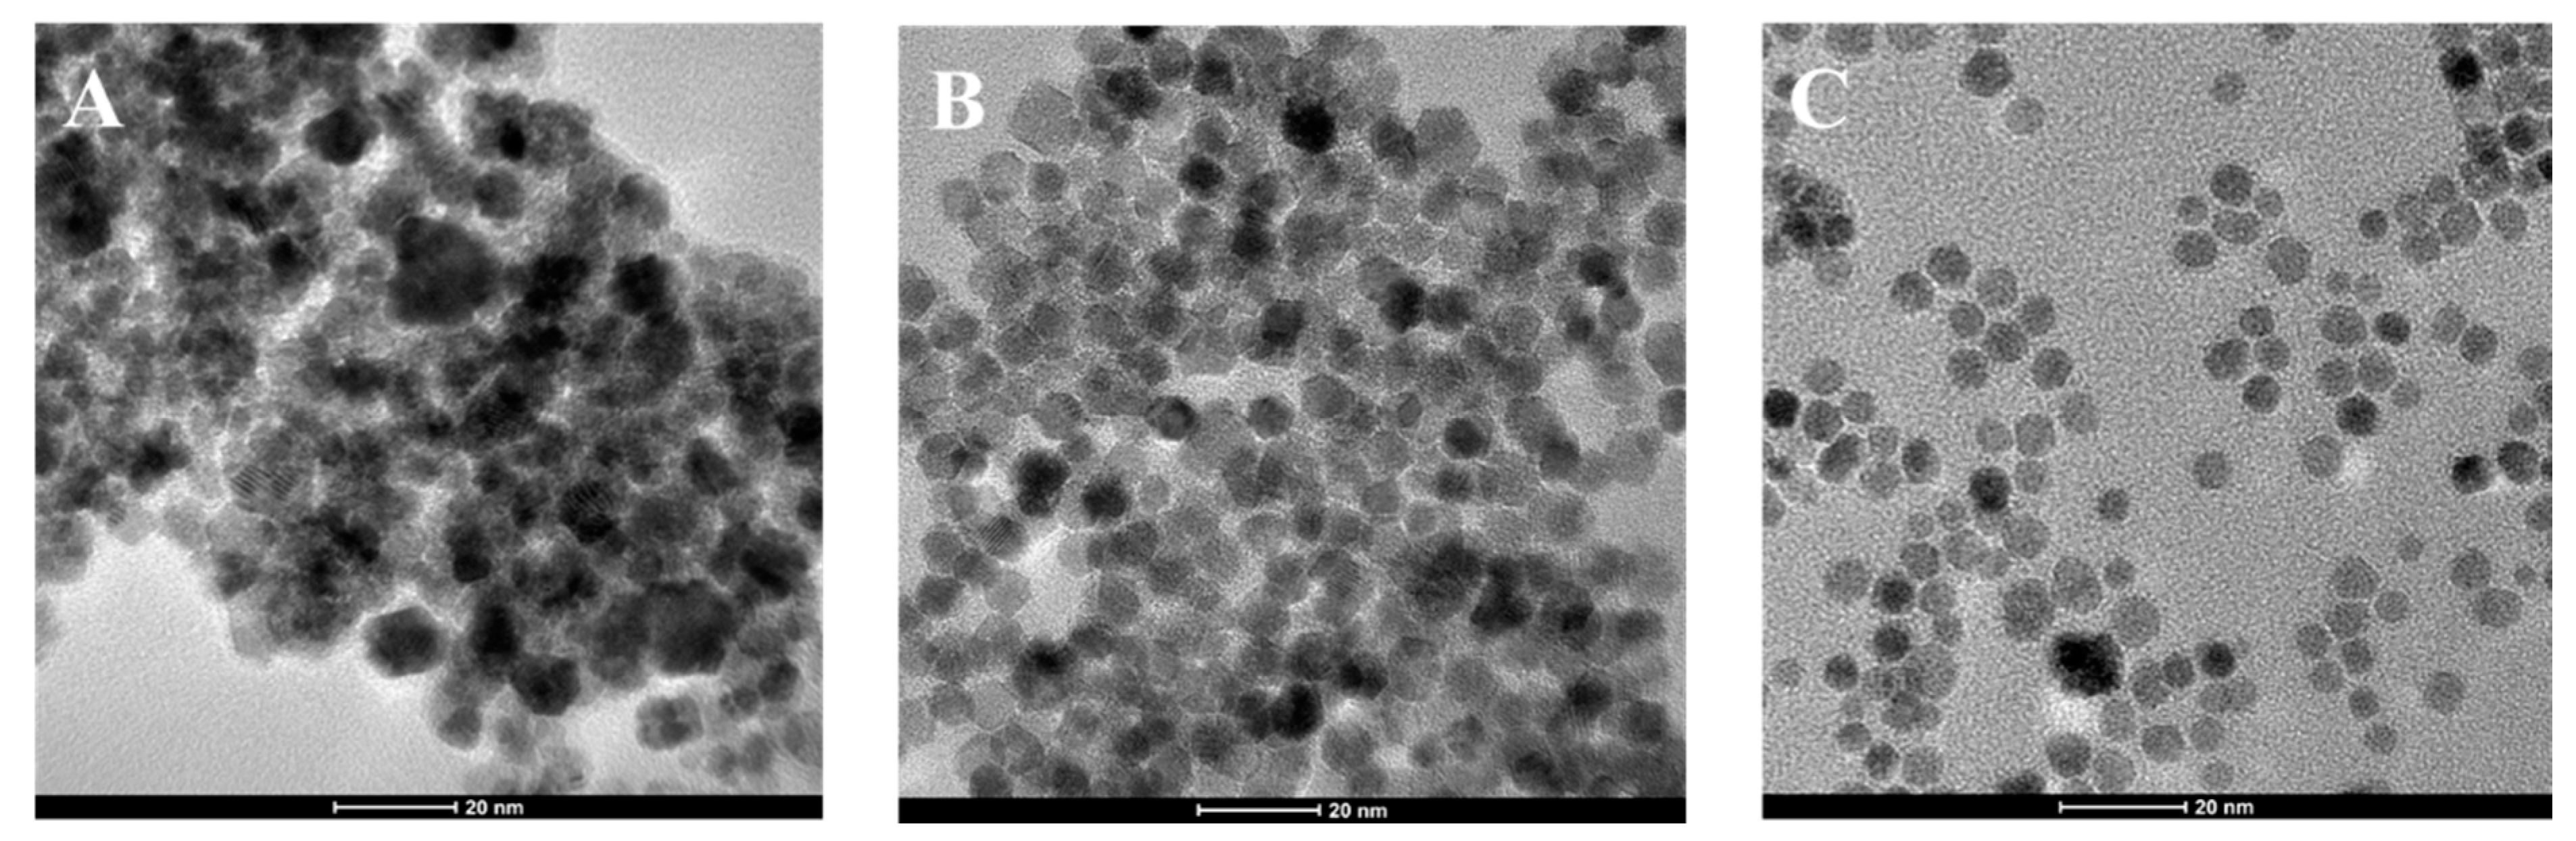
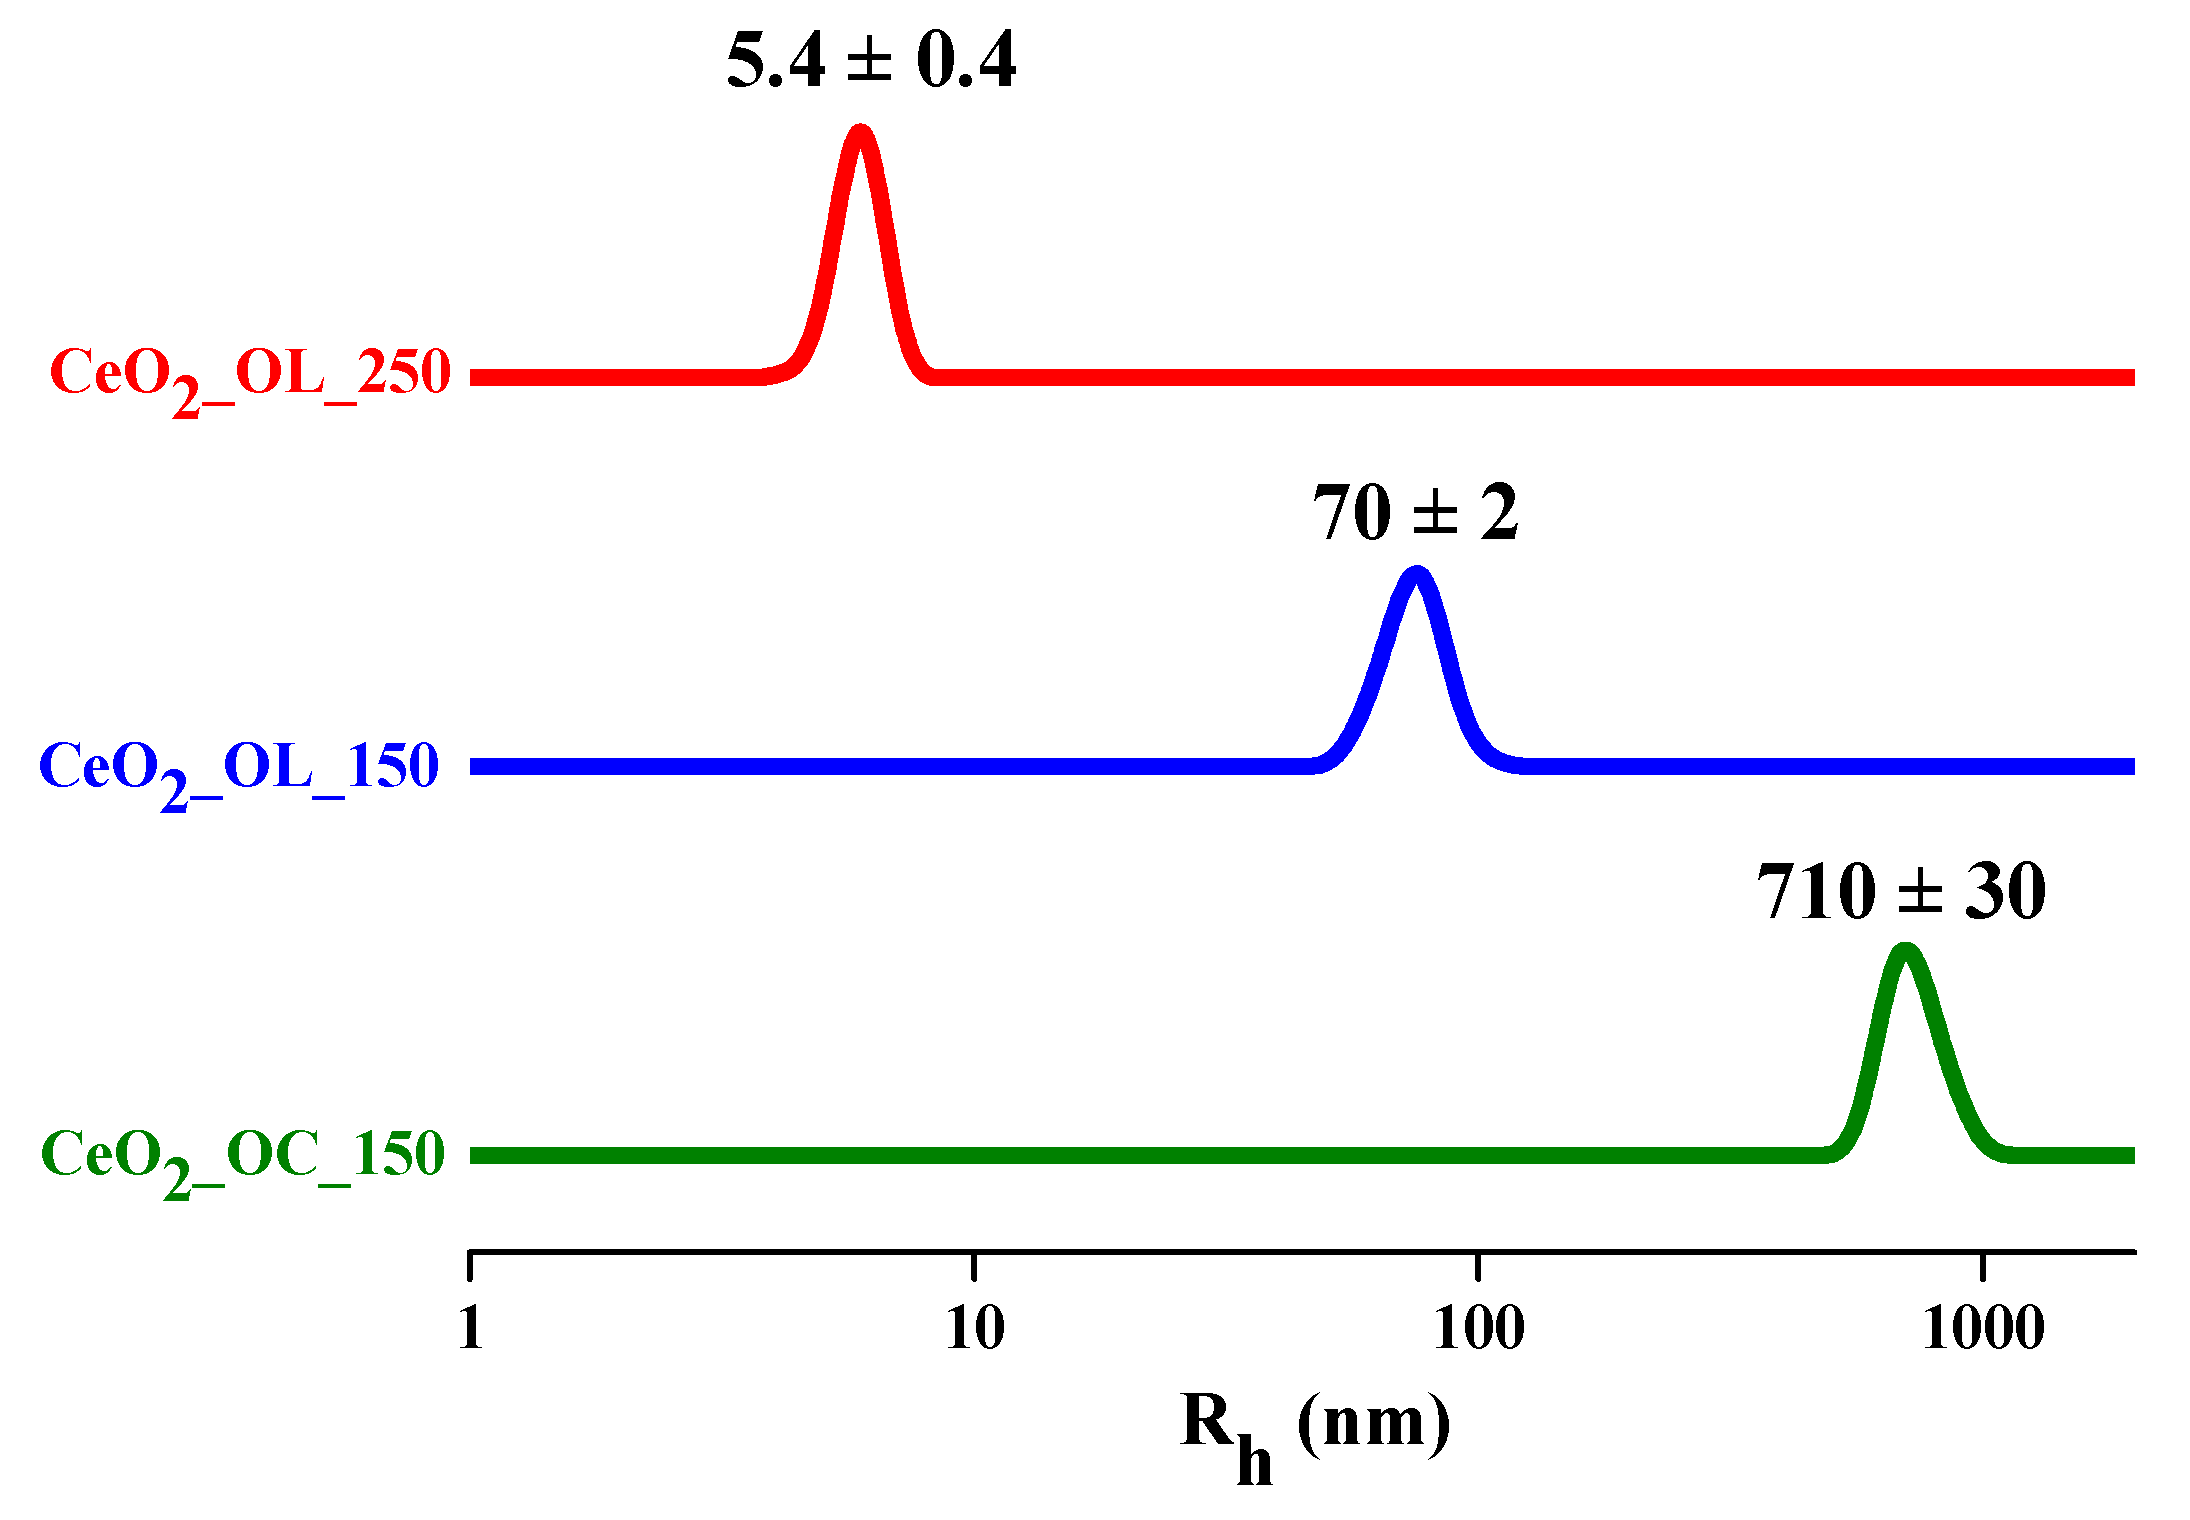
| Crystalline Structure | Shape | <R> (TEM) (nm) | Rh (DLS) (nm) | Absorption Maximum (nm) | Emission Maximum (nm) | |
|---|---|---|---|---|---|---|
| CeO2_OC_150 | Fluorite | Irregular | 6.5 ± 0.1 | Cluster 710 ± 30 | 315 | 400, 588, 612 |
| CeO2_OL_150 | Fluorite | Hexagonal | 3.5 ± 0.1 | Cluster 70 ± 20 | 294 | 404, 589 |
| CeO2_OL_250 | Fluorite | Spherical | 2.5 ± 0.1 | 5.4 ± 0.4 | 290 | 510, 583 |
Publisher’s Note: MDPI stays neutral with regard to jurisdictional claims in published maps and institutional affiliations. |
© 2021 by the authors. Licensee MDPI, Basel, Switzerland. This article is an open access article distributed under the terms and conditions of the Creative Commons Attribution (CC BY) license (http://creativecommons.org/licenses/by/4.0/).
Share and Cite
Gallucci, N.; Vitiello, G.; Di Girolamo, R.; Imbimbo, P.; Monti, D.M.; Tarallo, O.; Vergara, A.; Russo Krauss, I.; Paduano, L. Towards the Development of Antioxidant Cerium Oxide Nanoparticles for Biomedical Applications: Controlling the Properties by Tuning Synthesis Conditions. Nanomaterials 2021, 11, 542. https://doi.org/10.3390/nano11020542
Gallucci N, Vitiello G, Di Girolamo R, Imbimbo P, Monti DM, Tarallo O, Vergara A, Russo Krauss I, Paduano L. Towards the Development of Antioxidant Cerium Oxide Nanoparticles for Biomedical Applications: Controlling the Properties by Tuning Synthesis Conditions. Nanomaterials. 2021; 11(2):542. https://doi.org/10.3390/nano11020542
Chicago/Turabian StyleGallucci, Noemi, Giuseppe Vitiello, Rocco Di Girolamo, Paola Imbimbo, Daria Maria Monti, Oreste Tarallo, Alessandro Vergara, Irene Russo Krauss, and Luigi Paduano. 2021. "Towards the Development of Antioxidant Cerium Oxide Nanoparticles for Biomedical Applications: Controlling the Properties by Tuning Synthesis Conditions" Nanomaterials 11, no. 2: 542. https://doi.org/10.3390/nano11020542