Article

Smart Mn7+ Sensing via Quenching on Dual Fluorescence of Eu3+ Complex-Modified TiO2 Nanoparticles

1
National Center of International Joint Research for Hybrid Materials Technology, National Base of International Sci. & Tech. Cooperation on Hybrid Materials, Qingdao University, 308 Ningxia Road, Qingdao 266071, China
2
Department of Mechanical Engineering, Colorado State University, Fort Collins, CO 80523, USA
3
School of Biomedical Engineering/School of Advanced Materials Discovery, Colorado State University, Fort Collins, CO 80523, USA
4
Department of Chemical and Biological Engineering, Colorado State University, Fort Collins, CO 80523, USA
*
Authors to whom correspondence should be addressed.
Nanomaterials 2021, 11(12), 3283; https://doi.org/10.3390/nano11123283
Submission received: 4 November 2021 / Revised: 23 November 2021 / Accepted: 26 November 2021 / Published: 3 December 2021

Abstract

:
In this work, titania (TiO2) nanoparticles modified by Eu(TTA)3Phen complexes (ETP) were prepared by a simple solvothermal method developing a fluorescence Mn7+ pollutant sensing system. The characterization results indicate that the ETP cause structural deformation and redshifts of the UV-visible light absorptions of host TiO2 nanoparticles. The ETP also reduce the crystallinity and crystallite size of TiO2 nanoparticles. Compared with TiO2 nanoparticles modified with Eu3+ (TiO2-Eu3+), TiO2 nanoparticles modified with ETP (TiO2-ETP) exhibit significantly stronger photoluminescence under the excitation of 394 nm. Under UV excitation, TiO2-ETP nanoparticles showed blue and red emission corresponding to TiO2 and Eu3+. In addition, as the concentration of ETP in TiO2 nanoparticles increases, the PL intensity at 612 nm also increases. When ETP-modified TiO2 nanoparticles are added to an aqueous solution containing Mn7+, the fluorescence intensity of both TiO2 and ETP decreases. The evolution of the fluorescence intensity ratio (I1/I2) of TiO2 and ETP is linearly related to the concentration of Mn7+. The sensitivity of fluorescence intensity to Mn7+ concentration enables the design of dual fluorescence ratio solid particle sensors. The method proposed here is simple, accurate, efficient, and not affected by the environmental conditions.

1. Introduction

Manganese has two primary valence and oxidation states, namely, Mn2+ and Mn7+, which have different effects in practice [1,2]. Mn7+ has been widely used as a strong disinfectant, but its strong oxidation property and its heavy metal characteristic make it a toxic and carcinogenic species in water recycling systems and in human health [3]. In industry, Mn7+ has been used as a strong oxidation agent, generating large amounts of toxic waste water [4]. Manganese ions have contributed to serious pollution, causing toxic drinking water and damage to plants [5]. Thus, Mn7+ has attracted a lot of attention among pollutants in recent years, and the detection of Mn7+ is very important for environmental protection. Ion chromatography (IC) [6], atomic absorption spectroscopy (AAS) [7], inductively coupled plasma mass spectroscopy (ICP-MS) [8] and spectrophotometry [9] can be used to detect Mn7+. Monitoring Mn7+ in water samples requires complex methods such as atomic spectrometry. However, due to the low efficiency of this method and the interference of impurities present in the real samples, the detection of Mn7+ at low concentration is complicated and requires pretreatment steps [10]. Therefore, it is necessary to explore a simple, accurate, efficient, and low-interference method to detect Mn7+ in complex samples.
Even with the use of highly sensitive metal ion detectors, the content level of Mn7+ in environmental samples is usually low or close to the detection limit, so the samples require a unique separation. When high concentrations of interfering particles are present in the matrix, efficient extraction of Mn7+ is required. Qian et al. proposed a FAAS method that uses crosslinked chitosan to separate Mn2+ and Mn7+. This method is simple and sensitive and can be used for environmental sample detection [11]. A potential problem limiting the application of this method for actual samples is that the Mn2+ is determined by its oxidation to Mn7+, and then the total Mn concentration is determined. Therefore, this method requires that the analyte species are only Mn2+ and Mn7+. This motivates the development of new Mn sensors.
Europium complexes constitute an important class of optical probes, with applications ranging from sensing of bioactive species, high throughput assays and screening protocols in vitro, to time-resolved imaging studies in cellulo or in vivo [12]. Eu complexes might also provide an opportunity for Mn7+ sensing. In this work, we design a strategy to combine the advantages of Eu3+ fluorescence and TiO2 dispersion in water. Our fluorescent nanomaterials can detect in water or other liquids, with minimal interference and low cost. In recent years, fluorescence spectrometry has been used to detect and quantify metal ions [13]. A new method for the determination of copper, manganese, nickel, and lead in diesel oil has been developed, which combines liquid–liquid reversed-phase eddy microextraction and energy dispersive X-ray fluorescence spectroscopy [14]. Fluorescence sensors [15] have received widespread attention due to their high sensitivity, selectivity, and simple operation; however, a single wavelength fluorescence sensor is still affected by sample concentration, environmental factors, and excitation intensity [16]. Dual fluorescence sensors can measure emission peaks at two different wavelengths, and use the ratio of the two peak intensities to solve the above problems [17,18,19,20], increasing sensitivity and selectivity [21,22]. Nanomaterial fluorescence sensors are a new type of sensors, which have large specific surface area, controllable size, predictable nanostructure [23,24,25], and polychromatic and adjustable radiation characteristics [26]. In general, photoluminescence is achieved by organic lanthanide complexes that absorb UV light and emit photons due to f-f or f-d electronic transitions in the lanthanide ion [27,28]. Among all the lanthanide ions, europium ions have been widely used because of their prominent emission peak and long fluorescence lifetime [29,30,31]. The advantages of their complexes are stable characteristic emission peaks and increased fluorescence intensity. TiO2 nanoparticles have excellent optical properties, catalytic properties, chemical stability, and biocompatibility [32]. Therefore, TiO2-ETP nanoparticles combine the advantages and fluorescence properties of europium complexes and TiO2 nanoparticles.
In this work, we synthesized europium complex-modified TiO2 nanoparticles (TiO2-ETP) by a solvothermal method, and we investigated the structure, properties, and application of TiO2-ETP nanoparticles. The resulting nanoparticles have outstanding luminescence characteristics, indicating the possibility of using TiO2 nanoparticles to improve the effective luminescent properties of rare earth complexes. TiO2-ETP nanoparticles exhibit significantly stronger photoluminescence (PL) than TiO2-Eu3+ nanoparticles. Thus, TiO2-ETP nanoparticles have the potential to be used as new semiconductor luminescent materials. In our study, the fluorescence intensity of TiO2-ETP was sensitive to the change of Mn7+ concentration. In addition, the high specific surface area of TiO2 nanoparticles can increase the contact area between the sensor and Mn7+, which can improve the sensitivity of the sensor. In the fluorescence spectrum, excited with 394 nm light, TiO2-ETP has emission peaks at 454 nm and 616 nm for titania and the ETP, respectively. The fluorescence of ETP and TiO2 both decreases in the presence of Mn7+, but with different characteristic sensitivity to Mn7+. The Mn7+ dual fluorescence sensor shows a wide detection range and high sensitivity, and the effectiveness of the sensor has been verified through experiments. In this research, we propose an intelligent dual fluorescence sensor, which is low-cost and easy to operate. It has high sensitivity and high efficiency. Compared with previous reports [33,34], our method is simple and practical, reduces the need for pretreatment, and has a larger detection range. The preparation and detection mechanism of the sensor is shown in Figure 1.

2. Experimental Details

Ethanol (AR, 99.7%), acetic acid (AR, 99.7%), and tetrabutyl titanate (AR) were purchased from Macklin (Shanghai, China). Europium chloride hexahydrate (EuCl3·6H2O, 99.9%), 1,10-phenanthroline monohydrate (Phen, AR, 98%) and 2-thenoyltrifluoroacetone (TTA, 98%) were purchased from Aladdin (Shanghai, China).
As shown in Figure 2, TiO2, TiO2 modified with Eu3+ (TiO2-Eu3+), and TiO2 modified with Eu (TTA)3Phen (ETP) (TiO2-ETP) were prepared using the solvothermal method. Tetrabutyl titanate (TBT) was used as a precursor. Ethanol (CH3CH2OH) and acetic acid (CH3COOH) were used as solvents and hydrolysis inhibitors. Before the final synthesis, two solutions were prepared (solution A and solution B). Solution A was prepared by adding acetic acid and TBT in ethanol. In solution B, EuCl3 was dissolved in ethanol by stirring. Then 1,10-phenanthroline monohydrate and methyl 1H-benzotriazole, dissolved in absolute ethanol were added to solution B, and the mixed solution was stirred with a magnetic stirrer for 1 h at room temperature. Solution A was added to solution B. The mixture became cloudy with continuous stirring. The mixture was heated in an autoclave to 150 °C for 24 h. After the reaction, the resulting material was cooled to room temperature. The synthesized material was centrifuged and washed with ethanol and distilled water several times to remove impurities. The resulting white solid was collected and dried in an oven at 60 °C. For the synthesis of unmodified TiO2 nanoparticles, the same conditions are used, without the addition of ETP.
The quenching experiments using metal ions were performed by adding TiO2-ETP (0.1 mol/L) into different metal ion analyte solutions with the concentrations of 1 mM/L, and the mixtures were stirred for 2 h. To determine the quenching behavior, Mn7+ concentrations in the range of 1 µM/L to 1000 µM/L were used.
A Thermo Scientific F200i (Thermo, Waltham, MA, USA) transmission electron microscope was used to obtain transmission electron microscopy (TEM) images at an accelerating voltage of 200 kV. X-ray powder diffraction (XRD) measurements were performed using a Bruker D8 Advance diffractometer (Bruker, Karlsruhe, Germany), which was operated at a generator voltage of 40 keV and a current of 30 mA. The X-ray source is CuKα radiation (λ = 0.154 nm). The diffraction pattern was collected at a scanning speed of 1°/min within a 2θ scanning range of 20° to 80°. Measurements of Raman spectra were performed on a Thermo Scientific DXR 2xi (Thermo, Waltham, MA, USA) Raman Spectrometer under a backscattering geometry. The valence states of Eu, O, and Ti atoms were measured by X-ray photoelectron spectroscopy (XPS) on a Thermo Scientific ESCALAB 250 (Thermo, Waltham, MA, USA) spectrometer. The XPS experiment was performed under vacuum using AlKα (1486.6 eV) radiation. The ultraviolet absorption spectrum was obtained using PerkinElmer Lambda 750s (PerkinElmer, Shanghai, China) with a solid sample frame, on which the powder samples were flattened when the powder samples were used. The PL spectrum is an important tool for determining the luminescent properties of materials. An Edinburgh Instrument Fluorescence Spectrometer FLS 1000 (Livingston, Edinburgh, UK) was used to record the excitation and emission spectra of each sample, on which the data of excitation spectra, emission spectra, fluorescence lifetimes were collected. A 450W xenon arc lamp capable of emitting a continuous spectrum with greater intensity was used as the light source. The excitation monochromator was used to select the specified spectrum with the excitation wavelength of 394 nm. Fluorescence analyzer calibration was performed in accordance with the instrument operating procedures using standard sample, sample preparation and processing, resulting in excellent calibration curves.

3. Results and Discussion

3.1. Morphological Structures

The additions of Eu3+ and ETP into TiO2 change the shape and size of TiO2 nanoparticles. Figure 3 shows typical transmission electron microscopy (TEM) images of TiO2 nanoparticles. TiO2 nanoparticles with spherical morphology can be seen in TEM images (Figure 3a). The morphology of TiO2 nanoparticles with Eu3+ varies from spherical to ellipsoidal shapes (Figure 3b). The TiO2 nanoparticles modified with ETP have a cuboid shape (Figure 3c). These changes are similar to the previous report [35]. Eu3+ and ETP-doped TiO2 cause different shapes of TiO2-Eu3+ and TiO2-ETP nanoparticles [36]. The corresponding histograms of the diameter distributions and the changes of the average sizes are shown in Figure 3 in which the average nanoparticle sizes can be found to be 15 ± 0.09 nm, 12.3 ± 0.08 nm, and 9 ± 0.1 nm in diameter. The length of TiO2-Eu3+ is between 10 and 40 nm. Compared to TiO2, the average size of TiO2-ETP nanoparticles decreases, which suggests that the inclusion of ETP largely suppresses the growth of TiO2 nanoparticles. This size change of TiO2-Eu3+ and TiO2-ETP nanoparticles can also relate to crystalline structures described later, based on X-ray diffraction analyses [37]. The growth of TiO2-Eu3+ crystals is hindered by the formation of Eu-O-Ti bond in the crystal void of TiO2-Eu3+ nanoparticles. The decrease of particle size of ETP-modified TiO2 is mainly caused by ETP entering the lattice and binding with oxygen. Due to internal stress in the crystal lattice, the diffusion of Ti4+ and O2- and the obstacle of crystal migration, the crystal growth at the boundary is retarded [38].

3.2. Crystalline Structure

Modification with Eu3+ can effectively change the crystal structure and inhibit grain growth of TiO2 nanoparticles. This effect is more pronounced when the organic complex (ETP) is used. Figure 4 shows the diffraction patterns of TiO2 nanoparticles obtained by the solvothermal method. The presence of diffraction peaks corresponding to (101), (004), (200), (105), (211), and (204) planes indicate the formation of the anatase TiO2 phase [39]. The XRD shows that TiO2-Eu3+ and TiO2-ETP nanoparticles have peaks at 2θ = 25.3°, 38.1°, 47.9°, 54.1°, 55.2°, and 62.6°, which correspond to peaks of anatase TiO2 (JCPDS NO.21-1272). No additional peaks of any other phases or impurities were found, which indicates the high purity of the nanoparticles. Figure 4 shows that the XRD peaks of the (101) crystal plane in TiO2-ETP are slightly shifted towards a smaller diffraction angle from 25.3° to 25.1°, while other diffraction peaks have almost no observable shift. This is likely due to the addition of ETP [40]. Because the smaller diffraction angle relates to the larger gaps between crystal planes, this shift means that the distance of the (101) crystal plane slightly increases upon ETP addition [40]. The relative intensity of the peak at 2θ = 25.3° is significantly decreased in TiO2-ETP compared to the TiO2 and TiO2-Eu3+ nanoparticles, indicating that the crystallinity decreased [41]. When ETP is added to TiO2 nanoparticles, deformation is induced in the system, leading to a change in the periodicity of the lattice and a decrease in the crystal symmetry. From the full width at half maximum, one can judge that TiO2-ETP has a smaller particle size than TiO2 and TiO2-Eu3+. The characteristic peaks of the (101) (004), and (200) crystal planes from the XRD image were selected, and the Scherrer formula (Equation (1)) was used to calculate the average size of the modified and unmodified nanoparticles (Table 1),
L h k l = K λ β cos θ ,
where L h k l is the size of the particle crystallites, K is the shape constant, usually taken as 0.9, λ is the wavelength of X-rays (CuKα is 1.5406 Å), β is the full diffraction width at half maximum, measured in radians at 2θ Peak.
Figure 5 shows the Raman spectra of the obtained TiO2 nanoparticles. The Raman peaks at 143, 395, 514, and 639 cm−1 correspond to Eg, B1g, A1g, or B1g, and Eg of the anatase phase, respectively [42]. The most dominant Eg mode appears due to the external vibration of the anatase structure at 143 cm−1. This indicates that the anatase phase is formed in the prepared europium complex-modified TiO2 nanoparticles. The inclusion of ETP in TiO2-ETP nanoparticles changes features of the crystal structure of TiO2, so the Raman spectrum was slightly shifted. It can be seen from the Raman spectrum that, especially in the Eg mode near 144 cm−1, the TiO2 nanoparticles modified with ETP move to a higher wavenumber direction, and their intensity drops sharply. The observation can be explained by a decrease in the particle size in TiO2-Eu3+ [41,43,44]. When the grain size decreases, it will significantly affect the Raman spectrum of titanium dioxide nanoparticles. Generally speaking, dimensional changes will produce pressure, and volume shrinkage will occur in TiO2 nanoparticles. The reason for the increase in pressure is the decrease in the distance between atoms. The sudden drop in the intensity of the Raman spectrum, especially the drop in the scattering intensity of the Eg mode, is related to the destruction of the atomic symmetry of the crystal, which is caused by the defects modified with ETP. Because TiO2-ETP nanoparticles have local lattice defects, the Raman peak becomes weaker and broader, which means that the crystallinity of synthesized nanoparticles decreases.

3.3. Confirmation of Eu3+ in TiO2

X-ray photoelectron spectroscopy (XPS) was used for elemental analysis of ETP-modified titanium dioxide nanoparticles. Figure 6A(a–c) shows the survey XPS spectra of TiO2, TiO2-Eu3+, and TiO2-ETP, respectively. The XPS spectra in Figure 6B clearly shows the changes of the binding energy of the Ti2p electron orbital in TiO2, TiO2-Eu3+, and TiO2-ETP in which the binding energies in TiO2, TiO2-Eu3+ and TiO2-ETP, are gradually decreased at 458.72, 458.62, and 458.57 eV. This phenomenon is similar to a previous report [45]. The binding energy decreases are caused by Eu3+ and ETP inserting between crystal planes. The much larger decrease of binding energy in TiO2-ETP is due to the larger TTA and Phen ligands carried by Eu3+. Figure 6C shows spectra of Eu3d with significantly higher intensity for TiO2-ETP than for TiO2-Eu3+, indicating that the TTA and Phen ligands tightly bind the Eu. At the same time, the binding energy of Eu3d in TiO2-ETP is slightly lower than that in TiO2-Eu3+, which is also due to the stronger interaction of ligands with the Eu3d electron orbital [46]. Figure 6D–F show the binding energy changes of O1s in TiO2, TiO2-Eu3+, and TiO2-ETP, showing that Ti-O and Eu-O have almost the same binding energies in TiO2-Eu3+ and TiO2-ETP. The binding energy of Ti-O in TiO2 is higher (Figure 6D) than the corresponding binding energy in the TiO2-Eu3+ (Figure 6E) and TiO2-ETP (Figure 6F), indicating the influence of Eu3+ insertion between crystal planes of TiO2. The binding energies corresponding to Ti-O, O-H, Eu-O, and C=O in TiO2-ETP (Figure 6F) are located at 529.8, 530.8, 531.4, and 532.3 eV. Compared to TiO2, the formation of an Eu-O bond indicates that Eu has reacted with TiO2. The C=O bond belongs to TTA in ETP, which indicate that ETP is interacting with TiO2 [47,48,49].

3.4. UV Absorption and Bandgap of TiO2

Figure 7a,c show the UV-visible absorption curves of TiO2-Eu3+ and TiO2-ETP. Compared with the curves of TiO2-Eu3+ (Figure 7a), the curves of TiO2-ETP have significant redshift (Figure 7c). As the ETP concentration increases, the absorption edge moves to the right, and the energy required to generate electron-hole pairs gradually decreases. The valence band of TiO2 absorbs ultraviolet light and releases it into the conduction band and defect state energy level of TiO2. Because the excited state of Eu3+ is lower than the conduction band and defect state, the energy is transferred to Eu3+ [50]. UV–visible spectra shown in Figure 7b show that modification with ETP shifted the TiO2 absorption edge from the UV to the visible region. This means Eu3+ and ETP doping produce defects in the TiO2 host crystal, and thus these defects result in band gap decrease [51,52,53].
The absorption spectra in the UV and visible regions of TiO2-Eu3+ and TiO2-ETP nanoparticles are used to estimate the bandgap. [F(R) × hν] 1/2 of hν in the vicinity of the absorption edge are plotted for all samples in Figure 7c,d, where F(R) is the Kubelka–Munk function, defined as F(R) = (1 − R)2/2R, hν is the photon energy, and R is the reflection coefficient converted to absorption intensity. By extrapolating the linear part of the curve to the intersection with the x-axis, the bandgap energies can be estimated. The bandgap energies for TiO2-Eu3+ are 3.08 eV, 3.05 eV, 3.06, and 3.09 eV for TiO2 modified by 2, 4, 6, and 8 mol% Eu3+, respectively. The bandgap energies for TiO2-ETP are 2.72 eV, 2.40 eV, 2.30 eV, and 2.26 eV for TiO2 modified by 2, 4, 6, and 8 mol% ETP, respectively. Compared with the band gap of 3.2 eV of TiO2, the band gaps of TiO2-Eu3+ and TiO2-ETP are decreased. The bandgap decrease is caused by interactions between TiO2 host and dopants, either Eu3+ or ETP in TiO2-Eu3+ and TiO2-ETP, respectively. Based on the results of XRD to indicating the (101) crystal plane distance extension, and the XPS to confirm the interactions between Eu3+-O and the binding energy changes of Eu3d and Ti2p in Eu3+ and ETP, we conclude that Eu3+ and ETP as dopants have interacted with TiO2 in different ways. Thus, these changes can be attributed to the “solubility limit” of Eu3+ and ETP in TiO2 host. The former Eu3+ is from EuCl3·6H2O in which both the Cl counter ion and the bound H2O molecules affect the solubility of Eu3+. However, ETP is a complex with the organic ligand molecules (Phen and TTA), which modify the solubility of ETP. Solubilized ions have efficient interaction with the TiO2 host to change the electron transition bandgap [54]. These interactions also affect the fluorescence behaviors as shown in Figure 8.

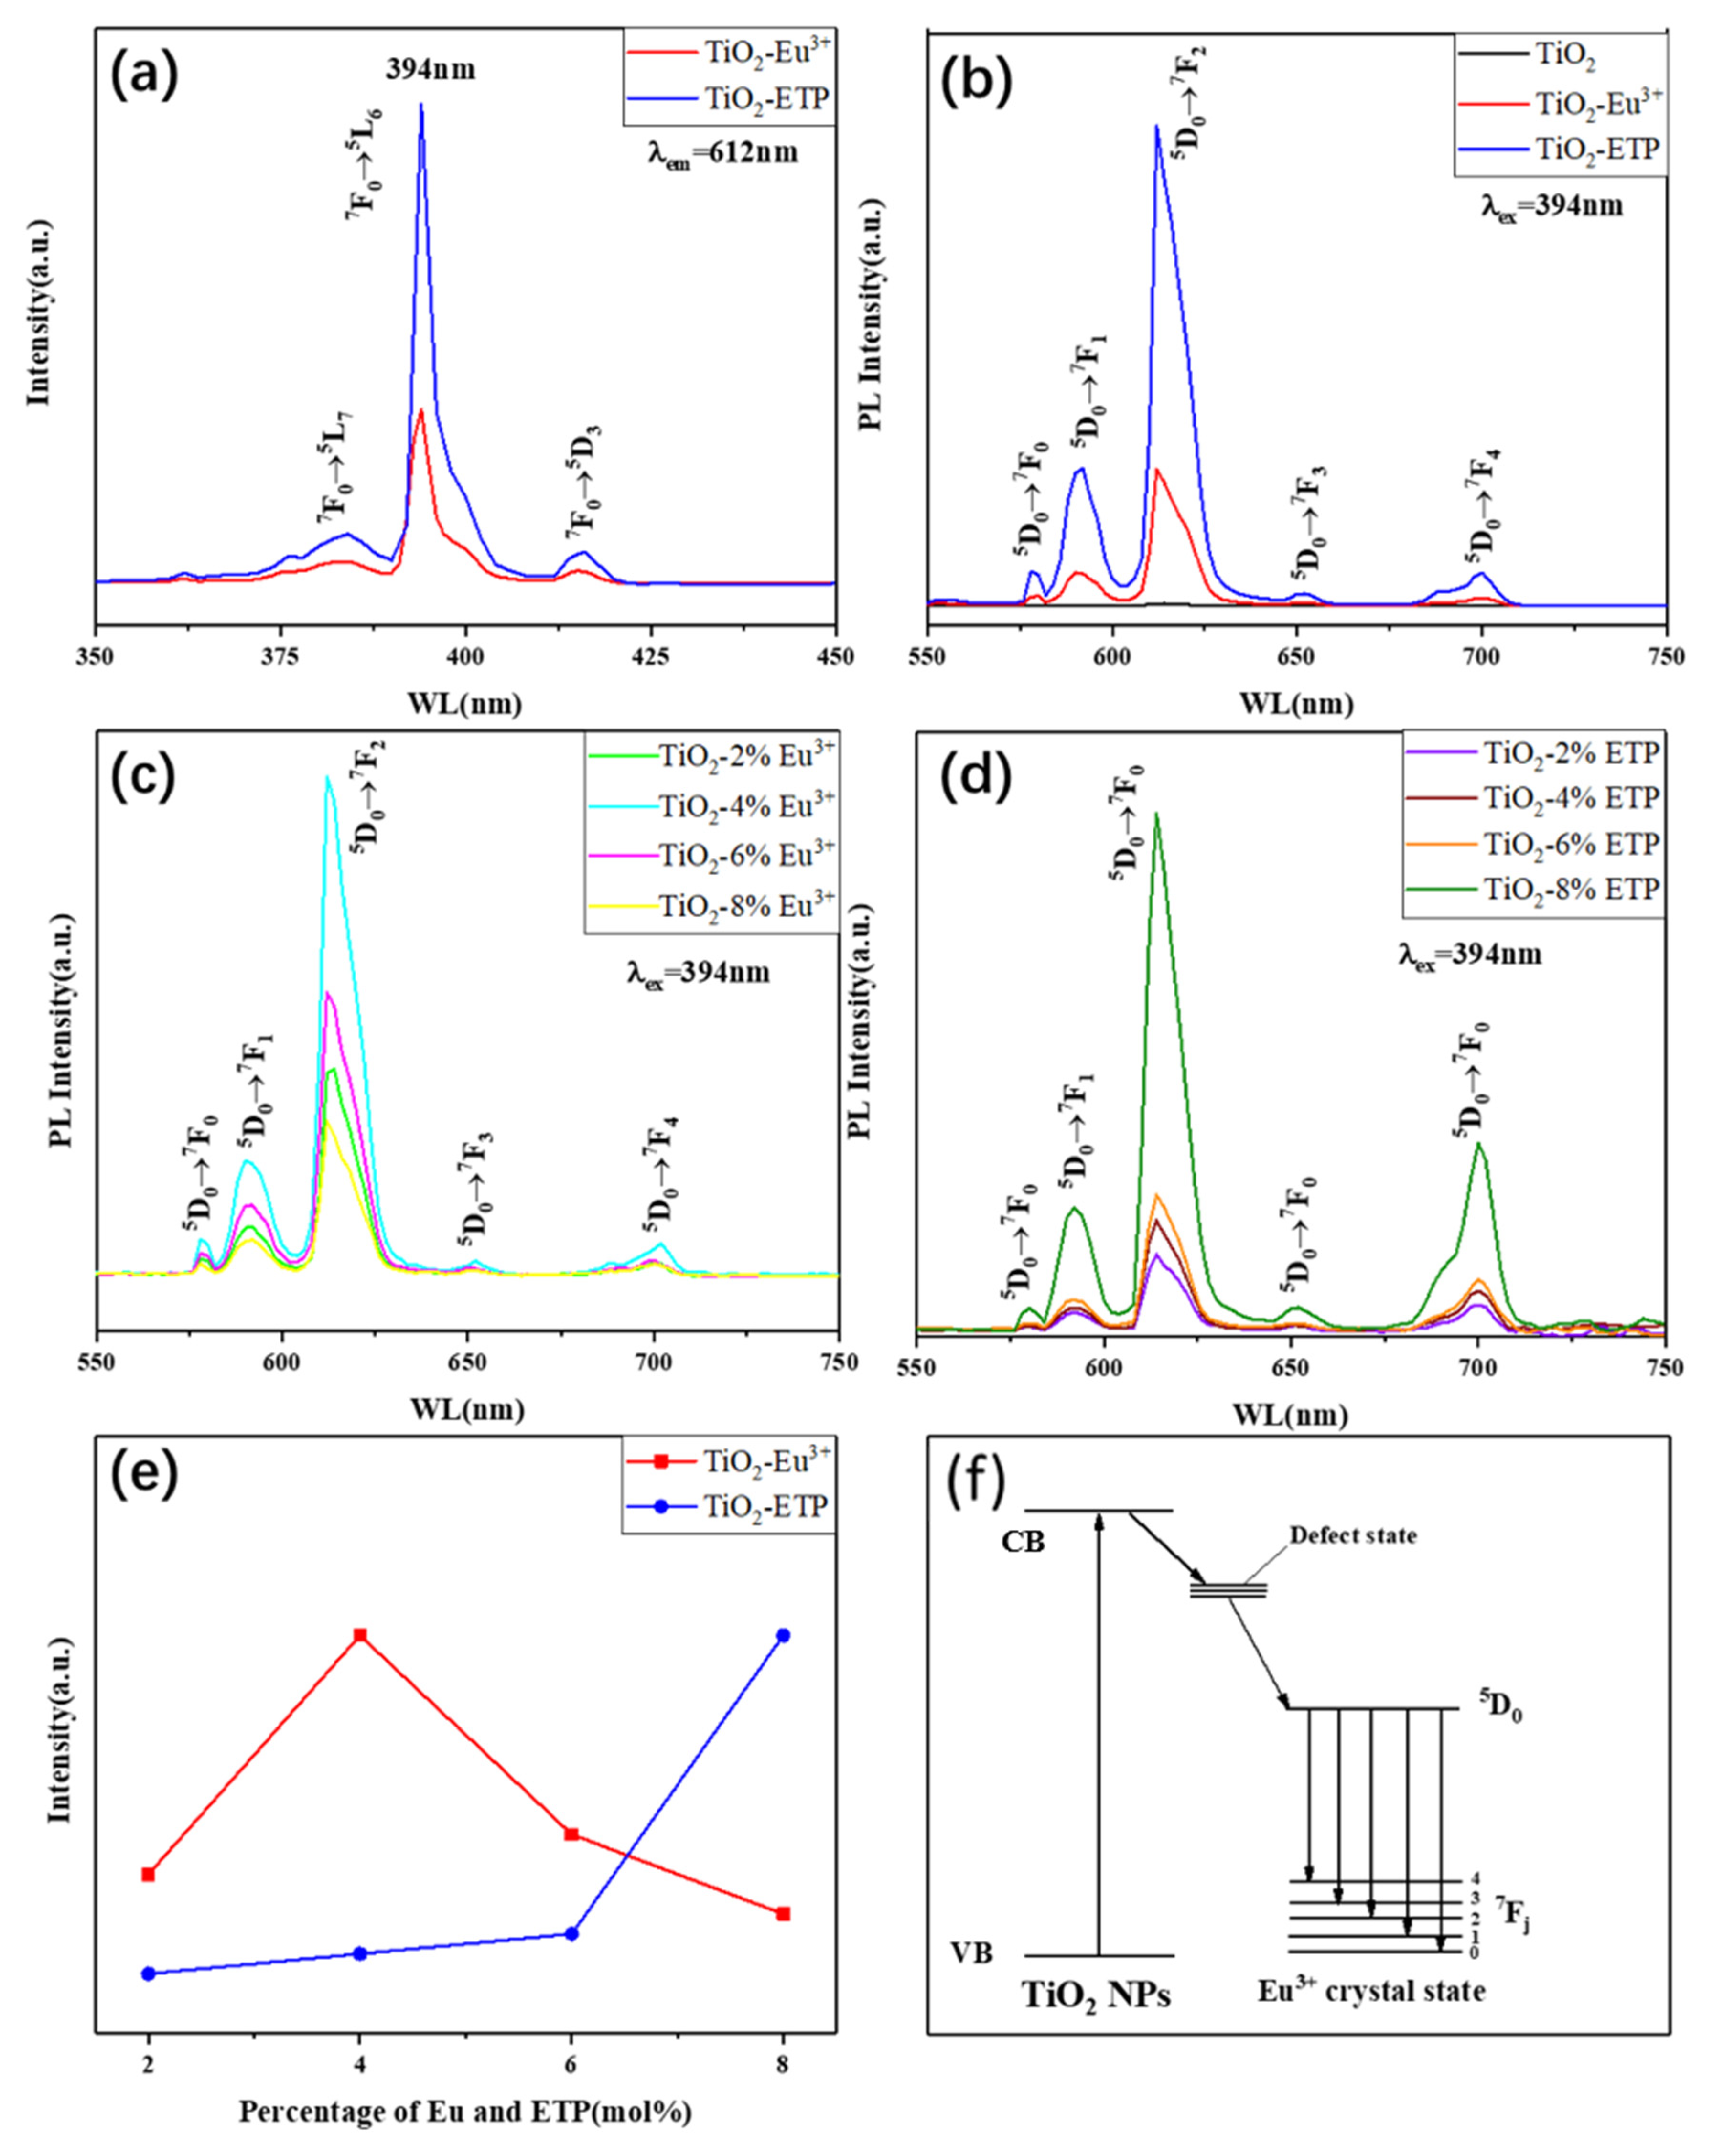
3.5. Photoluminescence Analysis

The luminescence mechanism of Eu3+-complexes is generally described as follows: the organic ligand absorbs incident photons, transitioning from the ground state to the excited singlet state. Normally, the excited electron will experience an intersystem transition from the singlet state to the triplet state. The triplet excited state transfers energy to the S1 excited state of Eu3+, which can subsequently emit a photon when the 5D0 transitions to the 7FJ configurations. The luminescence of TiO2 is due to the electron transition between the valence band and the conduction band. Figure 8a shows the excitation spectra of TiO2-Eu3+ and TiO2-ETP nanoparticles. The excitation spectra are measured by the emission wavelength of the nanoparticles at 612 nm. The characteristic excitation peak is related to the 4f-4f transition of Eu3+ from 7F0. The excitation spectrum consists of sharp lines at 384, 394, 418, and 464 nm, assigned to the 7F05L7, 7F05L6, 7F05D3, and 7F05D2 transitions of Eu3+ [55]. Strong peaks at 394 nm and 464 nm correspond to the 7F05L6 and 7F05D2 Eu3+ transitions. The intensity of the excitation spectrum of TiO2-ETP is higher than that of TiO2-Eu3+. The organic ligands in ETP help absorb more ultraviolet light. Figure 8b shows the emission spectra of TiO2-Eu3+ and TiO2-ETP. When excited at a wavelength of 394 nm, the emission spectrum consists of 5D07FJ (J = 0, 1, 2, 3, 4) (578, 592, 612, 652, and 703 nm) Eu3+ transitions. Due to the allowable electric dipole of the 5D07F2 transition, the strongest emission is produced at 612 nm, which is red. Figure 8c shows the emission spectra of TiO2-Eu3+, prepared with different concentrations of Eu3+ (2, 4, 6, and 8 mol%). The influence of concentration on PL intensity is shown in Figure 8e. The optimal concentration of Eu3+ is 4% [39]. When the concentration exceeds 4%, the fluorescence of TiO2-Eu3+ nanoparticles decreases. This suggests that 4% Eu3+ concentration is the upper solubility limit in the TiO2 host. However, the fluorescence intensity of TiO2-ETP increases with increasing concentrations of ETP. This indicates that the organic ligands in ETP improve the solubility of ETP in the TiO2 host, which provide a more effective “antenna effect” of organic ligands [56,57,58].
Figure 8f shows a diagram of energy levels. Based on XRD, Raman, and XPS analysis, Eu3+ and ETP were successfully incorporated into TiO2 nanoparticles. In Figure 8f, the phrase “defect state” is representative of a variety of defects. Europium ions and ETP will produce point defects in the crystal lattice and combine with oxygen atoms to form Eu-O bonds [59], and the multiple defect energy levels are marked as multiple lines. This indicates that the external ultraviolet rays are absorbed by the TiO2 nanoparticles, and the energy enters the defect state. Energy is then transferred to the Eu in the ETP, realizing the energy transfer process from TiO2 to Eu. Because the energy level of the emission state of Eu3+ is lower than the energy level of the defect in TiO2 nanoparticles, the energy is transferred from the defect state of TiO2 to the crystal field state of Eu3+ ions, which leads to effective photoluminescence of the nanoparticles. Due to the small size and a large number of nanoparticles, there are many surface states available for transferring energy to the states of the crystal field of Eu3+. Figure 9 shows the fluorescence lifetime diagram of TiO2-Eu3+ and TiO2-ETP. The fluorescence attenuation of TiO2-ETP is slower than that of TiO2-Eu3+, and the quantum yield of TiO2-ETP is higher than that of TiO2-Eu3+. The fluorescence lifetime of TiO2-ETP and TiO2-Eu3+ were 0.51 ms and 0.39 ms, and the quantum yields of TiO2-ETP and TiO2-Eu3+ were 10% and 5%.

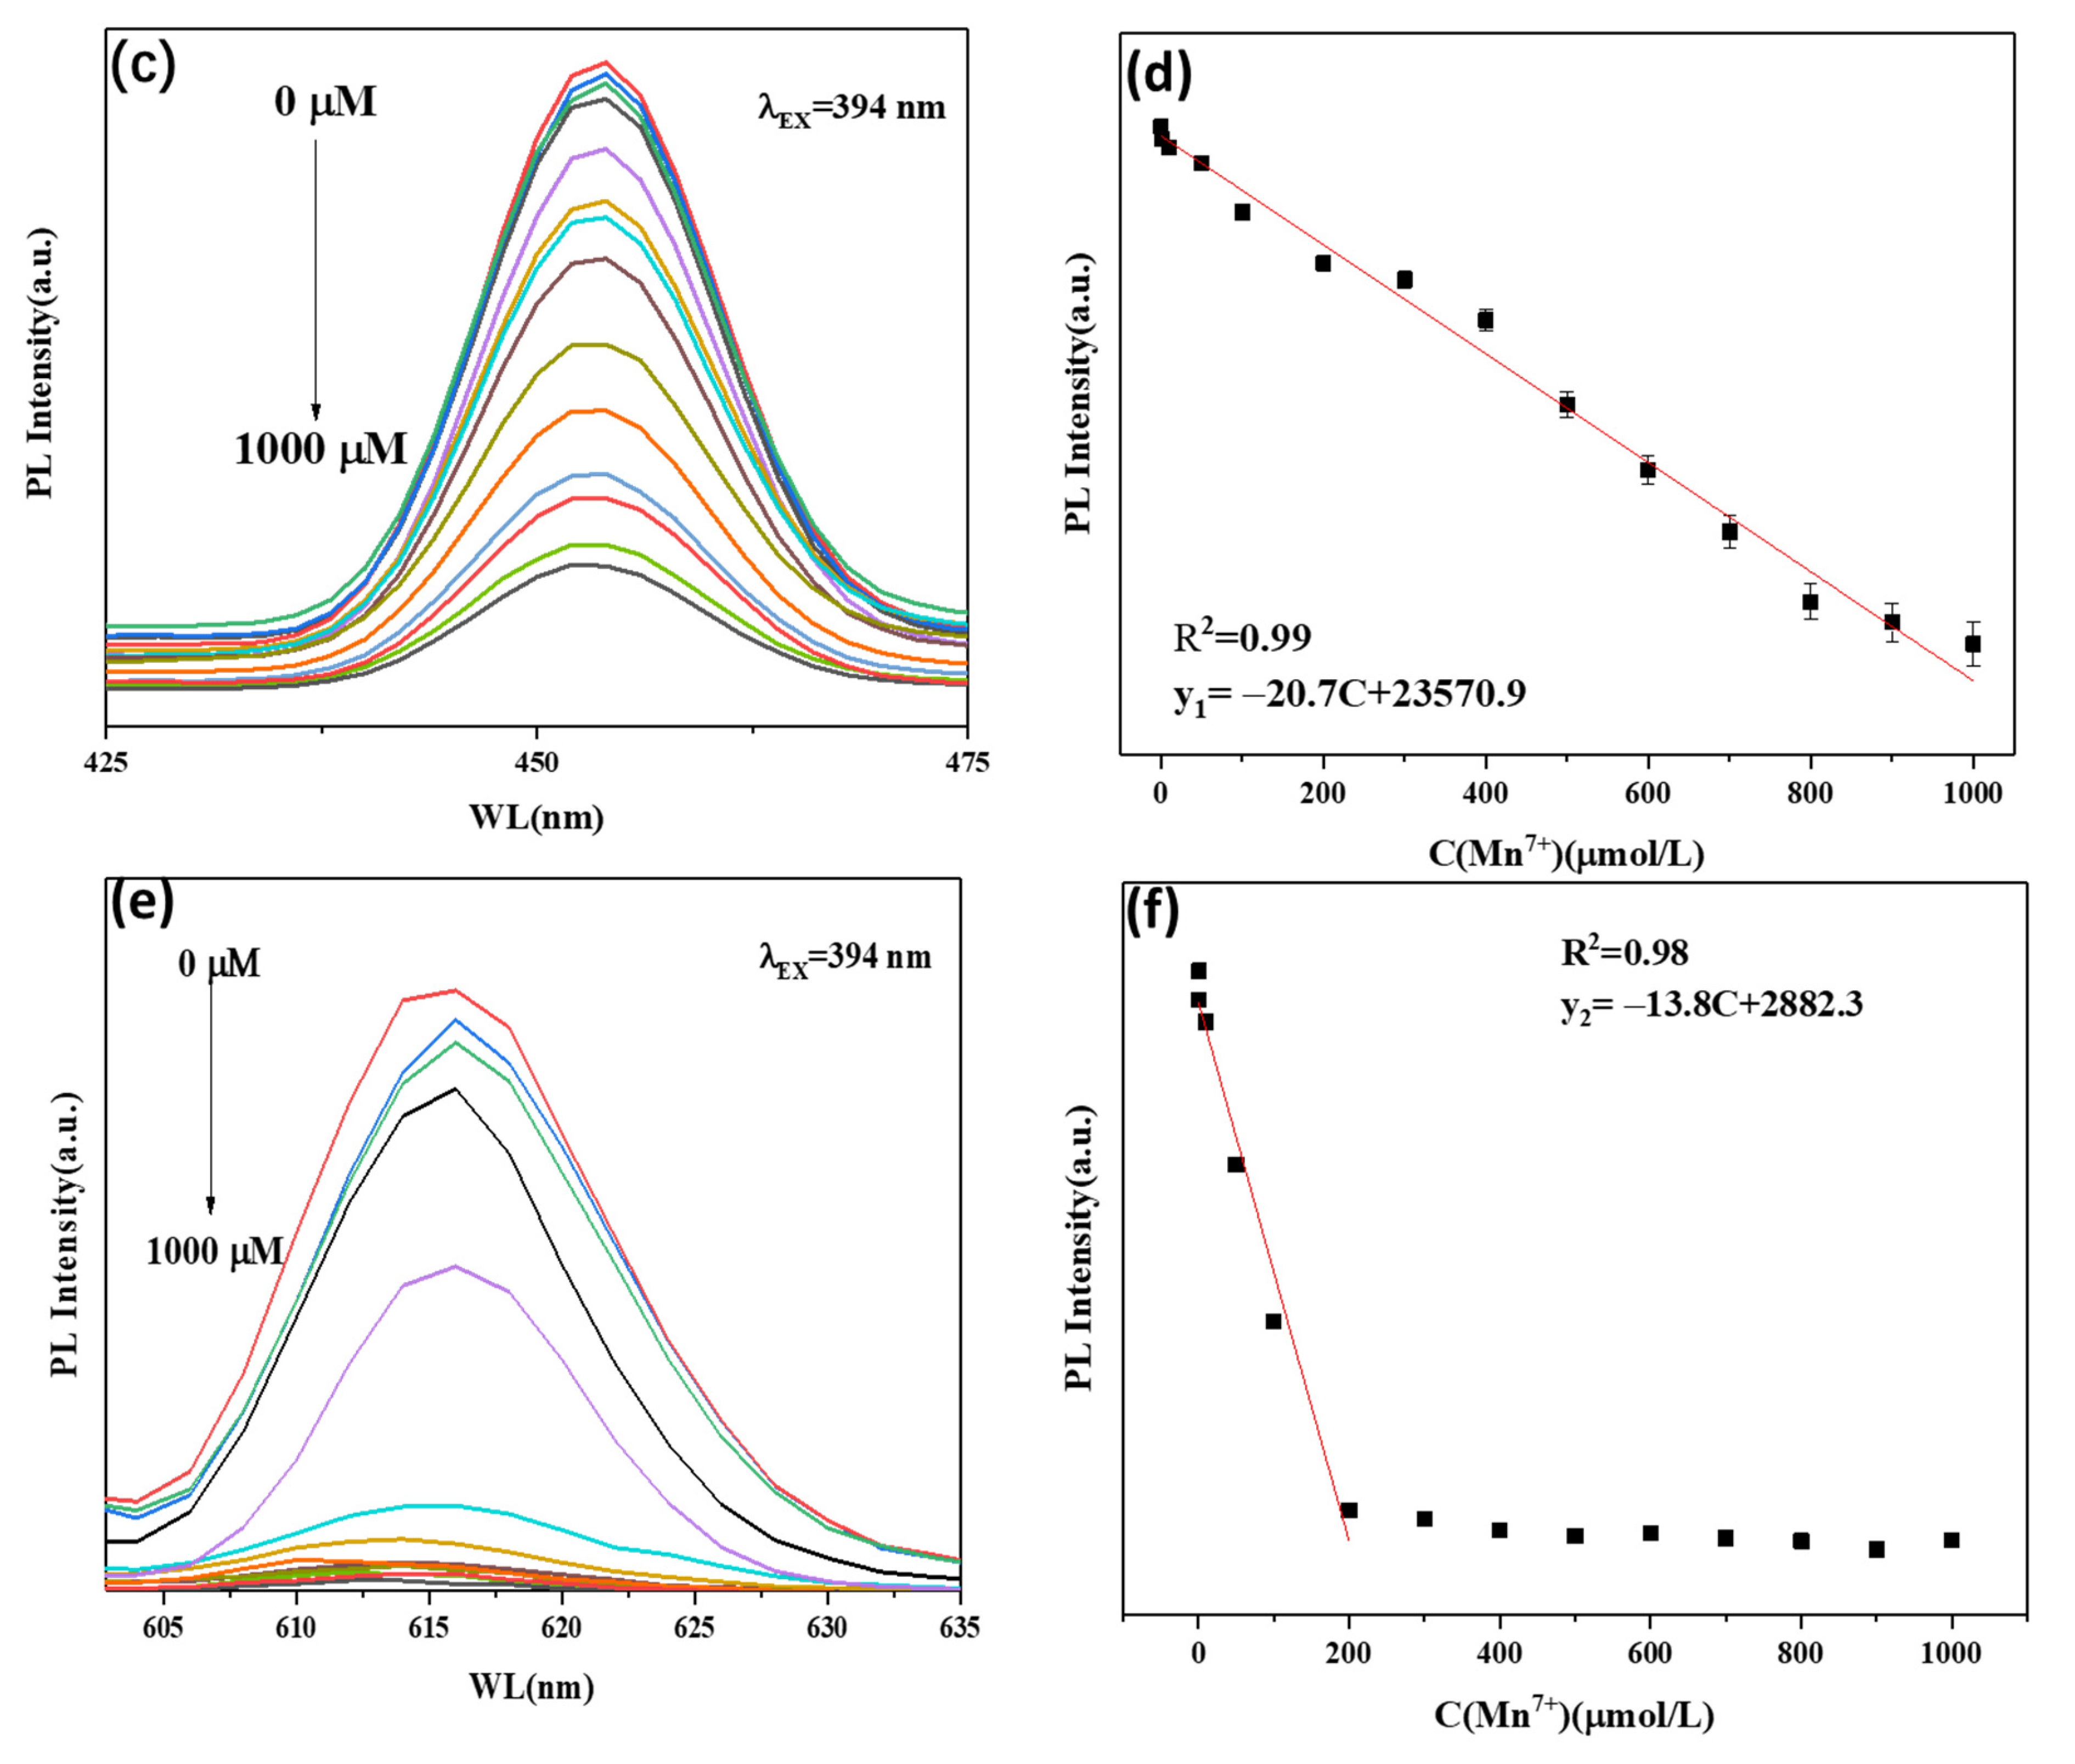
3.6. Fluorescence Spectra of TiO2-ETP in the Presence of Metal Ions

Eu3+ can be complexed with organic ligands containing oxygen or nitrogen groups, such as methyl 1H-benzotriazole and 1,10-phenanthroline monohydrate [60,61]. Therefore, when the europium complex is in contact with metal ions, the fluorescence properties will change. In this paper, common metal cations such as Zn2+, Mn3+, K+, Mn7+, Fe2+, Mg2+, Ca2+, and Co2+ are selected to determine whether these metal ions will affect the fluorescence properties of TiO2-ETP. These experimental analyses prove that these common impurities will not affect the sensitivity of the sensor. The results of these experiments are shown in Figure 10. We have also previously reported of the effects of organic molecules, such as carbohydrates, cholesterol, and amino acids, on the emission of Eu3+ complex in different hosts, showing that the tested organic molecules exhibit no quenching effect [40,62].
As shown in Figure 10a, TiO2-ETP shows a strong fluorescence peak located at 464 and 616 nm with excitation at λex = 394 nm. The fluorescence of TiO2-ETP is influenced by the addition of Mn7+, where a significant quenching effect can be observed. The fluorescence intensity of ETP-modified TiO2 nanoparticles decreases with the increase of Mn7+ concentration in the solution. Figure 10b shows the ratio (I/I0) of the fluorescence intensity of TiO2-ETP in an aqueous solution containing no metal ions and a solution containing a single metal ion. I0 is the fluorescence intensity of TiO2-ETP in the absence of metal ions at 464 nm and 616 nm, and I is the fluorescence intensity of TiO2-ETP at 464 nm and 616 nm in the presence of a single metal ion. It can be seen from Figure 10b that the addition of other metal ions besides Mn7+ will not significantly reduce the fluorescence intensity of TiO2-ETP. The aqueous solution containing Mn7+ will cause fluorescence quenching of TiO2-ETP. The decrease in fluorescence intensity can also be detected by adding TiO2-ETP to an aqueous solution containing a small amount of Mn7+. Experiments show that when other ions are present, only manganese will quench the Eu3+ fluorescence. The possible mechanism of quenching can be either the absorption of photons by Mn7+, or the Mn7+ excimer formation by interaction with the excited state of with ETP, preventing energy transfer to Eu3+. The detection of Mn7+ at the micromolar level can be achieved. Based on the different responses of TiO2-ETP in the presence of Mn7+ and other metal ions, a method is proposed for determining the concentration of Mn7+.
Figure 10c,e shows the relationship between the fluorescence intensity of TiO2-ETP and the concentration of Mn7+ in an aqueous solution. For semiconductor TiO2-ETP, fluorescence quenching is explained by the efficient electron transition process through annihilation of nonradiative electron-hole recombination. The quenching normally is from the Mn7+ acceptance of energy from the excited states of TiO2-ETP. Because there are two excited states corresponding to TiO2 and ETP, the emissions of TiO2 and ETP will be quenched by Mn7+. The Stern–Volmer diagram used to determine the sensitivity of Mn7+ to TiO2-ETP is shown in Figure 10d,f. The Mn7+ concentration is linearly related to the fluorescence intensity. As the concentration of Mn7+ increases from 0 μmol/L to 1 mmol/L, the position of the fluorescence emission peak does not move, and the fluorescence intensity of TiO2-ETP gradually decreases. This linear relationship means that the charge transfer mechanism between Mn7+ and TiO2-ETP is caused by a dynamic mechanism. Figure 10d shows a graph of the variation of the radiation intensity (I/I0) of TiO2 at 464 nm as a function of the concentration of Mn7+. A linear regression equation is obtained: I/I0 = 20.7C + 23,570.9 with a correlation coefficient R2 equal to 0.99 (n = 14), where I0 is the TiO2-ETP radiation intensity at 464 nm, I is the intensity of TiO2-ETP with different concentration of Mn7+, and C is the concentration of Mn7+. Likewise, Figure 10f shows a graph of the variation of the emission intensity (I/I0) of TiO2-ETP at 616 nm as a function of the Mn7+ concentration. The linear regression equation for Mn7+ is I/I0 = 13.8C + 2882.3 (R2 = 0.98, n = 14).

4. Conclusions

In this study, we have synthesized TiO2-ETP nanoparticles using a simple solvothermal process. XRD patterns, Raman spectra, and XPS spectra show that ETP is successfully incorporated into TiO2 nanoparticles. TiO2-ETP nanoparticles exhibit a higher PL intensity than TiO2-Eu3+ nanoparticles upon excitation at a wavelength of 394 nm. With the increase of Eu3+ concentration, the fluorescence intensity of TiO2-Eu3+ at 550–750 nm increases, and the optimal concentration is 4.0 mol%. When the concentration of Eu3+ exceeds 4.0 mol%, the fluorescence decreases, indicating that a solubility limit has been reached. TiO2-ETP overcomes the solubility limit, and realizes a fluorescence increase with increasing ETP concentration. Exploiting the quenching effect of Mn7+ on the fluorescence intensity of TiO2-ETP, a simple and efficient Mn7+ fluorescence sensor was proposed. Unlike the previously reported detection using Eu (TTA)3Phen or TiO2, the detection range of the TiO2-ETP nanomaterial is larger, and the detection accuracy and sensitivity are higher. Experimental results show that the proposed new sensor is practical, can be used to detect real samples, does not exhibit interference with common metal ions, can be used for detection in complex environments, is simple to operate, and has excellent potential for application.

Author Contributions

W.Y.: data curation, formal analysis, writing—original draft, writing—review & editing. S.N.: supervision. Y.W.: supervision. L.H.: supervision. S.W.: supervision. K.C.P.: conceptualization, writing—review & editing. M.J.K.: writing—review & editing. L.A.B.: supervision. J.T.: methodology, conceptualization, writing—review & editing, funding acquisition. All authors have read and agreed to the published version of the manuscript.

Funding

This work was supported by (1) National Natural Science Foundation of China (Jianguo Tang, 51473082, 51878361); (2) State Key Project of International Cooperation Research (Jianguo Tang, 2016YFE0110800, 2017YFE0108300); (3) The National Program for Introducing Talents of Discipline to Universities (“111” plan); (4) 1st class discipline program of Materials Science of Shandong Province, and (5) The Double-Hundred Foreign Expert Program of Shandong Province.

Data Availability Statement

All data, models, and code generated or used during the study appear in the submitted article.

Conflicts of Interest

The authors declare no conflict of interest.

References

  1. Brown, S.; Taylor, N.L. Could mitochondrial dysfunction play a role in manganese toxicity? Environ. Toxicol. Pharmacol. 1999, 7, 49–57. [Google Scholar] [CrossRef]
  2. Gerber, G.B.; Léonard, A.; Hantson, P. Carcinogenicity, mutagenicity and teratogenicity of manganese compounds. Crit. Rev. Oncol. Hematol. 2002, 42, 25–34. [Google Scholar] [CrossRef]
  3. Crossgrove, J.; Wei, Z. Manganese toxicity upon overexposure. NMR Biomed. 2004, 17, 544–553. [Google Scholar] [CrossRef]
  4. Zhong, Q.; Liao, D.X.; Ming, L.X. Review of Research in the Treatment of Electrolytic Manganese Waste Water. China’s Manganese Ind. 2005, 4, 7–9. [Google Scholar]
  5. Horiguchi, T. Mechanism of Manganese Toxicity and Tolerance of Plants. J. Plant Nutr. 1988, 11, 235–246. [Google Scholar] [CrossRef]
  6. Talasek, T. Ion Chromatography—ScienceDirect. Charact. Integr. Circuit Packag. Mater. 1993, 379, 240–242. [Google Scholar]
  7. Porento, M.; Sutinen, V.; Julku, T.; Oikari, R. Detection of copper in water using on-line plasma-excited atomic absorption spectroscopy (AAS). Appl. Spectrosc. 2011, 65, 678–683. [Google Scholar] [CrossRef]
  8. Nardi, E.P.; Evangelista, F.S.; Tormen, L.; Saint, T.D.; Curtius, A.J.; de Souza, S.S.; Barbosa, F., Jr. The use of inductively coupled plasma mass spectrometry (ICP-MS) for the determination of toxic and essential elements in different types of food samples. Food Chem. 2009, 112, 727–732. [Google Scholar] [CrossRef]
  9. Groves, J.T.; Lee, J.; Marla, S.S. Detection and Characterization of an Oxomanganese(V) Porphyrin Complex by Rapid-Mixing Stopped-Flow Spectrophotometry. J. Am. Chem. Soc. 1997, 119, 6269–6273. [Google Scholar] [CrossRef]
  10. Citak, D.; Tuzen, M.; Soylak, M. Speciation of Mn(II), Mn(VII) and total manganese in water and food samples by coprecipitation-atomic absorption spectrometry combination. J. Hazard. Mater. 2010, 173, 773–777. [Google Scholar] [CrossRef]
  11. Qian, A.X.; He, G.H.; Han, X. Separation and preconcentration of MnVII/MnII speciation on crosslinked chitosan and determination by flame atomic absorption spectrometry. Analyst 2001, 126, 239–241. [Google Scholar] [CrossRef]
  12. Pandya, S.; Yu, J.; Parker, D. Engineering emissive europium and terbium complexes for molecular imaging and sensing. Dalton Trans. 2006, 2757–2766. [Google Scholar] [CrossRef] [PubMed]
  13. Potts, P.J.; Webb, P.C. X-ray fluorescence spectrometry. J. Geochem. Explor. 2012, 44, 251–296. [Google Scholar] [CrossRef]
  14. Ferreira, V.J.; Almeida, J.S.; Lemos, V.A.; de Oliveira, O.M.C.; Garcia, K.S.; Teixeira, L.S.G. Determination of Cu, Ni, Mn, and Pb in diesel oil samples using reversed-phase vortex-assisted liquid-liquid microextraction associated with energy dispersive X-ray fluorescence spectrometry. Talanta 2021, 222, 121514. [Google Scholar] [CrossRef] [PubMed]
  15. Thompson, R.B. Fluorescence Sensors and Biosensors. Fluoresc. Sens. Biosens. 2006, 23, 2757–2766. [Google Scholar]
  16. Silva, A.P.D.; Gunaratne, H.Q.N.; Gunnlaugsson, T.; Huxley, A.J.M.; Rice, T.E. ChemInform Abstract: Signaling Recognition Events with Fluorescent Sensors and Switches. Chem. Rev. 1997, 97, 1515–1566. [Google Scholar] [CrossRef] [PubMed]
  17. Wu, P.; Hou, X.; Xu, J.J.; Chen, H.Y. Ratiometric fluorescence, electrochemiluminescence, and photoelectrochemical chemo/biosensing based on semiconductor quantum dots. Nanoscale 2016, 8, 8427–8442. [Google Scholar] [CrossRef]
  18. Zhang, Y.R.; Zhao, Z.M.; Miao, J.Y.; Zhao, B.X. A ratiometric fluorescence probe based on a novel FRET platform for imaging endogenous HOCl in the living cells. Sens. Actuators B Chem. 2016, 229, 408–413. [Google Scholar] [CrossRef]
  19. Liu, Z.M.; Feng, L.; Hou, J.; Lv, X.; Ning, J.; Ge, G.B.; Wang, K.W.; Cui, J.N.; Yang, L. A ratiometric fluorescent sensor for highly selective detection of human carboxylesterase 2 and its application in living cells. Sens. Actuators B Chem. 2014, 205, 151–157. [Google Scholar] [CrossRef]
  20. Long, L.; Lin, W.; Chen, B.; Gao, W.; Yuan, L. Construction of a FRET-based ratiometric fluorescent thiol probe. Chem. Commun. 2010, 47, 893. [Google Scholar] [CrossRef]
  21. Wang, K.; Qian, J.; Jiang, D.; Yang, Z.; Du, X.; Wang, K. Onsite naked eye determination of cysteine and homocysteine using quencher displacement-induced fluorescence recovery of the dual-emission hybrid probes with desired intensity ratio. Biosens. Bioelectron. 2015, 65, 83–90. [Google Scholar] [CrossRef] [PubMed]
  22. Zhang, L.Y.K. A novel core-satellite CdTe/Silica/Au \{NCs\} hybrid sphere as dual-emission ratiometric fluorescent probe for Cu2+. Biosens. Bioelectron. 2014, 51, 40–46. [Google Scholar] [CrossRef] [PubMed]
  23. Liu, F.; He, J.; Zeng, M.; Hao, J.; Guo, Q.; Song, Y.; Wang, L. Cu–hemin metal-organic frameworks with peroxidase-like activity as peroxidase mimics for colorimetric sensing of glucose. J. Nanopart. Res. 2016, 18, 106. [Google Scholar] [CrossRef]
  24. Dong, Y.; Cai, J.; Fang, Q.; You, X.; Chi, Y. Dual-Emission of Lanthanide Metal–Organic Frameworks Encapsulating Carbon-Based Dots for Ratiometric Detection of Water in Organic Solvents. Anal. Chem. 2016, 88, 1748. [Google Scholar] [CrossRef]
  25. Zhang, Z.; Zhao, Y.; Gong, Q.; Li, Z.; Li, J. MOFs for CO2 capture and separation from flue gas mixtures: The effect of multifunctional sites on their adsorption capacity and selectivity. Chem. Commun. 2012, 49, 653–661. [Google Scholar] [CrossRef] [PubMed]
  26. Cui, Y.; Yue, Y.; Qian, G.; Chen, B. Luminescent Functional Metal-Organic Frameworks. Chem. Rev. 2012, 112, 1126–1162. [Google Scholar] [CrossRef]
  27. Rocha, J.; Carlos, L.; Paz, F.A.; Ananias, D. Luminescent multifunctional lanthanides-based metal-organic frameworks. Chem. Soc. Rev. 2011, 40, 926–940. [Google Scholar] [CrossRef]
  28. Zhou, Y.; Zhang, D.; Zeng, J.; Gan, N.; Cuan, J. A luminescent Lanthanide-free MOF nanohybrid for highly sensitive ratiometric temperature sensing in physiological range. Talanta 2018, 181, 410–415. [Google Scholar] [CrossRef]
  29. Kaczmarek, A.M.; Kristof, V.H.; Rik, V.D. Enhanced luminescence in Ln3?-doped Y?WO? (Sm, Eu, Dy) 3D microstructures through Gd3? Codoping. Inorg. Chem. 2014, 53, 9498–9508. [Google Scholar] [CrossRef]
  30. Dorenbos, P. The 4fn4fn-15d transitions of the trivalent lanthanides in halogenides and chalcogenides. J. Lumin. 2000, 91, 91–106. [Google Scholar] [CrossRef]
  31. Werts, M.H.V.; Jukes, R.T.F.; Verhoeven, J.W. The emission spectrum and the radiative lifetime of Eu3+ in luminescent lanthanide complexes. Phys. Chem. Chem. Phys. 2002, 4, 1542–1548. [Google Scholar] [CrossRef]
  32. Linsebigler, A.L.; Lu, G.; Yates, J.T. Photocatalysis on TiO2 Surfaces: Principles, Mechanisms, and Selected Results. Chem. Rev. 1995, 95, 735–758. [Google Scholar] [CrossRef]
  33. Zhai, D.; Zhang, K.; Yong, Z.; Sun, H.; Fan, G. Mesoporous silica equipped with europium-based chemosensor for mercury ion detection: Synthesis, characterization, and sensing performance. Inorg. Chim. Acta 2012, 387, 396–400. [Google Scholar] [CrossRef]
  34. Zhang, M.; Zhan, G.; Chen, Z. Iodometric Amplification Method for the Determinations of Microgram Amounts of Manganese(II), Manganese(VII), Chromium(III) and Chromium(VI) in Aqueous Solution. Anal. Ences 2005, 14, 1077–1083. [Google Scholar] [CrossRef] [Green Version]
  35. Zheng, K.; Xu, X.; Zhao, H.; Song, Y.; Sheng, Y.; Huo, Q.; Zou, H. Facile synthesis of TiO2:Eu3+ spindle shaped nanoparticles from titanate nanobelt precursors. Powder Technol. 2012, 228, 277–283. [Google Scholar]
  36. Lazzeri, M.; Vittadini, A.; Selloni, A. Erratum, Structure and energetics of stoichiometric TiO2 anatase surfaces. Phys. Rev. B 2001, 65, 011990. [Google Scholar]
  37. Wang, H.; Wang, Y.; Yang, Y.; Li, X.; Wang, C. Photoluminescence properties of the rare-earth ions in the TiO2 host nanofibers prepared via electrospinning. Mater. Res. Bull. 2009, 44, 408–414. [Google Scholar] [CrossRef]
  38. Vranješ, M.; Kuljanin-Jakovljević, J.; Radetić, T.; Stoiljković, M.; Mitrić, M.; Šaponjić, Z.V.; Nedeljković, J. Structure and luminescence properties of Eu3+ doped TiO2 nanocrystals and prolate nanospheroids synthesized by the hydrothermal processing. Ceram. Int. 2012, 38, 5629–5636. [Google Scholar] [CrossRef]
  39. Qi, X.; Zou, H.; Song, Y.; Zhang, H.; Zhao, H.; Shi, Z.; Sheng, Y. Hydrothermal synthesis and luminescence properties of TiO2: Eu3+ submicrospheres. Ceram. Int. 2014, 40, 12993–12997. [Google Scholar] [CrossRef]
  40. Hsiao, R.C.; Arul, N.S.; Mangalaraj, D.; Juang, R.S. Influence of Eu3+ doping on the degradation property of TiO2 nanostructures. J. Optoelectron. Adv. Mater. 2010, 12, 193–198. [Google Scholar]
  41. Pal, M.; Pal, U.; Jiménez, J.M.G.Y.; Pérez-Rodríguez, F. Effects of crystallization and dopant concentration on the emission behavior of TiO2:Eu nanophosphors. Nanoscale Res. Lett. 2012, 7, 1. [Google Scholar] [CrossRef] [Green Version]
  42. Zhang, W.F.; He, Y.L.; Zhang, M.S.; Yin, Z.; Chen, Q.Y.Z. Raman scattering study on anatase TiO2 nanocrystals. J. Phys. D Appl. Phys. 2000, 33, 912. [Google Scholar] [CrossRef]
  43. Zhang, J.; Li, M.; Feng, Z.; Chen, J.; Li, C. UV Raman spectroscopic study on TiO2. I. Phase transformation at the surface and in the bulk. J. Phys. Chem. B 2006, 110, 927–935. [Google Scholar] [CrossRef]
  44. Bersani, D.; Lottici, P.P.; Ding, X.Z. Phonon confinement effects in the Raman scattering by TiO2 nanocrystals. Appl. Phys. Lett. 1998, 72, 73–75. [Google Scholar] [CrossRef]
  45. Su, B.; Wang, S.; Yang, W.; Wang, Y.; Huang, L.; Popat, K.C.; Kipper, M.J.; Belfiore, L.A.; Tang, J. Synthesis of Eu-modified luminescent Titania nanotube arrays and effect of voltage on morphological, structural and spectroscopic properties. Mater. Sci. Semicond. Process. 2020, 113, 105026. [Google Scholar] [CrossRef]
  46. Tan, X.; Fan, Q.; Wang, X.; Grambow, B. Eu(III) sorption to TiO2 (anatase and rutile): Batch, XPS, and EXAFS studies. Environ. Sci. Technol. 2009, 43, 3115–3121. [Google Scholar] [CrossRef]
  47. Diebold, U. TiO2 by XPS. Surf. Sci. Spectra 1996, 4, 227–231. [Google Scholar] [CrossRef]
  48. Feng, X.; Yang, L.; Zhang, N.; Liu, Y. A facile one-pot hydrothermal method to prepare europium-doped titania hollow phosphors and their sensitized luminescence properties. J. Alloy. Compd. 2010, 506, 728–733. [Google Scholar] [CrossRef]
  49. Khan, S.B.; Rahman, M.M.; Asiri, A.M.; Marwani, H.M.; Bawaked, S.M.; Alamry, K.A. Co3O4 co-doped TiO2 nanoparticles as a selective marker of lead in aqueous solution. New J. Chem. 2013, 37, 2888–2893. [Google Scholar] [CrossRef]
  50. Yu, J.; Xiang, Q.; Zhou, M. Preparation, characterization and visible-light-driven photocatalytic activity of Fe-doped titania nanorods and first-principles study for electronic structures. Appl. Catal. B: Environ. 2009, 90, 595–602. [Google Scholar] [CrossRef]
  51. Krasil’Nikov, V.N.; Zhukov, V.P.; Perelyaeva, L.A.; Baklanova, I.V.; Shein, I.R. Electronic band structure, optical absorption, and photocatalytic activity of iron-doped anatase. Phys. Solid State 2013, 55, 1903–1912. [Google Scholar] [CrossRef]
  52. Yamashita, H.; Harada, M.; Misaka, J.; Takeuchi, M.; Anpo, M. Degradation of propanol diluted in water under visible light irradiation using metal ion-implanted titanium dioxide photocatalysts. J. Photochem. Photobiol. A Chem. 2002, 148, 257–261. [Google Scholar] [CrossRef]
  53. Komaraiah, D.; Radha, E.; Kalarikkal, N.; Sivakumar, J.; Reddy, M.R.; Sayanna, R. Structural, optical and photoluminescence studies of sol-gel synthesized pure and iron doped TiO2 photocatalysts. Ceram. Int. 2019, 45, 25060–25068. [Google Scholar] [CrossRef]
  54. Singh, D.; Singh, N.; Sharma, S.D.; Kant, C.; Sharma, C.P.; Pandey, R.R.; Saini, K.K. Bandgap modification of TiO2 sol–gel films by Fe and Ni doping. J. Sol.-Ge.l Sci. Technol. 2011, 58, 269–276. [Google Scholar] [CrossRef]
  55. Qi, X.; Song, Y.; Sheng, Y.; Zhang, H.; Zhao, H.; Shi, Z.; Zou, H. Controllable synthesis and luminescence properties of TiO2:Eu3+ nanorods, nanoparticles and submicrospheres by hydrothermal method. Opt. Mater. 2014, 38, 193–197. [Google Scholar] [CrossRef]
  56. Shahi, P.K.; Singh, A.K.; Singh, S.K.; Rai, S.B.; Ullrich, B. Revelation of the Technological Versatility of the Eu(TTA)3Phen Complex by Demonstrating Energy Harvesting, Ultraviolet Light Detection, Temperature Sensing, and Laser Applications. Acs. Appl. Mater. Interfaces 2015, 7, 18231–18239. [Google Scholar] [CrossRef] [PubMed]
  57. Yan, B.; Li, Y. Luminescent ternary inorganic-organic mesoporous hybrids Eu(TTASi-SBA-15)phen: Covalent linkage in TTA directly functionalized SBA-15. Dalton Trans. 2010, 39, 1480–1487. [Google Scholar] [CrossRef]
  58. Coban, M.B.; Kocak, C.; Kara, H.; Aygun, M.; Amjad, A. Magnetic properties and sensitized visible and NIR luminescence of DyIII and EuIII coordination polymers by energy transfer antenna ligands. Mol. Cryst. Liq. Cryst. 2017, 648, 202–215. [Google Scholar] [CrossRef]
  59. Frindell, K.L.; Bartl, M.H.; Robinson, M.R.; Bazan, G.C.; Popitsch, A.; Stucky, G.D. Visible and near-IR luminescence via energy transfer in rare earth doped mesoporous titania thin films with nanocrystalline walls. J. Solid State Chem. 2003, 172, 81–88. [Google Scholar] [CrossRef]
  60. Knyazev, A.A.; Karyakin, M.E.; Krupin, A.S.; Romanova, K.A.; Galyametdinov, Y.G. Influence of Eu(III) Complexes Structural Anisotropy on Luminescence of Doped Conjugated Polymer Blends. Inorg. Chem. 2017, 56, 6067–6075. [Google Scholar] [CrossRef]
  61. Rino, L.; Simes, W.; Santos, G.; Fonseca, F.J.; Andrade, A.M.; Deichmann, V.A.F.; Akcelrud, L.; Pereira, L. Photo and electroluminescence behavior of Tb(ACAC)3phen complex used as emissive layer on organic light emitting diodes. J. Non.-Cryst. Solids 2008, 354, 5326–5327. [Google Scholar] [CrossRef]
  62. Song, Z.; Wang, J.; Liu, J.; Wang, X.; Tang, J. Eu3+-Induced Polysaccharide Nano-Dumbbell Aggregates (PNDA) as Drug Carriers to Smartly Report Drug Concentration through Variable Fluorescence. Sens. Actuators B Chem. 2021, 336, 129724. [Google Scholar] [CrossRef]
Figure 1. Schematic illustration of TiO2 nanoparticles modified with Eu(TTA)3Phen preparation and sensing mechanism of manganese ion concentration.
Nanomaterials 11 03283 g001
Figure 2. Flow chart of TiO2-ETP preparation.
Nanomaterials 11 03283 g002
Figure 3. TEM images of (a) TiO2 (b) TiO2-Eu3+ (c) TiO2-ETP and diameter distribution histograms of (d) TiO2, (e) TiO2-Eu3+, (f) TiO2-ETP.
Nanomaterials 11 03283 g003
Figure 4. XRD patterns for (a) TiO2, (b) TiO2-Eu3+, (c) TiO2-ETP.
Nanomaterials 11 03283 g004
Figure 5. Raman spectra of TiO2, TiO2-Eu3+, and TiO2-ETP.
Nanomaterials 11 03283 g005
Figure 6. (A) Survey XPS spectra, (B) XPS spectra of Ti2p, (C) XPS spectra of Eu3d, (D) XPS spectra of O1s in TiO2, (E) XPS spectra of O1s in TiO2-Eu3+, (F) XPS spectra of O1s in TiO2-ETP.
Nanomaterials 11 03283 g006
Figure 7. UV-Vis spectra (a,c) of TiO2-Eu3+ and TiO2-ETP nanoparticles prepared with different amounts of the dopant (2%, 4%, 6%, and 8%). Kubelka-Munk function for band gap estimation (b,d) of TiO2-Eu3+ and TiO2-ETP.
Nanomaterials 11 03283 g007
Figure 8. The photoluminescence excitation spectra (a) and emission spectra (bd) of TiO2, TiO2-Eu3+ and TiO2-ETP nanoparticles; fluorescence intensity vs. concentration curve (e) and energy transfer diagram (f) of TiO2, TiO2-Eu3+ and TiO2-ETP.
Nanomaterials 11 03283 g008
Figure 9. The fluorescence lifetime diagram of TiO2-Eu3+ and TiO2-ETP.
Nanomaterials 11 03283 g009
Figure 10. (a) Fluorescence spectra of TiO2-ETP with metal ions, (b) fluorescence intensity ratio (I/I0) of the TiO2-ETP in an aqueous solution containing no metal ions and a solution containing a single metal ion, (c,e) fluorescence intensity versus cation concentration for the addition of the Mn7+ ions, (d,f) the linear plot of ΔF/F0 against the concentration of Mn7+.
Nanomaterials 11 03283 g010aNanomaterials 11 03283 g010b
Table 1. XRD results with parameters.
Samplehkl2θ (deg)D (Å)FWHM (deg)Mean Grain Size (nm)Crystal Structure
TiO210125.343.510.67115.1tetragonal
00437.842.370.84615.0tetragonal
20048.071.890.71015.1tetragonal
TiO2-Eu3+10125.313.501.11512.2tetragonal
00437.662.380.78612.4tetragonal
20047.881.890.82512.1tetragonal
TiO2-ETP10125.063.550.9669.0tetragonal
00437.482.390.8479.1tetragonal
20047.761.900.9718.9tetragonal
Publisher’s Note: MDPI stays neutral with regard to jurisdictional claims in published maps and institutional affiliations.

