
Bamboo-Based Mesoporous Activated Carbon for High-Power-Density Electric Double-Layer Capacitors


Abstract
:1. Introduction
2. Experimental
2.1. Sample Preparation
2.1.1. Phosphoric Acid Stabilization
2.1.2. Carbonization
2.1.3. Steam Activation
2.2. Characterization
2.3. Electrochemical Tests
3. Results and Discussion
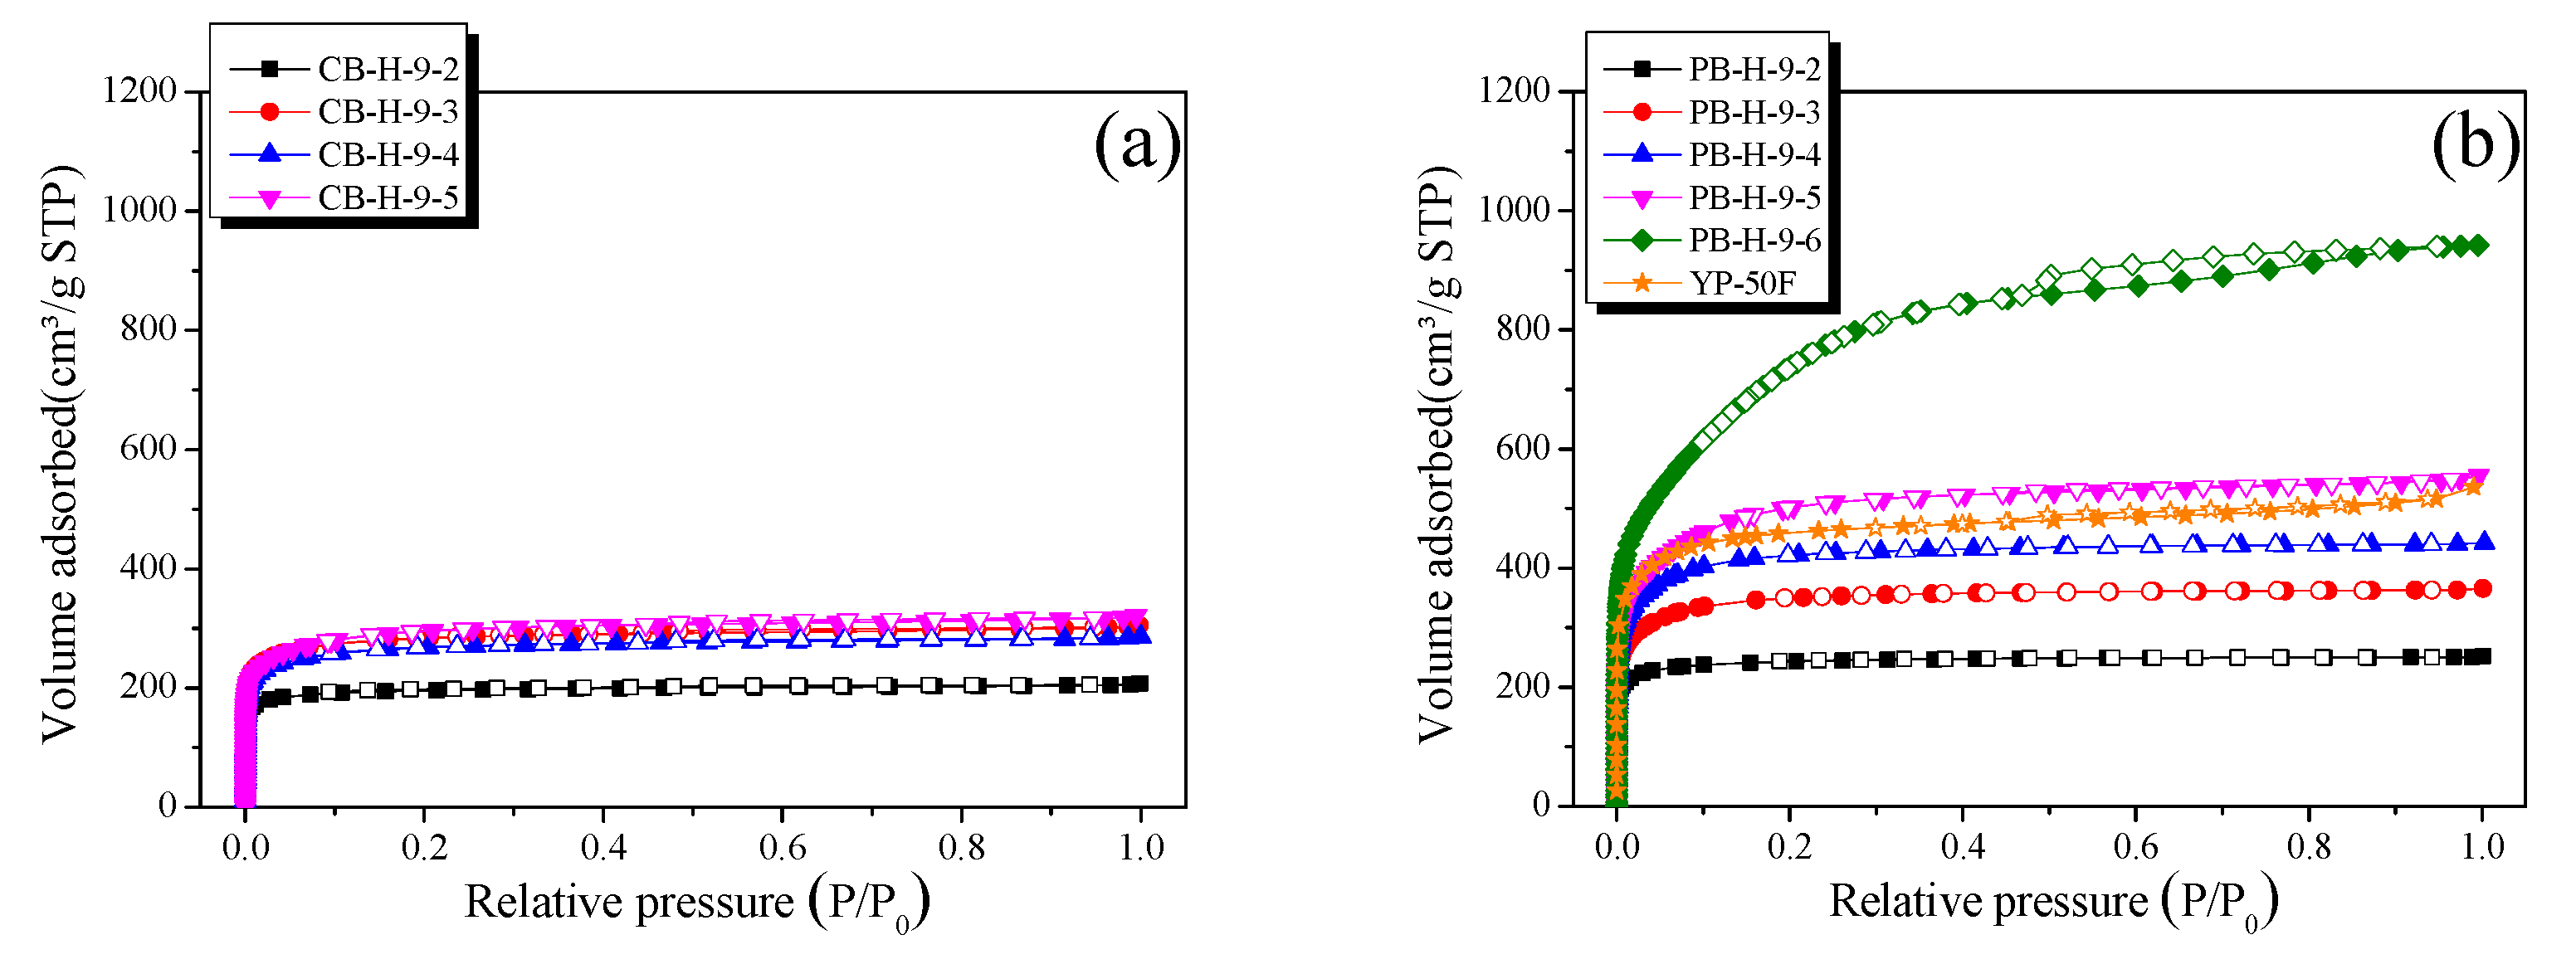
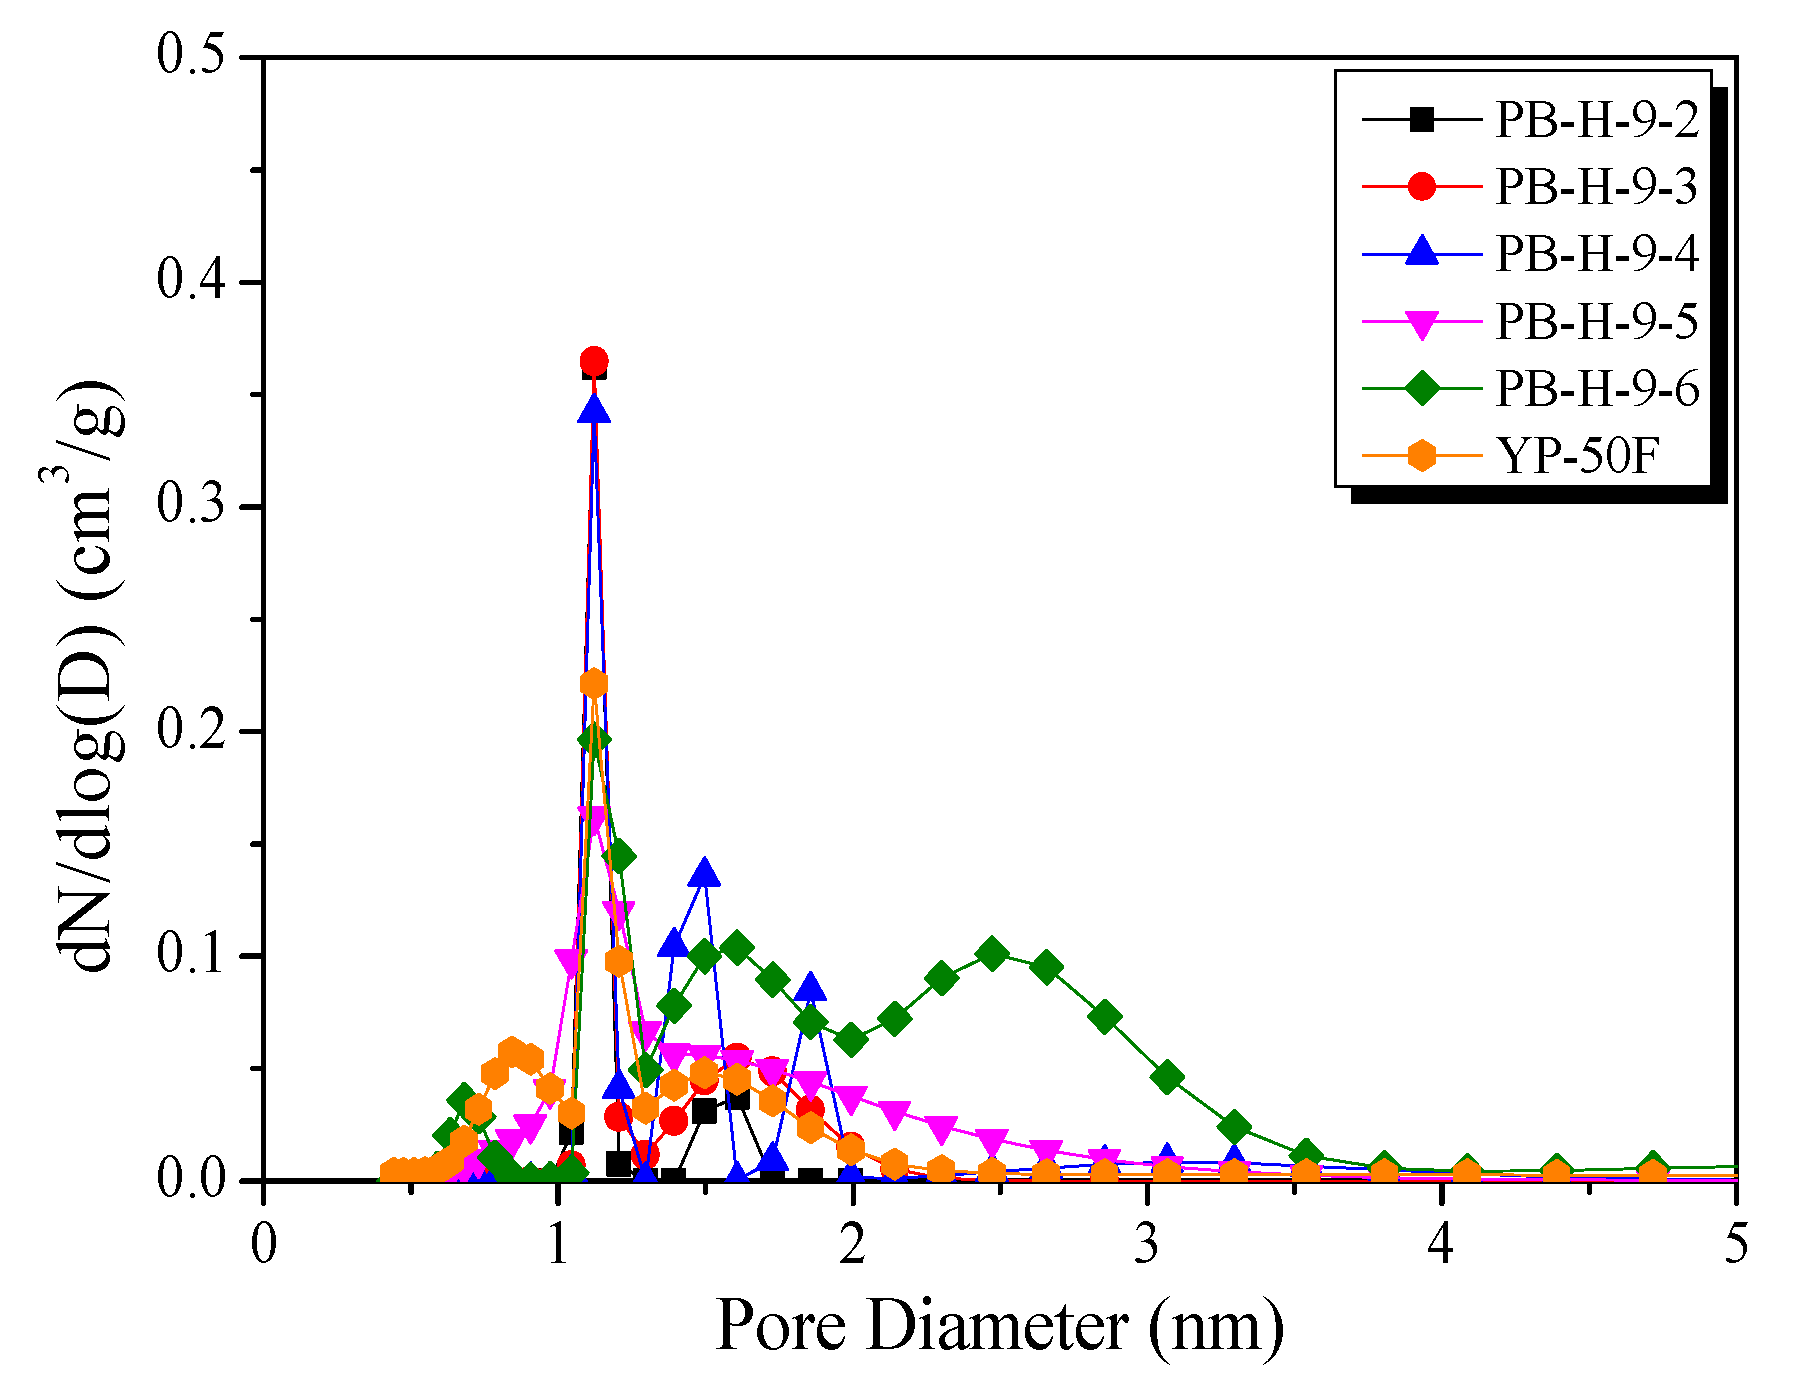
3.1. Adsorption Isotherms and Textural Properties
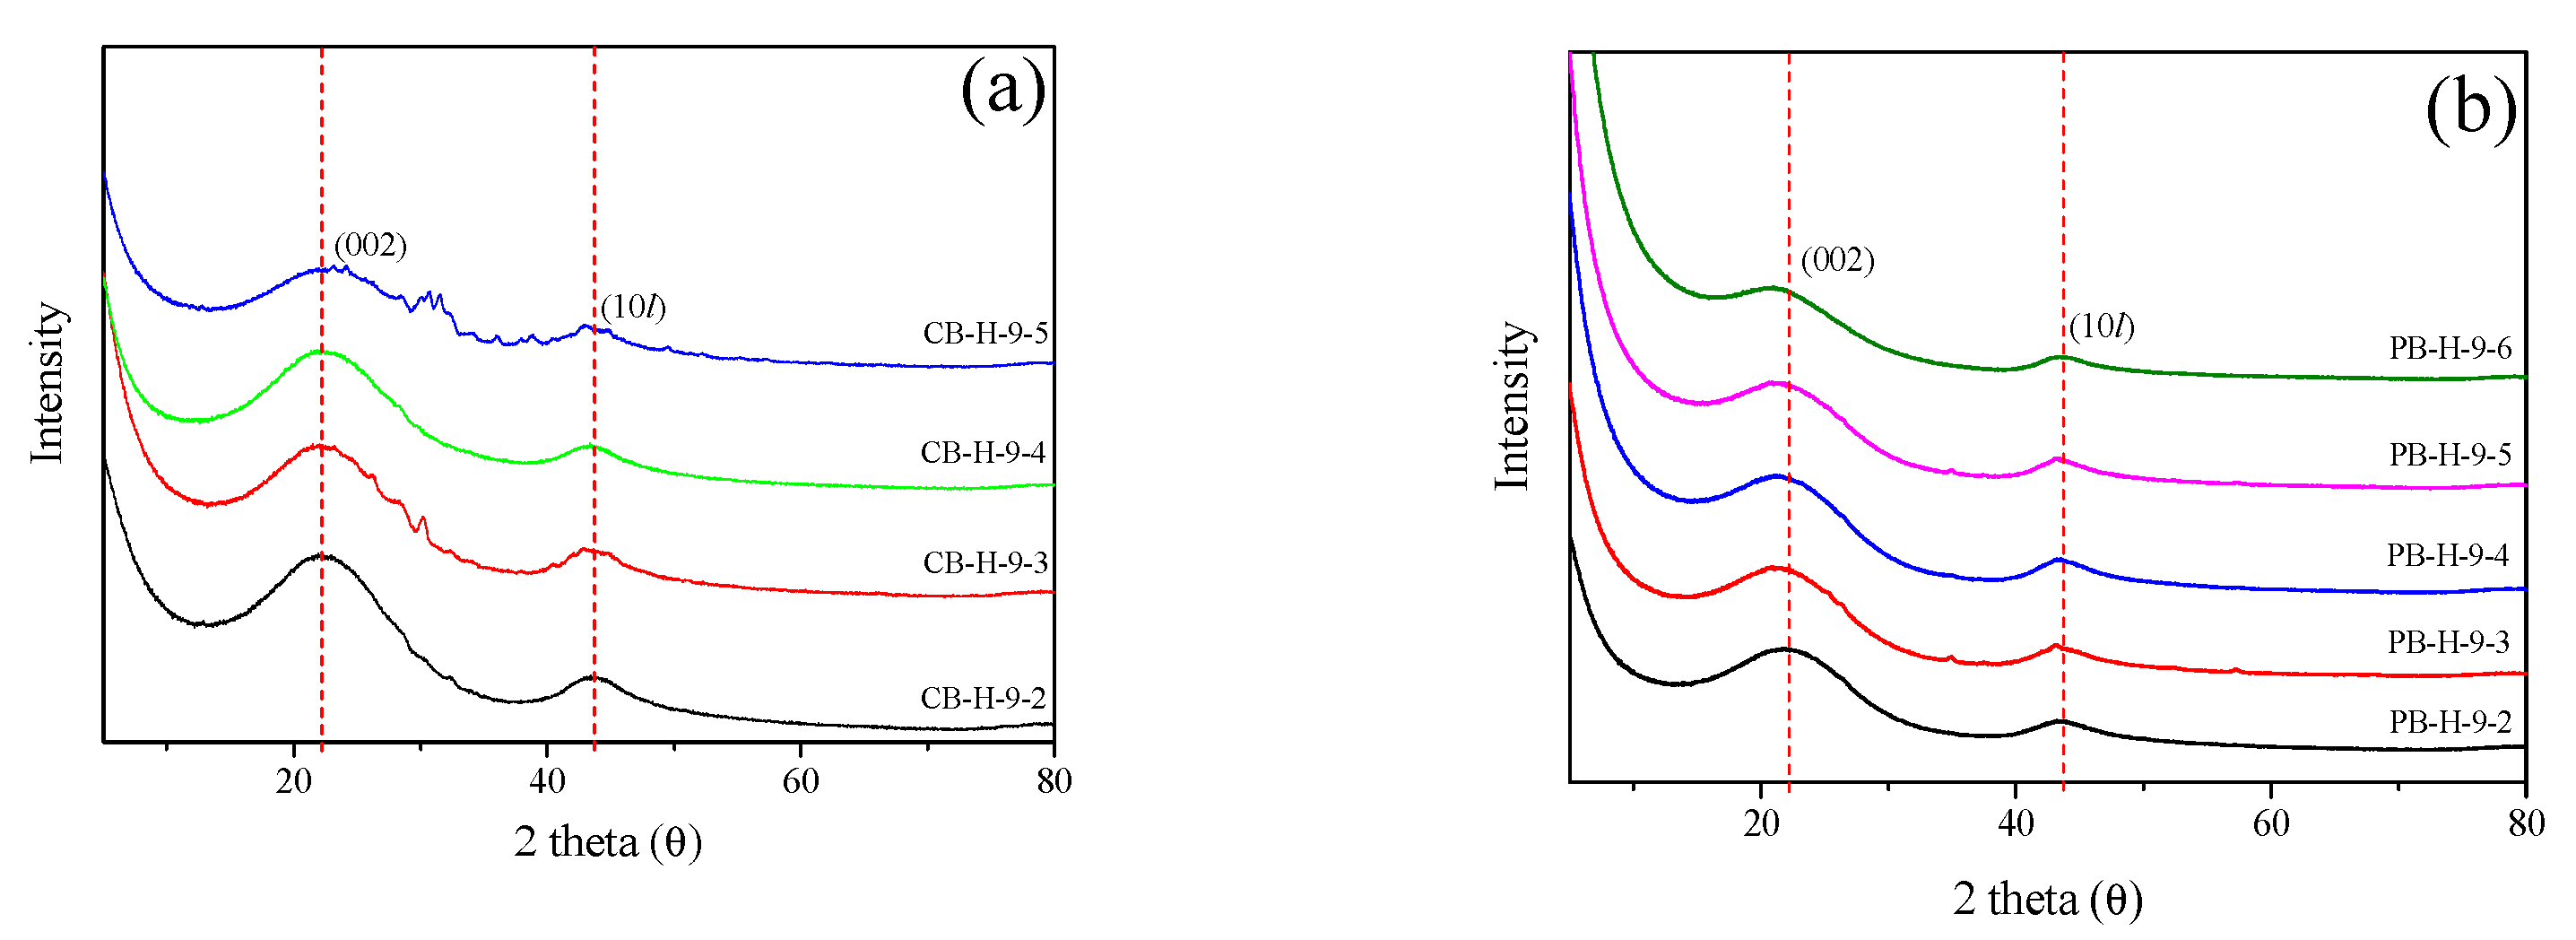
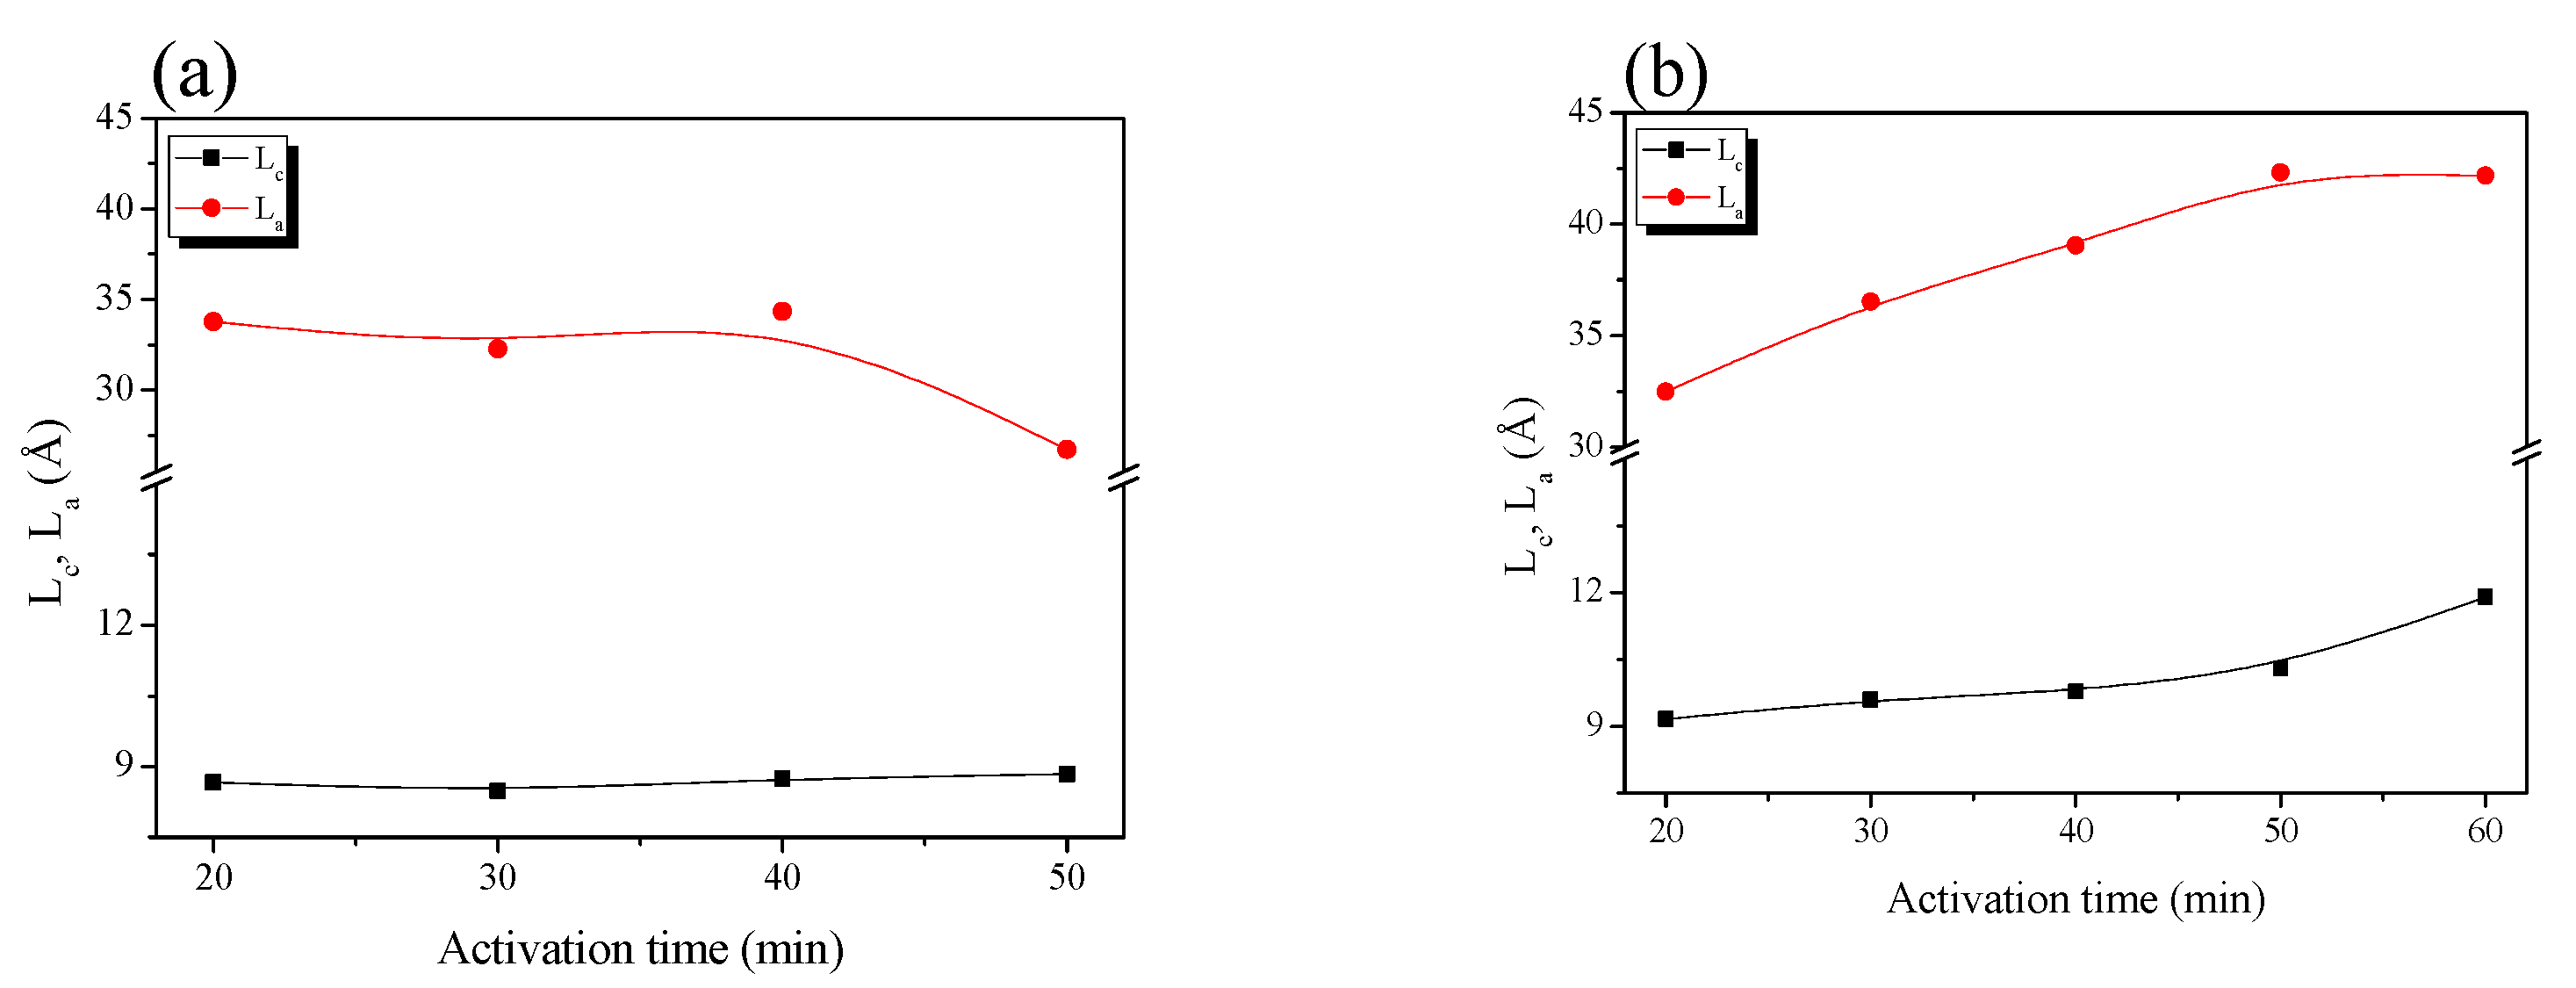
3.2. X-ray Diffraction Analysis
3.3. Electrochemical Properties
4. Conclusions
Author Contributions
Funding
Data Availability Statement
Conflicts of Interest
References
- Yu, M.; Patrick, H.; von Jouanne, A.; Yokochi, A. Current Li-Ion Battery Technologies in Electric Vehicles and Opportunities for Advancements. Energies 2019, 12, 1074. [Google Scholar] [CrossRef] [Green Version]
- Das, H.S.; Tan, C.W.; Yatim, A.H.M. Fuel cell hybrid electric vehicles: A review on power conditioning units and topologies. Renew. Sustain. Energy Rev. 2017, 76, 268–291. [Google Scholar] [CrossRef]
- Winter, M.; Brodd, R.J. What Are Batteries, Fuel Cells, and Supercapacitors? Chem. Rev. 2004, 104, 4245–4269. [Google Scholar] [CrossRef] [Green Version]
- Khaligh, A.; Li, Z. Battery, Ultracapacitor, Fuel Cell, and Hybrid Energy systems for Electric, Hybrid Electric, Fuel Cell, and Plug-In Hybrid Electric Vehicles: State of the Art. IEEE Trans. Veh. Technol. 2010, 59, 2806–2814. [Google Scholar] [CrossRef]
- Burke, A.F. Batteries and Ultracapacitors for Electric, Hybrid, and Fuel Cell Vehicles. Proc. IEEE 2007, 95, 806–820. [Google Scholar] [CrossRef]
- González, A.; Goikolea, E.; Barrena, J.A.; Mysyk, R. Review on supercapacitors: Technologies and materials. Renew. Sustain. Energy Rev. 2016, 58, 1189–1206. [Google Scholar] [CrossRef]
- Miñambres-Marcos, V.M.; Guerrero-Martínez, M.Á.; Barrero-González, F.; Milanés-Montero, M.I. A Grid Connected Photovoltaic Inverter with Battery-Supercapacitor Hybrid Energy Storage. Sensors 2017, 17, 1856. [Google Scholar] [CrossRef] [Green Version]
- Sikkabut, S.; Mungporn, P.; Ekaravarodome, C.; Bizon, N.; Tricoli, P.; Nahid-Movarakeh, B.; Pierfederici, S.; Davat, B.; Thounthong, P. Control of High-Energy High-Power Densities Storage Devices by Li-ion Battery and Supercapacitor for Fuel Cell/Photovoltaic Hybrid Power Plant for Autonomous System Applications. IEEE Trans. Ind. Appl. 2016, 52, 4395–4407. [Google Scholar] [CrossRef] [Green Version]
- Bang, J.H.; Lee, H.M.; An, K.H.; Kim, B.J. A study on optimal pore development of modified commercial activated carbons for electrode materials of supercapacitors. Appl. Surf. 2017, 415, 61–66. [Google Scholar] [CrossRef]
- Karthikeyan, K.; Amaresh, S.; Lee, S.N.; Sun, X.; Aravindan, V.; Lee, Y.G.; Lee, Y.S. Construction of High-Energy-Density Supercapacitors from Pine-Cone-Derived High-Surface-Area Carbons. ChemSusChem 2014, 7, 1435–1442. [Google Scholar] [CrossRef]
- Phiri, J.; Dou, J.; Vuorinen, T.; Gane, P.A.C.; Maloney, T.C. Highly Porous Willow Wood-Derived Activated Carbon for High-Performance Supercapacitor Electrodes. J. Am. Chem. Soc. 2019, 4, 18108–18117. [Google Scholar] [CrossRef] [PubMed] [Green Version]
- Tian, X.; Ma, H.; Li, Z.; Yan, S.; Ma, L.; Yu, F.; Wang, G.; Guo, X.; Ma, Y.; Wong, C. Flute type micropores activated carbon from cotton stalk for high performance supercapacitors. J. Power Sources 2017, 359, 88–96. [Google Scholar] [CrossRef]
- Lin, R.; Taberna, P.L.; Chmiola, J.; Guay, D.; Gogatsi, Y.; Simon, P. Microelectrode Study of Pore Size, Ion Size, and Solvent Effects on the Charge/Discharge Behavior of Microporous Carbons for Electrical Double-Layer Capacitors. J. Electrochem. Soc. 2009, 156, A7–A12. [Google Scholar] [CrossRef] [Green Version]
- Li, J.; Wang, N.; Tian, J.; Qian, W.; Chu, W. Cross-Coupled Macro-Mesoporous Carbon Network toward Record High Energy-Power Density Supercapacitor at 4 V. Adv. Funct. Mater. 2018, 28, 1806153. [Google Scholar] [CrossRef]
- Pham, D.T.; Lee, T.H.; Luong, D.H.; Yao, F.; Ghosh, A.; Le, V.T.; Kim, T.H.; Li, B.; Chang, J.; Lee, Y.H. Carbon Nanotube-Bridged Graphene 3D Building Blocks for Ultrafast Compact Supercapacitors. ACS Nano 2015, 9, 2018–2027. [Google Scholar] [CrossRef]
- Basnayaka, P.A.; Ram, M.K.; Stefanakos, L.; Kumar, A. Graphene/Polypyrrole Nanocomposite as Electrochemical Supercapacitor Electrode: Electrochemical Impedance Studies. Graphene 2013, 2, 30869. [Google Scholar] [CrossRef] [Green Version]
- Leng, C.; Zhao, Z.; Song, Y.; Sun, L.; Fan, Z.; Yang, Y.; Liu, X.; Wang, X.; Qiu, J. 3D Carbon Frameworks for Ultrafast Charge/Discharge Rate Supercapacitors with High Energy-Power Density. Nano-Micro Lett. 2020, 13, 8. [Google Scholar] [CrossRef]
- Yahya, M.A.; Qadah, Z.A.; Ngah, C.W.Z. Agricultural bio-waste materials as potential sustainable precursors used for activated carbon production: A review. Renew. Sustain. Energy Rev. 2015, 46, 218–235. [Google Scholar] [CrossRef]
- Mamaní, A.; Sardella, M.F.; Giménez, M.; Deiana, C. Highly microporous carbons from olive tree pruning: Optimization of chemical activation conditions. J. Environ. Chem. Eng. 2019, 7, 102830. [Google Scholar] [CrossRef]
- Nowicki, P.; Kazmierczak, J.; Pietrzak, R. Comparison of physicochemical and sorption properties of activated carbons prepared by physical and chemical activation of cherry stones. Powder Technol. 2015, 269, 312–319. [Google Scholar] [CrossRef]
- Fu, K.; Yue, Q.; Gao, B.; Sun, Y.; Zhu, L. Preparation, characterization and application of lignin-based activated carbon from black liquor lignin by steam activation. Chem. Eng. J. 2013, 228, 1074–1082. [Google Scholar] [CrossRef]
- Lee, H.M.; Heo, Y.J.; An, K.H.; Jung, S.C.; Chung, D.C.; Park, S.J.; Kim, B.J. A study on optimal pore range for high pressure hydrogen storage behaviors by porous hard carbon materials prepared from a polymeric precursor. Int. J. Hydrog. Energy 2018, 43, 5894–5902. [Google Scholar] [CrossRef]
- Lee, H.M.; Kwac, L.K.; An, K.H.; Park, S.J.; Kim, B.J. Electrochemical behavior of pitch-based activated carbon fibers for electrochemical capacitors. Energy Convers. Manag. 2016, 125, 347–352. [Google Scholar] [CrossRef]
- Baek, J.; Lee, H.M.; Roh, J.S.; Lee, H.S.; Kang, H.S.; Kim, B.J. Studies on preparation and applications of polymeric precursor-based activated hard carbons: I. Activation mechanism and microstructure analyses. Microporous Mesoporous Mater. 2016, 219, 258–264. [Google Scholar] [CrossRef]
- Li, W.; Yang, K.; Peng, J.; Zhang, L.; Guo, S.; Xia, H. Effects of carbonization temperatures on characteristics of porosity in coconut shell chars and activated carbons derived from carbonized coconut shell chars. Ind. Crops. Prod. 2008, 28. [Google Scholar] [CrossRef]
- Daud, W.M.A.W.; Ali, W.S.W. Comparison on pore development of activated carbon produced from palm shell and coconut shell. Bioresour. Technol. 2004, 93, 63–69. [Google Scholar] [CrossRef] [PubMed]
- Choy, K.K.H.; Barford, J.P.; McKay, G. Production of activated carbon from bamboo scaffolding waste—process design, evaluation and sensitivity analysis. Chem. Eng. J. 2005, 109, 147–165. [Google Scholar] [CrossRef]
- Sugesty, S.; Kardiansyah, T.; Hardiani, H. Bamboo as raw materials for dissolving pulp with environmental friendly technology for rayon fiber. Procedia Chem. 2014, 17, 194–199. [Google Scholar] [CrossRef] [Green Version]
- Jagtoyen, M.; Derbyshire, F. Activated carbons from yellow poplar and white oak by H3PO4 Activation. Carbon 1998, 36, 1085–1097. [Google Scholar] [CrossRef]
- Lee, B.H.; Lee, H.M.; Chung, D.C.; Kim, B.J. Effect of Mesopore Development on Butane Working Capacity of Biomass-Derived Activated Carbon for Automobile Canister. Nanomaterials 2021, 11, 673. [Google Scholar] [CrossRef]
- Brauneur, S.; Emmet, P.; Telle, E. Adsorption of Gases in Multimolecular Layer. J. Am. Chem. Soc. 1938, 60, 309–319. [Google Scholar] [CrossRef]
- Barrett, E.P.; Joyner, L.G.; Halenda, P.P. The Determination of Pore Volume and Area Distributions in Porous Substances. I. Computations from Nitrogen Isotherms. J. Am. Chem. Soc. 1951, 73, 373–380. [Google Scholar] [CrossRef]
- Kierlik, E.; Rosinberg, M.L. Free-energy density functional for the inhomogeneous hard-sphere fluid: Application to interfacial adsorption. Phys. Rev. A 1990, 42, 3382. [Google Scholar] [CrossRef] [PubMed]
- Biscoe, J.; Warren, B.E. An X-Ray Study of Carbon Black. Int. J. Appl. Phys. 1942, 13, 364. [Google Scholar] [CrossRef]
- Sing, K.S.W. Reporting Physisorption Data for Gas/Solid Systems with Special Reference to the Determination of Surface Area and Porosity. Pure Appl. Chem. 2009, 57, 603–619. [Google Scholar] [CrossRef]
- Wigmans, T. Industrial aspects of production and use of activated carbons. Carbon 1989, 27, 13–22. [Google Scholar] [CrossRef]
- Kim, D.W.; Kil, H.S.; Nakabayashi, K.; Yoon, S.H.; Miyawaki, J. Structural elucidation of physical and chemical activation mechanisms based on the microdomain structure model. Carbon 2017, 114, 98–105. [Google Scholar] [CrossRef]
- Basta, A.H.; Fierro, V.; Saied, H.; Celzard, A. Effect of deashing rice straws on their derived activated carbons produced by phosphoric acid activation. Biomass Bioenergy 2011, 35, 1954–1959. [Google Scholar] [CrossRef]
- Baek, J.; Shin, H.S.; Chung, D.C.; Kim, B.J. Studies on the correlation between nanostructure and pore development of polymeric precursor-based activated hard carbons: II. Transmission electron microscopy and Raman spectroscopy studies. J. Ind. Eng. Chem. 2017, 54, 324–331. [Google Scholar] [CrossRef]
- Mei, B.A.; Munteshari, O.; Lau, J.; Dunn, B.; Pilon, L. Physical Interpretations of Nyquist Plots for EDLC Electrodes and Devices. J. Phys. Chem. C 2018, 122, 194–206. [Google Scholar] [CrossRef]
- Choi, W.; Shin, H.C.; Kim, J.M.; Choi, J.Y.; Yoon, W.S. Modeling and Applications of Electrochemical Impedance Spectroscopy (EIS) for Lithium-ion Batteries. J. Electrochem. Sci. Technol. 2020, 11, 1–13. [Google Scholar] [CrossRef] [Green Version]
- Oda, H.; Yamashita, A.; Minoura, S.; Okamoto, M.; Morimoto, T. Modification of the oxygen-containing functional group on activated carbon fiber in electrodes of an electric double-layer capacitor. J. Power Sources 2006, 158, 1510–1516. [Google Scholar] [CrossRef]
- Liu, X.; Juan, L.; Zhan, L.; Tang, L.; Wang, Y.; Qiao, W.; Liang, X.; Ling, L. Effect of conductive filler on the impedance behaviors of activated carbon based electric double layer capacitors. J. Electroanal. Chem. 2010, 642, 75–81. [Google Scholar] [CrossRef]
- Sudhan, N.; Subramani, K.; Karnan, M.; IIayaraja, N.; Sathish, M. Biomass-Derived Activated Porous Carbon from Rice Straw for a High Energy Symmetric Supercapacitor in Aqueous and Non-Aqueous Electrolytes. Energy Fuels 2017, 31, 977–985. [Google Scholar] [CrossRef]
- Rani, M.U.; Nanaji, K.; Rao, T.N.; Deshpande, A.S. Corn husk derived activated carbon with enhanced electrochemical performance for high-voltage supercapacitors. J. Power Sources 2020, 471, 228387. [Google Scholar] [CrossRef]
- Gong, C.; Wang, X.; Ma, D.; Chen, H.; Zhang, S.; Liao, Z. Microporous carbon from a biological waste-stiff silkworm for capacitive energy storage. Electrochim. Acta 2016, 220, 331–339. [Google Scholar] [CrossRef]
- Zhang, G.; Chen, Y.; Chen, Y.; Guo, H. Activated biomass carbon made from bamboo as electrode material for supercapacitors. Mater. Res. Bull. 2018, 102, 391–398. [Google Scholar] [CrossRef]


| Sample | SBETa (m2/g) | VTotal b (cm3/g) | VMicroc (cm3/g) | VMesod (cm3/g) | Mesopore Ratio e (%) | Yield f (%) |
|---|---|---|---|---|---|---|
| CB-H-9-2 | 770 | 0.32 | 0.29 | 0.03 | 9.4 | 19.6 |
| CB-H-9-3 | 1100 | 0.47 | 0.42 | 0.05 | 10.6 | 13.9 |
| CB-H-9-4 | 1030 | 0.44 | 0.39 | 0.05 | 11.4 | 8.5 |
| CB-H-9-5 | 1120 | 0.50 | 0.43 | 0.07 | 14.0 | 5.8 |
| CB-H-9-6 | - | - | - | - | - | 0 |
| PB-H-9-2 | 960 | 0.41 | 0.36 | 0.03 | 7.7 | 22.9 |
| PB-H-9-3 | 1350 | 0.56 | 0.51 | 0.05 | 8.9 | 19.4 |
| PB-H-9-4 | 1630 | 0.68 | 0.61 | 0.07 | 10.3 | 16.7 |
| PB-H-9-5 | 1890 | 0.86 | 0.69 | 0.17 | 19.8 | 12.6 |
| PB-H-9-6 | 2700 | 1.46 | 0.81 | 0.65 | 44.5 | 4.6 |
| YP-50F | 1780 | 0.83 | 0.70 | 0.13 | 15.7 | - |
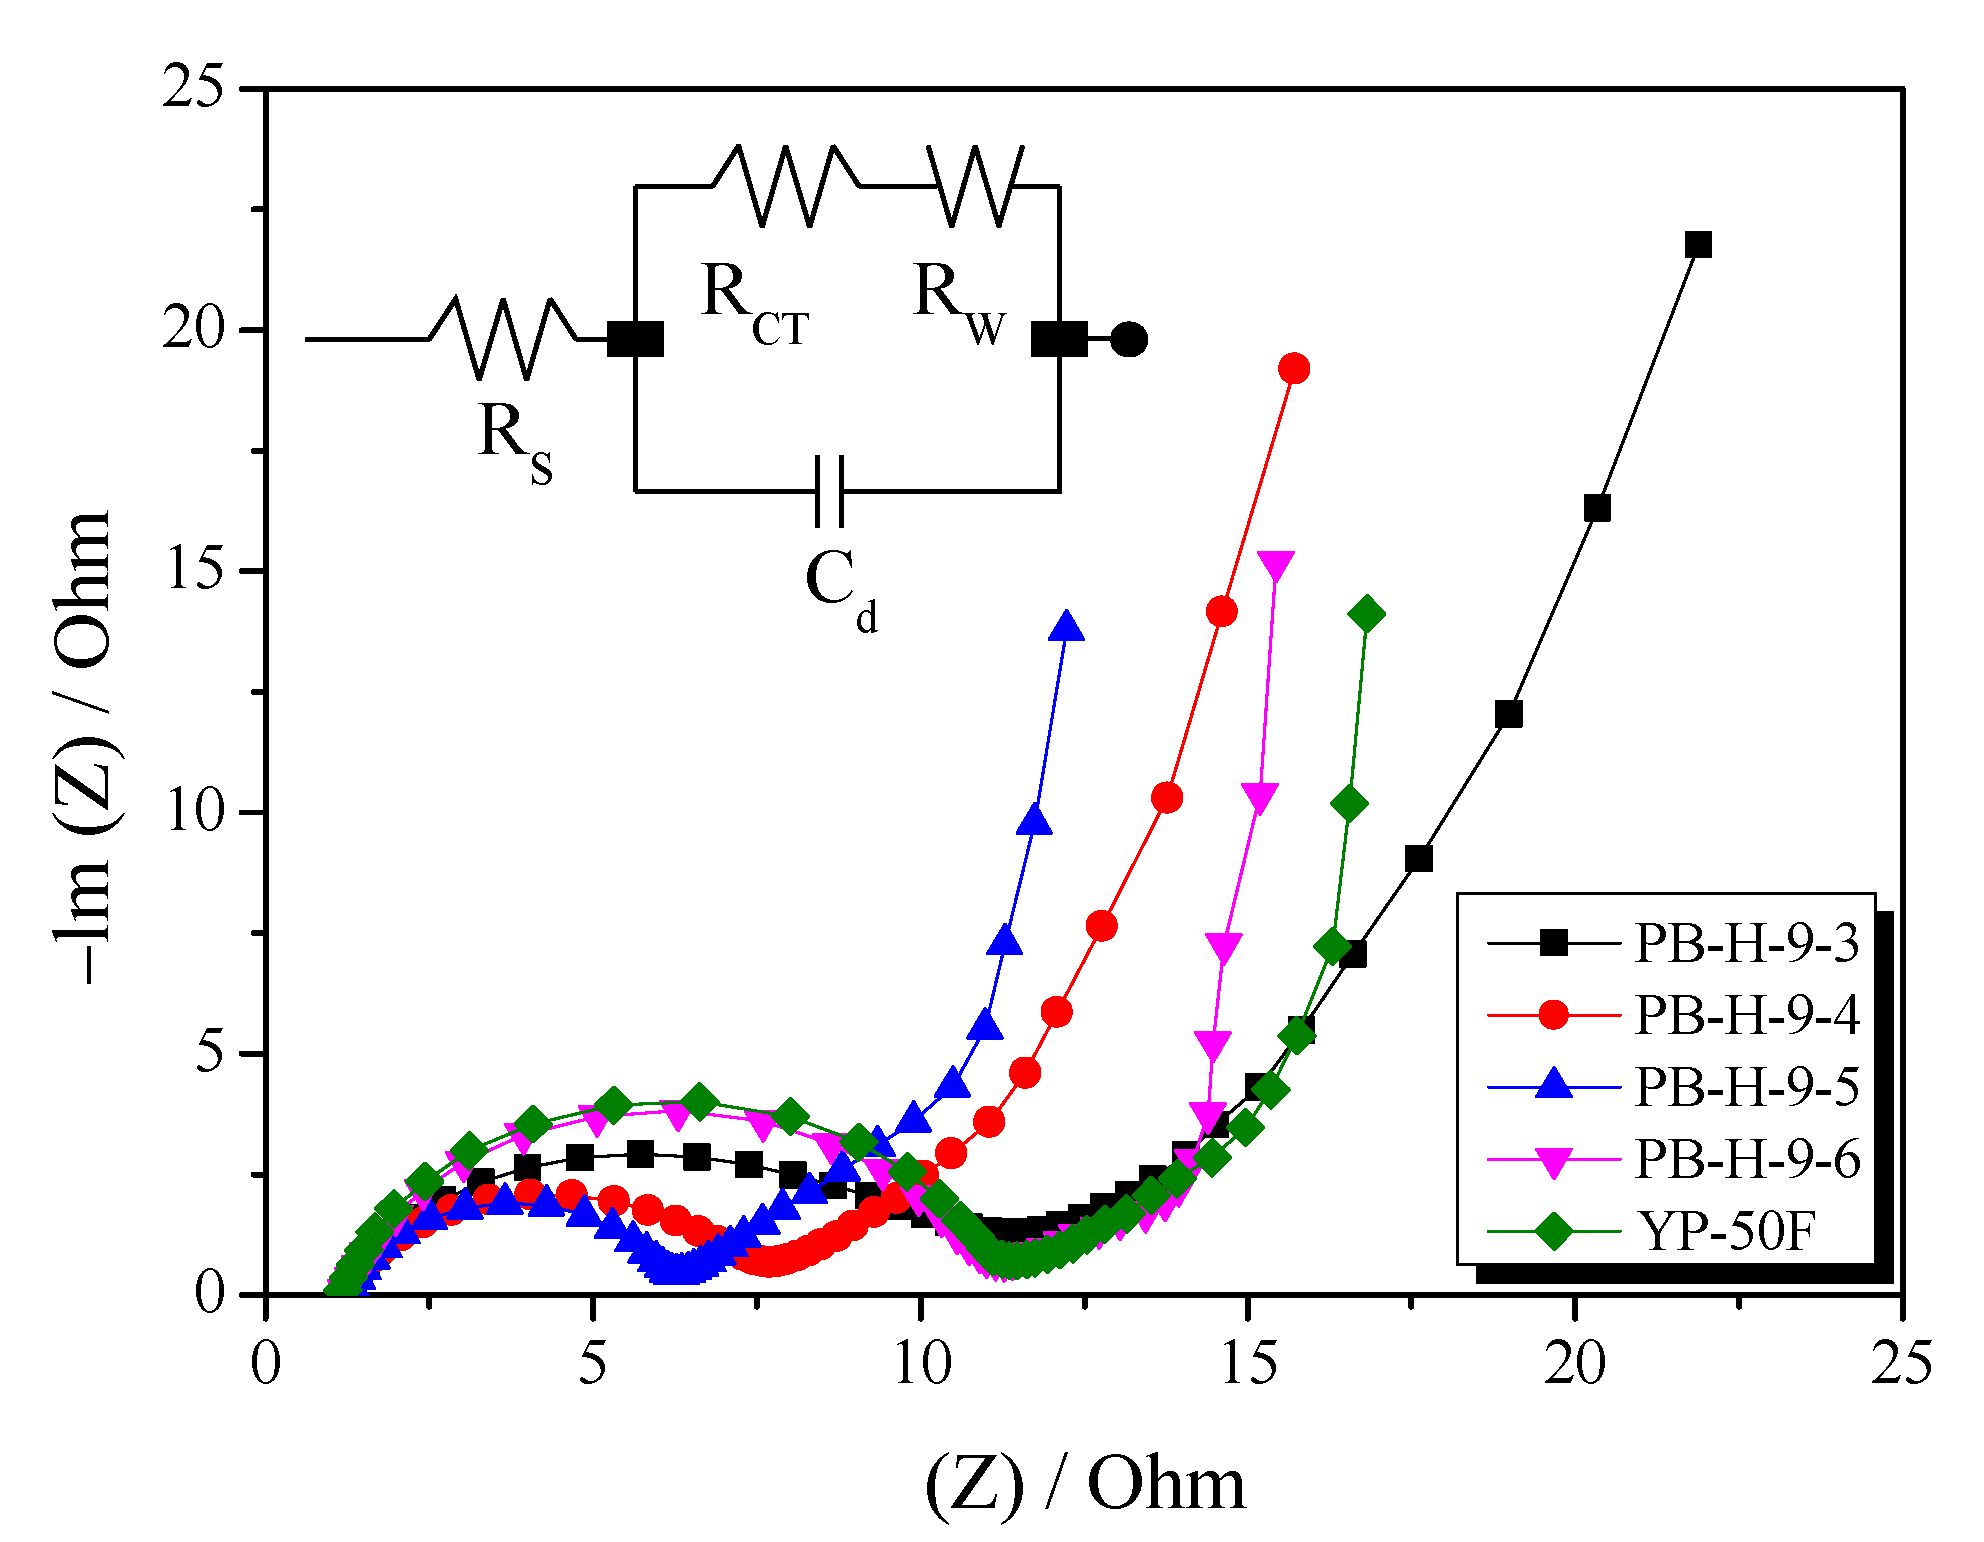
| Sample | RSa (Ω) | RCTb (Ω) | RWc (Ω) |
|---|---|---|---|
| PB-H-9-3 | 1.26 | 10.32 | 4.24 |
| PB-H-9-4 | 1.24 | 6.46 | 3.91 |
| PB-H-9-5 | 1.25 | 5.03 | 3.61 |
| PB-H-9-6 | 1.22 | 10.01 | 2.89 |
| YP-50F | 1.18 | 10.2 | 4.39 |
| Precursor | Activation Method | SBET (m2/g) | Electrolyte | Specific Capacitance (F/g) | Energy Density (Wh/kg) | Ref |
|---|---|---|---|---|---|---|
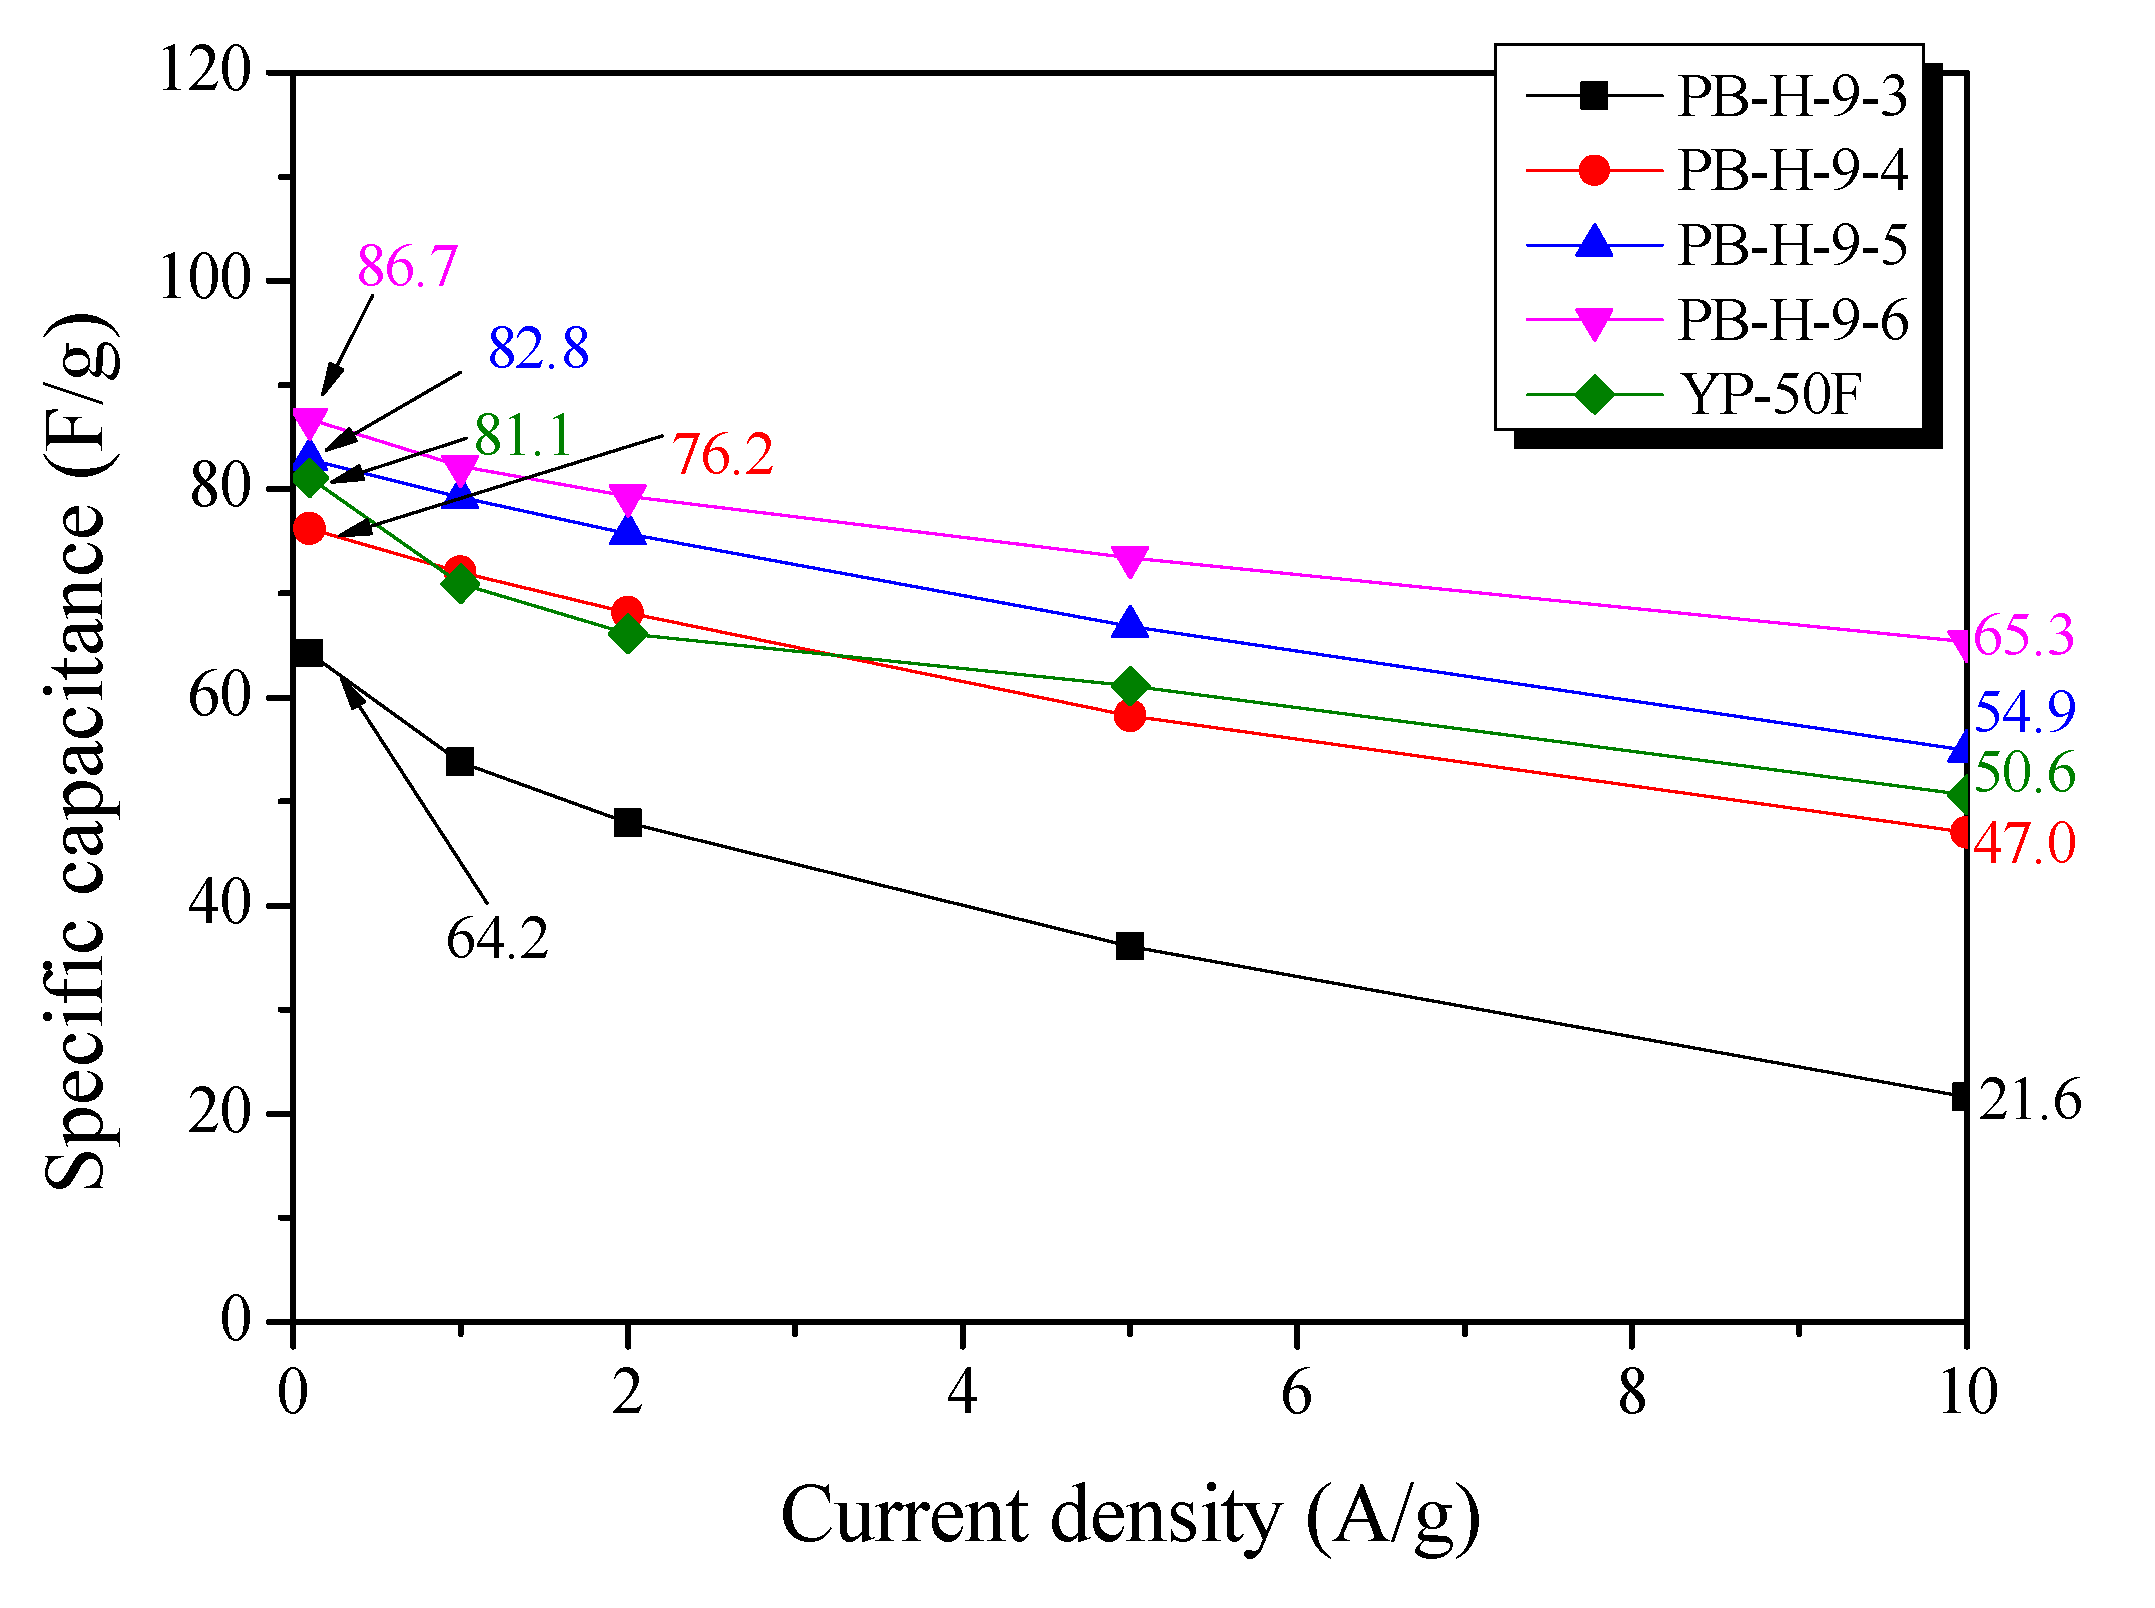
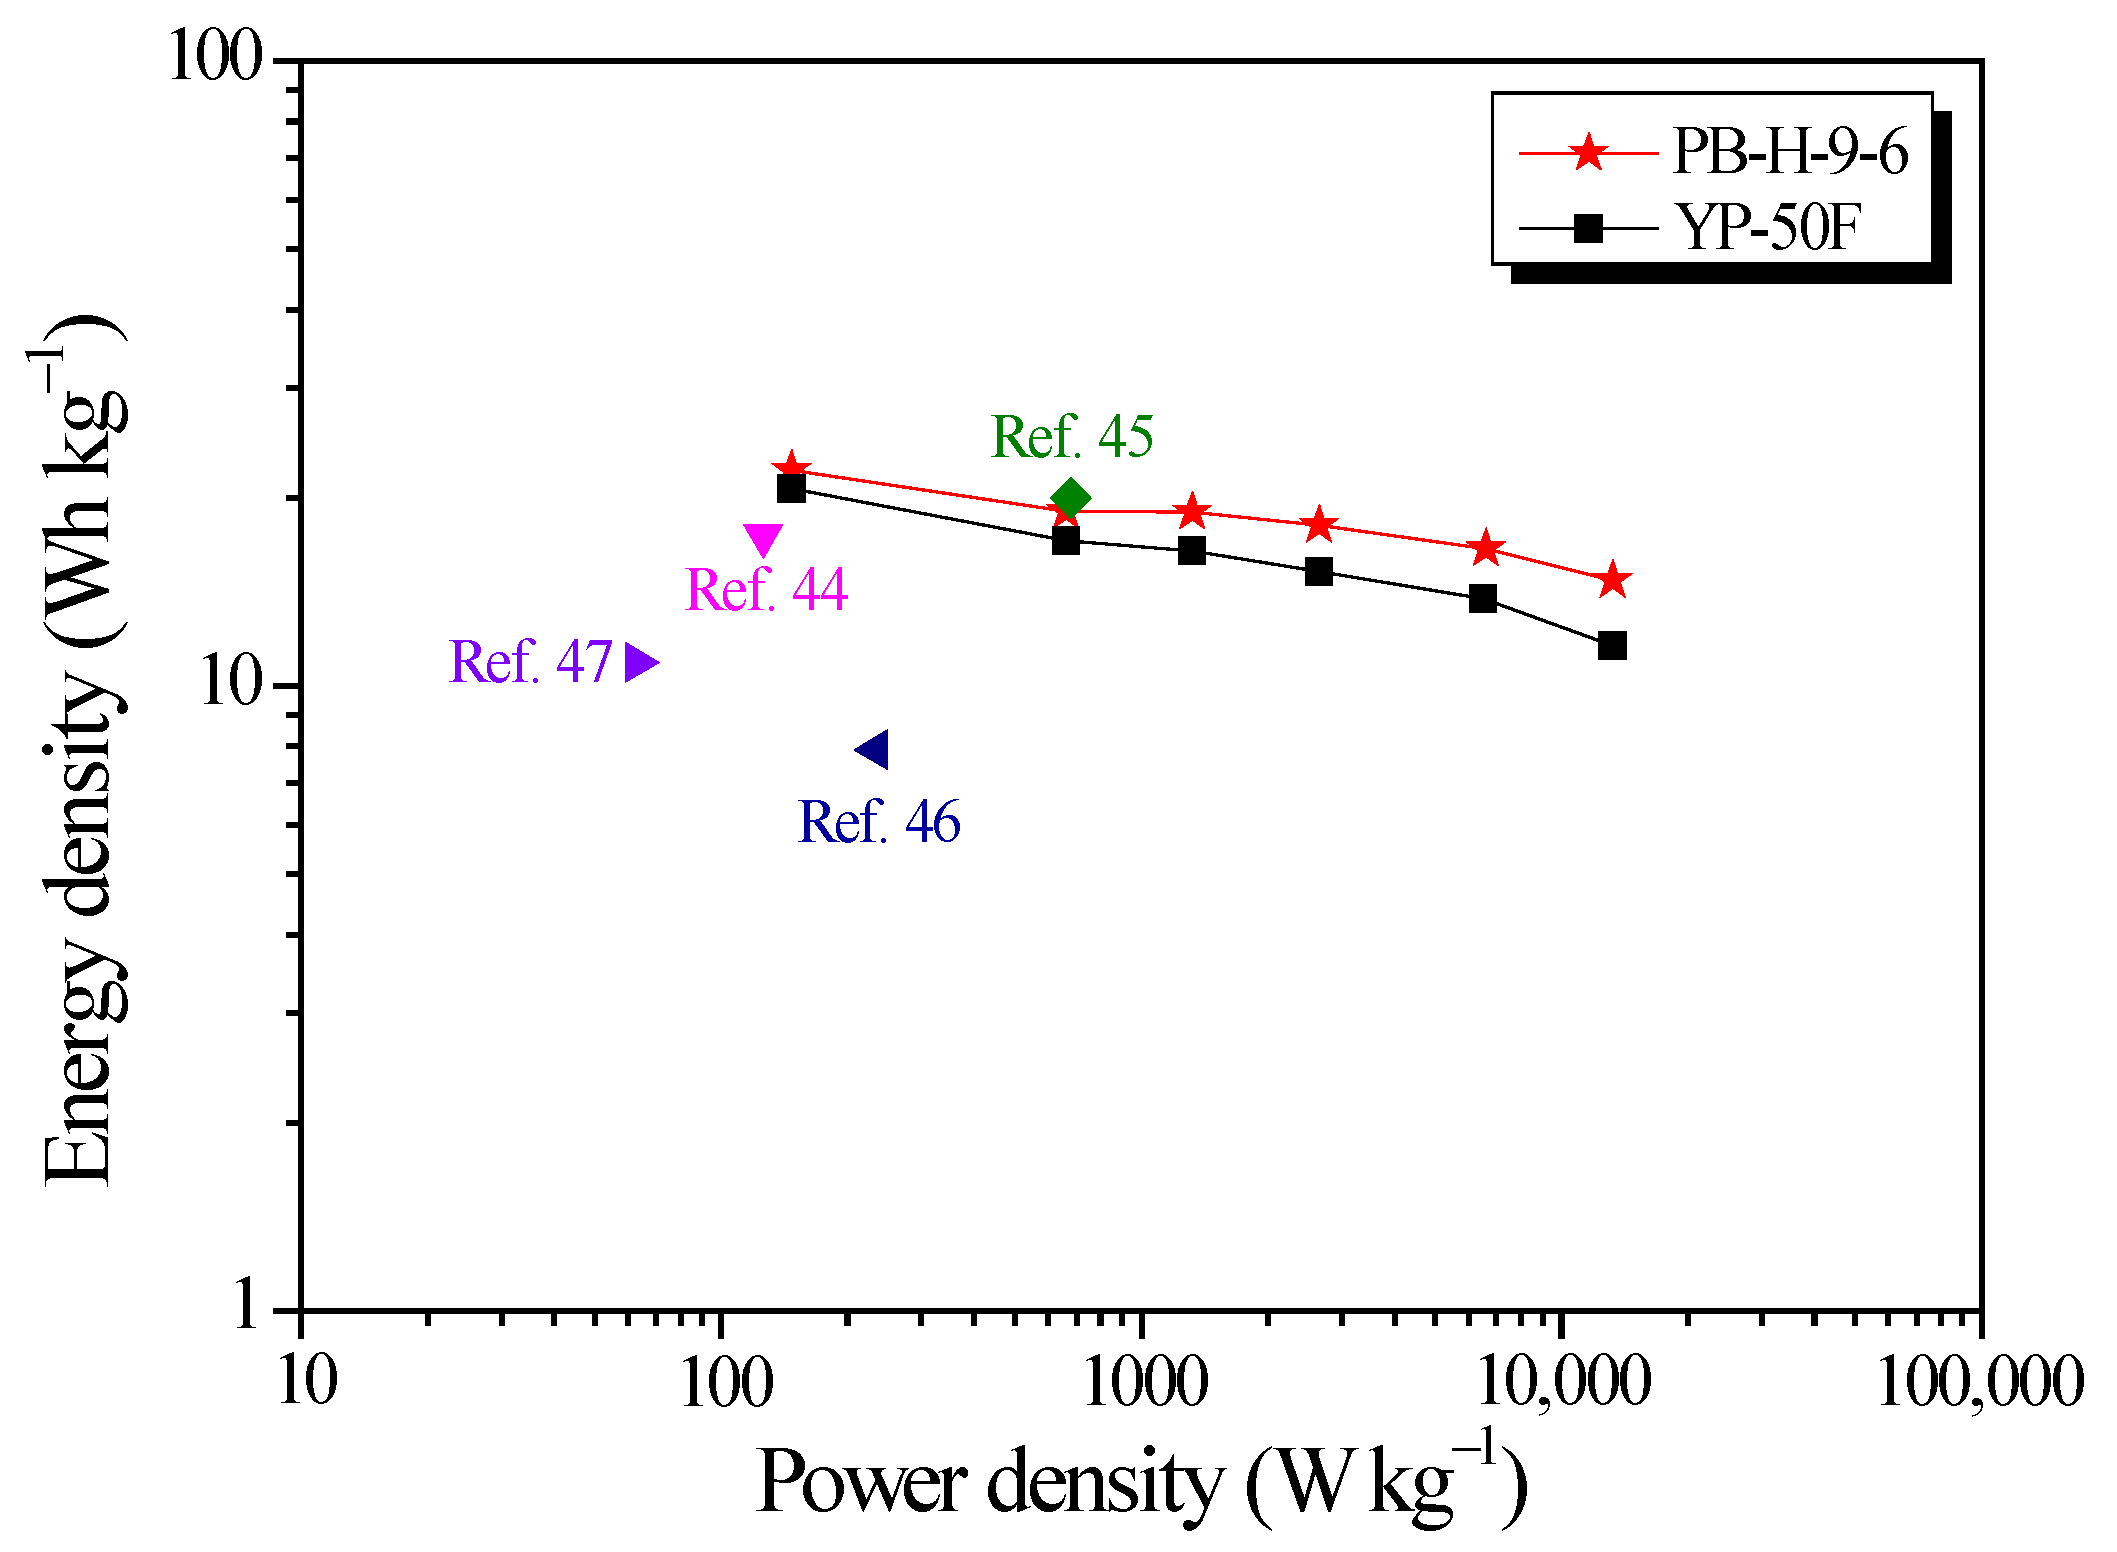
| Baboo | Steam | 2700 | 1 M TEABF4/PC | 86.7 @ 0.1 A/g | 22.1 | This work |
| Rice straw | KOH | 1007 | EMIMBF4 | 64.0 @ 0.1 A/g | 17.4 | [44] |
| Corn husk | KOH | 1378 | 1 M TEABF4/AN | 64.0 @ 1.0 A/g | 20.0 | [45] |
| Stiff silkworm | KOH | 2523 | 6 M KOH | 199.8 @ 1.0 A/g | 7.9 | [46] |
| Bamboo | KOH | 2221 | 3 M KOH | 234.4 @ 0.5 A/g | 10.9 | [47] |
Publisher’s Note: MDPI stays neutral with regard to jurisdictional claims in published maps and institutional affiliations. |
© 2021 by the authors. Licensee MDPI, Basel, Switzerland. This article is an open access article distributed under the terms and conditions of the Creative Commons Attribution (CC BY) license (https://creativecommons.org/licenses/by/4.0/).
Share and Cite
Kim, J.-H.; Lee, H.-M.; Jung, S.-C.; Chung, D.-C.; Kim, B.-J. Bamboo-Based Mesoporous Activated Carbon for High-Power-Density Electric Double-Layer Capacitors. Nanomaterials 2021, 11, 2750. https://doi.org/10.3390/nano11102750
Kim J-H, Lee H-M, Jung S-C, Chung D-C, Kim B-J. Bamboo-Based Mesoporous Activated Carbon for High-Power-Density Electric Double-Layer Capacitors. Nanomaterials. 2021; 11(10):2750. https://doi.org/10.3390/nano11102750
Chicago/Turabian StyleKim, Ju-Hwan, Hye-Min Lee, Sang-Chul Jung, Dong-Chul Chung, and Byung-Joo Kim. 2021. "Bamboo-Based Mesoporous Activated Carbon for High-Power-Density Electric Double-Layer Capacitors" Nanomaterials 11, no. 10: 2750. https://doi.org/10.3390/nano11102750