Article

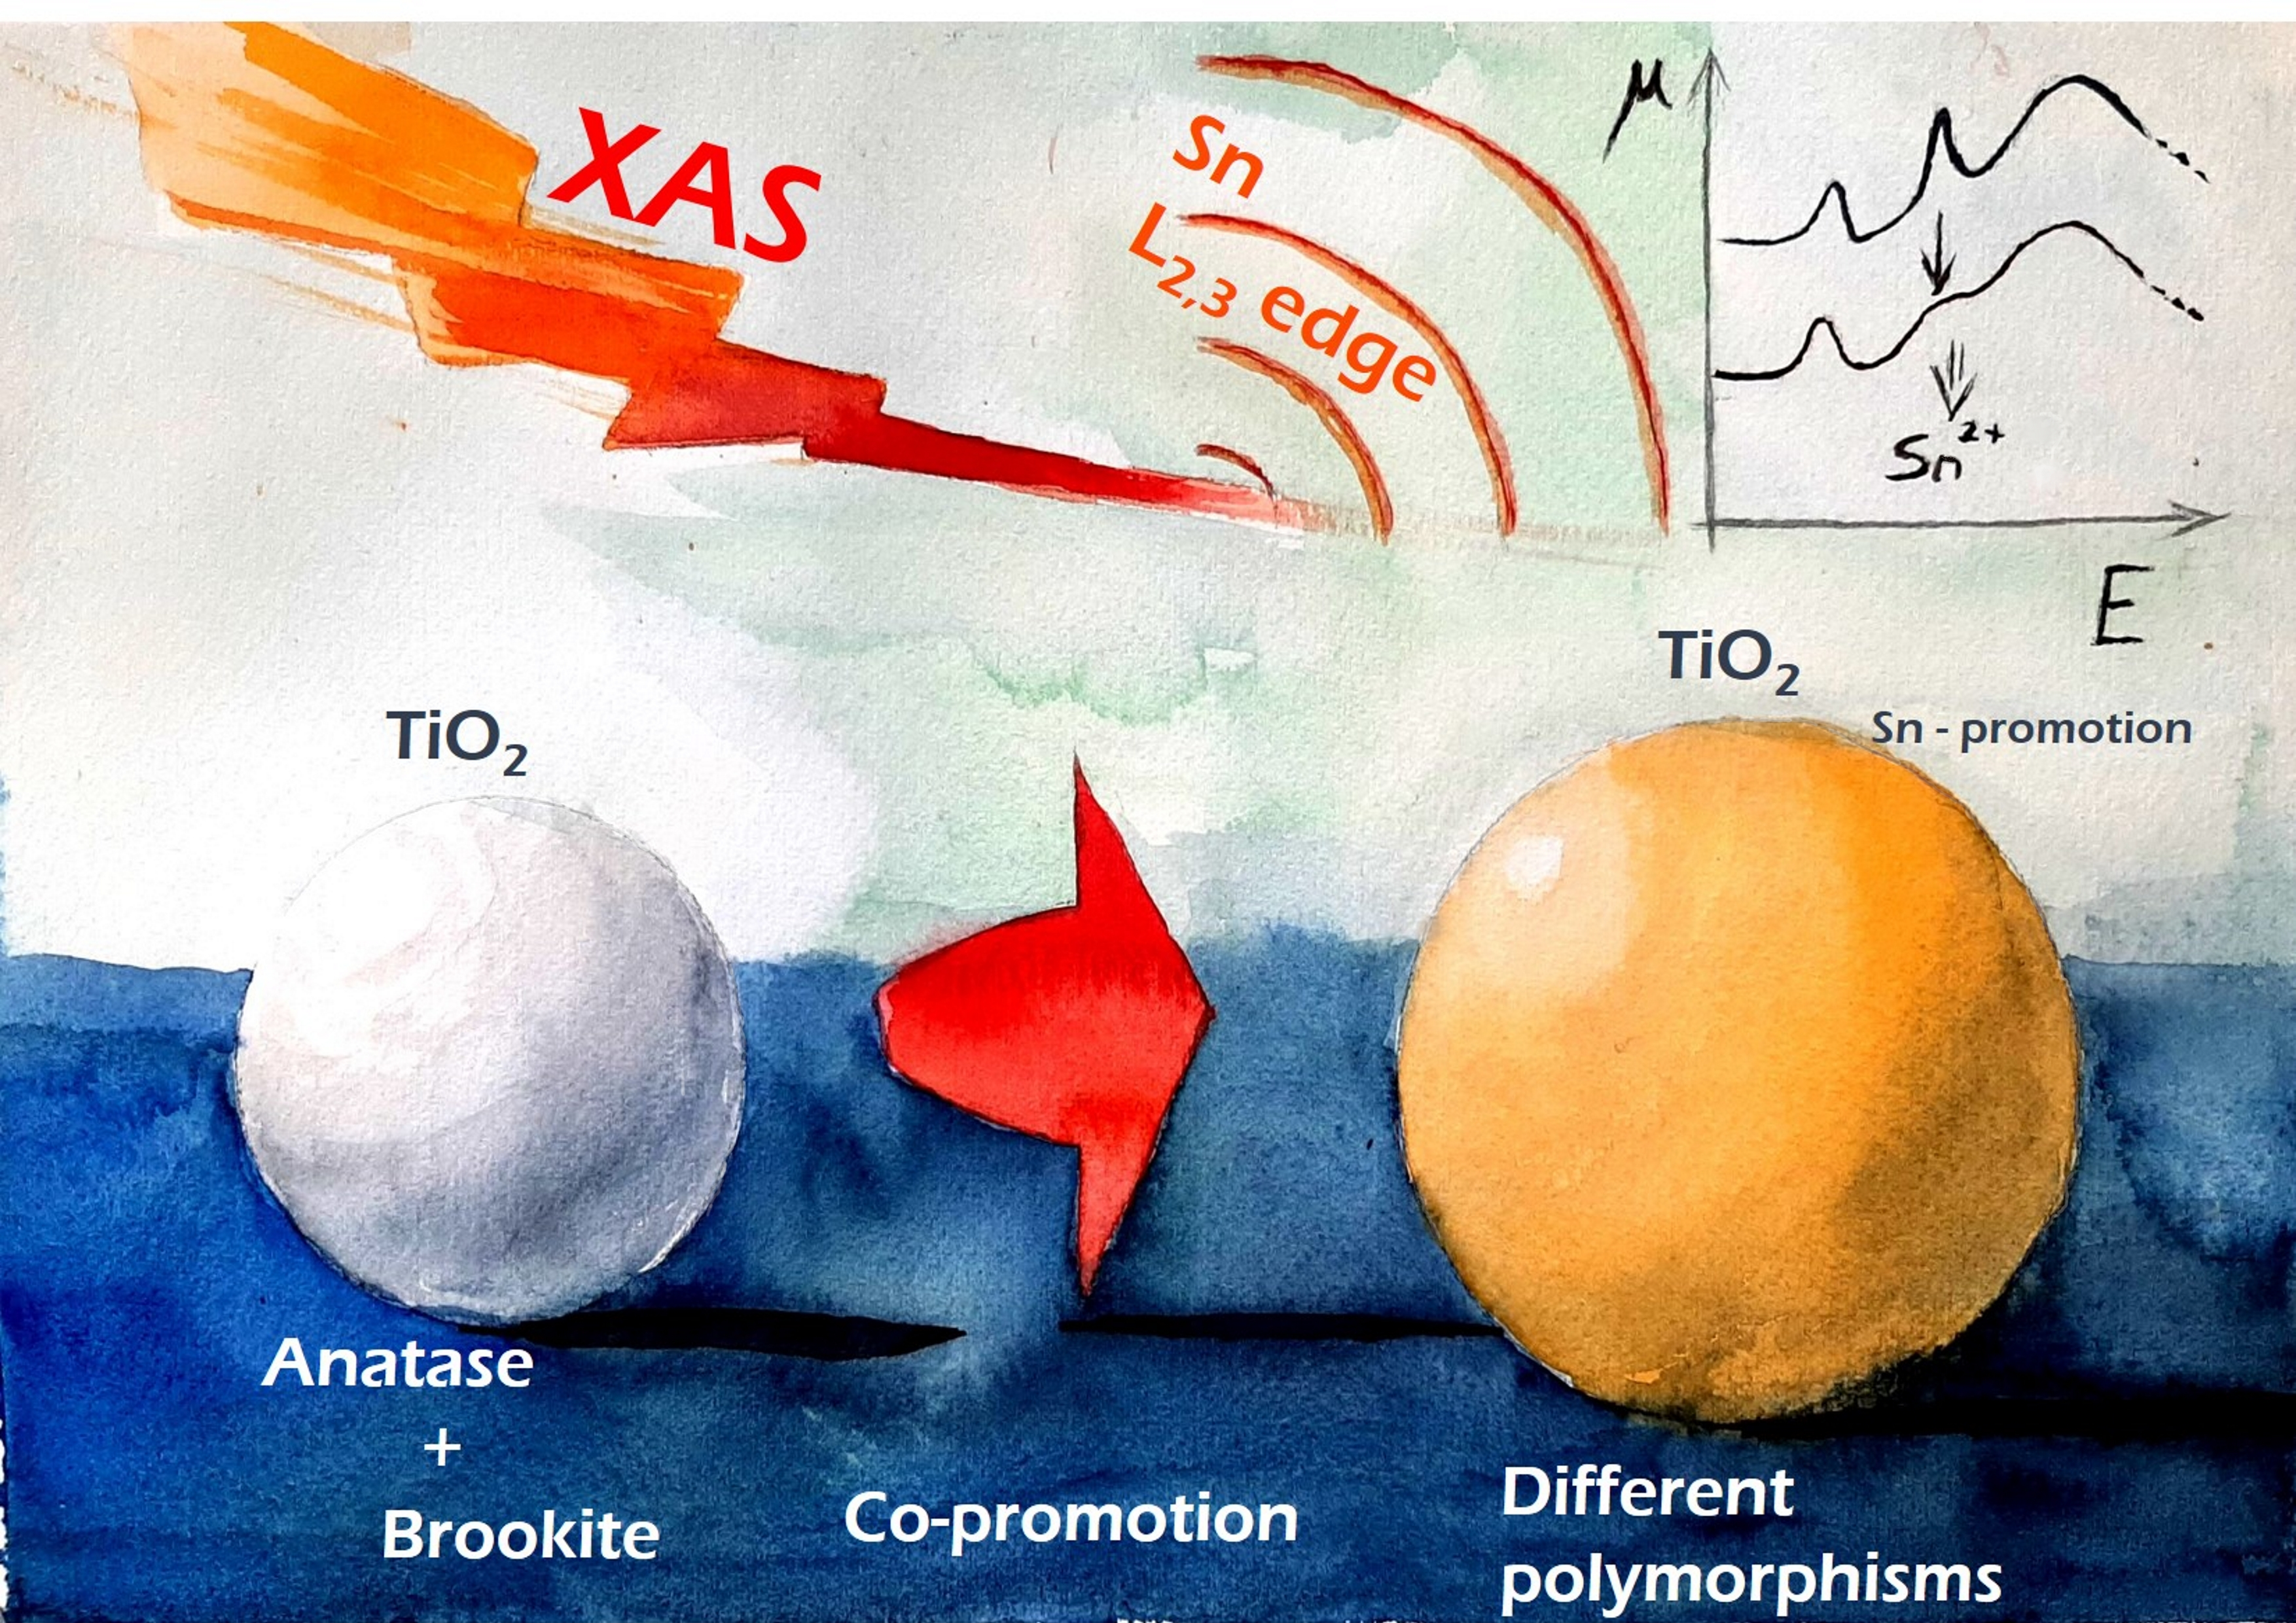
Role of Synthetic Parameters on the Structural and Optical Properties of N,Sn-Copromoted Nanostructured TiO2: A Combined Ti K-Edge and Sn L2,3-Edges X-ray Absorption Investigation

1
Department of Chemistry, Università degli Studi di Pavia, via Taramelli 12, 27100 Pavia, Italy
2
Consorzio Interuniversitario per la Scienza e Tecnologia dei Materiali (INSTM), via Giusti 9, 50121 Florence, Italy
3
Department of Chemistry, Università degli Studi di Milano, via Golgi 19, 20133 Milan, Italy
4
Department of Chemistry and NIS, Inter-Departmental Center, Università degli Studi di Torino, Via P. Giuria 7, 10125 Torino, Italy
*
Authors to whom correspondence should be addressed.
Nanomaterials 2020, 10(6), 1224; https://doi.org/10.3390/nano10061224
Submission received: 5 May 2020 / Revised: 18 June 2020 / Accepted: 19 June 2020 / Published: 23 June 2020

Abstract

:
Sn-modification of TiO2 photocatalysts has been recently proposed as a suitable strategy to improve pollutant degradation as well as hydrogen production. In particular, visible light activity could be promoted by doping with Sn2+ species, which are, however, thermally unstable. Co-promotion with N and Sn has been shown to lead to synergistic effects in terms of visible light activity, but the underlying mechanism has, so far, been poorly understood due to the system complexity. Here, the structural, optical, and electronic properties of N,Sn-copromoted, nanostructured TiO2 from sol-gel synthesis were investigated: the Sn/Ti molar content was varied in the 0–20% range and different post-treatments (calcination and low temperature hydrothermal treatment) were adopted in order to promote the sample crystallinity. Depending on the adopted post-treatment, the optical properties present notable differences, which supports a combined role of Sn dopants and N-induced defects in visible light absorption. X-ray absorption spectroscopy at the Ti K-edge and Sn L2,3-edges shed light onto the electronic properties and structure of both Ti and Sn species, evidencing a marked difference at the Sn L2,3-edges between the samples with 20% and 5% Sn/Ti ratio, showing, in the latter case, the presence of tin in a partially reduced state.

Graphical Abstract

1. Introduction

The promotion of TiO2 photocatalysts with Sn species, either by doping with Sn ions or by composite formation with SnOx, has been successfully applied to numerous fields, such as the photocatalytic degradation of water [1,2] and air pollutants [3,4,5], photovoltaics [6], and hydrogen production [7,8]. Because one of the main disadvantages of TiO2 photocatalysts is their limited activity in the visible region, due to the large band gap (≥3.0 eV) [9], doping with Sn2+ species has raised interest as a strategy for promoting TiO2 visible light activity [1,2,3,5,8]. Visible light absorption of TiO2 doped with Sn2+ has been related to a band gap narrowing caused by a shift in the position of the valence band, consisting of Sn 5s and O 2p orbitals [3]. Martinez-Oviedo et al., on the contrary, reported an extensive formation of Ti3+ species in Sn2+-doped TiO2, leading to a marked blue color [5].
The reported syntheses of Sn2+-doped TiO2 use SnCl2 as a starting material and require reducing conditions [5,8], leading to materials with limited thermal stability [1,10,11]. As a matter of fact, thermal treatments in non-reducing atmosphere result in the conversion of Sn2+ in Sn4+, leading to the loss of visible-light absorption.
Doping with Sn4+ has been reported to be beneficial to TiO2 activity, but only under UV irradiation [4]. Indeed, DFT calculations [11,12] have shown no effect or a blue shift in the absorption edge of anatase and rutile TiO2 when Sn4+ substitutional doping occurs; the latter has been reported to be the most energetically favored situation at low dopant content [11,12,13]. Conversely, the surface segregation of SnOx clusters has been often observed at higher Sn content [4,13,14]. The formation of heterojunctions with SnO2, while beneficial for the charge separation of photogenerated carriers [15,16], does not promote visible light activity of the resulting composite due to the large band gap of SnO2 [17]. However, the doping of SnO2 by Sn2+ has been recently reported to induce visible light activity in the semiconductor. Additionally, in this case, reducing conditions are required during the synthesis, leading to yellowish powders [18,19].
As an alternative strategy to induce visible light activity in TiO2 materials, copromotion with N and Sn4+ has been recently proposed: this approach leads to synergistic effects between the two dopants in terms of visible light absorption [6,20], but the underlying mechanism has, so far, been poorly understood.
Most of the reports on Sn-doped TiO2 investigate the oxide structural features and the dopant oxidation state by X-ray diffraction (XRD) and X-ray photoelectron spectroscopy (XPS), respectively, with only few reports using other techniques, such as Mössbauer spectroscopy [6,10,11] and X-ray absorption (XAS) techniques, like extended X-ray absorption fine structure (EXAFS) [11,21] and X-ray absorption near edge structure (XANES) [3,21,22]. To the authors’ best knowledge, the latter are exclusively limited to K-edge spectra of Sn. X-ray absorption spectroscopy is expected to give additional and complementary information with respect to that achievable by XRD or XPS. XPS is, in fact, a surface technique, providing more information regarding the Sn species segregated at the particle surface. It is mandatory to probe the oxidation state and chemical surrounding of tin in the bulk in order to find correlations between the electronic structure and bulk physical properties, such as light absorption. Moreover, a precise identification of phases (regarding both Ti and Sn) is difficult in the case of XPS analysis, where peak interpretation is often misleading, as well as of XRD measurements, due to the reflections broadening caused by the sample nanocrystalline nature. On the contrary, X-ray absorption spectroscopy is a bulk technique and it is element selective, hence enabling us to gather electronic and structural information selectively on both tin and titanium. In this respect, it should be noted that the diverse TiO2 polymorphs yield different and easily distinguishable XANES spectra at the Ti K-edge [23,24], while SnO2 and SnO show different response at the Sn L2,3-edges, thus allowing us to detect modifications in the tin valence state [25,26,27]; in fact, 5s states can be directly probed at the Sn L2,3-edges.
Some of us have recently reported about N,Sn-copromoted, nanostructured TiO2 from sol-gel synthesis with enhanced photocatalytic properties towards the degradation of tetracycline, an emerging water pollutant [20,28]. Interestingly, different light absorption could be attained, depending on the type of applied thermal post-treatment (calcination or low temperature hydrothermal treatment), with ensuing different photocatalytic activity of the materials in the UV-vis region. Here, we report a combination of X-ray absorption and UV-visible light absorption experiments, which aimed to shed light on the structural, optical, and electronic properties of these materials and on the structure-property relationships. The samples were prepared using SnCl4 as tin source and ammonia as precipitating agent and N source. The Sn/Ti molar content was varied in the 0–20% range and different post-treatments were used to promote sample crystallinity: either a calcination in oxidizing environment or a prolonged, low temperature hydrothermal treatment. In this respect, literature studies report shorter hydro/solvothermal treatments (24–72 h) for TiO2 growth, but, in much harsher conditions [29,30,31,32], while flash treatments (few hours) are only reported for the preparation of TiO2 crystal seeds [33,34]. In the present case, a prolonged hydrothermal treatment was adopted for promoting crystal growth in less demanding conditions, with notable advantages in terms of safety concerns and required instrumentation. It was observed that very different structural and optical properties can be obtained, depending on the post-treatment and on the quantity of Sn.

2. Materials and Methods

During syntheses, doubly-distilled water passed through a Milli-Q apparatus and analytical grade reagents and solvents (Sigma–Aldrich, Milan, Italy) were used. Sn-promoted TiO2 samples were prepared according to a previously reported sol-gel procedure [20,28]. Titanium(IV) isopropoxide (TTIP, 37.6 mmol), along with an appropriate amount of SnCl4∙5H2O, was mixed with 2-propanol. Subsequently, a NH4OH aqueous solution was slowly dripped into the reaction flask while stirring at 300 rpm. The adopted molar ratios were 1:20:0.5:100 for TTIP:2-propanol:NH4OH:H2O, and the Ti:Sn molar ratio was varied in the 0–20% range. The reaction mixture was then stirred at 60 °C for 90 min., and then dried overnight at 80 °C and ambient pressure. The resulting powder was washed several times by centrifugation-resuspension cycles and then dried in oven. For the sake of comparison, the TiO2 reference samples were also prepared with the same method without the addition of Sn species.
Two different post-synthetic treatments were compared in order to promote the sample crystallinity: a hydrothermal treatment in mild conditions and a conventional calcination procedure. For the hydrothermal treatment, 1.5 g of xerogel was suspended in water (50 mL) and then transferred into a 100 mL Teflon-lined stainless-steel autoclave. The reaction mixture was heated at 100 °C for 170 h. The calcined samples were instead treated at 400 °C under O2 flux (9 NL·h−1) for 6 h.
The samples were labeled as TiSnx_y, where x is the Sn/Ti molar ratio, while y is a letter indicating the type of post-synthetic treatment (H for hydrothermal and C for calcination). Similarly, reference TiO2 samples with no Sn content were named Ti_H and Ti_C. Commercial pure TiO2 polymorphs (Sigma–Aldrich) were also used as benchmarks. The SnO2 samples were also prepared as reference: both commercial (Sigma–Aldrich) and synthesized oxides were adopted for this purpose. The latter was prepared by a previously reported procedure [35]; in brief, it was synthesized by precipitation starting from a 0.1 M SnCl4∙5H2O aqueous solution and using urea as precipitating agent (Sn:urea molar ratio 1:7) at 90 °C for 8 h; the precipitate was washed then treated in a Teflon-lined stainless-steel autoclave at 130 °C (SnO2_H); another sample was subjected to a final calcination at 400 °C in O2 flux (SnO2_C).
The optical properties of the samples were determined by diffuse reflectance spectroscopy (DRS). The spectra were recorded in the 250–800 nm range on a UV-vis spectrophotometer (Shimadzu UV-2600, Shimadzu Italia S.r.l., Milan, Italy) that was equipped with an integrating sphere. Reflectance curves were converted to absorptivity by applying the Kubelka–Munk function, F(R):
F(R) = (1 − R)2/2R = K/S
where R is the reflectance from a thick layer of powder, K is the absorptivity, and S is the scattering factor.
High resolution transmission electron microscopy (HRTEM) images were collected using a JEOL 3010–UHR microscope (JEOL (ITALIA) S.p.A., Milan, Italy), working at a 300 kV acceleration potential and equipped with a LaB6 filament. Micrographs were acquired using an Ultrascan 1000 camera and image processing was carried out using the Gatan Digital Micrograph 3.11.1 software. Before analysis, the sample powders were dry dispersed onto copper grids coated with “lacey” carbon film.
Fourier transform infrared (FT-IR) spectra were acquired on a PerkinElmer Spectrum 100 FT-IR spectrometer (PerkinElmer Italia S.p.A., Milan, Italy) working in attenuated total reflectance.
XAS spectra were measured at the XAFS beamline [36] operating at the Elettra synchrotron radiation facility in Trieste, Italy. The spectra were acquired at room temperature at the Ti K-edge and at the Sn L2,3-edges in transmission mode. The ring current and energy were 200 mA and 2.4 GeV, respectively. A Si(111) double crystal monochromator was used, ensuring high-order harmonic rejection by the de-tuning of the second crystal and a water cooled Pt-coated silicon mirror was used to obtain vertical collimation of the beam. For the measurements, a proper amount of sample (as to give a unit jump into the absorption coefficient) was mixed with boron nitride and then pressed into a pellet. The signal extraction was performed with the Athena code, belonging to the set of interactive programs IFEFFIT [37,38]. The pre-edge background was fitted by means of a straight line, while the post-edge by a cubic spline. All of the spectra were then normalized at unit absorption well above the edge, where the EXAFS oscillations were no more visible.

3. Results and Discussion

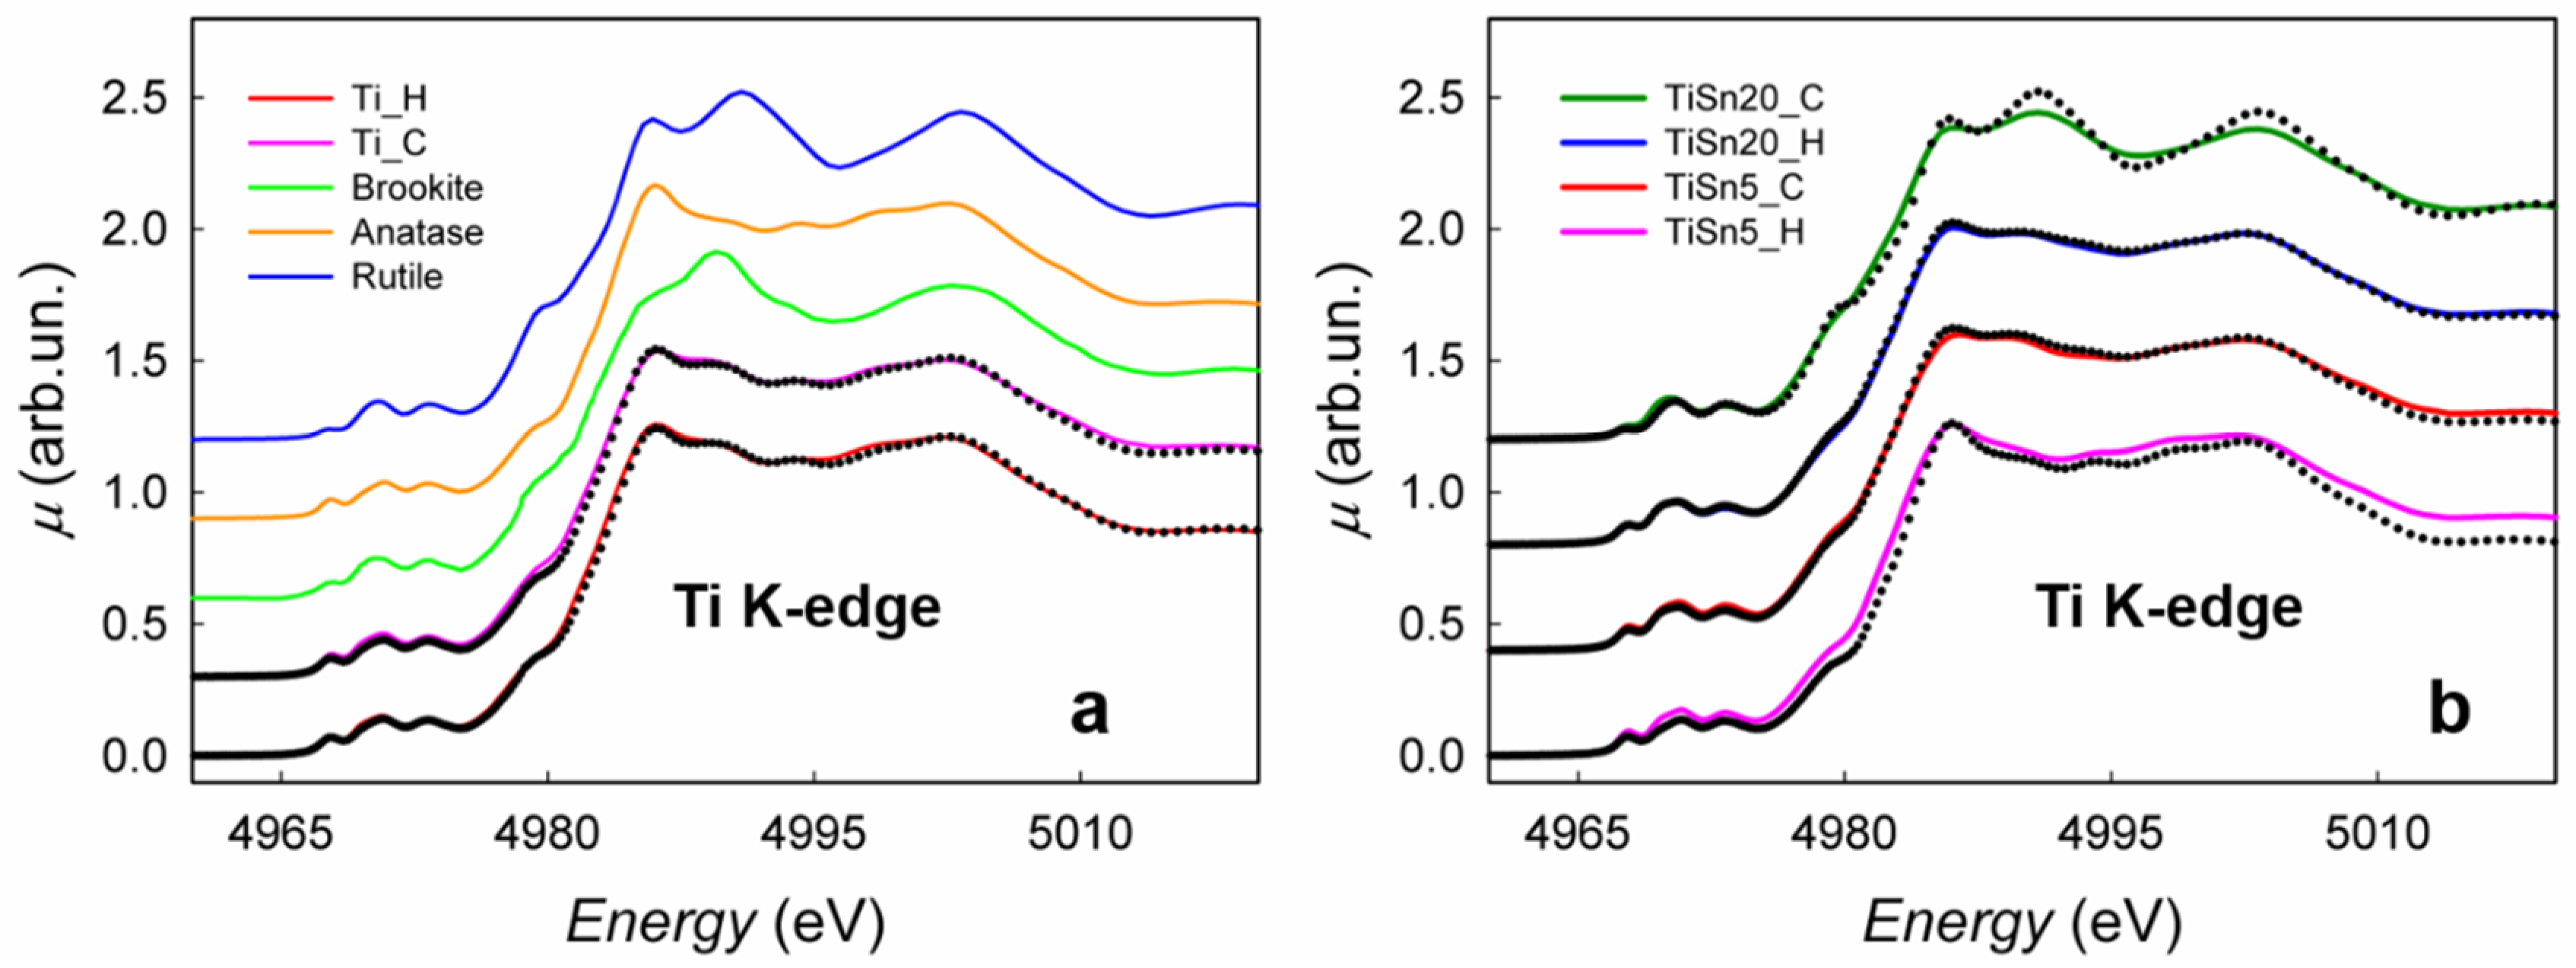
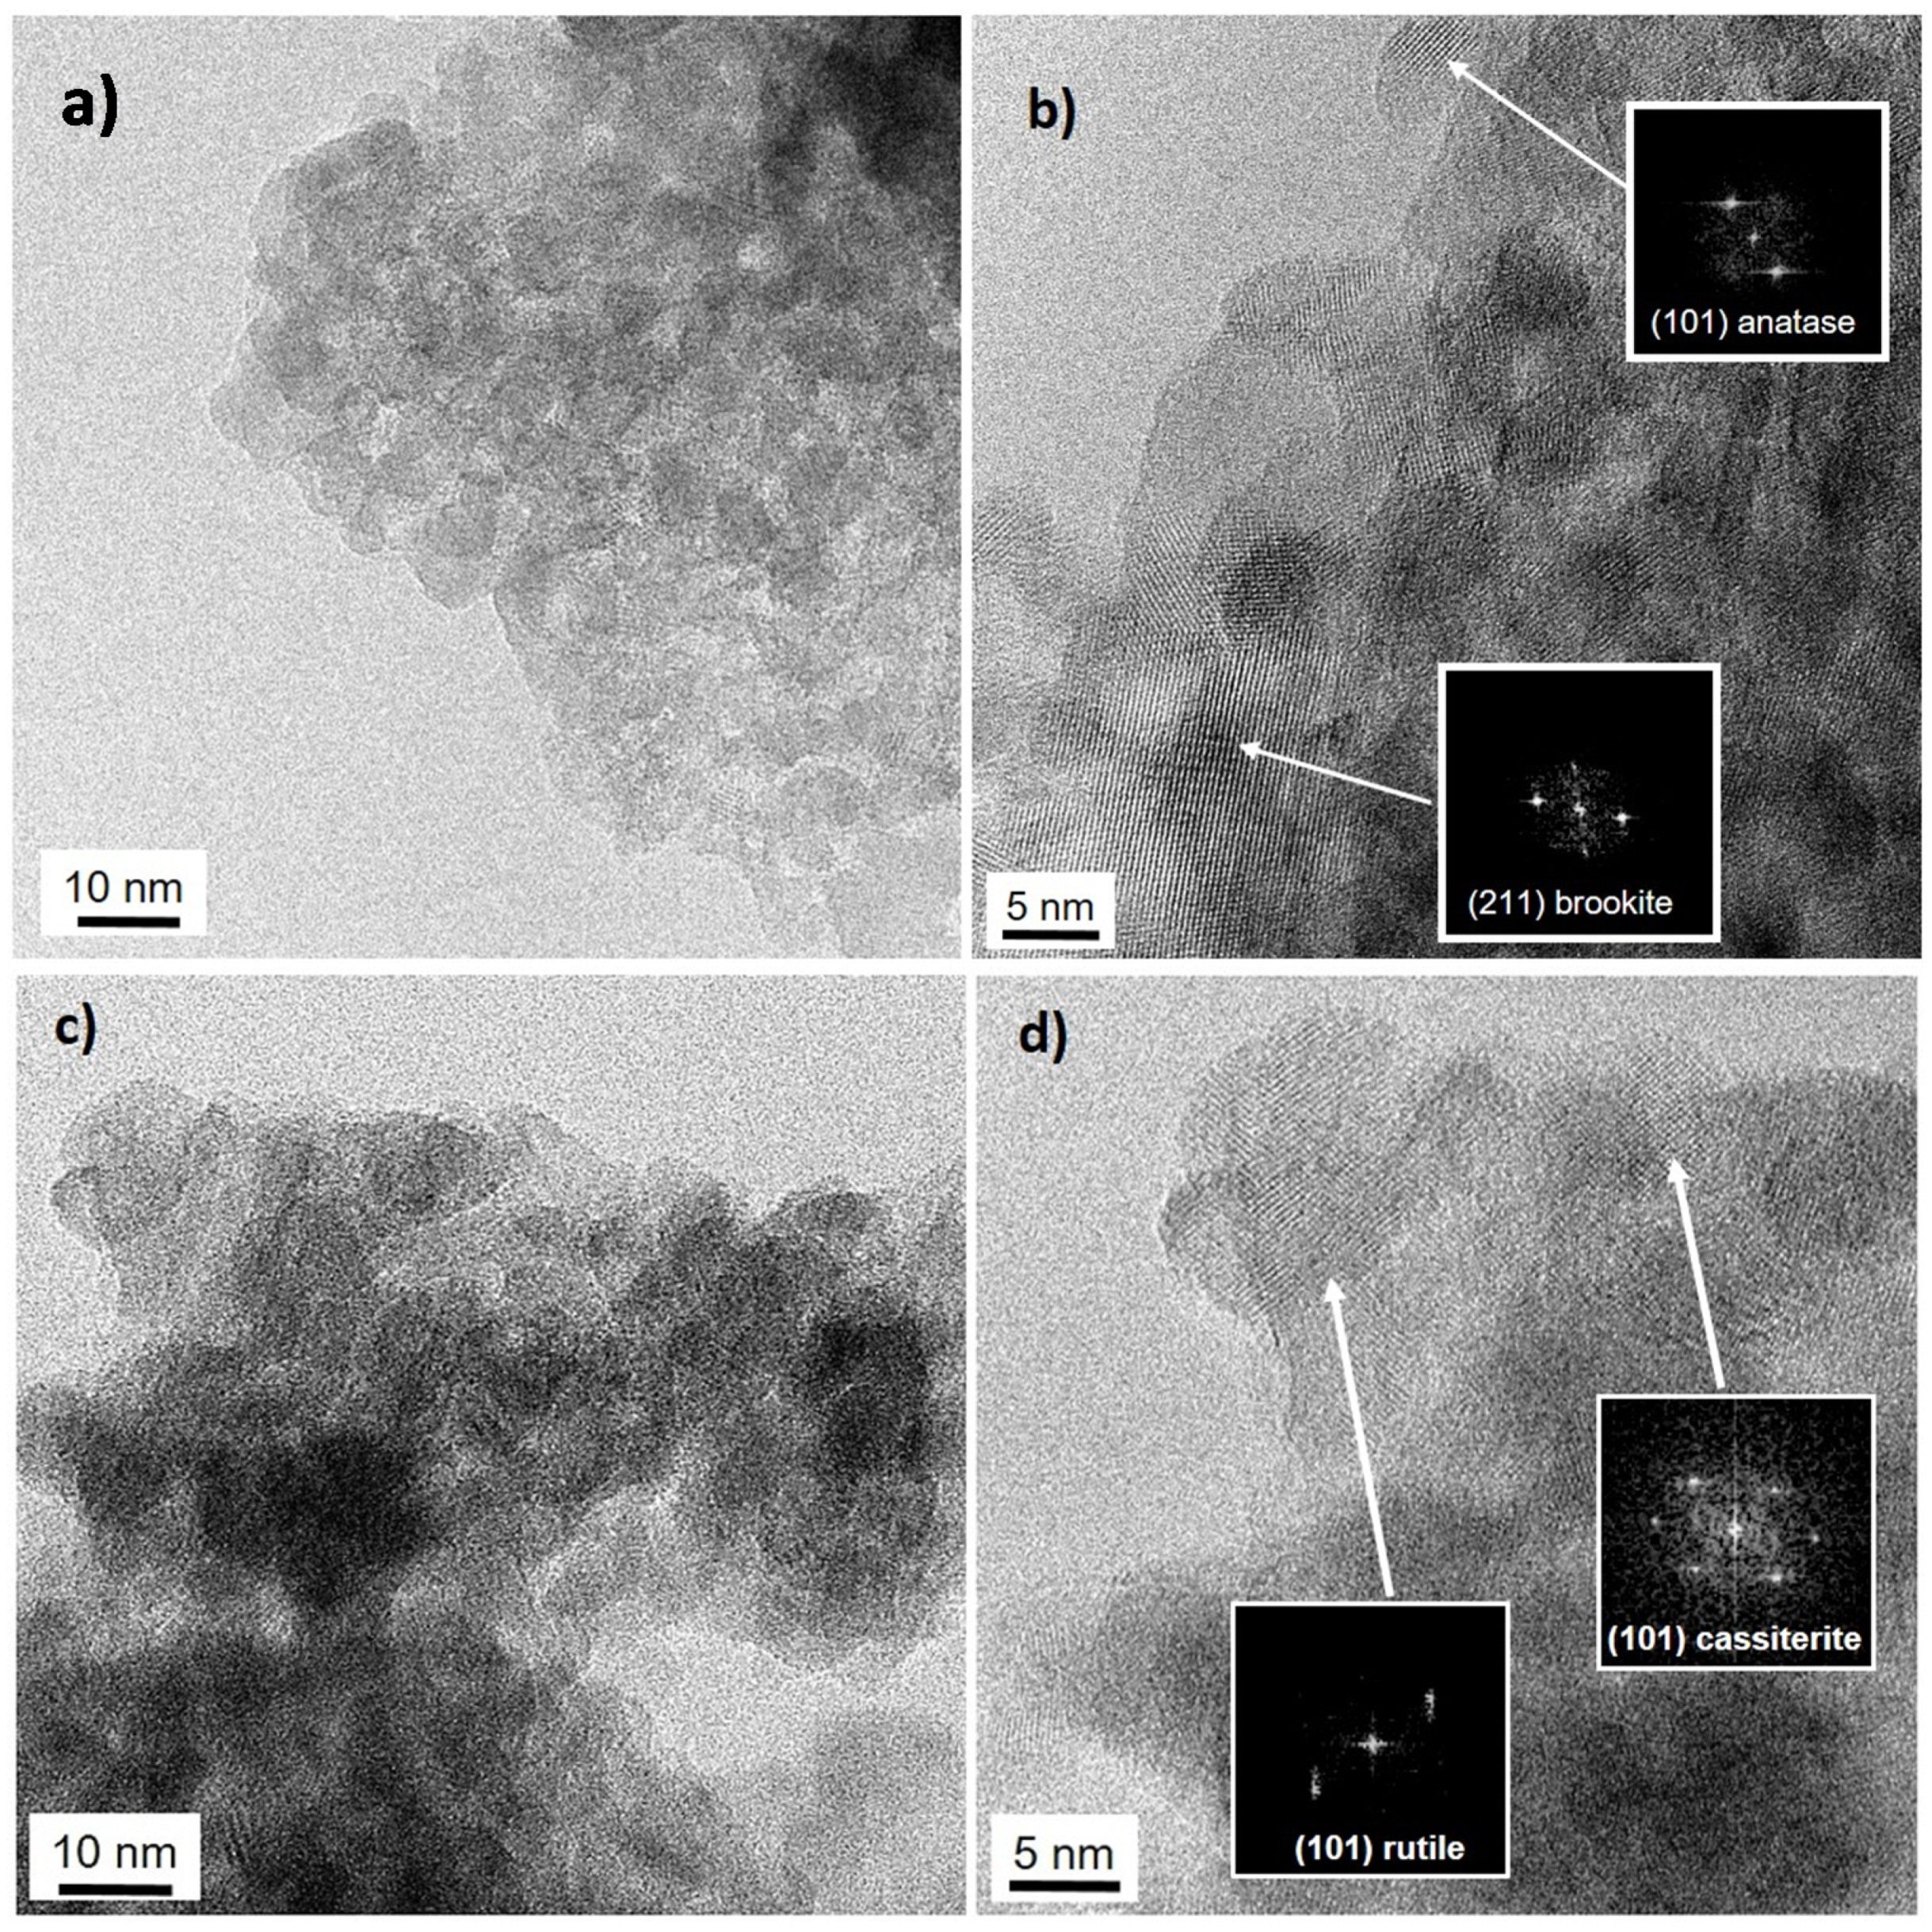
3.1. Structural Properties of the TiO2 Matrix

X-ray absorption spectra were acquired both at the Ti K-edge and at the Sn L2,3-edges in order to obtain a complete picture of the electronic and structural properties of the Sn-copromoted TiO2 nanomaterials. Here, we warn the reader that structural probes, such as XAS and TEM, are only indirectly sensitive to the presence of N in the structure, which, on the contrary, may affect in a relevant way the optical properties. Ti K-edge spectra were first measured on the reference materials, as shown in Figure 1a. TiO2 can exist in three possible structural modifications, namely anatase, rutile, and brookite, which mainly differ in the connectivity of the TiO6 octahedral units. While, for bulk samples, rutile is the most stable phase at ambient pressure and room temperature, the synthesis of nanometric TiO2 can also lead to the stabilization of brookite and anatase. Ti K-edge spectra result from the transition from filled 1s orbitals to empty 4p Ti orbitals; the different connection of octahedra leads to different binding energies and density of empty states, with the result that the three Ti K-edge spectra of rutile, anatase, and brookite are different and easy to discriminate. The spectra of the Ti_H and Ti_C, corresponding to TiO2 with no Sn content and synthesized through hydrothermal synthesis (H) or calcination (C), closely resemble each other, and they clearly show the presence of different TiO2 phases; for a quantification, a linear combination fit was performed, starting from the rutile, anatase, and brookite spectra. For both samples, the best fit showed the presence of 76(2)% anatase and 24(1)% brookite. However, it should be noted that, in the case of nanocrystalline particles of small dimensions (as in the present case, see the HRTEM results below), a notable broadening of the main XAS peaks is expected, and this can lead to a certain degree of error in the quantification of phases.
Figure 1b shows the XAS spectra of TiSn20_C, TiSn5_C, TiSn20_H, and TiSn5_H at the Ti K-edge.
The derivative spectra of all the samples were also calculated and compared to the derivates of the standard spectra, in order to search for possible shifts of the edge energy (see Figure S1a); the precise correspondence of all the features in the derivatives allows for excluding the presence of Ti in oxidations states different from Ti (IV), at least within the sensitivity limits of the technique (±5%). The N,Sn-copromoted TiO2 nanoparticles described here have a radius of ca. 5 nm, meaning that ca. 10% of Ti atoms are at the surface. This figure is twice the sensitivity of ca. 5% of XAS, which is not an error in the data analysis, but rather an intrinsic sensitivity limit of the technique. This means that the contribution of the Ti atoms at the surface is rather relevant for what concerns the XANES.
The spectrum of TiSn20_C presents all of the structures corresponding to rutile, shown for the sake of comparison as a black dotted line. As expected, and as pointed out before, while the peaks lie in the same position of the reference spectrum, they show a notable broadening; however, it can be safely stated that TiSn20_C has a pure rutile structure, notwithstanding the low calcination temperature here adopted (400 °C). Doping with tin seems to favor the formation and, therefore, the stabilization of rutile, which is isostructural with SnO2 in its most stable modification, cassiterite. In this respect, Okajima et al. reported DFT calculations showing that Sn(IV) substitutional doping in the TiO2 structure reduces the formation energy of rutile with respect to anatase, hence favoring the formation of the rutile [22]. Therefore, in the present case, the formation of pure rutile in the TiSn20_C sample can be related to its high Sn content coupled to the calcination procedure. When the Sn/Ti ratio is lower, i.e., 5%, and for the same synthetic method (TiSn5_C sample), the best fit shows a mix of anatase, brookite, and rutile. In this case, the quantity of tin seems to be too low to induce the neat formation of rutile TiO2. The same happens when the samples are synthesized via the milder hydrothermal procedure, even when the Sn/Ti ratio is 20%. In the case of TiSn5_H, no trace of rutile is found, and all of the peaks clearly coincide with the anatase reference spectrum (shown for comparison in Figure 1b as the black dotted line). A reliable phase quantification for TiSn5_C and TiSn20_H was possible via a linear combination fit starting from TiSn20_C and TiSn5_H, which account for Sn-copromoted titania with pure rutile structure and with pure anatase structure, respectively. As an example, the linear combination fit for TiSn20_H is better shown in Figure S1c, together with the corresponding residual; all of the residuals (experimental data minus fit) are shown for all the samples in Figure S1d, while panel b shows the difference between the spectra of TiSn20_C and TiSn5_H and the standard spectra of rutile and anatase, respectively. In this last case, it can be noted that all of the differences are due to the nanometric size of the samples with respect to the standards, as pointed out before. Concerning the experimental fits, it can be noted that in all cases the residual is low and negligible, thus confirming the good quality of the fitting procedure.
TiO2 in TiSn20_H is a mix of anatase and rutile, despite the relatively high quantity of tin, as shown in Table 1. This indicates that probably, in this Sn/Ti ratio, the hydrothermal synthesis prevents most of tin atoms to penetrate in the lattice, leaving SnO2 confined at the surface of the nanoparticles. This hypothesis is supported by previous XPS/EDX studies [28], showing substantial surface segregation of tin species for hydrothermal samples, in agreement with a much lower bulk penetration of the heteroatoms during the low temperature post-treatment with respect to calcined samples. In Table 1, the phase quantification that is obtained by XAS is compared to previous results obtained from XRD measurements (Table 1, column 5) [28]. When considering the different sensitivity of the two techniques to local and long-range order, respectively, the agreement is rather satisfactory.
TEM images support the phase composition that has been determined by XAS analyses. Figure 2 reports representative (HR)TEM images of TiSn5_C and TiSn20_C. The samples are characterized by a good degree of crystallinity and exhibit pseudo-spherical crystallites, generally smaller than 10 nm in size, which is in good agreement with the values determined by Scherrer analysis of diffractograms [20,28]. Figure 2a,b confirm that, when a lower tin content is introduced, TiO2 is mostly in the anatase form (d101 = 0.339–0.342 nm), with some evidence of the brookite polymorph (d211 = 0.291–0.294 nm). Moreover, at this low Sn content, segregated cassiterite SnO2 is only seldom recognizable, as it will also be discussed on the grounds of Sn L2,3-edges XAS spectra. In the case of TiSn20_C (Figure 2c,d), TiO2 is mostly present as the rutile polymorph, in close agreement with the Ti K-edge XAS findings. Along with rutile TiO2 (d101 = 0.246–0.249 nm), highly dispersed cassiterite SnO2 is also appreciable at this high Sn content, both on the basis of interplanar distances (d101 = 0.260–0.263 nm) and of the electron diffraction patterns (Figure 2d). In this respect, it should be noted that previous XRD investigations [20,28] showed no well-defined peaks that were related to SnO2 phases, possibly due to the highly dispersed nature and low content of segregated cassiterite Moreover, because cassiterite and rutile are isostructural, their reflections are substantially overlapped in the XRD pattern, thus preventing easy distinction between the phases. The localization of Sn species in the samples will be further discussed on the grounds of XAS spectra at the Sn L2,3-edges.

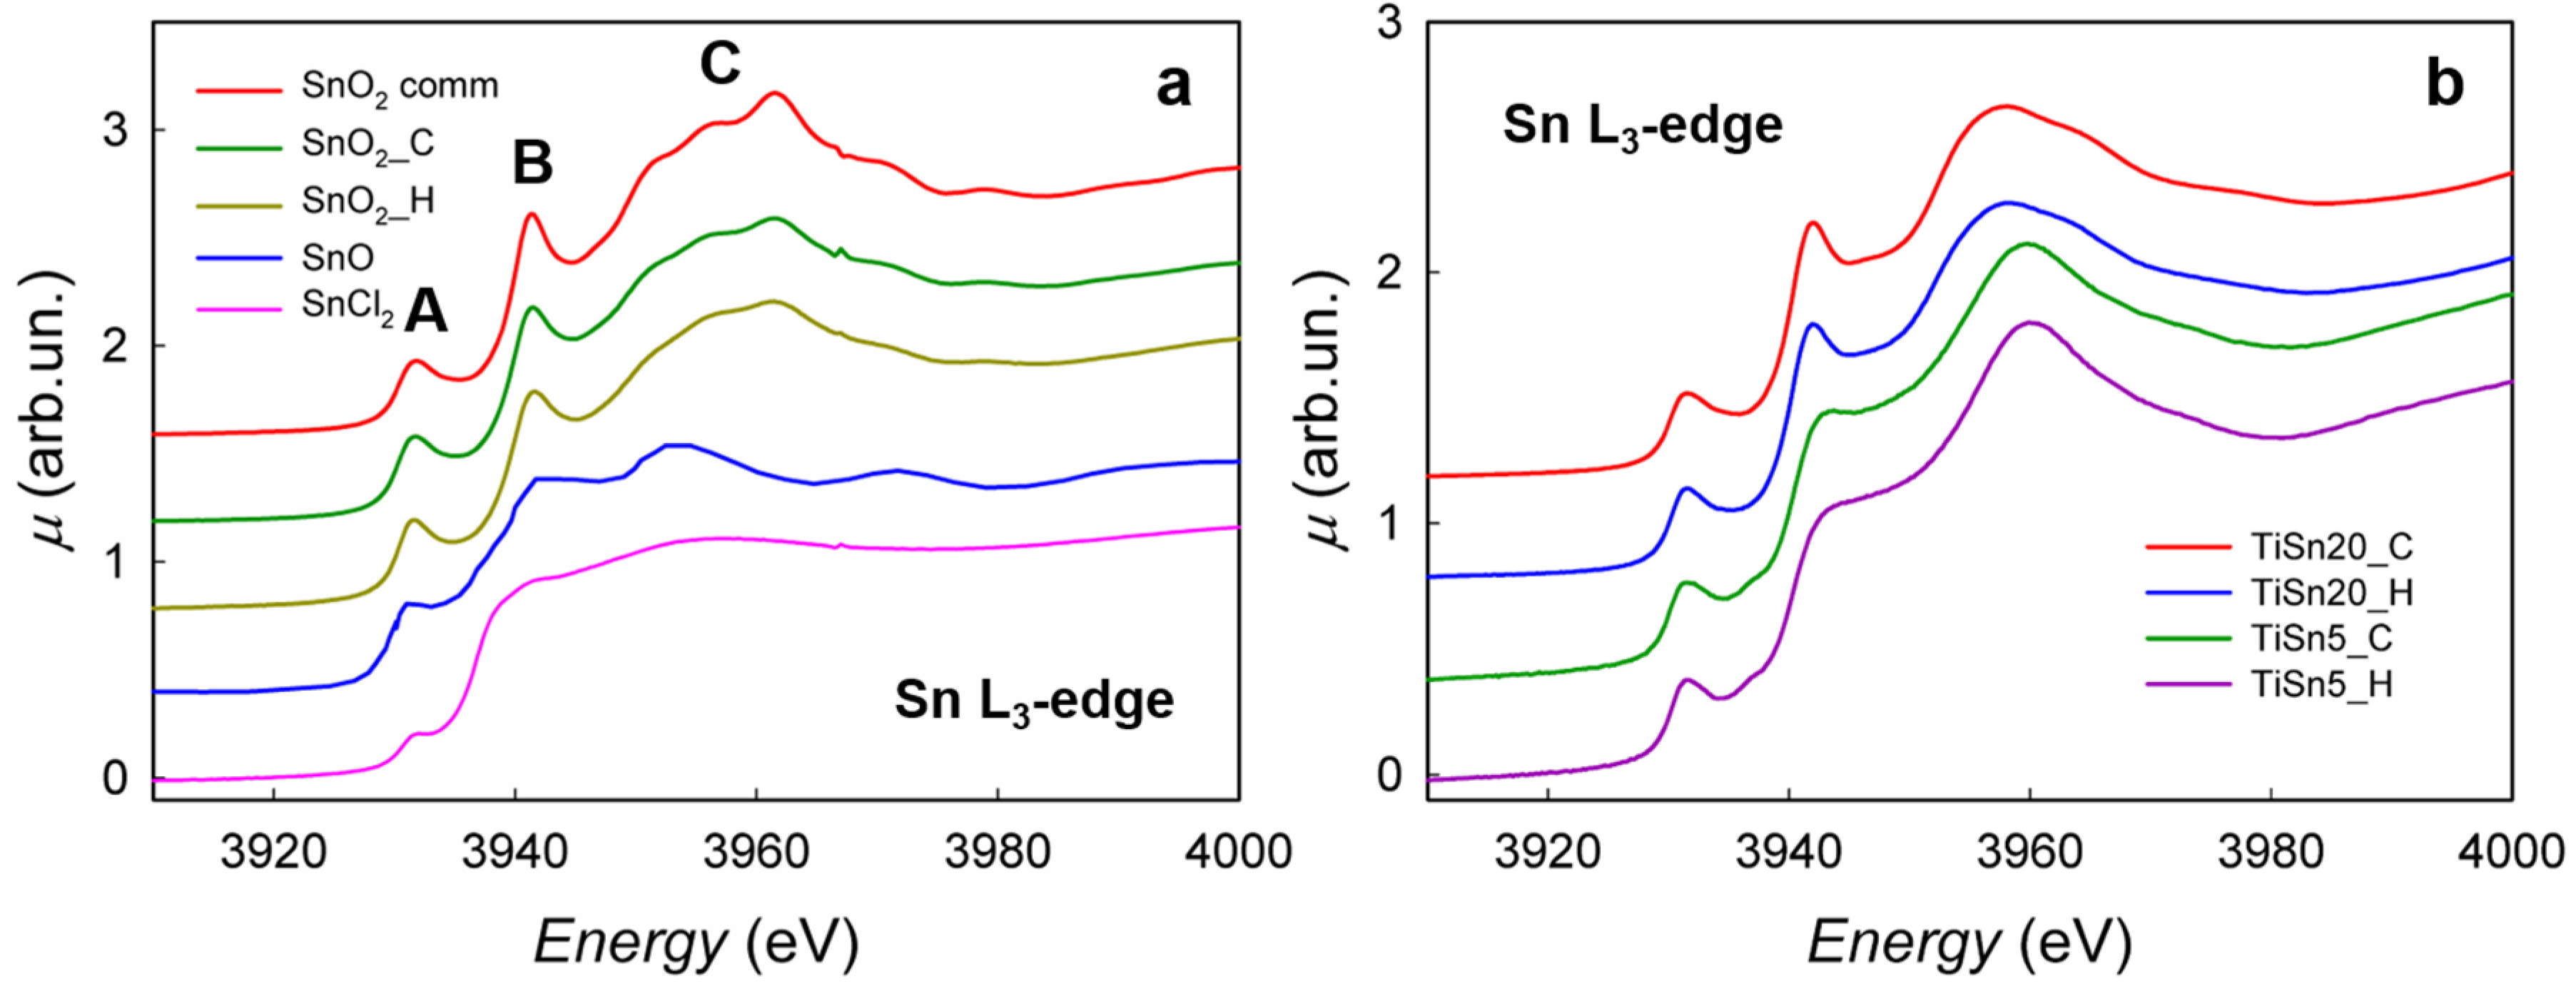
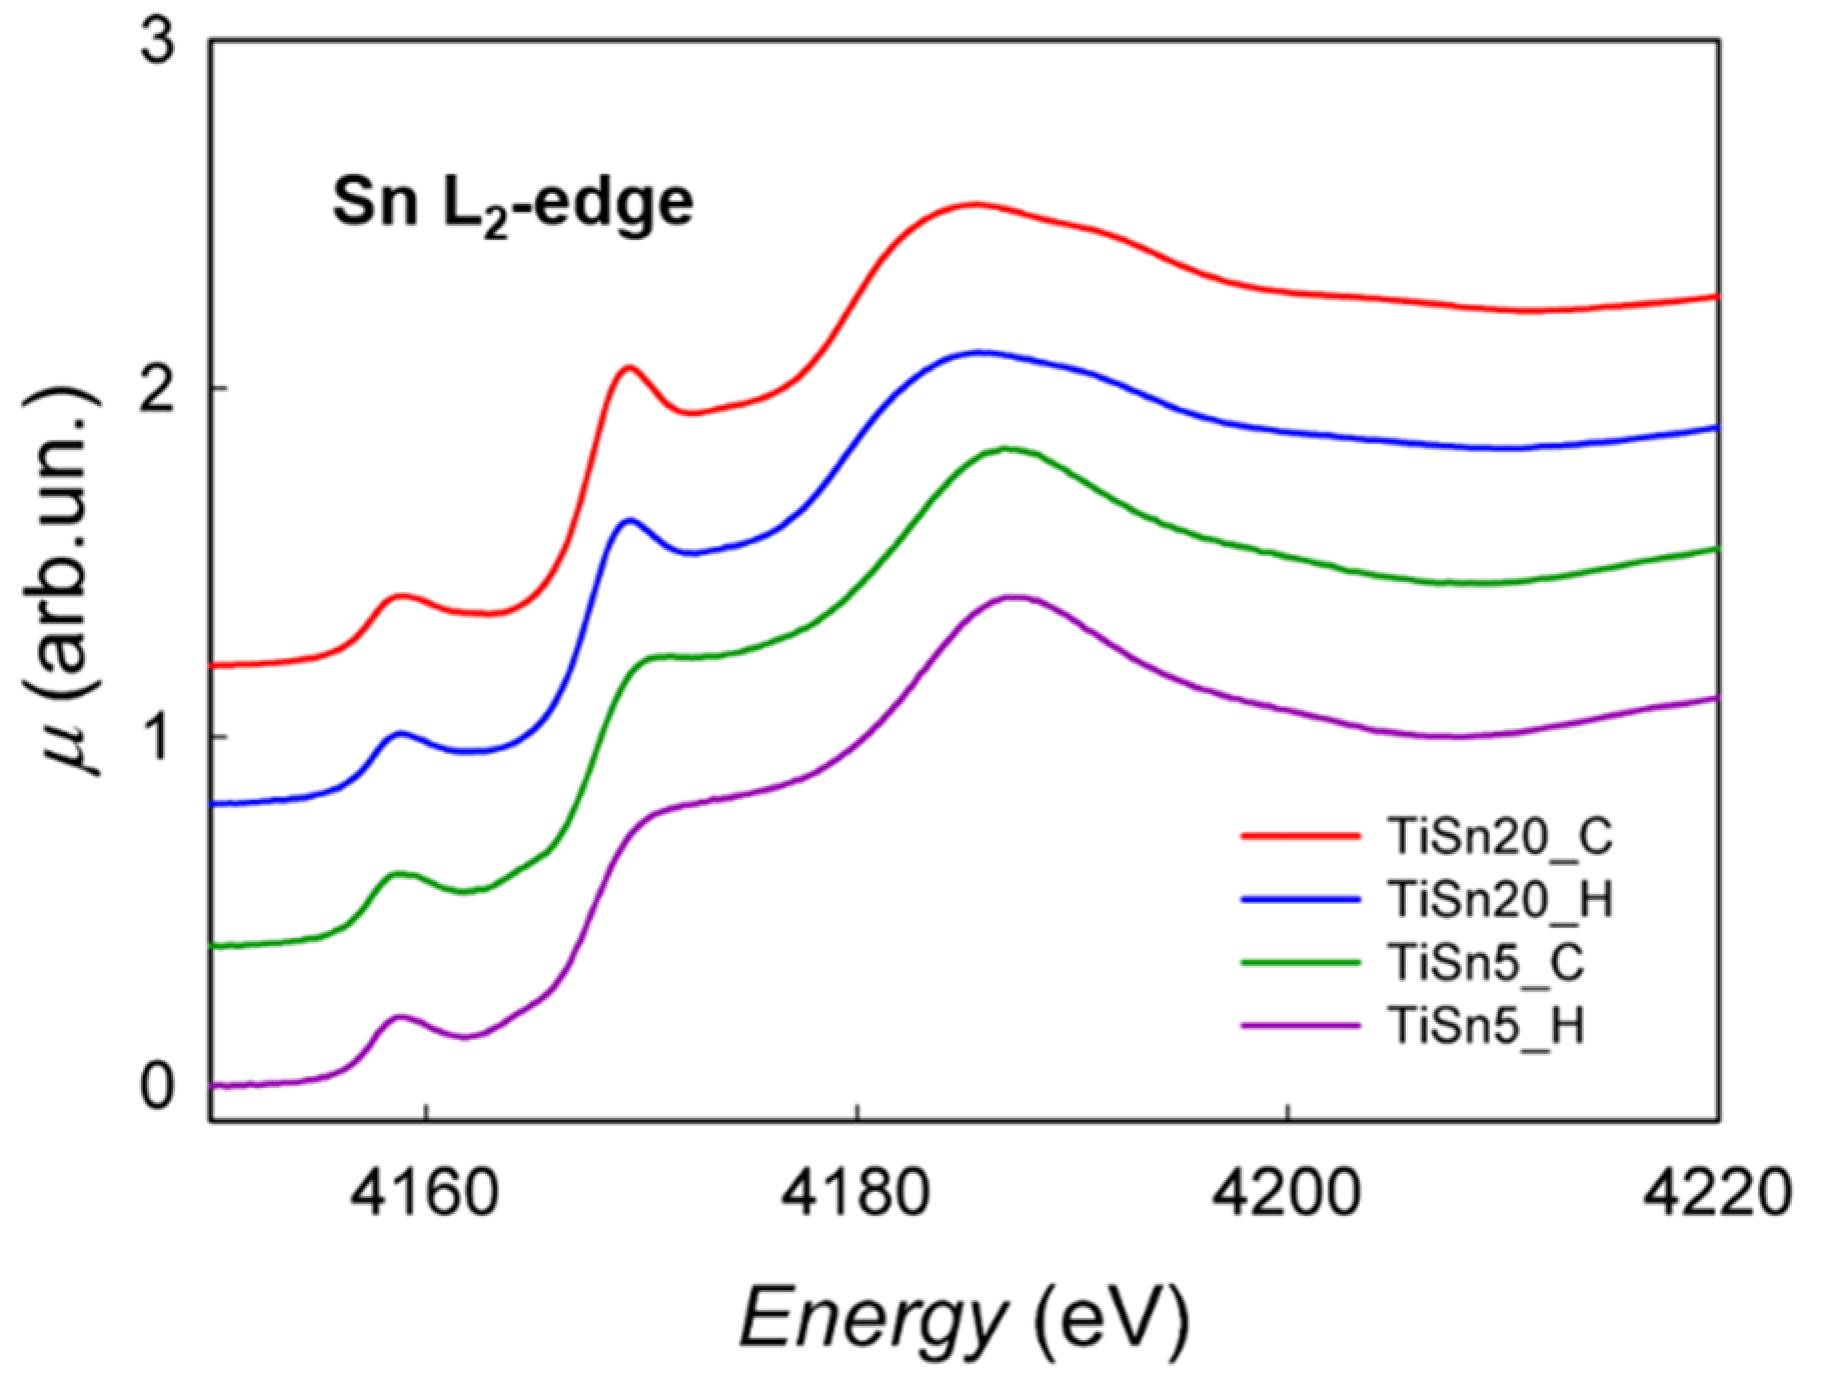
3.2. Tin Location in the Oxide

XAS spectra were acquired at the Sn L2,3-edges for a better understanding of the role of Sn on the structural and electronic properties of our samples. The Sn L3-edge spectra of some reference compounds were first acquired and they are shown in Figure 3a.
The spectra of SnO2 synthesized via calcination (SnO2_C) and hydrothermal procedure (SnO2_H) show a close resemblance to commercial SnO2, despite some broadening of the main peak (White Line, WL). In XAS spectra, peaks in the close proximity of the edge can be ascribed to a specific electronic transition to empty states that are projected on the photoabsorber. The L3-edge is due to the transition from filled 2p3/2 Sn states to empty Sn orbitals of either 5s or 5d nature. In particular, the peaks that are indicated as A and B in Figure 3 are due to the transition 2p3/2 → 5s1/2, while the whole region that is indicated as C is due to transition to empty 5d5/2 orbitals [26]. In SnO2, tin has electronic configuration [Kr]4d105s05p0: the 5s orbitals, being empty, are accessible to the photoelectron, thus resulting in two well visible peaks, A and B. The exact origin of these two peaks has yet to be clarified as, in principle, the 2p3/2 → 5s1/2 transition should give rise to just one peak. We here offer a tentative attribution by considering the similar situation of the Ce L3-edge in CeO2 [39,40], although a precise interpretation has to be supported by full calculations that are outside the aims of the present paper. In CeO2, the L3-edge is characterized by a two peak structure, while the 5d0 electronic configuration of Ce(IV) would suggest the presence of just one peak. Final state effects, and the covalence of the Ce-O bond in CeO2, allow for transitions to the empty 5d states of the 4f0 and of the 4f1L electronic configurations, where L represents a hole in the ligand states [31], thus giving rise to the two peak structure. Here, we can also note that the Sn-O bond in SnO2 has a large covalent character. Thus, the Sn 5s and 5p states are expected to show a high degree of hybridization with the O 2p states. Correspondingly, ligand electrons are transferred in the 5s states, giving rise to the additional electronic configuration 5s1L, where L represents a hole in the ligand states. In analogy with CeO2, we can then attribute peak A to the 2p3/2 → 5s1/2 transition of the s0 electronic configuration, and peak B to the 2p3/2 → 5s1/2 of the 5s1L electronic configuration. In SnO, the electronic configuration of tin is [Kr]4d105s25p0, so it would be expected to have a negligible intensity of peaks A and B; however, probably due to partial hybridization between s and p orbitals, these peaks show a lower intensity, but they are still visible in the spectrum (blue line in Figure 3).
Figure 3b shows the spectra of TiSn20_C, TiSn20_H, TiSn5_C, and TiSn5_H at the Sn L3-edge, while the spectra at the L2 edge are reported in Figure 4. The spectra of TiSn20_C and TiSn20_H show a close resemblance to each other and are similar to the spectra of SnO2_C and SnO2_H, despite minor differences in the white line. This can be rationalized when considering that TiSn20_C presents a sizable rutile content, which provides a neighboring environment that is similar to cassiterite; in addition, HRTEM micrographs showed that part of SnO2 remains segregated as cassiterite. Unfortunately, it is impossible to discern from XAS the portion of segregated SnO2 due to the similar neighboring environment or rutile and cassiterite, thus preventing any precise quantification. Concerning TiSn20_H, the quantity of rutile is lower (28%), thus indicating that most of SnO2 does not enter the structure. This is in agreement with our observation at the Sn L3-edge.
The XAS spectra of TiSn5_C and TiSn5_H have a profile that is completely different from samples with 20% Sn/Ti ratio, clearly showing that, in this case, the chemical surroundings of Sn are not those that are typical of cassiterite. When considering that, as demonstrated by the Ti K-edge analysis, Ti is mostly present as anatase TiO2, it is reasonable to suppose that in this case Sn is not segregated (as also observed by TEM analysis), but it is a substitutional dopant in the TiO2 structure, with the chemical surrounding typical of anatase/brookite, leading to the characteristic spectrum profile that is shown in Figure 3b. When considering a complete insertion of Sn in the TiO2 structure, we could, in principle, say that 5% (as molar ratio) of Ti4+ is affected by disorder due to the substitution with Sn4+. Moreover, the most striking feature of the two spectra of TiSn5_C and TiSn5_H is the notable reduced intensity of the peak indicated as B in Figure 3a. The lower intensity of this peak indicates that the 5s orbitals are partially filled, as mentioned above: this points towards the fact that Sn might be partially present in a reduced Sn2+ state. Moreover, in agreement with the previous attribution, peak B is strongly depressed by the addition of extra electrons in the 5s1L electronic configuration, while peak A, due to the 5s0 electronic configuration, still retains a considerable intensity. A subtraction procedure was applied to isolate peak B in order to quantify the amount of reduced tin, as it is shown in the Supplementary Materials (Figure S2). The areas of peak B for the different samples was then obtained (see Supplementary Materials, Table S1), and the fraction of reduced tin was obtained by   1 ( A S A SnO ) / ( A SnO 2 A SnO ) , where A S , A SnO   and A SnO 2 are the areas of peak B in each sample, SnO and SnO2, respectively. Table S1 shows the results. The reader is warned that, mainly due to the arbitrariness of the background subtraction procedure, the values that are shown in Table S1 are to be considered as semi-quantitative. It is reasonable to suppose that Sn2+ is still a substitutional dopant in the TiO2 structure; in fact, intrinsic defects in SnO2 give rise to oxygen vacancies that are compensated by substitutional Sn(II) on the Sn(IV) sites [41], while aliovalent self-doping of SnO2 with Sn(II) is a commonly used tool for improving the electrical properties, which are relevant for the applications of SnO2 in gas sensing [42]. This means that Sn(II) can easily replace Sn(IV) in the SnO2 structure. Thus, substitutional doping of Sn(II) in the TiO2 structure can be deemed as possible, given the close similarity in ionic radii of Ti(IV) and Sn(IV) and the fact that SnO2 has the rutile structure.
Figure 4 shows the XAS spectra at the Sn L2-edge; in this case, the transition is from filled 2p1/2 orbitals to empty s or d orbitals above the Fermi level. It can be seen that the profile is analogous to that found for the L3-edge, which confirms the presence of tin in a partial reduced state for the TiSn5_C and TiSn5_H samples.
It is worth noting that evidence of tin in a partially reduced state is found not only for TiSn5_H, which underwent a mild hydrothermal treatment, but also for TiSn5_C, which was, in turn, calcined in O2 at 400 °C. This could be explained by a combined effect of ammonia in the synthetic procedure, which creates a reducing environment, and of the N-doping, which could concur to stabilize the formation of Sn(II) (vide infra).

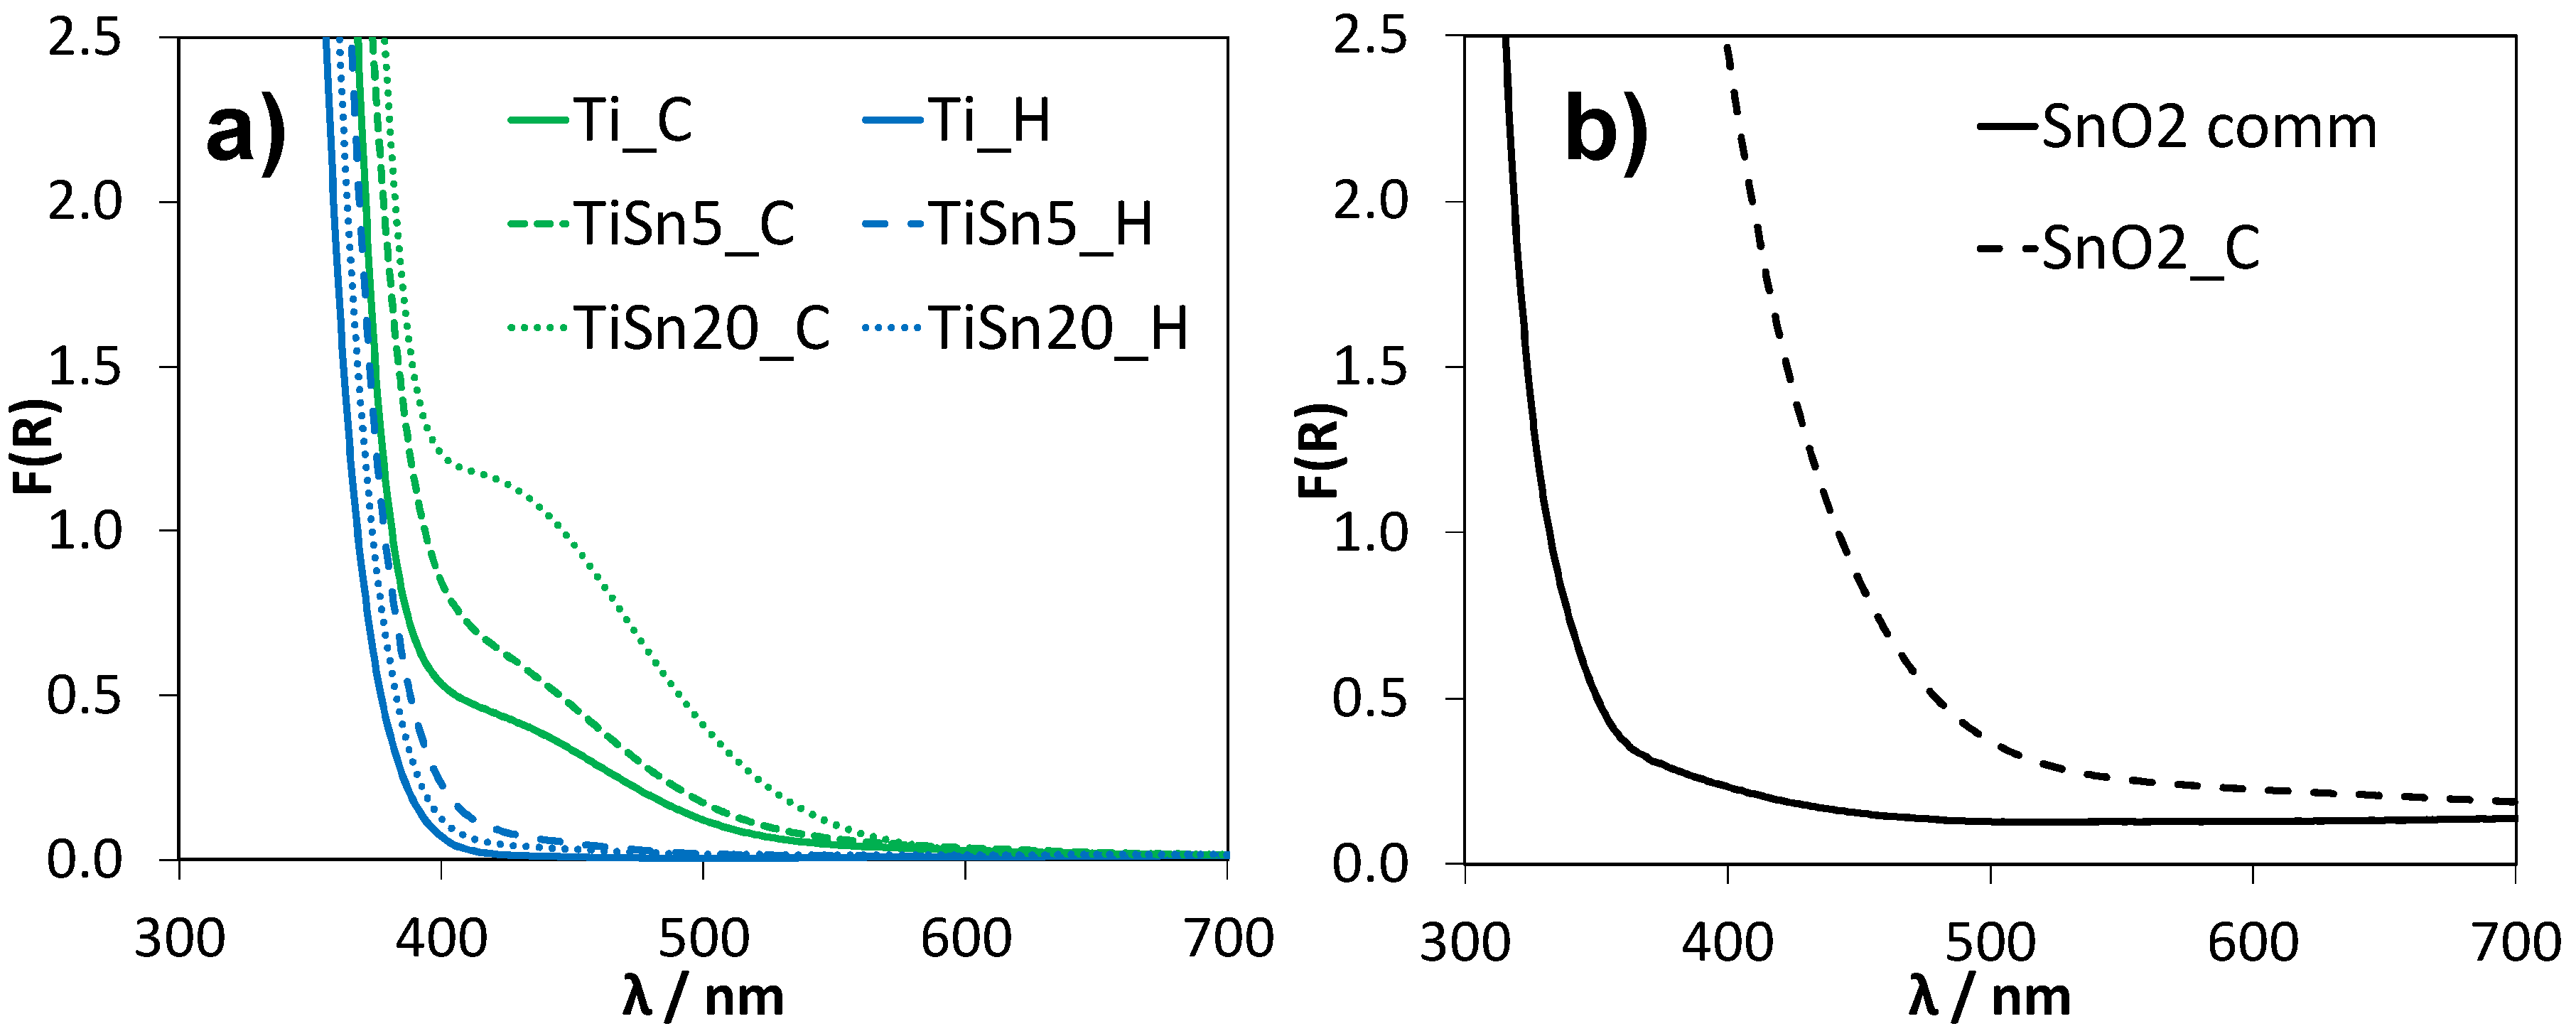
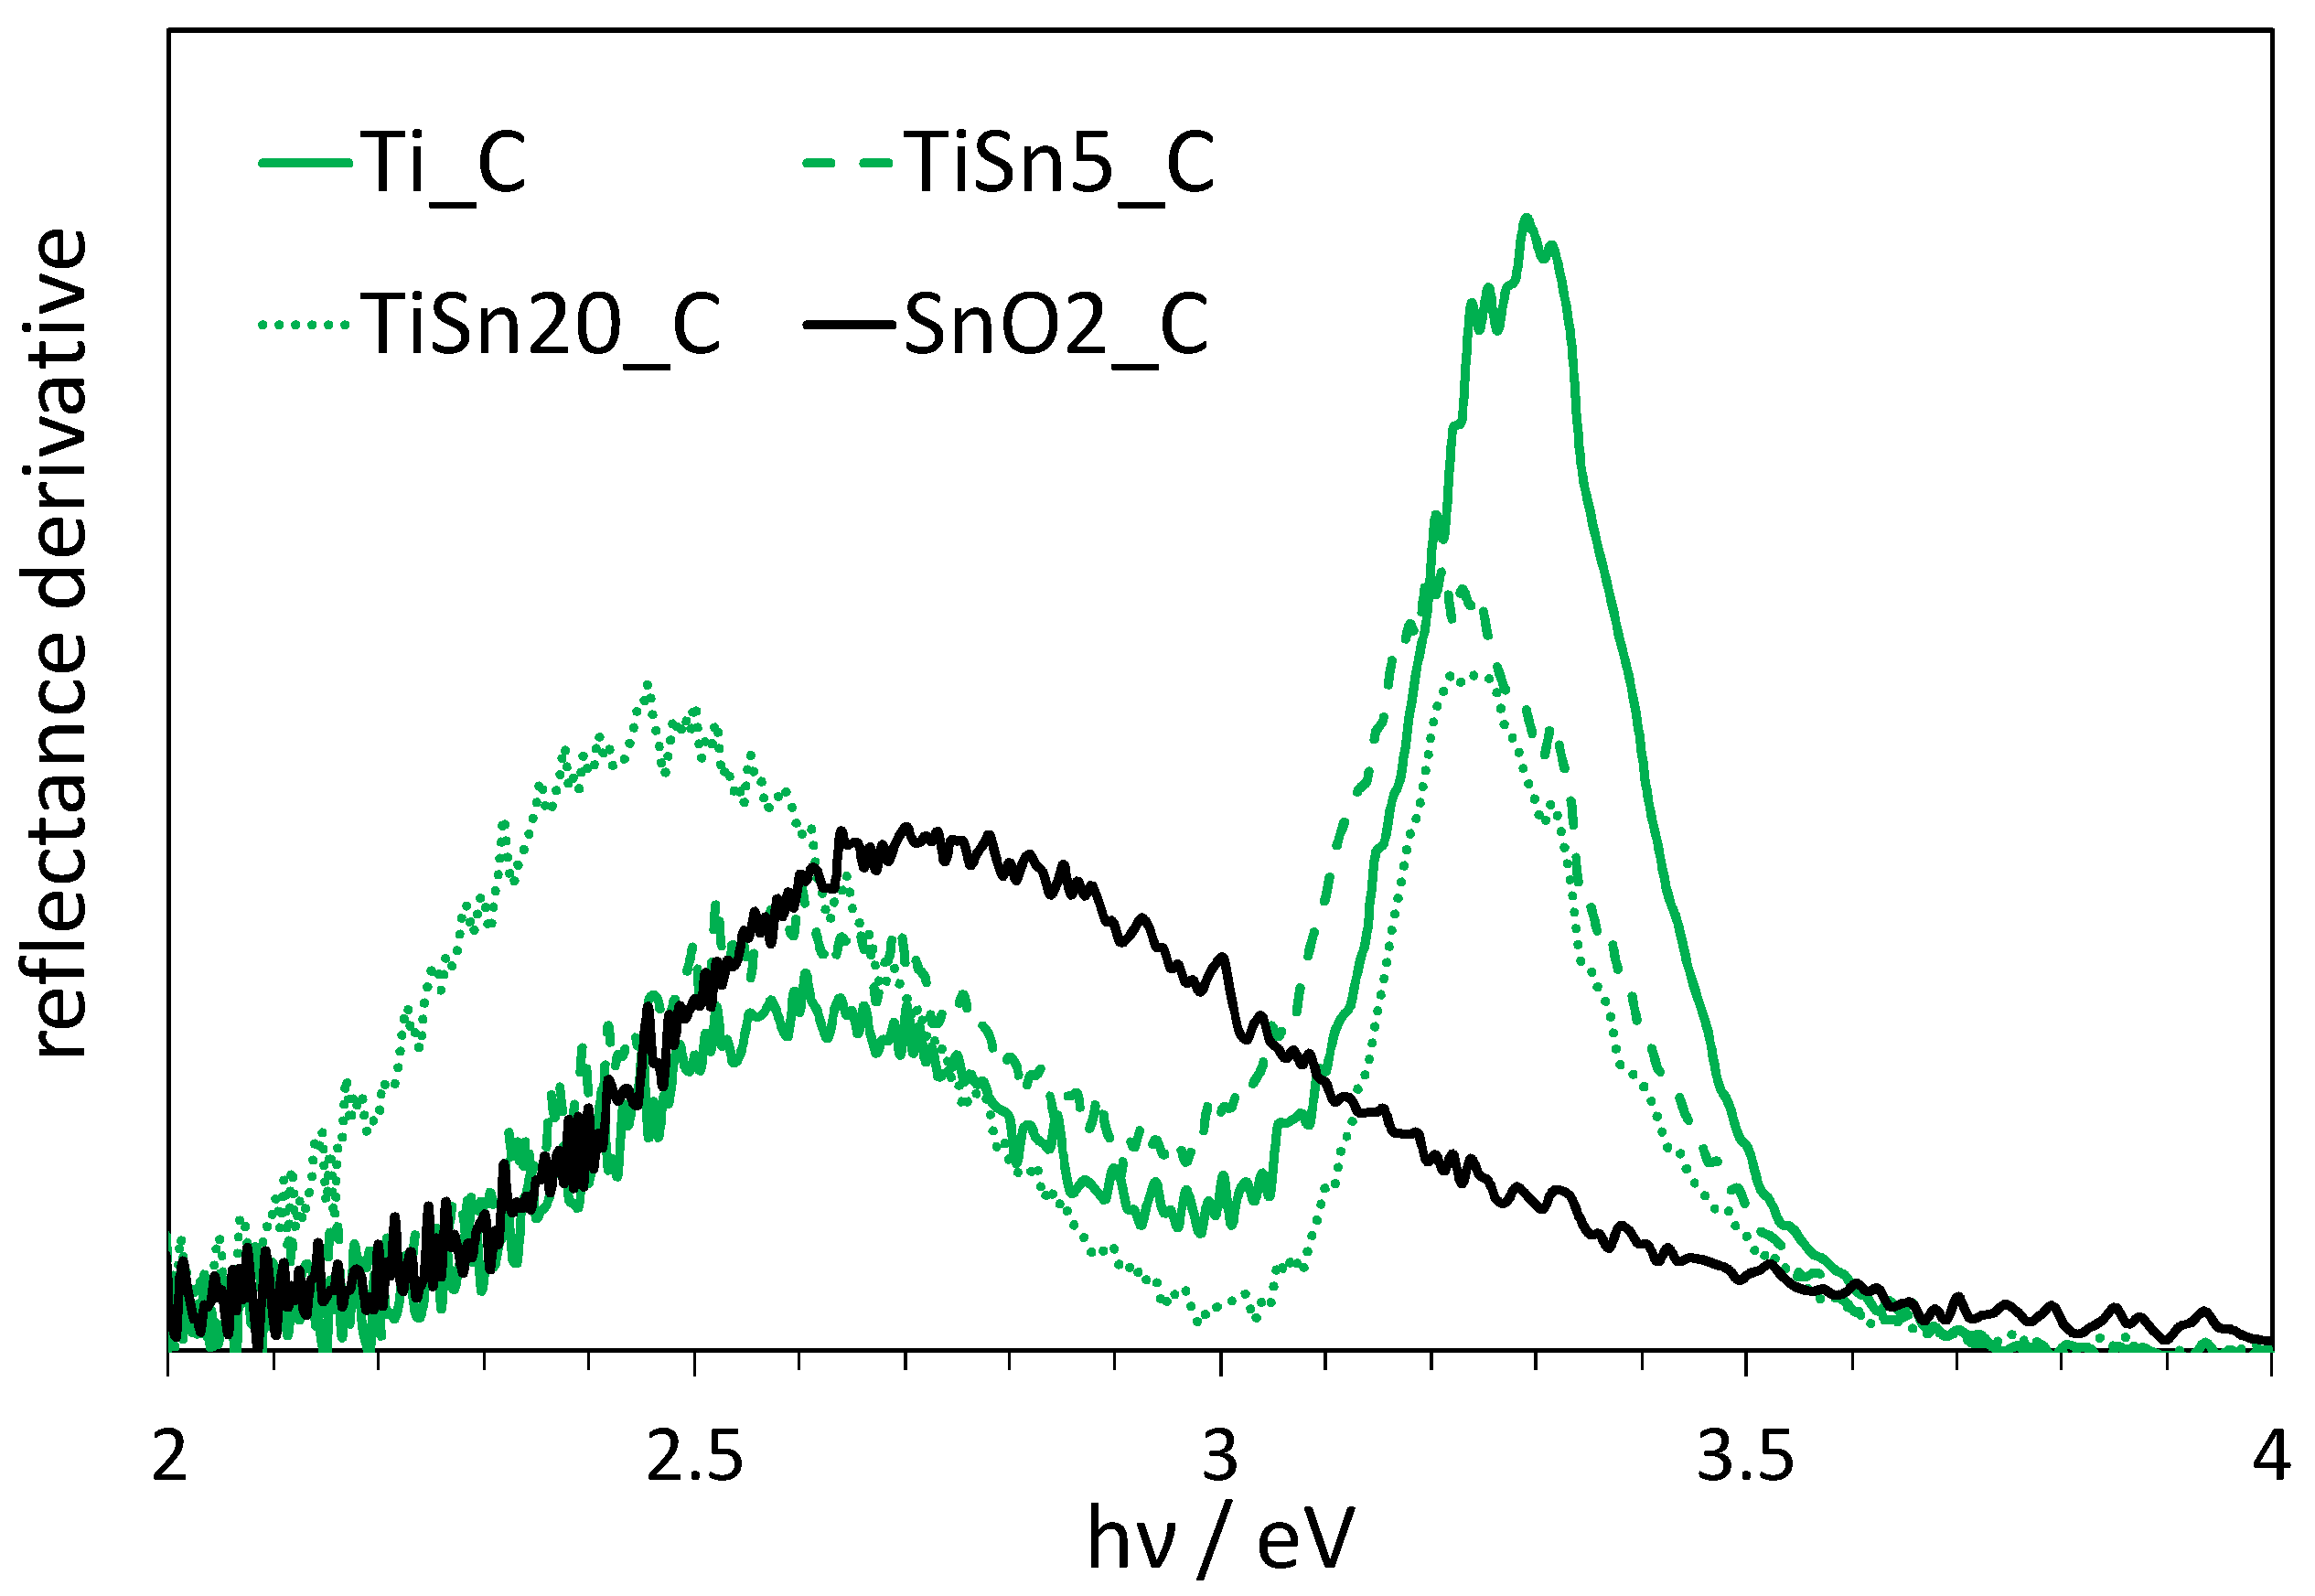
3.3. Optical Properties

The role of N doping in the samples, as mentioned above, can be better evidenced by the study of the optical properties. The optical properties of Sn-promoted TiO2 samples present notable differences, depending on the Sn/Ti molar content and on the post-treatment. The normalized diffuse reflectance spectra (Kubelka–Munk function vs. wavelength) are shown in Figure 5a. The spectra of Ti_H and Ti_C are also reported for the sake of comparison.
Figure 5a shows a marked difference in terms of visible light absorption between hydrothermal and calcined TiO2 samples, irrespective of the amount of Sn introduced. While samples from hydrothermal treatment present the classical light absorption of TiO2 semiconductors, with an absorption edge at ca. 390 nm, the calcined samples present a marked absorption in the visible region. In particular, both undoped and Sn-promoted TiO2 samples upon calcination show, beside the light absorption in the UV region characteristic of TiO2, a light absorption centered at about 450 nm that imparts a yellowish color to the powder. This optical feature can be attributed to the occurrence of defects giving rise to intragap electronic states. Similar optical properties have been reported in the case of N-doped TiO2 [43] and attributed to intragap states due to N interstitial doping within the TiO2 lattice [44]. It should be noted that N species (ammonia) was added during the synthesis of all TiO2 samples. Thus, it can be assumed that the calcination step promotes the diffusion of N species in the TiO2 structure, giving rise to N-doping and, consequently, to visible light absorption. This attribution is confirmed by DR spectra of Sn-doped TiO2 samples that were prepared using the same synthetic procedure, followed by calcination, but without the addition of nitrogen containing species (Figure S3): the absence of the absorption component in the visible region for the Sn-doped TiO2 sample supports the attribution of this feature to N-doping. On the contrary, the hydrothermal treatment appears to be unsuitable for introducing the N species within TiO2, leading to optical properties mirroring undoped anatase-brookite TiO2 [45], and supported by the comparison with Figure S3. A lower diffusion of N species in the case of hydrothermal samples is also supported by FTIR evidence (Figure S4), showing, for these samples, irrespective of the presence of Sn, the occurrence of surface N species: the peak at ca. 1430 cm−1, not appreciable for calcined samples, can be ascribed to surface NH4+ species [46,47,48].
The optical properties of SnO2 samples were also considered to better understand the effect of tin doping in the TiO2 samples. Figure 5b reports the DR spectra of SnO2_C with respect to a commercial SnO2 powder: both of the samples exhibit absorption curves that are characteristic of semiconductor materials; however, the position of the absorption edge varies greatly between the two samples. While the commercial oxide shows a light absorption only in the UV region, in good agreement with literature band gap values for SnO2 [18,19], the SnO2_C sample presents a red-shifted absorption edge that leads to a marked visible light absorption up to ca. 500 nm. It is noteworthy that N species were added also during SnO2_C synthesis. In this respect, the occurrence of N-doping in pure SnO2 has been investigated both theoretically [47,49,50] and experimentally [51,52,53]. Theoretical calculations and experimental evidence support a preferential occurrence of substitutional doping of nitrogen atoms on O sites in SnO2, leading to intragap acceptor levels due to N species [47,49,54]. These intragap states can red-shift the absorption edge of SnO2 [50], as observed in the present sample. Moreover, experimental investigations have shown evidence of oxygen vacancies or reduced SnO2 occurring along N-doping [51,52]. Interestingly, previous studies have shown that the incorporation of N atoms on the oxygen sites of SnO2 is significantly enhanced by the high temperature oxidation and the optimal temperature is about 400 °C [53]. A contribution of N-doped SnO2 to the light absorption of N,Sn-copromoted TiO2 samples showing segregated cassiterite could occur, especially for calcined samples (vide infra).
To better clarify this aspect, the light absorption features of calcined samples were further compared by means of first derivative reflectance spectra (Figure 6).
TiSnx_C samples show a red shift of ca. 0.1 eV in the main absorption edge, related to the main semiconductor band gap, with respect to the reference Ti_C, as clearly appreciable in Figure 6. In this respect, it should be noted that TiSnx_C samples exhibit increasing amounts of rutile: the lower band gap of this polymorph (3.0 eV) could partially explain the observed red shift. However, a larger shift is observed for the TiSn5_C sample, which has a lower rutile content than TiSn20_C. Moreover, a similar red shift is also observed in the case of the TiSn5_H sample (Figure S5), which contains no rutile. While rutile content can surely cause a red shift of the absorption edge, this cannot be the sole reason behind the observed shift for TiSn5_x samples, because of the opposite trends in rutile content and observed red shift as a function of Sn-content. Thus, on the grounds of Sn L2,3-edge findings, it can be proposed that the observed shift in the absorption edge of TiSn5_C and TiSn5_H can be related to Sn(II) states, also in agreement with previous reports [3] and as supported by DFT calculations of electronic structure [3].
The second component centered at ca. 2.60 eV, observed in both TiSn5_C and Ti_C samples, can be attributed to intragap states that are related to N-doping, on the grounds of previous characterization of Ti_C sample [43,44,45,55] and as supported by the comparison with Sn-doped sample without N species (Figure S5). This component appears to be slightly enhanced in the N,Sn-copromoted sample, which suggests a synergistic effect of Sn(II) species with respect to N-doping. In this respect, it has been previously reported that nitrogen incorporation is favored by the presence of TiO2 lattice defects, such as oxygen vacancies [56,57]. Vice versa, N-doping has also been reported to favor the occurrence of oxygen vacancies [58], which might, in turn, favor the formation of Sn(II) species.
It should be noted that a quantification of bulk nitrogen species is a difficult task, since the N content is at least one order of magnitude lower than the nominal content because of a loss of N species during calcination [43,44,45]. As a result, the quantification of the actual nitrogen bulk content is quite challenging, since techniques, such as XPS, provide a surface sensitive information, which is thus greatly affected by N-containing atmospheric contaminants [59].
In the case of the TiSn20_C sample, the absorption in the visible region is further promoted, but it is red shifted with respect to Ti_C and TiSn5_C. As this sample is composed of rutile TiO2 and cassiterite SnO2 (as supported by XAS and HRTEM findings), on the grounds of the SnO2_C optical properties and of literature studies of N-doped rutile [60,61], the observed light absorption of the TiSn20_C samples seems to be mainly compatible with nitrogen interstitial doping in the TiO2 structure. No evidence of light absorption by N-doped SnO2 is appreciable, since the visible light component of the TiSn20_C sample is shifted of ca. 0.3 eV with respect to the SnO2_C light absorption. The occurrence of segregated cassiterite seems to contribute to light absorption mainly in an indirect way. The markedly enhanced visible light absorption could be related to the higher defectivity that is associated with the highly dispersed SnO2 phase in the sample. Although no Sn(II) could be detected in the samples with 20% Sn/Ti ratio, a consideration should be made: XAS provides an averaged information on all the Sn atoms in the samples. The signal is not expected to drastically change if only few centers exhibit a different environment. As in TiSn20_x samples, most of tin is segregated as cassiterite; this component is mostly responsible for the observed signal at the expense of any dopant atoms within the TiO2 structure.

4. Conclusions

In this work, a combined X-ray absorption spectroscopy investigation was carried out on N,Sn-copromoted TiO2 nanoparticles at both the Ti K-edge and Sn L2,3-edges, with the aim of correlating the material structural and the optical properties. In the samples, the Sn/Ti molar content was varied in the 0–20% range and different post-treatments (calcination and low temperature hydrothermal treatment) were considered.
Irrespective of the type of post-treatment adopted, when the Sn/Ti ratio is high (20%), part of tin remains segregated as SnO2 at the surface of the nanoparticles, as shown by HRTEM and Sn L2,3-edge findings. However, part of tin enters the TiO2 structure, more so in calcined samples, inducing the formation of TiO2 in the rutile phase, as supported by HRTEM and Ti K-edge XAS evidence. Hydrothermally treated samples seem to show a lower diffusion of heteroatoms (Sn, N) within TiO2, which could be inferred by the higher anatase content, surface N species, and limited visible light absorption.
When the Sn/Ti ratio is lower (5%), the quantity of tin is not enough to induce the formation of pure rutile, also in the case of calcined samples, so TiO2 remains mainly an anatase/brookite mixture. At this lower Sn content, tin is not segregated as SnO2, but it is an effective dopant in the TiO2 structure, as shown by Sn L2,3-edge XAS; moreover, there is evidence of the formation of Sn in a partially reduced state. This is possibly related to ammonia used in synthesis and the N-doping, which might stabilize the formation of Sn(II). It is worth noting that, to the best of our knowledge, this is the first experimental observation of reduced tin states in TiO2 samples that were treated in highly oxidizing conditions and at high temperature. The reduced Sn species are responsible for a red shift of the absorption edge of samples with lower Sn content.
On the other hand, the best optical properties were found for the calcined sample with Sn/Ti ratio that was equal to 20%. It should be noted that TiO2 promoted with only Sn species has no enhanced light absorption in the visible, whereas N,Sn-copromoted, calcined TiO2 samples present an increased visible absorption with respect to N-doped TiO2, pointing towards synergistic effects between N and Sn on the optical properties of TiO2 photocatalysts. This phenomenon can be the result of the combined effect of the calcination process, which enhances the diffusion of N species within the lattice, and of the defectivity induced by tin species, including highly dispersed SnO2, which promotes the incorporation of N in the TiO2 structure.

Supplementary Materials

The following are available online at https://www.mdpi.com/2079-4991/10/6/1224/s1, Figure S1: Derivative spectra of all the samples and standards at the Ti K-edge, residuals (experimental data minus fit lines) for all the samples, Figure S2: Isolation procedure of peak B in the case of TiSn5_C sample, Figure S3: DR spectrum of a calcined Sn-doped TiO2 sample without N-doping, Figure S4: FTIR spectra of calcined and hydrothermal samples, Figure S5: First derivative of reflectance spectra of hydrothermal samples as a function of radiation energy (in eV), Table S1: Quantification of Sn(II) in TiSn5_C and TiSn5_H.

Author Contributions

Conceptualization and supervision, D.M., P.G., A.M. and A.V.; XAS data acquisition, D.M., M.F., P.G., XAS data analysis, M.F. and P.G., DRS spectra analysis, D.M., TEM analysis, G.C. and F.T. Writing-original draft preparation, D.M., M.F., P.G.; all authors discussed the data. All authors have read and agreed to the published version of the manuscript.

Funding

The ELETTRA synchrotron radiation facility is acknowledged for the provision of beamtime at the beamline XAFS for the XAS measurements (experiment 20180253). M.F. gratefully acknowledges financial support from the Italian Ministry of University and Research (MIUR) through grant “PRIN 2017, 2017KKP5ZR, MOSCATo”. A.M. and D.M. gratefully acknowledge the Università degli Studi di Milano for financial support by means of Piano di Sostegno alla ricerca–2015/2017-Linea 2, terzo rinnovo-2018.

Acknowledgments

The Authors thankfully acknowledge Luca Olivi for the kind support during the experiment at the XAFS beamline at the Elettra synchrotron radiation facility in Trieste, Italy. This work is dedicated to the memory of our friend and colleague Claudio Ferrero.

Conflicts of Interest

The authors declare no conflict of interest.

References

  1. Boppana, V.B.R.; Lobo, R.F. Photocatalytic degradation of organic molecules on mesoporous visible-light-active Sn (II)-doped titania. J. Catal. 2011, 281, 156–168. [Google Scholar] [CrossRef]
  2. Sridharan, K.; Park, T.J. Thorn-ball shaped TiO2 nanostructures: Influence of Sn2+ doping on the morphology and enhanced visible light photocatalytic activity. Appl. Catal. B Environ. 2013, 134–135, 174–184. [Google Scholar] [CrossRef]
  3. Zhuang, H.; Gu, Q.; Long, J.; Lin, H.; Lin, H.; Wang, X. Visible light-driven decomposition of gaseous benzene on robust Sn2+-doped anatase TiO2 nanoparticles. RSC Adv. 2014, 4, 34315–34324. [Google Scholar] [CrossRef]
  4. Gálvez-López, M.F.; Muñoz-Batista, M.J.; Alvarado-Beltrán, C.G.; Almaral-Sánchez, J.L.; Bachiller-Baeza, B.; Kubacka, A.; Fernández-García, M. Sn modification of TiO2 anatase and rutile type phases: 2-Propanol photo-oxidation under UV and visible light. Appl. Catal. B Environ. 2018, 228, 130–141. [Google Scholar] [CrossRef]
  5. Martinez-Oviedo, A.; Ray, S.K.; Nguyen, H.P.; Lee, S.W. Efficient photo-oxidation of NOx by Sn doped blue TiO2 nanoparticles. J. Photochem. Photobiol. A Chem. 2019, 370, 18–25. [Google Scholar] [CrossRef]
  6. Ayyakannu Sundaram, G.; Yang, M.; Nomura, K.; Maniarasu, S.; Veerappan, G.; Liu, T.; Wang, J. 119Sn Mössbauer and Ferromagnetic Studies on Hierarchical Tin- and Nitrogen-Codoped TiO2 Microspheres with Efficient Photocatalytic Performance. J. Phys. Chem. C 2017, 121, 6662–6673. [Google Scholar] [CrossRef]
  7. Tangale, N.P.; Niphadkar, P.S.; Samuel, V.; Deshpande, S.S.; Joshi, P.N.; Awate, S.V. Synthesis of Sn-containing anatase (TiO2) by sol-gel method and their performance in catalytic water splitting under visible light as a function of tin content. Mater. Lett. 2016, 171, 50–54. [Google Scholar] [CrossRef]
  8. Zhang, C.; Zhou, Y.; Bao, J.; Zhang, Y.; Fang, J.; Zhao, S.; Chen, W.; Sheng, X. Sn2+-Doped Double-Shelled TiO2 Hollow Nanospheres with Minimal Pt Content for Significantly Enhanced Solar H2 Production. ACS Sustain. Chem. Eng. 2018, 6, 7128–7137. [Google Scholar] [CrossRef]
  9. Wilke, K.; Breuer, H.D. The influence of transition metal doping on the physical and photocatalytic properties of titania. J. Photochem. Photobiol. A Chem. 1999, 121, 49–53. [Google Scholar] [CrossRef]
  10. Ghosh, M.; Pralong, V.; Wattiaux, A.; Sleight, A.W.; Subramanian, M.A. Tin(II) doped anatase (TiO2) nanoparticles: A potential route to “greener” yellow pigments. Chem. Asian J. 2009, 4, 881–885. [Google Scholar] [CrossRef]
  11. Weibel, A.; Bouchet, R.; Savin, S.L.P.; Chadwick, A.V.; Lippens, P.E.; Womes, M.; Knauth, P. Local atomic and electronic structure in nanocrystalline Sn-doped anatase TiO2. ChemPhysChem 2006, 7, 2377–2383. [Google Scholar] [CrossRef] [PubMed]
  12. Long, R.; Dai, Y.; Huang, B. Geometric and Electronic Properties of Sn-Doped TiO2 from First-Principles Calculations. J. Phys. Chem. C 2009, 113, 650–653. [Google Scholar] [CrossRef]
  13. Zatsepin, D.A.; Boukhvalov, D.W.; Kurmaev, E.Z.; Zhidkov, I.S.; Kim, S.S.; Cui, L.; Gavrilov, N.V.; Cholakh, S.O. XPS and DFT study of Sn incorporation into ZnO and TiO2 host matrices by pulsed ion implantation. Phys. Status Solid. Basic Res. 2015, 252, 1890–1896. [Google Scholar] [CrossRef] [Green Version]
  14. Shi, Z.M.; Yan, L.; Jin, L.N.; Lu, X.M.; Zhao, G. The phase transformation behaviors of Sn2+-doped Titania gels. J. Non-Cryst. Solids 2007, 353, 2171–2178. [Google Scholar] [CrossRef]
  15. Awa, K.; Akashi, R.; Akita, A.; Naya, S.I.; Kobayashi, H.; Tada, H. Highly Efficient and Selective Oxidation of Ethanol to Acetaldehyde by a Hybrid Photocatalyst Consisting of SnO2 Nanorod and Rutile TiO2 with Heteroepitaxial Junction. ChemPhysChem 2019, 20, 2155–2161. [Google Scholar] [CrossRef]
  16. Awa, K.; Naya, S.; Fujishima, M.; Tada, H. A Three-Component Plasmonic Photocatalyst Consisting of Gold Nanoparticle and TiO2–SnO2 Nanohybrid with Heteroepitaxial Junction: Hydrogen Peroxide Synthesis. J. Phys. Chem. C 2020, 124, 7797–7802. [Google Scholar] [CrossRef]
  17. Xiong, L.; Guo, Y.; Wen, J.; Liu, H.; Yang, G.; Qin, P.; Fang, G. Review on the Application of SnO2 in Perovskite Solar Cells. Adv. Funct. Mater. 2018, 28, 1–18. [Google Scholar] [CrossRef]
  18. Wang, J.; Li, H.; Meng, S.; Ye, X.; Fu, X.; Chen, S. Controlled synthesis of Sn-based oxides: Via a hydrothermal method and their visible light photocatalytic performances. RSC Adv. 2017, 7, 27024–27032. [Google Scholar] [CrossRef] [Green Version]
  19. Fan, C.-M.; Peng, Y.; Zhu, Q.; Lin, L.; Wang, R.-X.; Xu, A.-W. Synproportionation Reaction for the Fabrication of Sn2+ Self-Doped SnO2−x Nanocrystals with Tunable Band Structure and Highly Efficient Visible Light Photocatalytic Activity. J. Phys. Chem. C 2013, 117, 24157–24166. [Google Scholar] [CrossRef]
  20. Rimoldi, L.; Pargoletti, E.; Meroni, D.; Falletta, E.; Cerrato, G.; Turco, F.; Cappelletti, G. Concurrent role of metal (Sn, Zn) and N species in enhancing the photocatalytic activity of TiO2 under solar light. Catal. Today 2018, 313, 40–46. [Google Scholar] [CrossRef]
  21. Jia, J.; Yamamoto, H.; Okajima, T.; Shigesato, Y. On the Crystal Structural Control of Sputtered TiO2 Thin Films. Nanoscale Res. Lett. 2016, 11, 324. [Google Scholar] [CrossRef] [PubMed] [Green Version]
  22. Okajima, T.; Jia, J.; Shigesato, Y. Geometric structure of Sn dopants in sputtered TiO2 film revealed by X-ray absorption spectroscopy and first-principles DFT calculations. Mater. Res. Express 2018, 5, 4. [Google Scholar] [CrossRef]
  23. Lin, K.S.; Mai, Y.J.; Chiu, S.W.; Yang, J.H.; Chan, S.L.I. Synthesis and characterization of metal hydride/carbon aerogel composites for hydrogen storage. J. Nanomater. 2012, 2012, 201584. [Google Scholar] [CrossRef]
  24. Kityakarn, S.; Worayingyong, A.; Suramitr, A.; Smith, M.F. Ce-doped nanoparticles of TiO2: Rutile-to-brookite phase transition and evolution of Ce local-structure studied with XRD and XANES. Mater. Chem. Phys. 2013, 139, 543–549. [Google Scholar] [CrossRef]
  25. Masai, H.; Ina, T.; Okumura, S.; Mibu, K. Validity of Valence Estimation of Dopants in Glasses using XANES Analysis. Sci. Rep. 2018, 8, 1–7. [Google Scholar] [CrossRef] [PubMed]
  26. Liu, Z.; Handa, K.; Kaibuchi, K.; Tanaka, Y.; Kawai, J. Comparison of the Sn L edge X-ray absorption spectra and the corresponding electronic structure in Sn, SnO, and SnO2. J. Electron. Spectros. Relat. Phenom. 2004, 135, 155–158. [Google Scholar] [CrossRef]
  27. Hulme, H.; Baxter, F.; Babu, R.P.; Denecke, M.A.; Gass, M.; Steuwer, A.; Norén, K.; Carlson, S.; Preuss, M. An X-ray absorption near-edge structure (XANES) study of the Sn L3 edge in zirconium alloy oxide films formed during autoclave corrosion. Corros. Sci. 2016, 105, 202–208. [Google Scholar] [CrossRef]
  28. Rimoldi, L.; Meroni, D.; Pargoletti, E.; Biraghi, I.; Cappelletti, G.; Ardizzone, S. Role of the growth step on the structural, optical and surface features of TiO2/SnO2 composites. R. Soc. Open Sci. 2019, 6, 1–8. [Google Scholar] [CrossRef] [Green Version]
  29. Ding, J.; Huang, Z.; Zhu, J.; Kou, S.; Zhang, X.; Yang, H. Low-temperature synthesis of high-ordered anatase TiO2 nanotube array films coated with exposed {001} nanofacets. Sci. Rep. 2015, 5, 1–7. [Google Scholar] [CrossRef] [Green Version]
  30. Pan, X.; Zhang, N.; Fu, X.; Xu, Y.J. Selective oxidation of benzyl alcohol over TiO2 nanosheets with exposed {001} facets: Catalyst deactivation and regeneration. Appl. Catal. A Gen. 2013, 453, 181–187. [Google Scholar] [CrossRef]
  31. Yang, H.G.; Sun, C.H.; Qiao, S.Z.; Zou, J.; Liu, G.; Smith, S.C.; Cheng, H.M.; Lu, G.Q. Anatase TiO2 single crystals with a large percentage of reactive facets. Nature 2008, 453, 638–641. [Google Scholar] [CrossRef] [PubMed] [Green Version]
  32. Roy, N.; Sohn, Y.; Pradhan, D. Synergy of low-energy {101} and high-energy {001} TiO2 crystal facets for enhanced photocatalysis. ACS Nano 2013, 7, 2532–2540. [Google Scholar] [CrossRef] [PubMed]
  33. Hellstern, H.L.; Bremholm, M.; Mamakhel, A.; Becker, J.; Iversen, B.B. Hydrothermal Synthesis of TiO2@SnO2 Hybrid Nanoparticles in a Continuous-Flow Dual-Stage Reactor. ChemSusChem 2016, 9, 532–539. [Google Scholar] [CrossRef] [PubMed]
  34. Tian, Q.; Yan, J.; Yang, L.; Chen, J. Fabrication of three-dimensional carbon coating for SnO2/TiO2 hybrid anode material of lithium-ion batteries. Electrochim. Acta 2018, 282, 38–47. [Google Scholar] [CrossRef]
  35. Braglia, L.; Fracchia, M.; Ghigna, P.; Minguzzi, A.; Meroni, D.; Edla, R.; Vandichel, M.; Ahlberg, E.; Cerrato, G.; Torelli, P. Understanding Solid-gas Reaction Mechanisms by Operando Soft X-ray Absorption Spectroscopy at Ambient Pressure. J. Phys. Chem. C 2020. [Google Scholar] [CrossRef]
  36. Di Cicco, A.; Aquilanti, G.; Minicucci, M.; Principi, E.; Novello, N.; Cognigni, A.; Olivi, L. Novel XAFS capabilities at ELETTRA synchrotron light source. J. Phys. Conf. Ser. 2009, 190, 012043. [Google Scholar] [CrossRef]
  37. Ravel, B.; Newville, M. ATHENA, ARTEMIS, HEPHAESTUS: Data analysis for X-ray absorption spectroscopy using IFEFFIT. J. Synchrotron Radiat. 2005, 12, 537–541. [Google Scholar] [CrossRef] [Green Version]
  38. Newville, M. IFEFFIT: Interactive XAFS analysis and FEFF fitting. J. Synchrotron Radiat. 2001, 8, 322–324. [Google Scholar] [CrossRef]
  39. Soldatov, A.V.; Ivanchenko, T.S.; Della Longa, S.; Kotani, A.; Iwamoto, Y.; Bianconi, A. Crystal-structure effects in the Ce L3-edge x-ray-absorption spectrum of CeO2: Multiple-scattering resonances and many-body final states. Phys. Rev. B 1994, 50, 5074–5080. [Google Scholar] [CrossRef]
  40. Ghigna, P.; Spinolo, G.; Scavini, M.; Tamburini, U.A.; Chadwick, A.V. The atomic and electronic structure of cerium substitutional defects in Nd2-xCexCuO4+δ An XAS study. Phys. C Supercond. Appl. 1995, 253, 147–155. [Google Scholar] [CrossRef]
  41. Godinho, K.G.; Walsh, A.; Watson, G.W. Energetic and electronic structure analysis of intrinsic defects in SnO2. J. Phys. Chem. C 2009, 113, 439–448. [Google Scholar] [CrossRef]
  42. Wang, H.; Dou, K.; Teoh, W.Y.; Zhan, Y.; Hung, T.F.; Zhang, F.; Xu, J.; Zhang, R.; Rogach, A.L. Engineering of facets, band structure, and gas-sensing properties of hierarchical Sn2+-Doped SnO2 nanostructures. Adv. Funct. Mater. 2013, 23, 4847–4853. [Google Scholar]
  43. Marchiori, C.; Di Liberto, G.; Soliveri, G.; Loconte, L.; Lo Presti, L.; Meroni, D.; Ceotto, M.; Oliva, C.; Cappelli, S.; Cappelletti, G.; et al. Unraveling the cooperative mechanism of visible-light absorption in bulk N,Nb codoped TiO2 powders of nanomaterials. J. Phys. Chem. C 2014, 118, 24152–24164. [Google Scholar] [CrossRef] [Green Version]
  44. Ceotto, M.; Lo Presti, L.; Cappelletti, G.; Meroni, D.; Spadavecchia, F.; Zecca, R.; Leoni, M.; Scardi, P.; Bianchi, C.L.; Ardizzone, S. About the nitrogen location in nanocrystalline N-doped TiO2: Combined DFT and EXAFS approach. J. Phys. Chem. C 2012, 116, 1764–1771. [Google Scholar] [CrossRef]
  45. Rimoldi, L.; Ambrosi, C.; Di Liberto, G.; Lo Presti, L.; Ceotto, M.; Oliva, C.; Meroni, D.; Cappelli, S.; Cappelletti, G.; Soliveri, G.; et al. Impregnation versus Bulk Synthesis: How the Synthetic Route Affects the Photocatalytic Efficiency of Nb/Ta:N Codoped TiO2 Nanomaterials. J. Phys. Chem. C 2015, 119, 24104–24115. [Google Scholar] [CrossRef]
  46. Michalow-Mauke, K.A.; Lu, Y.; Kowalski, K.; Graule, T.; Nachtegaal, M.; Kröcher, O.; Ferri, D. Flame-Made WO3/CeOx-TiO2 Catalysts for Selective Catalytic Reduction of NOx by NH3. ACS Catal. 2015, 5, 5657–5672. [Google Scholar] [CrossRef]
  47. Albanese, E.; Di Valentin, C.; Pacchioni, G.; Sauvage, F.; Livraghi, S.; Giamello, E. Nature of Paramagnetic Species in Nitrogen-Doped SnO2: A Combined Electron Paramagnetic Resonance and Density Functional Theory Study. J. Phys. Chem. C 2015, 119, 26895–26903. [Google Scholar] [CrossRef] [Green Version]
  48. Murcia, J.J.; Hidalgo, M.C.; Navío, J.A.; Araña, J.; Doña-Rodríguez, J.M. In situ FT-IR study of the adsorption and photocatalytic oxidation of ethanol over sulfated and metallized TiO2. Appl. Catal. B Environ. 2013, 142–143, 205–213. [Google Scholar] [CrossRef]
  49. Long, R.; English, N.J. Density functional theory description of the mechanism of ferromagnetism in nitrogen-doped SnO2. Phys. Lett. Sect. A Gen. Solid State Phys. 2009, 374, 319–322. [Google Scholar] [CrossRef] [Green Version]
  50. Sun, X.; Long, R.; Cheng, X.; Zhao, X.; Dai, Y.; Huang, B. Structural, electronic, and optical properties of N-doped SnO2. J. Phys. Chem. C 2008, 112, 9861–9864. [Google Scholar] [CrossRef]
  51. Wang, L.P.; Leconte, Y.; Feng, Z.; Wei, C.; Zhao, Y.; Ma, Q.; Xu, W.; Bourrioux, S.; Azais, P.; Srinivasan, M.; et al. Novel Preparation of N-Doped SnO2 Nanoparticles via Laser-Assisted Pyrolysis: Demonstration of Exceptional Lithium Storage Properties. Adv. Mater. 2017, 29, 1603286. [Google Scholar] [CrossRef]
  52. Zhou, G.X.; Xiong, S.J.; Wu, X.L.; Liu, L.Z.; Li, T.H.; Chu, P.K. N-doped SnO2 nanocrystals with green emission dependent upon mutual effects of nitrogen dopant and oxygen vacancy. Acta Mater. 2013, 61, 7342–7347. [Google Scholar] [CrossRef]
  53. Pan, S.S.; Wang, S.; Zhang, Y.X.; Luo, Y.Y.; Kong, F.Y.; Xu, S.C.; Xu, J.M.; Li, G.H. P-type conduction in nitrogen-doped SnO2 films grown by thermal processing of tin nitride films. Appl. Phys. A Mater. Sci. Process. 2012, 109, 267–271. [Google Scholar] [CrossRef]
  54. Pan, S.S.; Li, G.H.; Wang, L.B.; Shen, Y.D.; Wang, Y.; Mei, T.; Hu, X. Atomic nitrogen doping and p-type conduction in SnO2. Appl. Phys. Lett. 2009, 95, 93–96. [Google Scholar] [CrossRef]
  55. Meroni, D.; Ardizzone, S.; Cappelletti, G.; Oliva, C.; Ceotto, M.; Poelman, D.; Poelman, H. Photocatalytic removal of ethanol and acetaldehyde by N-promoted TiO2 films: The role of the different nitrogen sources. Catal. Today 2011, 161, 169–174. [Google Scholar] [CrossRef]
  56. Graciani, J.; Álvarez, L.J.; Rodriguez, J.A.; Sanz, J.F. N doping of rutile TiO2 (110) surface. A theoretical DFT study. J. Phys. Chem. C 2008, 112, 2624–2631. [Google Scholar] [CrossRef]
  57. Nambu, A.; Graciani, J.; Rodriguez, J.A.; Wu, Q.; Fujita, E.; Sanz, J.F. N doping of TiO2(110) Photoemission and density-functional studies. J. Chem. Phys. 2006, 125, 094706. [Google Scholar] [CrossRef] [PubMed]
  58. Batzill, M.; Morales, E.H.; Diebold, U. Influence of nitrogen doping on the defect formation and surface properties of TiO2 rutile and anatase. Phys. Rev. Lett. 2006, 96, 1–4. [Google Scholar] [CrossRef]
  59. Lo Presti, L.; Ceotto, M.; Spadavecchia, F.; Cappelletti, G.; Meroni, D.; Acres, R.G.; Ardizzone, S. Role of the nitrogen source in determining structure and morphology of n-doped nanocrystalline TiO2. J. Phys. Chem. C 2014, 118, 4797–4807. [Google Scholar] [CrossRef]
  60. Livraghi, S.; Czoska, A.M.; Paganini, M.C.; Giamello, E. Preparation and spectroscopic characterization of visible light sensitized N doped TiO2 (rutile). J. Solid State Chem. 2009, 182, 160–164. [Google Scholar] [CrossRef]
  61. Diwald, O.; Thompson, T.L.; Zubkov, T.; Goralski, E.G.; Walck, S.D.; Yates, J.T. Photochemical activity of nitrogen-doped rutile TiO2(110) in visible light. J. Phys. Chem. B 2004, 108, 6004–6008. [Google Scholar] [CrossRef]
Figure 1. (a) X-ray absorption (XAS) spectra at the Ti K-edge of rutile, anatase, brookite, Ti_C, and Ti_H. The linear combination fits for Ti_C and Ti_H are shown by the correspondent black dotted lines. (b) XAS spectra at the Ti K-edge of TiSn20_C, TiSn20_H, TiSn5_C, and TiSn5_H. The black dotted lines in correspondence with TiSn20_C and TiSn5_H are the reference spectra of rutile and anatase, shown for the sake of comparison, while the black dotted lines in correspondence with TiSn5_C and TiSn20_H are the result of the linear combination fit, as listed in Table 1.
Nanomaterials 10 01224 g001
Figure 2. TEM images of (a,b) TiSn5_C and (c,d) TiSn20_C. Scale bars are 10 nm (a,c) and 5 nm (b,d). Insets: electron diffraction patterns of the detected polymorphs.
Nanomaterials 10 01224 g002
Figure 3. (a) XAS spectra at the Sn L3-edge of commercial SnO2, SnO, and SnCl2, and of SnO2_C and SnO2_H samples. (b) XAS spectra at the Sn L3-edge of TiSn20_C, TiSn20_H, TiSn5_C, and TiSn5_H.
Nanomaterials 10 01224 g003
Figure 4. XAS spectra at the Sn L2-edge of TiSn20_C, TiSn20_H, TiSn5_C, and TiSn5_H.
Nanomaterials 10 01224 g004
Figure 5. Normalized diffuse reflectance spectra (Kubelka–Munk function vs. wavelength) of pristine and Sn-promoted TiO2 samples (a) and SnO2 samples (b).
Nanomaterials 10 01224 g005
Figure 6. First derivative of reflectance spectra of calcined samples as a function of radiation energy (in eV).
Nanomaterials 10 01224 g006
Table 1. Anatase, brookite, and rutile content (expressed as percentage) and associated error (in brackets) in the Sn-promoted TiO2 samples derived from the linear combination fit of Ti K-edge XAS spectra. Phase composition (A: anatase, B: brookite, R: rutile) determined by X-ray diffraction (XRD) is also reported for the sake of comparison from Ref. [28].
SamplePhase Content From XASPhase Composition From XRD
Anatase (%)Brookite (%)Rutile (%)
Ti_C76(2)24(1)/66A–34B
Ti_H76(2)24(1)/80A–20B
TiSn20_C//100100 R
TiSn20_H55(2)/45(2)30A–70R
TiSn5_C58(3)14(7)28(6)78A–22B
TiSn5_H100//96A–4B

