Article

Highly Catalytic Electrochemical Oxidation of Carbon Monoxide on Iridium Nanotubes: Amperometric Sensing of Carbon Monoxide

Department of Chemistry and Nanoscience, Ewha Womans University, Seoul 03760, Korea
*
Author to whom correspondence should be addressed.
Nanomaterials 2020, 10(6), 1140; https://doi.org/10.3390/nano10061140
Submission received: 12 May 2020 / Revised: 5 June 2020 / Accepted: 8 June 2020 / Published: 10 June 2020
(This article belongs to the Special Issue Nanostructured Gas Sensors)

Abstract

:
The nanotubular structures of IrO2 and Ir metal were successfully synthesized without any template. First, IrO2 nanotubes were prepared by electrospinning and post-calcination, where a fine control of synthetic conditions (e.g., precursor concentration and solvent composition in electrospinning solution, temperature increasing rate for calcination) was required. Then, a further thermal treatment of IrO2 nanotubes under hydrogen gas atmosphere produced Ir metal nanotubes. The electroactivity of the resultant Ir metal nanotubes was investigated toward carbon monoxide (CO) oxidation using linear sweep voltammetry (LSV) and amperometry. The anodic current response of Ir metal nanotubes was linearly proportional to CO concentration change, with a high sensitivity and a short response time. The amperometric sensitivity of Ir metal nanotubes for CO sensing was greater than a nanofibrous counterpart (i.e., Ir metal nanofibers) and commercial Pt (20 wt% Pt loading on carbon). Density functional theory calculations support stronger CO adsorption on Ir(111) than Pt(111). This study demonstrates that metallic Ir in a nanotubular structure is a good electrode material for the amperometric sensing of CO.

Graphical Abstract

1. Introduction

The production of toxic gases, such as sulfur oxides, nitrogen oxides, hydrocarbons, and carbon monoxide (CO) has risen rapidly in the last few decades. Among them, CO is a colorless and hazardous gas produced as a by-product of fuel combustion, affecting adverse effects on human health as well as the ecosystem [1]. There have been enormous research activities in detection of these harmful gases, which are mainly based on electrochemical (e.g., amperometry and potentiometry) and optical methods (e.g., colorimetry, infrared spectroscopy) [2]. Electrochemical gas sensors have several advantages, including low detection limit, low power consumption, high stability and selectivity [3]. Amperometric gas sensors generally employ a variety of electrode materials catalyzing the electrochemical reactions of target analytes on the electrode surface. In fact, the amperometric sensing of CO requires electrode materials, which facilitate the oxidation of CO and are also highly resistive to the poisoning. In these reasons, various materials (Au [4,5,6], Pt-Sn [7], multi-wall carbon nanotubes [8], Pt covered with Nafion [9], etc. [10,11,12]) have been investigated for the anodic conversion of CO to carbon dioxide (CO2), in some cases with water assistance. The mechanism for the CO oxidation in the aqueous acidic condition is shown as follows:
CO + H2O → CO2 + 2H+ + 2e
Elongated nanostructures, including nanofibers, nanorods, nanotubes, and nanobelts, have attracted attention due to their versatile optical, electrical, and mechanical properties [13,14]. Large surface-to-volume ratios and great resistance to agglomeration of these longish nanostructures play important roles in diverse applications. One of the strategies to improve the catalytic efficiencies of a certain material is to enlarge the real surface areas, and thus more active sites can be utilized. In this respect, tubular structures, rather than fibers, are more attractive for the catalytic application [15,16]. Up to date, iridium dioxide (IrO2) nanotubes of hollow morphology have been synthesized with diverse methods: e.g., chemical bath deposition using anodic aluminum oxide template [17], electrodeposition in a polycarbonate template [18], metal-organic chemical vapor deposition [19], etc.
In this study, we report the synthesis of IrO2 and Ir metal nanotubes without using any templates. IrO2 nanotubes are synthesized with electrospinning and subsequent calcination. Thermal annealing of the prepared IrO2 nanotubes under H2 atmosphere produces Ir metal nanotubes. The resultant Ir metal and IrO2 nanotubes are applied for the electrochemical oxidation of CO. The electroactivities of Ir metal or oxide have been previously investigated only for oxygen evolution reaction (OER) [20,21], hydrogen evolution reaction (HER) [22], L-ascorbic acid oxidation [23], but not for CO oxidation. For a clearer understanding of the electrocatalytic CO oxidation at Ir, CO adsorption energy on Ir(111) is also studied theoretically, using density functional theory (DFT) calculation and compared with that on Pt(111).

2. Materials and Methods

2.1. Materials

Iridium chloride hydrate (IrCl3·xH2O), poly(vinylpyrrolidone) (PVP, MW ≈ 1,300,000), ethanol (99.9%), N,N-dimethylformamide (DMF, anhydrous, 99.8%), sulfuric acid (H2SO4, 95.0–98.0%) and sodium chloride (NaCl) were all purchased from Sigma-Aldrich (St. Louis, MO, United States). Commercial Pt (cPt, 20 wt% metal loading on Vulcan XC-72) was obtained from Fuel Cell Store (College Station, TX, United States). CO, argon (Ar), helium (He), oxygen (O2) and hydrogen (H2) gases were obtained from Dong-A Gas Co. (Seoul, Korea). All of the solutions were prepared with deionized water (resistivity ≥ 18 MΩ·cm).

2.2. Synthesis of Ir Metal Nanotubes

IrO2 nanotubes were synthesized by electrospinning and calcination techniques. Notably, 0.21 g of IrCl3·xH2O was dissolved in 4.5 mL of a mixture of DMF and ethanol (v/v = 3:7) and sonicated for 30 min, then stirred and stabilized overnight. Moreover, 0.3909 g of PVP was added to the solution containing IrCl3 and this solution was stirred for 20–24 h to obtain homogeneously mixed solution. Then, the resultant solution was transferred to a syringe with a steel needle (21 GA) and emitted through the needle with a flow rate of 10 μL min−1. Furthermore, 13 kV of voltage was applied between the syringe needle and an aluminum plate that are separated by 15 cm using an electrospinning system (NanoNC ESR200R2). The collected electrospun nanofibers were detached from the aluminum plate and dried in a vacuum oven at room temperature to remove the remaining solvents. These as-spun nanofibers were placed in the middle of a furnace. Then, the temperature of the furnace was increased at a rate of 1 °C min−1 up to 500 °C, and maintained for 1 h with a flowing of O2 and He gases at 10 and 80 sccm, respectively. IrO2 nanotubes were eventually obtained after the sufficient cooling at room temperature. These IrO2 nanotubes were further heat-treated for the reduction to Ir metal nanofibers, under a continuous flowing of H2 and Ar gases at 10 and 80 sccm, respectively. For this process, the temperature of a furnace was raised at a rate of 7.5 °C min−1 to reach 250 °C, and maintained for 2 h.

2.3. Physical Characterization

The morphologies and structures of IrO2 and Ir metal nanotubes were characterized by field-emission scanning electron microscopy (FE-SEM, JEOL JSM-6700F, Tokyo, Japan), high-resolution transmission electron microscopy (HRTEM; JEOL JEM-2100F, Tokyo, Japan), and high-resolution X-ray diffraction (XRD; Rigaku D/Max-2000/PC X-ray diffractometer using Cu Kα radiation, Tokyo, Japan). A thermal analysis of as-spun nanofibers was performed by thermogravimetric analysis and differential scanning calorimetry (TGA-DSC, Q600, TA Instruments, New Castle, DE, United States) to observe the combustion process of PVP. For this measurement, as-spun nanofibers were heated in air from room temperature to 700 °C, at a rate of 5 °C min−1.

2.4. Electrode Preparation and Electrochemical Measurements

Firstly, synthesized IrO2 and Ir metal nanotubes were dispersed in deionized water, with a concentration of 2 mg mL−1. A glassy carbon (GC, Austin, TX, United States) electrode (diameter, 3 mm) was loaded with 6 μL of each dispersed solution five times (i.e., 60-μg loading of each material), along with drying in a 60 °C oven between loadings. Then, 10 μL of 0.05 wt% Nafion (diluted in ethanol) was dropped onto the sample loaded GC electrode and dried in air for 30 min. For comparison, 20 μg of cPt was loaded onto the GC electrode with the same procedure.
Electrochemical measurements toward CO oxidation were performed using an electrochemical analyzer (CHI 900B, CH Instrument, Inc., Austin, TX, United States) in 0.5 M H2SO4, containing 0.03 M NaCl, an optimized condition for CO oxidation [24]. The CO standard solution was prepared by bubbling a deaerated solution of 0.5 M H2SO4 and 0.03 M NaCl with CO gas for 20 min. A Pt wire and saturated calomel electrode (SCE) were used as the counter and reference electrodes, respectively. Linear sweep voltammetry (LSV) was carried out at various concentrations of CO, with a scan rate of 10 mV·s−1. Amperometric response of Ir metal nanotubes to CO concentration changes was measured at 0.7 V (vs. SCE). To prevent CO oxidation through a reaction with O2 in the air, a gas-tight cell system was used, and background solutions were deaerated by Ar gas purging. Electrochemical impedance spectroscopy (EIS) was conducted with the CHI 920C electrochemical workstation in 10 mM K3Fe(CN)6 solution, containing 0.1 M KCl. Cyclic voltammetry (CV) measurements, to investigate the electrochemical surface area (ECSA) of the materials, were conducted in 0.5 M H2SO4 aqueous solution.

2.5. DFT Calculation

DFT calculations were carried out with the generalized gradient approximation (GGA) for the exchange and correlated functional. Vienna ab initio simulation package (VASP), based on the density functional theory (DFT), was used to obtain CO adsorption energy on Ir(111) and Pt(111) by solving the Kohn−Sham equation of a many-body system with an iterative approach. A plane-wave basis set with an adequate cutoff energy of 300 eV and accurate precision was employed. A Monkhorst-Pack mesh of 6 × 6 × 6 k-points was used.
In our calculations, the bottom two layers of atoms of the metals were held fixed in their calculated bulk positions, while the upper layers of surface atoms was allowed to move. CO adsorption energy was calculated as below.
Eads(CO) = Esurface-CO,Oa − (Esurface-Oa + ECO)
where Esurface-CO,Oa, Esurface-Oa, and ECO are the total energies of surface adsorbed with both CO and Oa (adsorbed oxygen atom), surface adsorbed with Oa, and CO, respectively.

3. Results and Discussion

3.1. Synthetic Condition and Physical Characterization of IrO2 and Ir Metal Nanotubes

Scheme S1 describes the overall synthetic steps for the nanotubes. Firstly, a homogenously mixed precursor/PVP solution was electrospun to produce nanofibers with a compact body and smooth surface. Obtained as-spun nanofibers were calcined in an atmosphere of O2 and He. During this calcination process at 500 °C, IrCl3·xH2O was thermally decomposed to IrO2, and PVP playing as framework was removed via the combustion to CO2 and H2O. Then, the resultant IrO2 nanostructures were reduced to form Ir metal counterparts by means of the following reduction process in H2 and Ar atmosphere.
The morphologies of IrO2 and Ir metal nanomaterials, before and after the reduction step, respectively, were confirmed by FE-SEM images (Figure 1). The diameters of IrO2 and Ir metal nanotubes were estimated to be 200 (±31) nm and 189 (±17) nm, respectively. This implies that the thermal reduction process in the H2 atmosphere causes a decrease in diameter. In contrast to the fibrous structure of as-spun IrCl3/PVP, both IrO2 and Ir metal have tubular morphologies consisting of thorn-sprout outer cylindrical wall and hollow inner space. Tubular morphologies can be built when metal oxides construct rigid walls on the surface of as-spun nanofibers before the complete degradation of PVP [25]. As PVP decomposes into gaseous combustion products (as CO2 and H2O), the removal of PVP forces metal precursors to move toward the surface. Thus, the degradation of PVP and thermal decomposition of metal precursors are required to occur at properly different temperatures. The precursor concentration and solvent composition in the electrospinning solution also affect the morphology of the spun nanostructures [26,27].
We synthesized elongated IrO2 nanostructures under various conditions, of which SEM images were compared in Figure S1. In fact, the IrO2 nanotubes shown in Figure 1A,B were synthesized using an electrospinning solution of 0.21 g metal precursor dissolved in a mixed solvent (ethanol/DMF = 70:30 in %v/v), and the applied temperature inclining rate for calcination step was 1 °C·min−1. Under the same synthetic condition, except the solvent composition with a lower ethanol content in the electrospinning solution (ethanol/DMF = 50:50 in % v/v), the prepared IrO2 appeared to be fibers with a smaller average diameter (Figure S1A) compared to the tubular ones (Figure 1). On the other hand, lowering the amount of metal precursor (0.18 g) in the electrospinning solution also resulted in the fiber form of IrO2 as seen in Figure S1B. While holding the other conditions constant, a faster temperature rising rate (3 °C·min−1) produced IrO2 with fiber morphology as well (Figure S1C). This clearly indicates that the preparation of IrO2 nanotubes requires the fine control of the synthetic condition.
For further investigation of the nanotube formation mechanism, TGA-DSC measurements of as-spun nanofibers were conducted (Figure 2). A slight weight decrease around 100 °C can be ascribed to evaporation of solvent and adsorbed water. The following rapid weight loss occurred with a sharp exothermic peak at around 290 °C. The abrupt mass loss between 280 °C and 300 °C is due to the decomposition of IrCl3 and PVP; and the weight loss accompanying a sharp exothermic peak at 290 °C is attributed to the oxidation of the main backbone of PVP [25,28]. In fact, the DSC-TGA for pure PVP nanofibers prepared without any metal precursor exhibited a distinct exothermic peak at a higher temperature, ca. 460 °C (data not shown). It has been reported that the presence of metal precursor facilitates the PVP combustion in air [25]. Likewise, the removal of PVP from as-spun IrCl3/PVP nanofibers could occur at a lower temperature (ca. 290 °C) than pure PVP with the aid of co-present IrCl3. In other words, IrCl3 and PVP decompose at quite similar temperatures. Thus, a slow temperature rising rate should be employed for the calcination process, to securely attain a critical condition for nanotube production: metal precursor decomposition, prior to completing PVP removal.
To investigate the crystal phases, IrO2 and Ir metal nanotubes were analyzed with XRD. The XRD spectrum of IrO2 showed three major peaks at 27.8°, 34.6° and 53.7°, corresponding to (110), (101) and (211) planes of crystalline IrO2 rutile structure, as shown in Figure 3A. After the reduction process in H2 atmosphere, the peaks of IrO2 rutile structures are not shown. Figure 3B indicates three distinct peaks at 40.7°, 47.4° and 69.2°, being assigned to (111), (200) and (220) planes of the Ir metal fcc crystal structure. This clearly indicates that IrO2 has been completely reduced to Ir metal through the reduction process.
The lattice parameter (a) for the cubic structure of Ir metal was calculated to be 3.83 Å from the obtained XRD (111) peak, based on Bragg’s law. This will be compared with a spacing of a stabilized Ir metal structure in DFT calculation (vide supra). Averaged crystallite sizes of IrO2 and Ir metal nanotubes were calculated to be ca. 8.58 and 14.91 nm, respectively, from the major diffraction peaks using the Scherrer formula. The crystallite size of Ir metal nanotubes formed after the thermal reduction was increased compared to IrO2 nanotubes, while both the IrO2 and Ir metal nanotubes had highly crystalline phases, verified with the sharp XRD peaks.
The tubular morphologies of IrO2 and Ir metal nanotubes were confirmed with TEM, as shown in Figure 4. Averaged wall thicknesses of IrO2 and Ir metal nanotubes were measured to be 47.1 (±4.7) nm and 49.8 (±4.2) nm, respectively. The crystalline structure of IrO2 and Ir metal nanotubes were identified from high-resolution TEM (HRTEM) images. The selected area electron diffraction (SAED) pattern and HRTEM image of IrO2 nanotubes clearly indicate the presence of (110) and (101) planes of rutile IrO2 phase (Figure 4C). On the other hand, (111) and (200) planes of Ir metal fcc phase were observed in the HRTEM image and SAED pattern of Ir metal nanotubes (Figure 4D). As confirmed by XRD analysis, HRTEM data also support that the nanotubes composed of single phase of IrO2 are completely reduced to metallic Ir via a thermal reduction process in the H2 atmosphere.

3.2. Electrochemical Characterization of the Nanotubes for CO Oxidation

To evaluate the electrochemical properties of the IrO2 and Ir metal nanotubes toward CO oxidation, LSVs were performed. To prevent the oxidation of CO via a reaction with O2 in the air, a gas-tight cell system was used.
As seen in Figure 5A, the oxidation of CO hardly occurred at IrO2 nanotubes within the tested potential range (0.0 to 1.0 V vs. SCE). In contrast, CO oxidation peaks were clearly observed at Ir metal nanotubes, while the peak currents were enhanced with increasing CO concentration (Figure 5B). This implies that electrochemical CO oxidation is more favorable at Ir metal nanotubes than at IrO2 nanotubes. Note that cathodic currents were also observed at Ir metal nanotubes for a potential region of 0.0 to 0.4 V (vs. SCE), and these currents increased with CO concentration increase. In fact, cathodic current measured at 0.1 V increased in a linear proportion to CO concentration (Figure S2). This suggests that CO can be reduced at Ir metal nanotubes with a rather low applied potential.
Figure S3 compares the CVs and Nyquist plots of IrO2 and Ir metal nanotubes in 10 mM K3Fe(CN)6 containing 0.1 M KCl. Both IrO2 and Ir metal nanotubes showed well-behaved diffusion-controlled CV curves. The charge transfer resistance (Rct) values of IrO2 nanotubes and Ir metal nanotubes determined from EIS were 83.7 Ω and 97.8 Ω, respectively. Conclusively, both IrO2 and Ir metal nanotubes possess low charge transfer resistances.

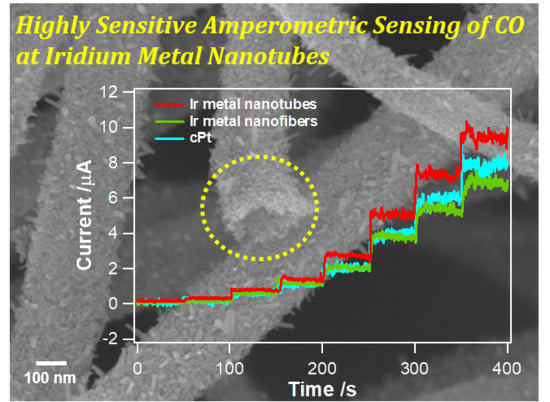
3.3. Amperometric Responses to CO at Ir Metal Nanotubes

According to the LSV results shown in Figure 5B, 0.7 V was chosen as an applied potential to monitor the amperometric response to the oxidation of CO. Figure 6A represents the result of the current responding to successive CO injections. Figure 6B illustrates the calibration curves obtained from dynamic current responses (like Figure 6A) of five different electrodes. Small error bars indicate a good reproducibility. Current increased stepwise in a linear proportion to CO concentration (0.028 to 2.24 ppm) in an Ar-saturated aqueous solution, and the sensitivity of Ir metal nanotubes toward CO was 4.1259 μA ppm−1 (n = 5) with a good linearity of R2 > 0.999. In addition, the current of Ir metal nanotubes responded almost immediately to CO injection. The response times (t95%, time to reach 95% of the steady-state value) were estimated by analyzing amperometric response curves, which were 2.9 ± 0.9 s (n = 5). The high sensitivity and linearity of Ir metal nanotubes could be ascribed to both the inherent property of Ir metal (discussed minutely in the DFT section) and the tubular morphology. The large electrochemical active surface area (ECSA) from the nanotube morphology contributes to the high sensitivity towards CO. In Figure 6C, amperometric current responses toward CO were monitored three times for the same concentration range, to test the repeatability and resistivity to the surface contamination. The sensitivities toward CO were nearly unchanged for the repeated measurements (Figure 6D). It indicates that Ir metal nanotubes were stable enough without surface fouling during CO oxidation.
Amperometric response and sensitivity for CO oxidation were also measured at Ir metal nanofibers and cPt, and compared with those obtained at Ir metal nanotubes (Figure 7). Ir metal nanofibers used for this experiment were the ones formed by the reduction of IrO2 nanofibers synthesized with a different solvent composition (ethanol/DMF = 50:50 in % v/v), shown in Figure S1A. As clearly seen in Figure 7B, the sensitivity of Ir metal nanotubes for amperometric CO sensing was 1.34-fold greater than that of Ir metal nanofibers, having the same composition but a tubular structure. Figure S4 represents CV curves of Ir metal nanotubes and Ir metal nanofibers obtained in 0.5 M H2SO4. The electrochemical surface area (ECSA) of each material was estimated using the charge amount for the hydrogen adsorption region in CV curves and the specific charge value for Ir metal (218 μC·cm−2) [29]. The ECSAs of Ir metal nanotubes and nanofibers were determined to be 8.29 cm2 and 6.35 cm2, respectively. Ir metal nanotubes had ca. 1.31-fold larger ECSA than Ir metal nanofibers. This clearly suggests that a tubular structure providing a larger surface area is advantageous over a fibrous one for catalyzing CO oxidation. Ir metal nanotubes also exhibited ~20% higher sensitivity for CO oxidation than cPt, a most commonly used heterogenous electrocatalyst, supporting its high electroactivity. Note that an applied potential of 0.7 V was also sufficient for CO oxidation at cPt, which was confirmed with LSV (Figure S5).
A continuous amperometric measurement of CO was carried out with Ir metal nanotubes at 0.7 V (vs. SCE) in 0.5 M H2SO4 containing 0.03 M NaCl aqueous solution, being purged with CO gas (Figure S6). Ir metal nanotubes maintained 97.6 % of the initial CO oxidation current after a 5000-s continuous measurement, indicating a reasonable stability (Figure S6).
The amperometric CO sensing performance of Ir metal nanotubes was compared with the previously reported materials in Table S1. Compared to other reported catalysts, Ir metal nanotubes were found to possess much higher sensitivity (normalized to geometric surface area) and lower detection limit, being advantageous particularly in the measurements of relatively low CO levels. Therefore, these materials have potential applications for monitoring air contamination by CO generated from the incomplete combustion of carbon-based fuels with high sensitivity and low detection limit.

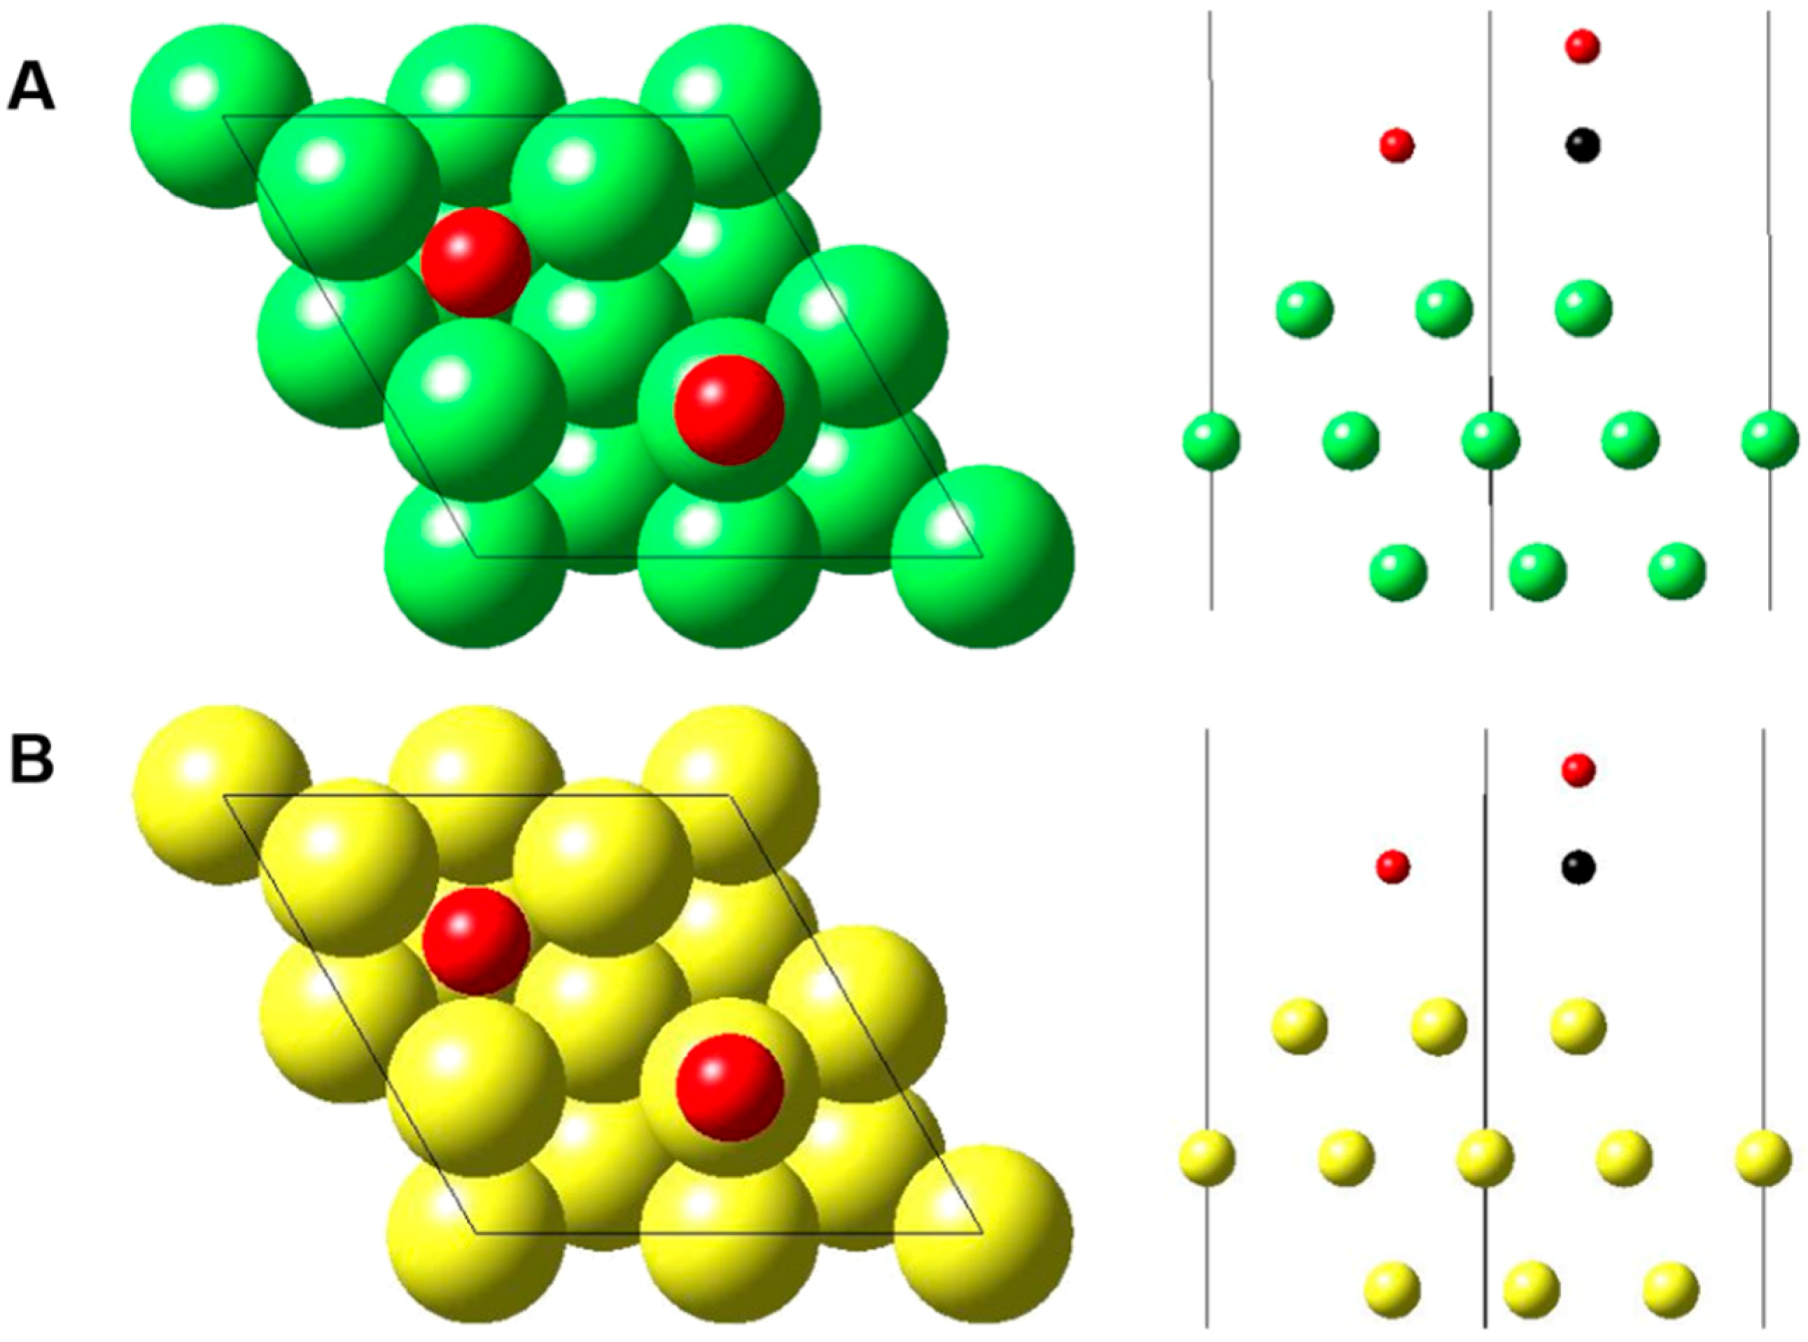
3.4. DFT Calculations for the CO Adsorption Energy

The interaction between reactants and catalyst surfaces is an important step in most heterogeneous catalytic reactions, such as CO oxidation and hydrogenation [30]. CO adsorption energy on Ir(111) was calculated by means of DFT and compared with that on Pt(111), which has been known as an excellent CO oxidation catalyst [31,32]. Before introducing CO and Oa, the structural optimizations for Pt(111) and Ir(111) were carried out. With the optimized metal structures, the lattice parameters were obtained to be 3.87 Å and 3.96 Å for Ir(111) and Pt(111), respectively. The calculated Ir metal lattice parameter, 3.87 Å, was very similar to the value (3.83 Å) estimated from XRD results, as shown in Figure 3B, indicating the reliability of our calculation.
A previous study suggested that CO preferentially adsorbs on the atop sites of Pt and Ir [30,33,34]. Adsorbed oxygen atom (denoted as Oa) was introduced with CO concurrently at the surface for DFT calculation [34]. The adsorption of oxygen is necessary to oxidize CO to CO2, and Oa could be from metal surface native oxide or any oxygen containing species near the surface. In our calculation, a CO molecule was also found to adsorb on atop sites of both Ir and Pt atoms through the carbon atom, while Oa sat on the fcc hollow site of three atoms. The calculated structures are shown in Figure 8.
The calculated adsorption energies of CO on Ir(111) and Pt(111) surfaces were 2.02 and 1.54 eV, respectively, demonstrating a stronger CO adsorption on Ir(111) than on Pt(111). Thus, the observed greater CO sensitivity of Ir metal nanotubes could be attributed to a facile CO adsorption on the Ir metal surface. However, the nanofibers of Ir metal showed a similar/slightly lower CO sensitivity compared with cPt. This implies that metallic Ir has an inherent good electroactivity for CO electrochemical oxidation, but morphology control is also another important factor for efficient application.

4. Conclusions

IrO2 nanotubes were fabricated by electrospinning and subsequent calcination in the O2 atmosphere. The production of nanotubular morphology of IrO2 necessitates the optimization of electrospinning solution composition (e.g., concentration and solvent composition) and temperature rising rate for the calcination step. The prepared IrO2 nanotubes were further reduced to Ir metal nanotubes under the thermal reduction process in H2 atmosphere. The resultant Ir metal nanotubes showed an excellent electroactivity for electrochemical CO oxidation; and the dynamic current response at a constant applied potential of 0.7 V vs. SCE increased in a linear proportion to CO concentration change, with a reasonable short response time. The CO sensitivity of nanotubular Ir metal was ca. 35% higher than a nanofibrous counterpart (i.e., Ir metal nanofibers) and even better than commercial Pt (20 wt% Pt loading on carbon). DFT calculation showed that Ir(111) has higher adsorption energy for CO than Pt(111). Conclusively, the enlarged surface area of a tubular morphology and the inherent property of metallic Ir for facile CO adsorption synergistically present Ir metal nanotubes as a good electrode material for amperometric CO sensing.

Supplementary Materials

The following are available online at https://www.mdpi.com/2079-4991/10/6/1140/s1, Scheme S1: synthetic scheme, Figure S1: SEM images, Figure S2: Dynamic current response for CO reduction, Figure S3: CV and EIS data obtained in 10 mM K3Fe(CN)6 containing 0.1 M KCl, Figure S4: CV in 0.5 M H2SO4, Figure S5: LSV results of cPt for CO oxidation, Figure S6: Chronoamperometric response for 5 000 s, Table S1: Comparison table.

Author Contributions

Conceptualization, Y.L.; Methodology, A.Y.; Investigation, A.Y. and T.K.; Data Curation, A.Y. and T.K.; Theoretical Calculation, A.Y.; Writing—Original Draft Preparation, A.Y.; Writing—Review and Editing, Y.L. and C.L.; Supervision, Y.L. and C.L.; Project Administration, Y.L.; Funding Acquisition, Y.L. and C.L. All authors have read and agreed to the published version of the manuscript.

Funding

This research was supported by the National Research Foundation of Korea (NRF) grant, funded by the Ministry of Science, ICT and Future Planning (NRF-2020R1A2B5B01001984 and NRF-2019R1F1A1059969) and by the Basic Science Research Program through the National Research Foundation of Korea (NRF) funded by the Ministry of Education (NRF-2018R1A6A1A03025340).

Conflicts of Interest

The authors declare no conflict of interest.

References

  1. Jin, Y.; Guo, L.; Veiga, M.C.; Kennes, C. Optimization of the treatment of carbon monoxide-polluted air in biofilters. Chemosphere 2009, 74, 332–337. [Google Scholar] [CrossRef] [PubMed] [Green Version]
  2. Yunusa, Z.; Hamidon, M.N.; Kaiser, A.; Awang, Z. Gas sensors: A review. Sens. Transducers J. 2014, 168, 61–75. [Google Scholar]
  3. Van der Wal, P.D.; de Rooij, N.F.; Koudelka-Hep, M. Extremely stable nafion based carbon monoxide sensor. Sens. Actuators B 1996, 35, 119–123. [Google Scholar] [CrossRef]
  4. Chen, C.; He, J.; Xu, D.; Tan, X.; Zhou, X.; Wang, X. Study of nano-Au-assembled amperometric CO gas sensor. Sens. Actuators B 2005, 107, 866–871. [Google Scholar] [CrossRef]
  5. Rodriguez, P.; Koper, M.T.M. Electrocatalysis on gold. Phys. Chem. Chem. Phys. 2014, 16, 13583–13594. [Google Scholar] [CrossRef] [PubMed]
  6. Hayden, B.E.; Pletcher, D.; Suchsland, J.-P. Enhanced activity for electrocatalytic oxidation of carbon monoxide on titania-supported gold nanoparticles. Angew. Chem. Int. Ed. 2007, 46, 3530–3532. [Google Scholar] [CrossRef] [PubMed]
  7. Wang, K.; Gasteiger, H.A.; Markovic, N.M.; Ross, P.N. On the reaction pathway for methanol and carbon monoxide electrooxidation on Pt-Sn alloy versus Pt-Ru alloy surfaces. Electrochim. Acta 1996, 41, 2587–2593. [Google Scholar] [CrossRef]
  8. Santhosh, P.; Manesh, K.M.; Gopalan, A.; Lee, K.-P. Novel amperometric carbon monoxide sensor based on multi-wall carbon nanotubes grafted with polydiphenylamine—Fabrication and performance. Sens. Actuators B 2007, 125, 92–99. [Google Scholar] [CrossRef]
  9. Yasuda, A.; Shimidzu, T. Electrochemical carbon monoxide sensor with a Nafion® film. React. Funct. Polym. 1999, 41, 235–243. [Google Scholar] [CrossRef]
  10. Li, X.; Xuan, T.; Yin, G.; Gao, Z.; Zhao, K.; Yan, P.; He, D. Highly sensitive amperometric CO sensor using nanocomposite C-loaded PdCl2–CuCl2 as sensing electrode materials. J. Alloys Compd. 2015, 645, 553–558. [Google Scholar] [CrossRef]
  11. Tsceng, K.-I.; Yang, M.-C. Platinum electrodes modified by tin for electrochemical CO sensors. J. Electrochem. Soc. 2003, 150, H156–H160. [Google Scholar] [CrossRef] [Green Version]
  12. Guan, Y.; Liu, F.; Wang, B.; Yang, X.; Liang, X.; Suo, H.; Sun, P.; Sun, Y.; Ma, J.; Zheng, J. Highly sensitive amperometric Nafion-based CO sensor using Pt/C electrodes with different kinds of carbon materials. Sens. Actuators B 2017, 239, 696–703. [Google Scholar] [CrossRef]
  13. Xia, Y.; Yang, P.; Sun, Y.; Wu, Y.; Mayers, B.; Gates, B.; Yin, Y.; Kim, F.; Yan, H. One-dimensional nanostructures: Synthesis, characterization, and applications. Adv. Mater. 2003, 15, 353–389. [Google Scholar] [CrossRef]
  14. Liang, H.-W.; Liu, S.; Yu, S.-H. Controlled synthesis of one-dimensional inorganic nanostructures using pre-existing one-dimensional nanostructures as templates. Adv. Mater. 2010, 22, 3925–3937. [Google Scholar] [CrossRef] [PubMed]
  15. Chu, Z.; Cheng, H.; Xie, W.; Sun, L. Effects of diameter and hollow structure on the microwave absorption properties of short carbon fibers. Ceram. Int. 2012, 38, 4867–4873. [Google Scholar] [CrossRef]
  16. Homaeigohar, S.; Davoudpour, Y.; Habibi, Y.; Elbahri, M. The electrospun ceramic hollow nanofibers. Nanomaterials 2017, 7, 383. [Google Scholar] [CrossRef] [PubMed] [Green Version]
  17. Chen, P.-C.; Chen, Y.-C.; Huang, C.-N. Free-standing iridium oxide nanotube array for neural interface electrode applications. Mater. Lett. 2018, 221, 293–295. [Google Scholar] [CrossRef]
  18. Mafakheri, E.; Salimi, A.; Hallaj, R.; Ramazani, A.; Kashi, M.A. Synthesis of iridium oxide nanotubes by electrodeposition into polycarbonate template: Fabrication of chromium(III) and arsenic(III) electrochemical sensor. Electroanalysis 2011, 23, 2429–2437. [Google Scholar] [CrossRef]
  19. Chen, R.-S.; Huang, Y.-S.; Tsai, D.-S.; Chattopadhyay, S.; Wu, C.-T.; Lan, Z.-H.; Chen, K.-H. Growth of well aligned IrO2 nanotubes on LiTaO3(012) substrate. Chem. Mater. 2004, 16, 2457–2462. [Google Scholar] [CrossRef]
  20. Geiger, S.; Kasian, O.; Shrestha, B.R.; Mingers, A.M.; Mayrhofer, K.J.J.; Cherevko, S. Activity and stability of electrochemically and thermally treated iridium for the oxygen evolution reaction. J. Electrochem. Soc. 2016, 163, F3132–F3138. [Google Scholar] [CrossRef] [Green Version]
  21. Antolini, E. Iridium as catalyst and cocatalyst for oxygen evolution/reduction in acidic polymer electrolyte membrane electrolyzers and fuel cells. ACS Catal. 2014, 4, 1426–1440. [Google Scholar] [CrossRef]
  22. Kim, S.-J.; Jung, H.; Lee, C.; Kim, M.H.; Lee, Y. Comparative study on hydrogen evolution reaction activity of electrospun nanofibers with diverse metallic Ir and IrO2 composition ratios. ACS Sustain. Chem. Eng. 2019, 7, 8613–8620. [Google Scholar] [CrossRef]
  23. Kim, S.-J.; Kim, Y.L.; Yu, A.; Lee, J.; Lee, S.C.; Lee, C.; Kim, M.H.; Lee, Y. Electrospun iridium oxide nanofibers for direct selective electrochemical detection of ascorbic acid. Sens. Actuators B 2014, 196, 480–488. [Google Scholar] [CrossRef]
  24. Lee, Y.; Kim, J. Simultaneous electrochemical detection of nitric oxide and carbon monoxide generated from mouse kidney organ tissues. Anal. Chem. 2007, 79, 7669–7675. [Google Scholar] [CrossRef] [PubMed]
  25. Zhang, G.; Wang, Y.; Wang, X.; Chen, Y.; Zhou, Y.; Tang, Y.; Lu, L.; Bao, J.; Lu, T. Preparation of Pd–Au/C catalysts with different alloying degree and their electrocatalytic performance for formic acid oxidation. Appl. Catal. B 2011, 102, 614–619. [Google Scholar] [CrossRef]
  26. Moon, S.; Cho, Y.-B.; Yu, A.; Kim, M.H.; Lee, C.; Lee, Y. Single-step electrospun Ir/IrO2 nanofibrous structures decorated with Au nanoparticles for highly catalytic oxygen evolution reaction. ACS Appl. Mater. Interfaces 2019, 11, 1979–1987. [Google Scholar] [CrossRef]
  27. Li, L.; Peng, S.; Cheah, Y.; Teh, P.; Wang, J.; Wee, G.; Ko, Y.; Wong, C.; Srinivasan, M. Electrospun porous NiCo2O4 nanotubes as advanced electrodes for electrochemical capacitors. Chem. Eur. J. 2013, 19, 5892–5898. [Google Scholar] [CrossRef] [PubMed]
  28. Kim, S.Y.; Yu, A.; Lee, Y.; Kim, H.Y.; Kim, Y.J.; Lee, N.-S.; Lee, C.; Lee, Y.; Kim, M.H. Single phase of spinel Co2RhO4 nanotubes with remarkably enhanced catalytic performance for the oxygen evolution reaction. Nanoscale 2019, 11, 9287–9295. [Google Scholar] [CrossRef]
  29. Łukaszewski, M.; Soszko, M.; Czerwiński, A. Electrochemical methods of real surface area determination of noble metal electrodes—An overview. Int. J. Electrochem. Sci. 2016, 11, 4442–4469. [Google Scholar] [CrossRef]
  30. Orita, H.; Itoh, N.; Inada, Y. All electron scalar relativistic calculations on adsorption of CO on Pt(111) with full-geometry optimization: A correct estimation for CO site-preference. Chem. Phys. Lett. 2004, 384, 271–276. [Google Scholar] [CrossRef]
  31. Allian, A.D.; Takanabe, K.; Fujdala, K.L.; Hao, X.; Truex, T.J.; Cai, J.; Buda, C.; Neurock, M.; Iglesia, E. Chemisorption of CO and mechanism of CO oxidation on supported platinum nanoclusters. J. Am. Chem. Soc. 2011, 133, 4498–4517. [Google Scholar] [CrossRef] [PubMed]
  32. McPherson, I.J.; Ash, P.A.; Jones, L.; Varambhia, A.; Jacobs, R.M.J.; Vincent, K.A. Electrochemical CO oxidation at platinum on carbon studied through analysis of anomalous in situ IR spectra. J. Phys. Chem. C 2017, 121, 17176–17187. [Google Scholar] [CrossRef] [PubMed] [Green Version]
  33. Zou, S.; Gómez, R.; Weaver, M.J. Nitric oxide and carbon monoxide adsorption on polycrystalline iridium electrodes:  A combined raman and infrared spectroscopic study. Langmuir 1997, 13, 6713–6721. [Google Scholar] [CrossRef]
  34. Zhang, C.J.; Baxter, R.J.; Hu, P.; Alavi, A.; Lee, M.H. A density functional theory study of carbon monoxide oxidation on the Cu3Pt(111) alloy surface: Comparison with the reactions on Pt(111) and Cu(111). J. Chem. Phys. 2001, 115, 5272–5277. [Google Scholar] [CrossRef]
Figure 1. SEM images of (A,B) IrO2 nanotubes and (C,D) Ir metal nanotubes. (scale bar = 100 nm).
Nanomaterials 10 01140 g001
Figure 2. Thermogravimetric analysis and differential scanning calorimetry graph for as-spun IrCl3/PVP nanofibers obtained in air, with temperature increasing rate of 5 °C·min−1.
Nanomaterials 10 01140 g002
Figure 3. XRD graphs of (A) IrO2 and (B) Ir metal nanotubes. The peaks marked with * are XRD peaks of Ir metal, whereas the peaks without any mark are XRD peaks of IrO2.
Nanomaterials 10 01140 g003
Figure 4. TEM images of (A) IrO2 and (B) Ir metal nanotubes. HRTEM images of (C) IrO2 and (D) Ir metal nanotubes (Insets: SAED patterns).
Nanomaterials 10 01140 g004
Figure 5. Background-corrected linear sweep voltammetry (LSV) curves of (A) IrO2 nanotubes- and (B) Ir metal nanotubes-loaded glassy carbon (GC) electrode obtained in aqueous solutions at 1.4 ppm (red), 2.8 ppm (blue), and 5.6 ppm (green) of CO concentration. Background solution contains 0.5 M H2SO4 and 0.03 M NaCl, which is deaerated via Ar gas purging. Scan rate 10 mV s−1.
Nanomaterials 10 01140 g005
Figure 6. (A) Dynamic current response of Ir metal nanotubes-loaded GC electrode to the successive increase of CO concentration (0, 0.028, 0.14, 0.28, 0.56, 1.12, 1.68 and 2.24 ppm), in 0.5 M H2SO4 aqueous solution containing 0.03 M NaCl. Electrode potential: 0.7 V vs. SCE. (B) An averaged calibration curve of Ir metal nanotubes-loaded GC electrodes (n = 5) for CO oxidation obtained from dynamic current reponses like (A). (C) Repeatability test for amperometric responses (three times) on Ir metal nanotubes-loaded GC electrode with an applied electrode potential of 0.7 V vs. SCE. (D) Corresponding calibration curves to (C).
Nanomaterials 10 01140 g006
Figure 7. (A) Dynamic current responses of cPt, Ir metal nanofibers and Ir metal nanotubes-loaded GC electrode to the successive increase of CO concentration (0, 0.028, 0.14, 0.28, 0.56, 1.12, 1.68 and 2.24 ppm), in 0.5 M H2SO4 aqueous solution containing 0.03 M NaCl. Electrode potential: 0.7 V vs. SCE. (B) Corresponding calibration curves to (A).
Nanomaterials 10 01140 g007
Figure 8. Illustration of CO and Oa adsorption on (A) Ir(111) and (B) Pt(111) surfaces. Ir, Pt, O and C atoms are represented in green, yellow, red and black, respectively.
Nanomaterials 10 01140 g008

