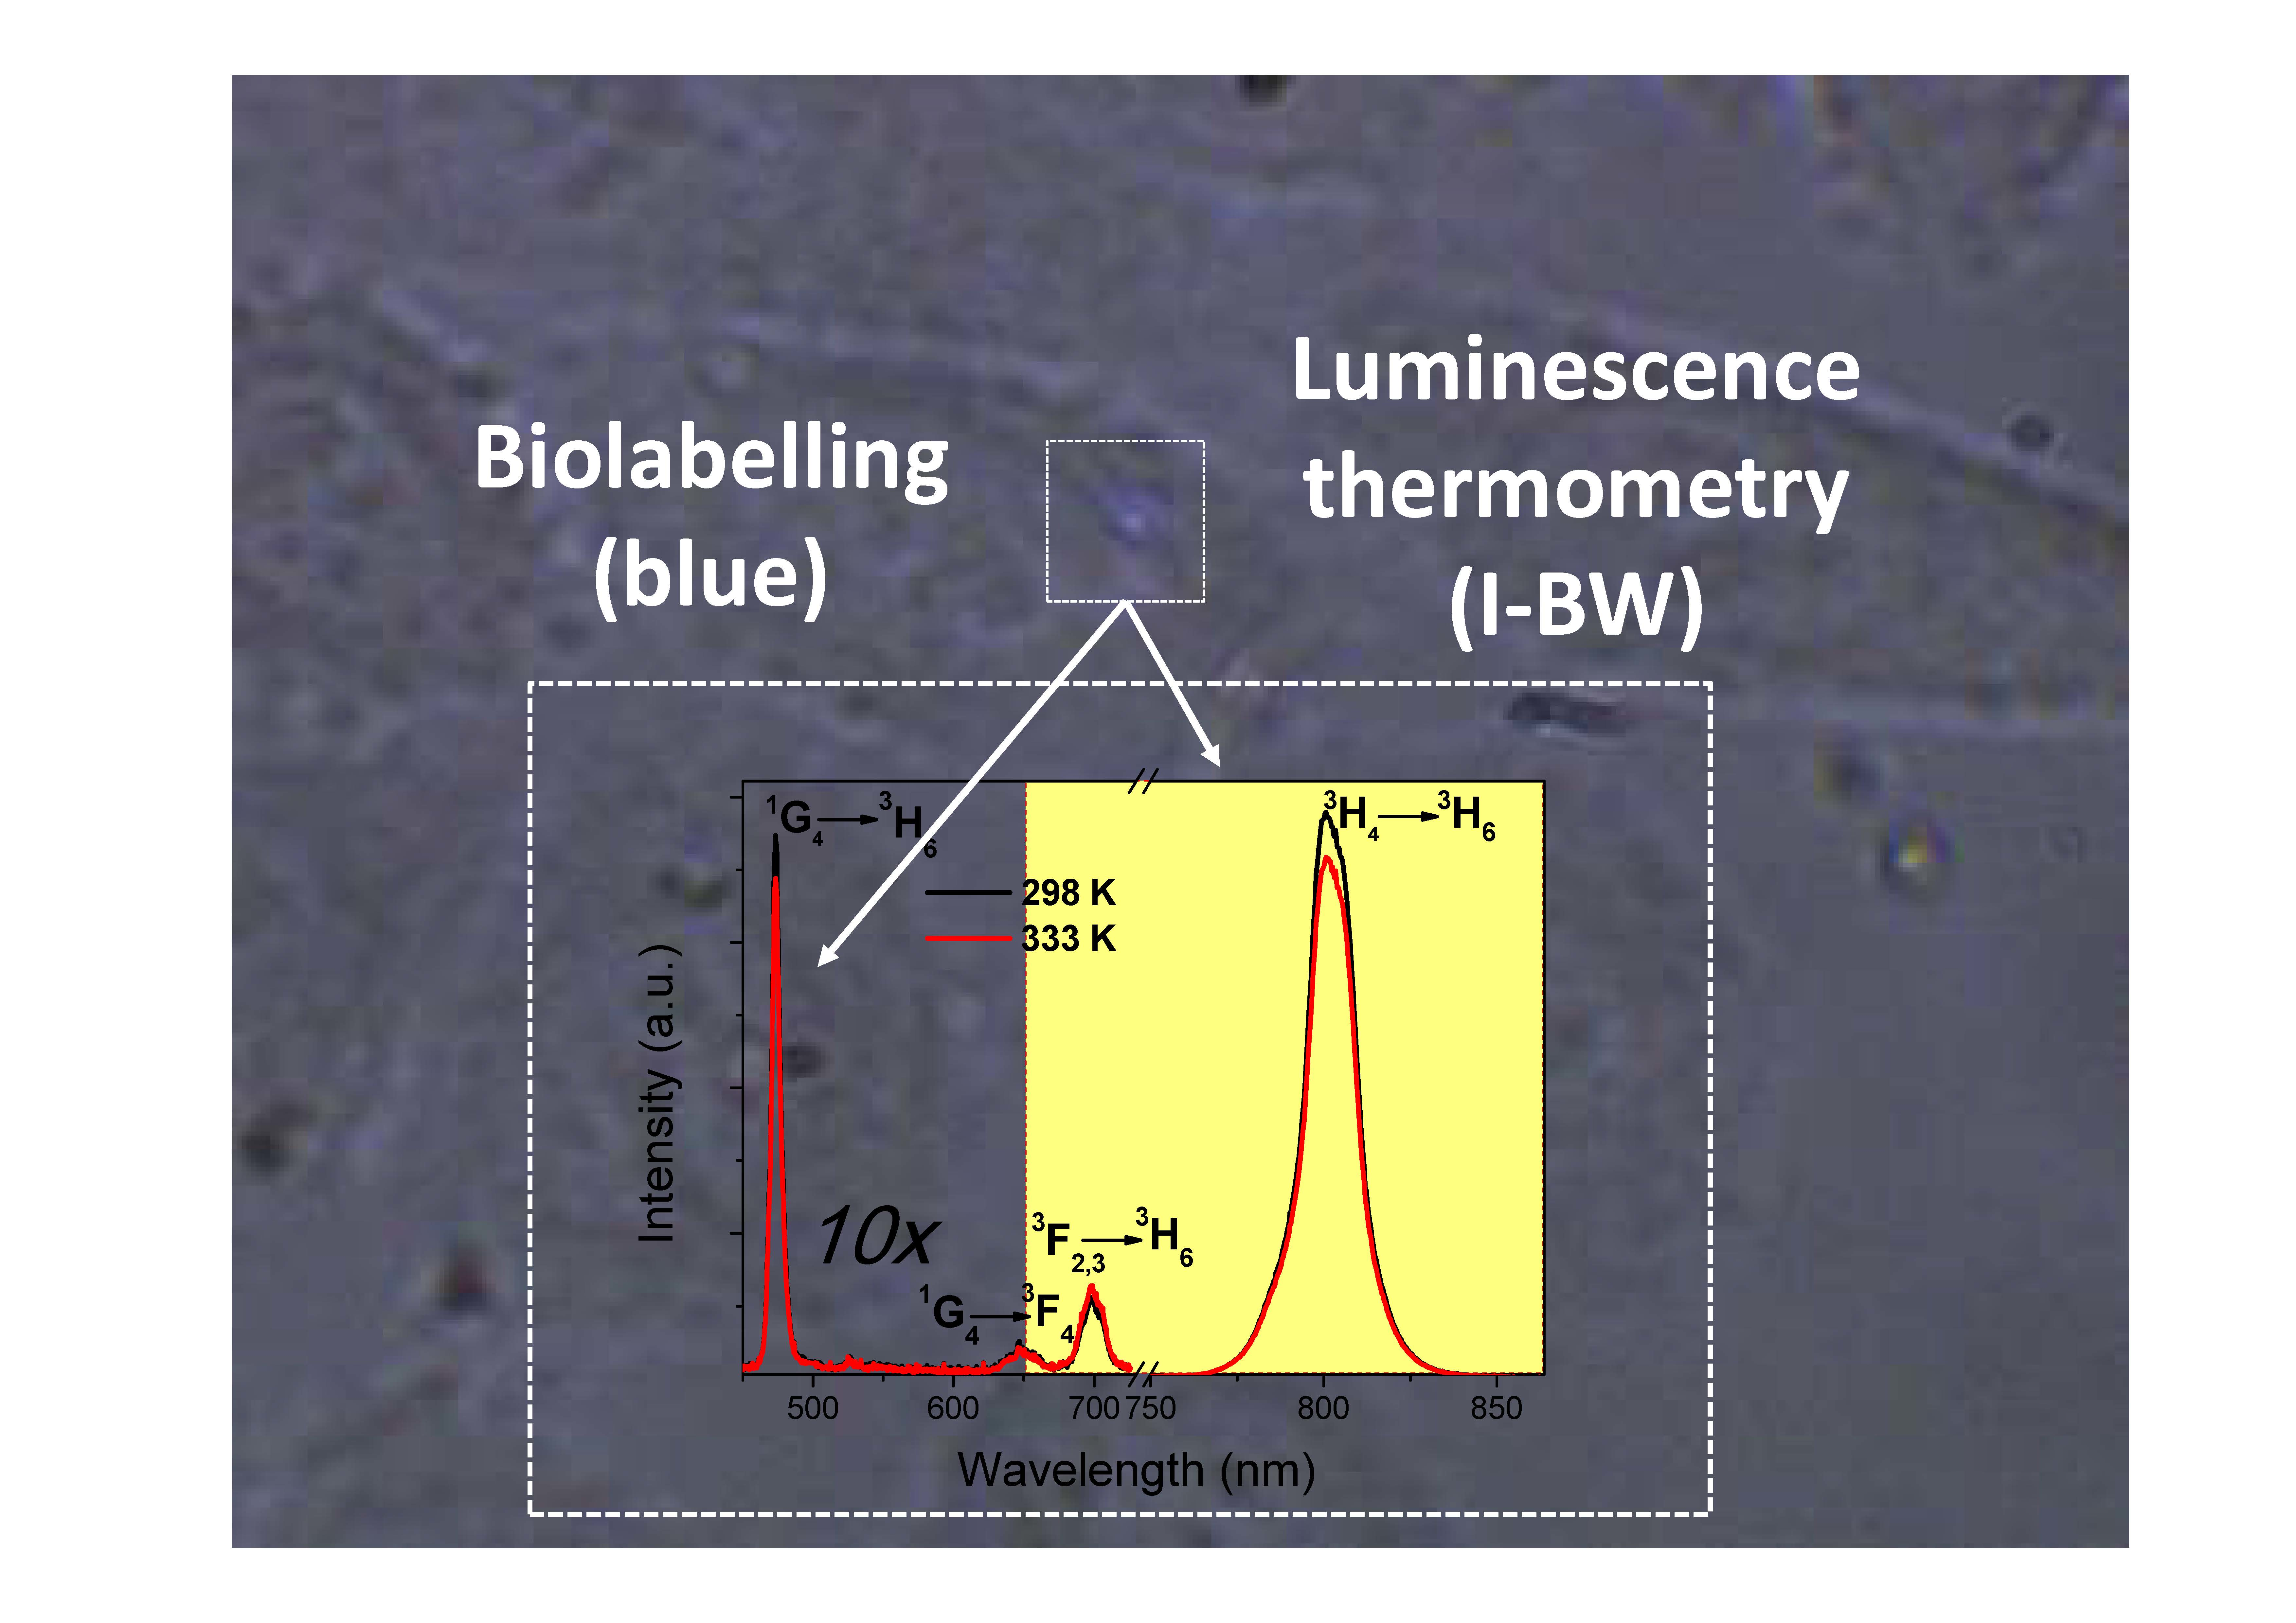
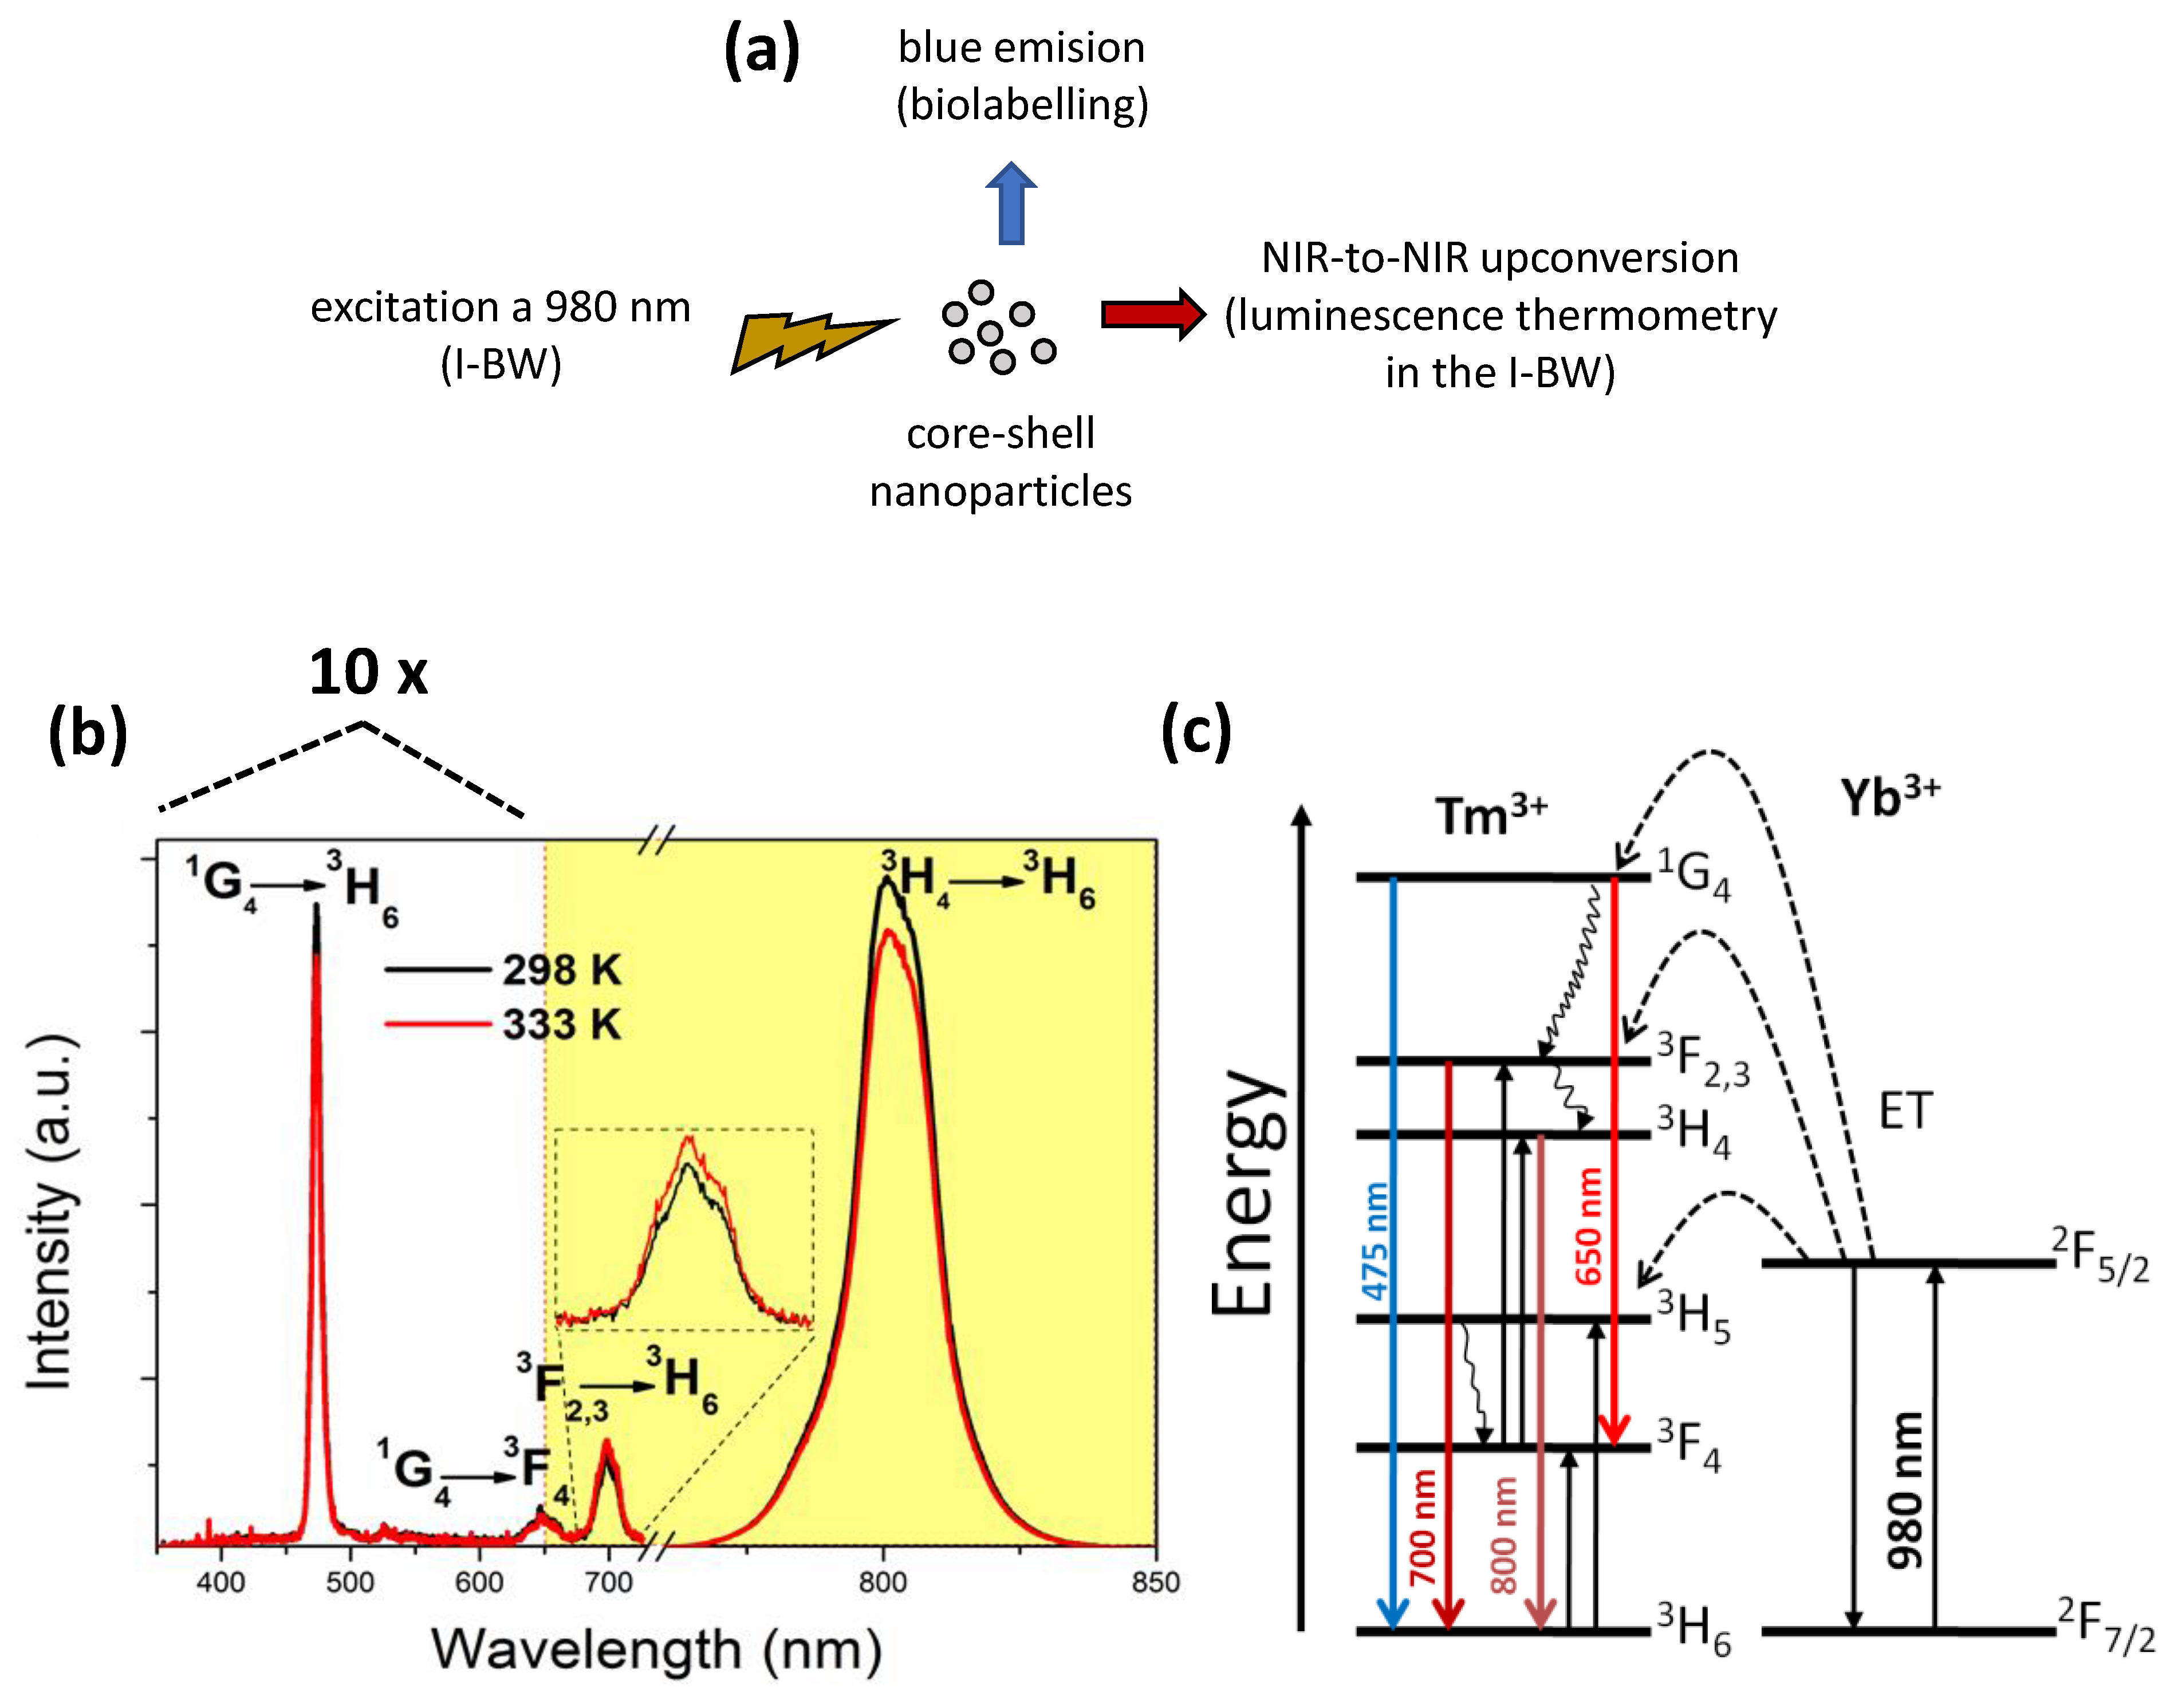
Bifunctional Tm3+,Yb3+:GdVO4@SiO2 Core-Shell Nanoparticles in HeLa Cells: Upconversion Luminescence Nanothermometry in the First Biological Window and Biolabelling in the Visible

 , ,
, ,
Abstract
:
1. Introduction
2. Materials and Methods
2.1. Synthesis of Tm,Yb:GdVO4@SiO2 Core-Shell Nanoparticles
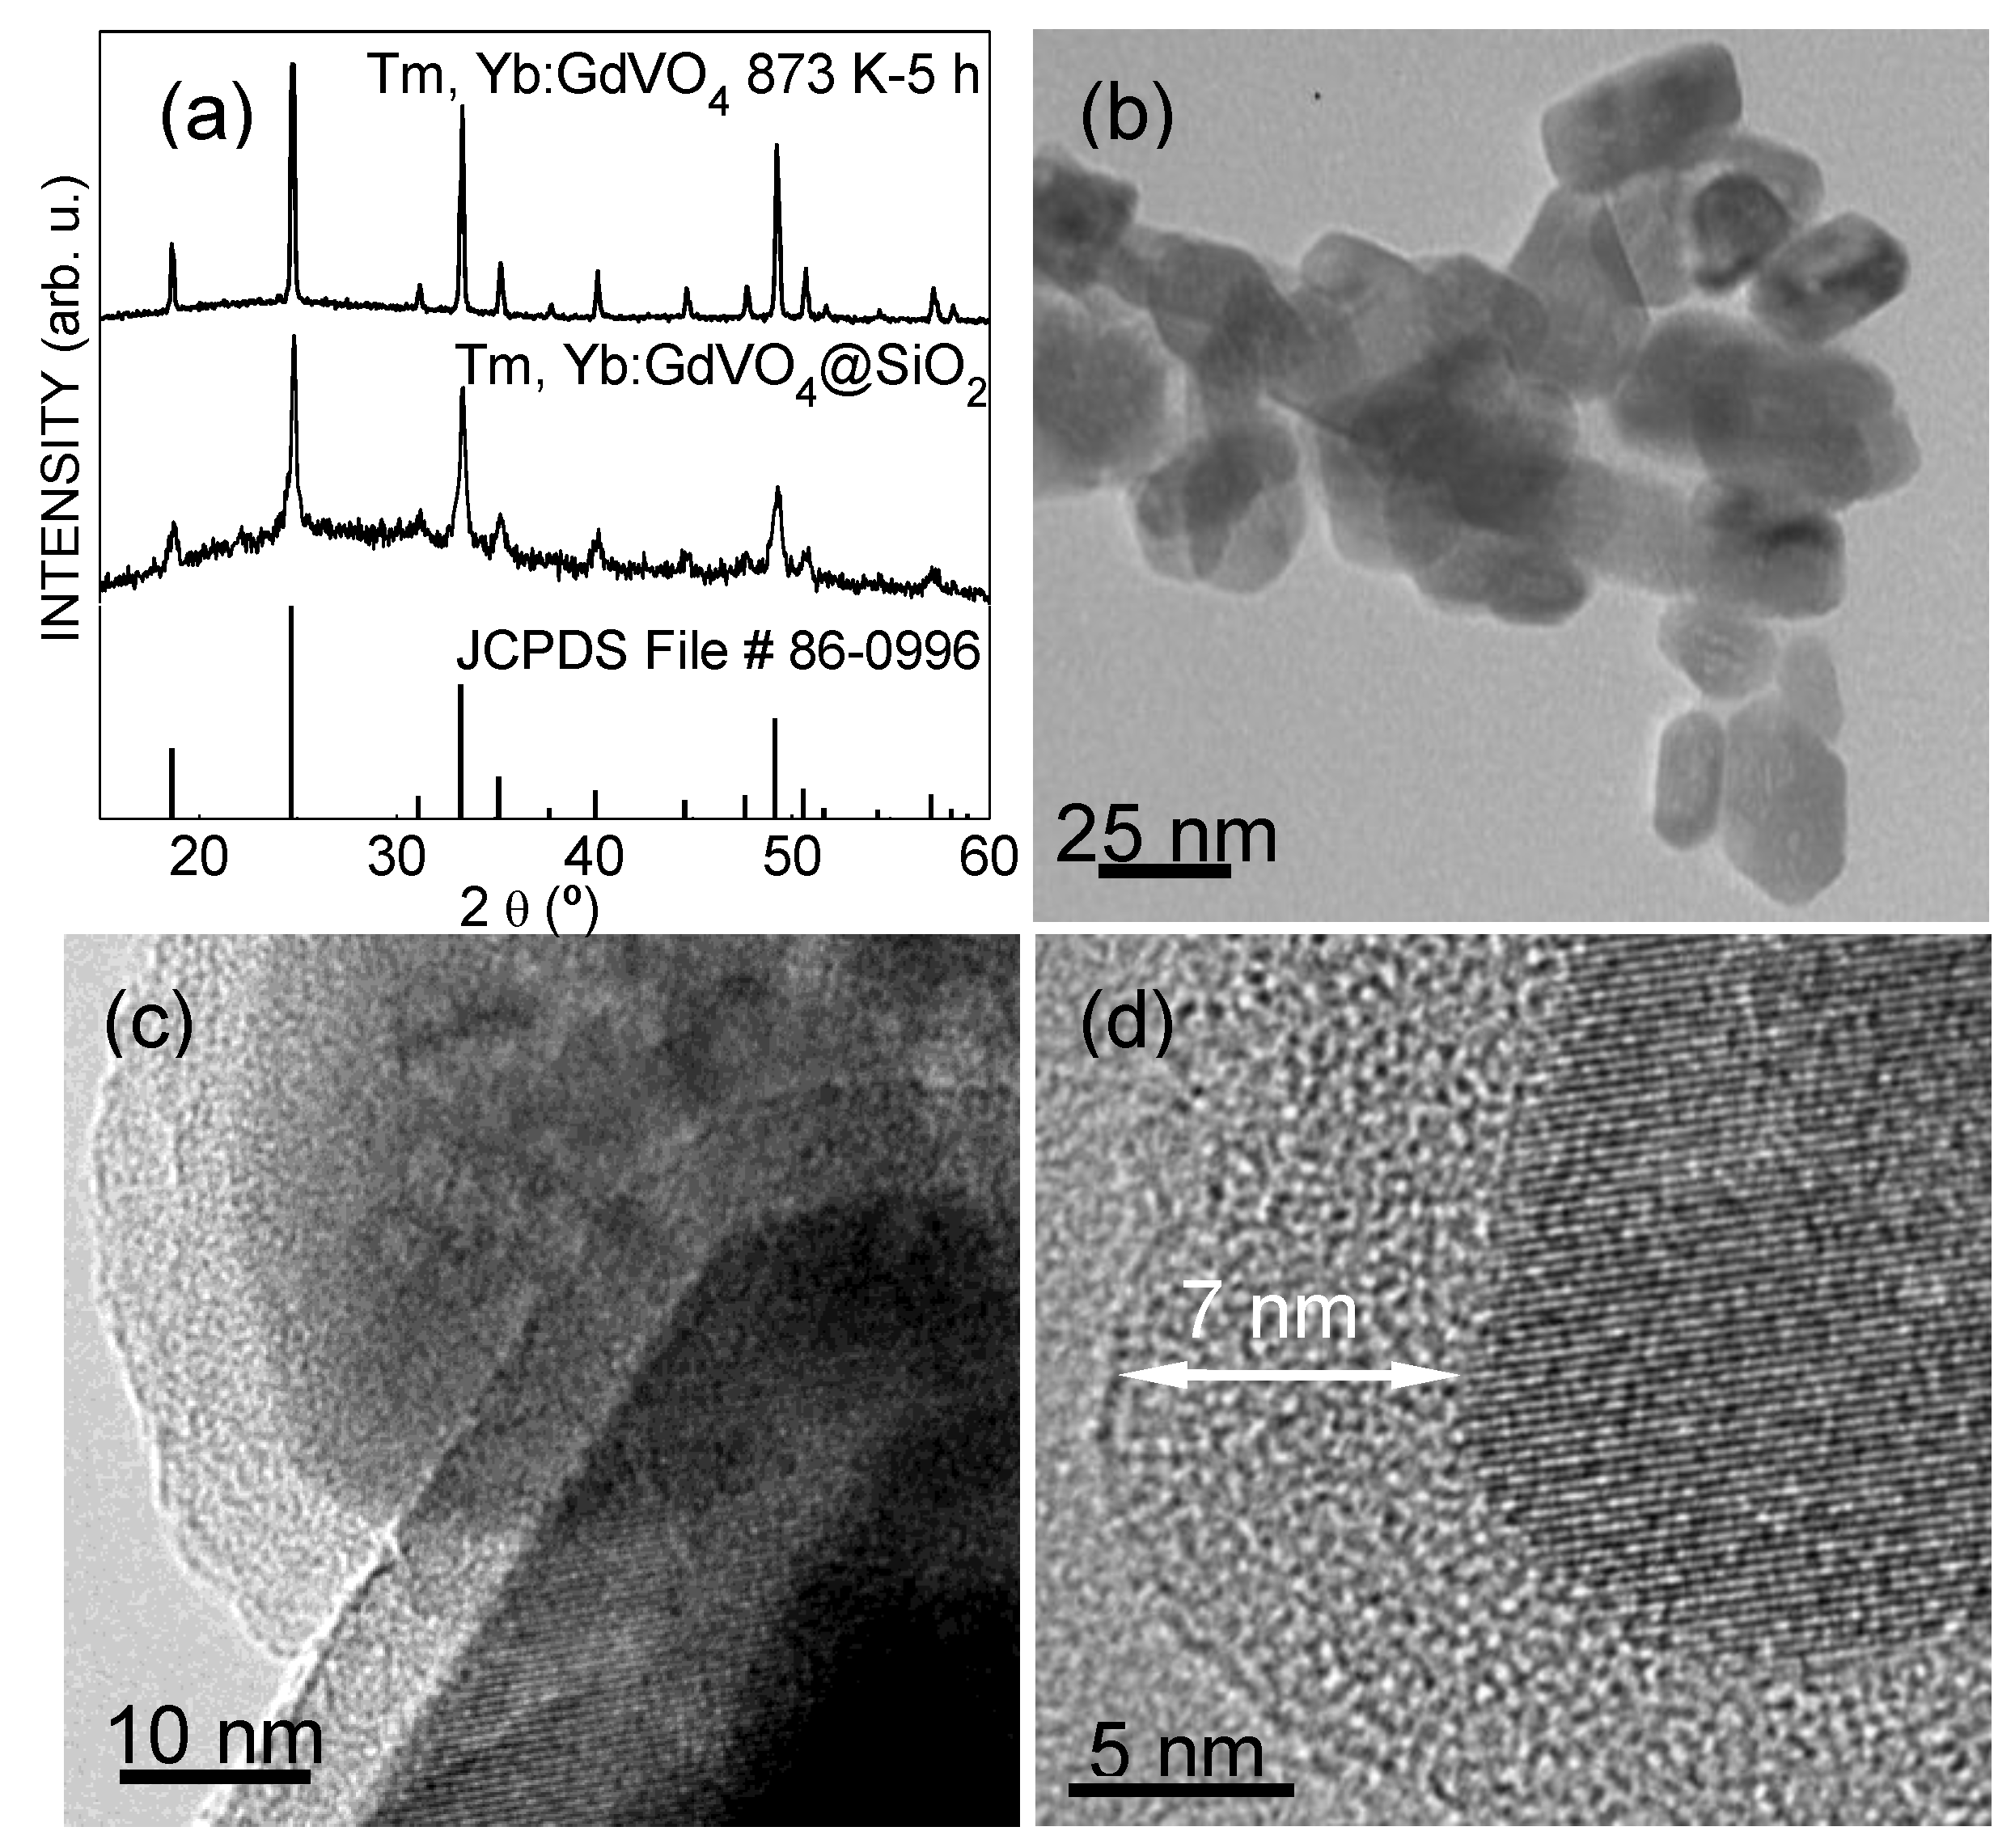
2.2. Structural and Morphological Characterization
2.3. Temperature-Dependent Photoluminescence Measurements
2.4. Subtissue Spectroscopic Measurements
2.5. In Vitro Experiments
2.6. In Vitro Cell Cytotoxicity/Viability Studies
3. Results
4. Conclusions
Supplementary Materials
Author Contributions
Funding
Acknowledgments
Conflicts of Interest
References
- Childs, P.R.N. Nanoscale thermometry and temperature measurements. In Thermometry at the Nanoscale: Techniques and Selected Applications, 1st ed.; Carlos, L.D., Palacio, F., Eds.; RSC Publishing: Oxfordshire, UK, 2016; pp. 1–22. [Google Scholar]
- Jaque, D.; Del Rosal, B.; Rodríguez, E.M.; Maestro, L.M.; Gonzalez, P.H.; Solé, J.G. Fluorescent nanothermometers for intracellular thermal sensing. Nanomedicine 2014, 9, 1047–1062. [Google Scholar] [CrossRef]
- Jaque, D.; Vetrone, F. Luminescent nanothermometry. Nanoscale 2012, 4, 4301–4326. [Google Scholar] [CrossRef]
- Brites, C.D.S.; Lima, P.; Silva, N.; Millán, A.; Amaral, V.S.; Palacio, F.; Carlos, L.D. Ratiometric highly sensitive luminescent nanothermometers working in the room temperature range. Applications to heat propagation in nanofluids. Nanoscale 2013, 5, 7572–7580. [Google Scholar] [CrossRef]
- Carrasco, E.; Del Rosal, B.; Sanz-Rodriguez, F.; De La Fuente, Á.J.; Gonzalez, P.H.; Rocha, U.; Kumar, K.U.; Jacinto, C.; Solé, J.G.; Jaque, D. Intratumoral thermal reading during photo-thermal therapy by multifunctional fluorescent nanoparticles. Adv. Funct. Mater. 2015, 25, 615–626. [Google Scholar] [CrossRef]
- Jaque, D.; Maestro, L.M.; Del Rosal, B.; Gonzalez, P.H.; Benayas, A.; Plaza, J.L.; Rodríguez, E.M.; Solé, J.G. Nanoparticles for photothermal therapies. Nanoscale 2014, 6, 9494–9530. [Google Scholar] [CrossRef]
- Wolfbeis, O.S. An overview of nanoparticles commonly used in fluorescent bioimaging. Chem. Soc. Rev. 2015, 44, 4743–4768. [Google Scholar] [CrossRef] [Green Version]
- Benayas, A.; Ren, F.; Carrasco, E.; Marzal, V.; Del Rosal, B.; Gonfa, B.A.; Juarranz, Á.; Sanz-Rodriguez, F.; Jaque, D.; Garcia-Sole, J.; et al. PbS/CdS/ZnS quantum dots: A multifunctional platform for in vivo near-infrared low dose fluorescent imaging. Adv. Funct. Mater. 2015, 25, 6650–6659. [Google Scholar] [CrossRef] [Green Version]
- Ju, Q.; Chen, X.; Ai, F.; Peng, D.; Lin, X.; Kong, W.; Shi, P.; Zhu, G.; Wang, F. An upconversion nanoprobe operating in the first biological window. J. Mater. Chem. B 2015, 3, 3548–3555. [Google Scholar] [CrossRef]
- Rocha, U.; Silva, C.J.D.; Silva, W.F.; Guedes, I.; Benayas, A.; Maestro, L.M.; Acosta-Elías, M.; Bovero, E.; Van Veggel, F.C.J.M.; Solé, J.A.G.; et al. Subtissue Thermal Sensing Based on Neodymium-Doped LaF3 Nanoparticles. Acs Nano 2013, 7, 1188–1199. [Google Scholar] [CrossRef]
- Savchuk, O.A.; Carvajal, J.J.; Cascales, C.; Aguiló, M.; Díaz, F. Benefits of Silica Core−Shell Structures on the Temperature Sensing Properties of Er,Yb:GdVO4 Up-Conversion Nanoparticles. Acs Appl. Mater. Interfaces 2016, 8, 7266–7273. [Google Scholar] [CrossRef]
- Smith, A.M.; Mancini, M.C.; Nie, S. Second window for in vivo imaging. Nat. Nanotech. 2009, 4, 710–711. [Google Scholar] [CrossRef] [Green Version]
- Savchuk, O.; Carlos, L.D.; Aguiló, M.; Díaz, F.; Carvajal, J.; Brites, C.D.S. Upconversion thermometry: A new tool to measure the thermal resistance of nanoparticles. Nanoscale 2018, 10, 6602–6610. [Google Scholar] [CrossRef] [Green Version]
- Savchuk, O.; Carvajal, J.J.; De La Cruz, L.; Gonzalez, P.H.; Aguiló, M.; Díaz, F. Luminescence thermometry and imaging in the second biological window at high penetration depth with Nd:KGd(WO4)2 nanoparticles. J. Mater. Chem. C 2016, 4, 7397–7405. [Google Scholar] [CrossRef]
- Hemmer, E.; Venkatachalam, N.; Hyodo, H.; Hattori, A.; Ebina, Y.; Kishimoto, H.; Soga, K. Upconverting and NIR emitting rare earth based nanostructures for NIR-bioimaging. Nanoscale 2013, 5, 11339–11361. [Google Scholar] [CrossRef]
- Naczynski, D.J.; Tan, M.C.; Zevon, M.; Wall, B.; Kohl, J.; Kulesa, A.; Chen, S.; Roth, C.M.; Riman, R.E.; Moghe, P.V. Rare-earth-doped biological composites as in vivo shortwave infrared reporters. Nat. Commun. 2013, 4, 2199. [Google Scholar] [CrossRef]
- Savchuk, O.A.; Carvajal, J.J.; Haro-Gonzalez, P.; Aguilo, M.; Diaz, F. Luminescent nanothermometry using short-wavelength infrared light. J. Alloys Compnd. 2018, 746, 710–719. [Google Scholar] [CrossRef]
- Dong, N.N.; Pedroni, M.; Piccinelli, F.; Conti, G.; Sbarbati, A.; Ramírez-Hernández, J.E.; Maestro, L.M.; Cruz, M.C.I.-D.L.; Sanz-Rodriguez, F.; Juarranz, Á.; et al. NIR-to-NIR Two-Photon Excited CaF2:Tm3+,Yb3+ Nanoparticles: Multifunctional Nanoprobes for Highly Penetrating Fluorescence Bio-Imaging. Acs Nano 2011, 5, 8665–8671. [Google Scholar] [CrossRef]
- Xing, L.; Xu, Y.; Wang, R.; Xu, W.; Zhang, Z. Highly sensitive optical thermometry based on upconversion emissions in Tm3+/Yb3+ codoped LiNbO3 single crystal. Opt. Lett. 2014, 39, 454–457. [Google Scholar] [CrossRef]
- Uchiyama, S.; Inada, N. Cellular thermometry. In Thermometry at the Nanoscale: Techniques and Selected Applications, 1st ed.; Carlos, L.D., Palacio, F., Eds.; RSC Publishing: Oxfordshire, UK, 2016; pp. 352–382. [Google Scholar]
- Shang, L.; Stockmar, F.; Azadfar, N.; Nienhaus, U. Intracellular thermometry by using fluorescent gold nanoclusters. Angew. Chem. Int. Ed. 2014, 52, 11154–11157. [Google Scholar] [CrossRef]
- Song, C.; Zhang, S.; Hou, Q.; Hai, H.; Zhao, D.; Hui, Y. Upconversion nanoparticles for bioimaging. Nanotechnol. Rev. 2017, 6, 233–242. [Google Scholar] [CrossRef]
- Zhu, X.; Zhang, J.; Liu, J.; Zhang, Y. Recent progress of rare-earth doped upconversion nanoparticles: Synthesis, optimization and applications. Adv. Sci. 2019, 6, 1901358. [Google Scholar] [CrossRef] [PubMed] [Green Version]
- Li, X.; Zhang, F.; Zhao, D. Lab on upconversion nanoparticles: Optical properties and applications. Chem. Soc. Rev. 2015, 44, 1346–1378. [Google Scholar] [CrossRef] [PubMed]
- Del Rosal, B.; Jaque, D. Upconversion nanoparticles for in vivo applications: Limitations and future perspectives. Methods Appl. Fluoresc. 2019, 7, 022001. [Google Scholar] [CrossRef]
- Tian, Y.; Chen, B.; Tian, B.; Mao, Y.; Sun, J.; Li, X.; Zhang, J.; Fu, S.; Zhong, H.; Dong, B.; et al. Size-dependent energy transfer and spontaneous radiative transition properties of Dy3+ ions in the GdVO4 phosphors. J. Nanopart. Res. 2013, 15, 1757. [Google Scholar] [CrossRef]
- Calderon-Villajos, R.; Zaldo, C.; Cascales, C. Enhanced upconversion multicolor and white light luminescence in SiO2-coated lanthanide-doped GdVO4 hydrothermal nanocrystals. Nanotechnology 2012, 23, 505205. [Google Scholar] [CrossRef]
- Van Staveren, H.J.; Moes, C.J.M.; van Marie, J.; Prahl, S.A.; van Gemert, M.J.C. Light scattering in lntralipid-10% in the wavelength range of 400–1100 nm. Appl. Opt. 1991, 30, 4507–4514. [Google Scholar] [CrossRef] [Green Version]
- Mosmann, T. Rapid colorimetric assay for cellular growth and survival: Application to proliferation and cytotoxicity assays. J. Immunol. Methods 1983, 65, 55–63. [Google Scholar] [CrossRef]
- Savchuk, O.A.; Carvajal, J.J.; Cascales, C.; Massons, J.; Aguiló, M.; Díaz, F. Thermochromic upconversion nanoparticles for visual temperature sensors with high thermal, spatial and temporal resolution. J. Mater. Chem. C 2016, 4, 6602–6613. [Google Scholar] [CrossRef]
- Lisiecki, R.; Solarz, P.; Dominiak-Dzik, G.; Ryba-Romanowski, W.; Sobczyk, M.; Černý, P.; Šulc, J.; Jelínková, H.; Urata, Y.; Higuchi, M. Comparative optical study of thulium-doped YVO4, GdVO4, and LuVO4 single crystals. Phys. Rev. B 2006, 74, 035103. [Google Scholar] [CrossRef]
- Wade, S.A.; Collins, S.F.; Baxter, G.W. Fluorescence intensity ratio technique for optical fiber point temperature sensing. J. Appl. Phys. 2003, 94, 4743–4756. [Google Scholar] [CrossRef]
- Yu, L.; Ye, L.; Bao, R.; Zhang, X.; Wang, L.G. Sensitivity-enhanced Tm3+/Yb3+ co-doped YAG single crystal optical fiber thermometry based on upconversion emissions. Opt. Commun. 2018, 410, 632–636. [Google Scholar] [CrossRef]
- Filho, P.C.D.S.; Alain, J.; Leménager, G.; Larquet, E.; Fick, J.; Serra, O.A.; Gacoin, T. Colloidal Rare Earth Vanadate Single Crystalline Particles as Ratiometric Luminescent Thermometers. J. Phys. Chem. C 2019, 123, 2441–2450. [Google Scholar] [CrossRef]
- Xing, L.; Yang, W.; Ma, D.; Wang, R. Effect of crystallinity on the optical thermometry sensitivity of Tm3+/Yb3+ codoped LiNbO3 crystal. Sens. Act. B 2015, 221, 458–462. [Google Scholar] [CrossRef]
- Wang, X.; Zheng, J.; Xuan, Y.; Yan, X. Optical temperature sensing of NaYbF4: Tm3+@ SiO2 core-shell micro-particles induced by infrared excitation. Opt. Exp. 2013, 21, 21596. [Google Scholar] [CrossRef]
- Du, P.; Luo, L.; Yu, J.S. Controlled synthesis and upconversion luminescence of Tm3+-doped NaYbF4 nanoparticles for non-invasion optical thermometry. J. Alloy. Compd. 2018, 739, 926–933. [Google Scholar] [CrossRef]
- Min, Q.; Bian, W.; Qi, Y.; Lu, W.; Yu, X.; Xu, X.; Zhou, D.; Qiu, J. Temperature sensing based on the up-conversion emission of Tm3+ in a single KLuF4 microcrystal. J. Alloy. Compd. 2017, 728, 1037–1042. [Google Scholar] [CrossRef]
- Suo, H.; Hu, F.; Zhao, X.; Zhang, Z.; Li, T.; Duan, C.; Yin, M.; Guo, C. All-in-one thermometer-heater up-converting platform YF3:Yb3+,Tm3+ operating in the first biological window. J. Mater. Chem. C 2017, 5, 1501–1507. [Google Scholar] [CrossRef]
- Xu, W.; Gao, X.Y.; Zheng, L.J.; Zhang, Z.G.; Cao, W.W. An optical temperature sensor based on the upconversion luminescence from Tm3+/Yb3+ codoped oxyfluoride glass ceramic. Sens. Actuators B. 2012, 173, 250–253. [Google Scholar] [CrossRef]
- Lojpur, V.; Nikolic, M.; Mancic, L.; Milosevic, O.; Dramicanin, M.D. Y2O3:Yb,Tm and Y2O3:Yb,Ho powders for low-temperature thermometry based on up-conversion fluorescence. Ceram. Int. 2013, 39, 1129–1134. [Google Scholar] [CrossRef]
- Brites, C.D.S.; Balabhadra, S.; Carlos, L.D. Lanthanide-based thermometers: At the cutting-edge of luminescence thermometry. Adv. Opt. Mater. 2019, 7, 1801239. [Google Scholar] [CrossRef] [Green Version]
- Rocha, U.; Kumar, K.U.; Jacinto, C.; Villa, I.; Sanz-Rodriguez, F.; Cruz, M.D.C.I.D.L.; Juarranz, Á.; Carrasco, E.; Van Veggel, F.C.J.M.; Bovero, E.; et al. Neodymium-Doped LaF3 Nanoparticles for Fluorescence Bioimaging in the Second Biological Window. Small 2014, 10, 1141–1154. [Google Scholar] [CrossRef]
- Huang, B.; Dong, H.; Wong, K.L.; Sun, L.D.; Yan, C.H. Fundamental View of Electronic Structures of β-NaYF4, β-NaGdF4, and β-NaLuF4. J. Phys. Chem. C 2016, 120, 18858–18870. [Google Scholar] [CrossRef]
- Balabhadra, S.; Debasu, M.L.; Brites, C.D.S.; Ferreira, R.A.S.; Carlos, L.D. Upconverting Nanoparticles Working As Primary Thermometers In Different Media. J. Phys. Chem. C 2017, 121, 13962–13968. [Google Scholar] [CrossRef]
- Zohar, O.; Ikeda, M.; Shinagawa, H.; Inoue, H.; Nakamura, H.; Elbaum, D.; Alkon, D.L.; Yoshioka, T. Thermal imaging of receptor-activated heat production in single cells. Biophys. J. 1998, 74, 82–89. [Google Scholar] [CrossRef] [Green Version]
- Oyama, K.; Takabayashi, M.; Takei, Y.; Arai, S.; Takeoka, S.; Ishiwata, S.; Suzuki, M. Walking nanothermometers: Spatiotemporal temperature measurement of transported acidic organelles in single living cells. Lab. Chip 2012, 12, 1591–1593. [Google Scholar] [CrossRef]
- Takei, Y.; Arai, S.; Murata, A.; Takabayashi, M.; Oyama, K.; Ishiwata, S.; Takeoka, S.; Suzuki, M. A Nanoparticle-Based Ratiometric and Self-Calibrated Fluorescent Thermometer for Single Living Cells. Acs Nano 2014, 8, 198–206. [Google Scholar] [CrossRef]
- Suzuki, M.; Tseeb, V.; Oyama, K.; Ishiwata, S. Microscopic Detection of Thermogenesis in a Single HeLa Cell. Biophys. J. 2007, 92, L46–L48. [Google Scholar] [CrossRef] [Green Version]
- Vetrone, F.; Naccache, R.; Zamarrón, A.; De La Fuente, A.J.; Sanz-Rodríguez, F.; Maestro, L.M.; Rodríguez, E.M.; Jaque, D.; García Solé, J.; Capobianco, J.A.; et al. Temperature Sensing Using Fluorescent Nanothermometers. Acs Nano 2010, 4, 3254–3258. [Google Scholar] [CrossRef]
- Fischer, L.H.; Harms, G.S.; Wolfbeis, O.S. Upconverting Nanoparticles for Nanoscale Thermometry. Angew. Chem. Int. Ed. 2011, 50, 4546–4551. [Google Scholar] [CrossRef]
- Miao, Q.; Xie, C.; Zhen, X.; Lyu, Y.; Duan, H.; Liu, X.; Jokerst, J.V.; Pu, K. Molecular afterglow imaging with bright, biodegradable polymer nanoparticles. Nat. Biotechnol. 2017, 35, 1102. [Google Scholar] [CrossRef]
- Zhen, X.; Xie, C.; Pu, K. Temperature-correlated afterglow of a semiconducting polymer nanococktail for imaging-guided photothermal therapy. Angew. Chem. Int. Ed. 2018, 57, 3938–3942. [Google Scholar] [CrossRef] [PubMed]


| Material | Temperature Range (K) | Excitation Wavelength (nm) | Wavelength Ratio | Sabs (K−1) (T) (K) | Srel (% K−1) (T) (K) | δT (K) | Ref. |
|---|---|---|---|---|---|---|---|
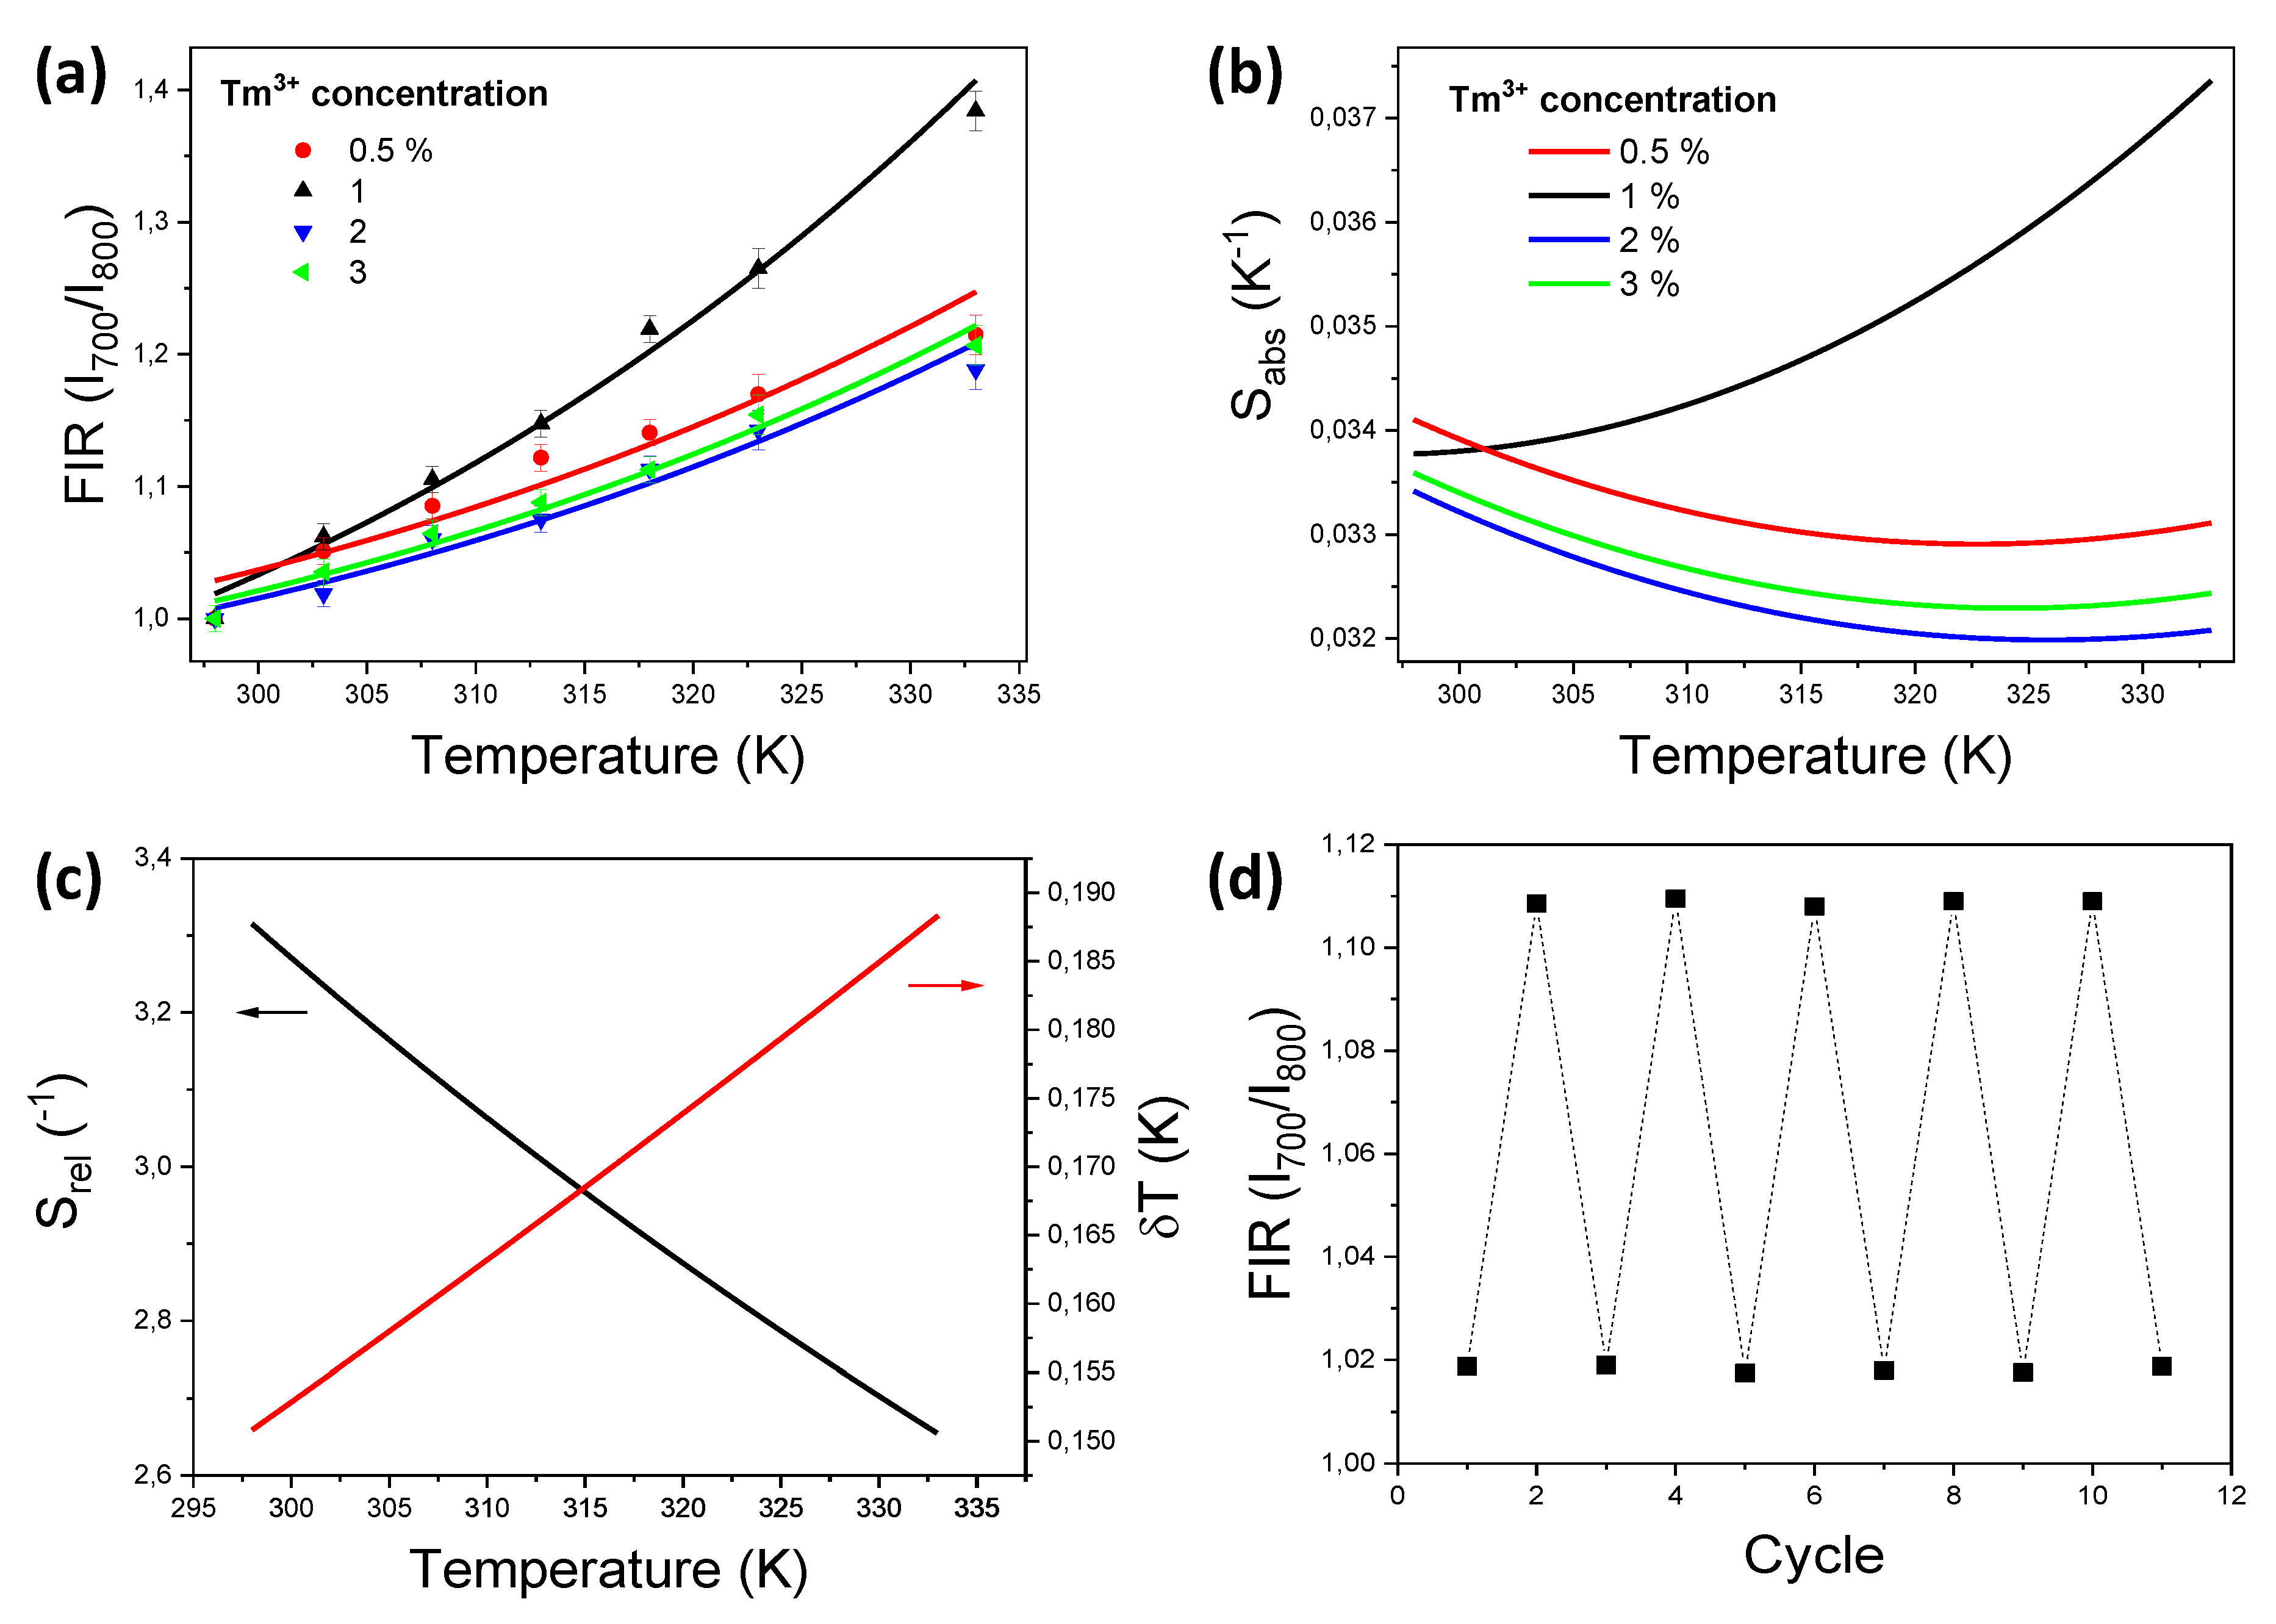
| Tm,Yb:GdVO4@SiO2 | 298–333 | 980 | I700/I800 | 0.037 (333) | 3.3 (298) | 0.15 | This work |
| Tm, Yb:YVO4 | 288–473 | 980 | I800/I700 | - | 2.4 (425) | ~0.1 | [34] |
| Tm,Yb:LiNbO3 | 323–773 | 980 | I700/I800 | 0.00024 (773) | 3.0 (323) | 0.16 * | [19] |
| Tm,Yb:LiNbO3 (single crystal) | 323–773 | 980 | I700/I800 | 0.00033 (773) | 3.0 (323) | 0.16 * | [35] |
| Tm,Yb:LiNbO3 (polycrystal) | 323–773 | 980 | I700/I800 | 0.00024 (773) | 2.0 (323) | 0.25 * | [35] |
| Tm, Yb:YA Goptical fiber | 333–733 | 976 | I683/I782 | 0.021 (733) | 2.3 (333) | 0.22 * | [33] |
| Tm:NaYbF4@SiO2 | 100–700 | 980 | I697/I798 | 0.0066 (100) | 28 (100) | 0.02 * | [36] |
| Tm:NaYbF4 | 298–778 | 980 | I700/I800 | 0.0002 (778) | 1.8 * (298) | 1.5 | [37] |
| Tm, Yb:KLuF4 | 303–503 | 980 | I690/I795 | - | 1.0 (303) | 0.5 * | [38] |
| Tm,Yb:YF3 | 300–750 | 980 | I700/I776 | 0.001 (750) | 2.8 * (300) | 0.18 * | [39] |
| Tm,Yb:oxyfluoride glass | 293–703 | 980 | I700/I800 | 0.00029 (703) | 3.2 * (300) | 0.16 * | [40] |
| Tm,Yb:Y2O3 | 6–300 | 978 | I815/I454 | - | 7.8 (270) | - | [41] |
| Tm,Yb:Y2O3 | 6–300 | 978 | I815/I460 | - | 6.7 (178) | - | [41] |
| Tm,Yb:Y2O3 | 6–300 | 978 | I815/I656 | - | 6.4 (290) | - | [41] |
| Material | Thermometric Parameter | Cell Line | Introduction into Cells | Spectral Range (nm) | λexc (nm) | δT (K) | Ref. |
|---|---|---|---|---|---|---|---|
| Eu-TTA | Emission intensity | CHO | Incubation, RT, 30 min On cell membrane | 615 | 372 | - | [46] |
| Eu-TTA | Emission intensity | HeLa | Incubation, 310 K, 1 h Endosome/lysosome | 0.3 | [47] | ||
| Eu-TTA/Rh101 | Intensity ratio | HeLa | Incubation, 310 K, 2 h Endosome | 580–615 | 340 (Eu-TTA) 530 (Rh101) | 1.0 | [48] |
| Eu-TTA and Fluo-4 | Emission intensity | HeLa | Micropipette, physical contact | - | 385 (Eu-TTA) 480 (Fluo-4) | <0.5 | [49] |
| NaYF4:Er,Yb | FIR | HeLa | Incubation, 1.5 h | 525–545 | 920 | - | [50] |
| NaYF4:Er,Yb | Intensity ratio | HEK 293 | Transfected | 539–651 | 980 50 mW | - | [51] |
© 2020 by the authors. Licensee MDPI, Basel, Switzerland. This article is an open access article distributed under the terms and conditions of the Creative Commons Attribution (CC BY) license (http://creativecommons.org/licenses/by/4.0/).
Share and Cite
Savchuk, O.; Carvajal Marti, J.J.; Cascales, C.; Haro-Gonzalez, P.; Sanz-Rodríguez, F.; Aguilo, M.; Diaz, F. Bifunctional Tm3+,Yb3+:GdVO4@SiO2 Core-Shell Nanoparticles in HeLa Cells: Upconversion Luminescence Nanothermometry in the First Biological Window and Biolabelling in the Visible. Nanomaterials 2020, 10, 993. https://doi.org/10.3390/nano10050993
Savchuk O, Carvajal Marti JJ, Cascales C, Haro-Gonzalez P, Sanz-Rodríguez F, Aguilo M, Diaz F. Bifunctional Tm3+,Yb3+:GdVO4@SiO2 Core-Shell Nanoparticles in HeLa Cells: Upconversion Luminescence Nanothermometry in the First Biological Window and Biolabelling in the Visible. Nanomaterials. 2020; 10(5):993. https://doi.org/10.3390/nano10050993
Chicago/Turabian StyleSavchuk, Oleksandr, Joan Josep Carvajal Marti, Concepción Cascales, Patricia Haro-Gonzalez, Francisco Sanz-Rodríguez, Magdalena Aguilo, and Francesc Diaz. 2020. "Bifunctional Tm3+,Yb3+:GdVO4@SiO2 Core-Shell Nanoparticles in HeLa Cells: Upconversion Luminescence Nanothermometry in the First Biological Window and Biolabelling in the Visible" Nanomaterials 10, no. 5: 993. https://doi.org/10.3390/nano10050993