Control of pH-Responsiveness in Graphene Oxide Grafted with Poly-DEAEMA via Tailored Functionalization

 and
and
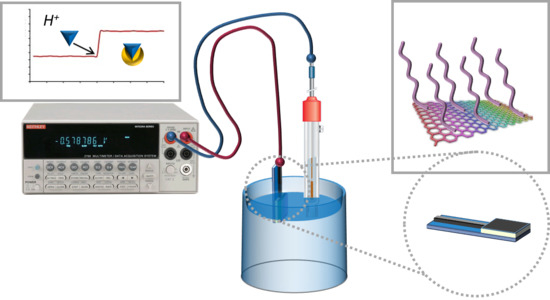
Abstract
:
1. Introduction
2. Materials and Methods
2.1. Materials, Synthesis and Characterization
2.1.1. General
2.1.2. Buffer Solutions
2.1.3. Dispersion of GO Materials
2.1.4. Analysis of GO Materials
2.1.5. Potentiometric Measurements
2.1.6. Synthesis Stage I
2.1.7. Synthesis Stage II
2.1.8. Synthesis Stage III
2.2. Performance Evaluations
2.2.1. Swelling Studies
2.2.2. Potentiometric Studies
3. Results and Discussion
3.1. Material Evolution upon Synthesis Stage
3.2. Performance Evaluations of the Material Family
3.3. Proposed Mechanism for pH-Dependence in the Material Performance
4. Conclusions
Supplementary Materials
Author Contributions
Funding
Conflicts of Interest
References
- Iijima, S. Helical Microtubules of graphitic carbon. Nature 1991, 354, 56–58. [Google Scholar] [CrossRef]
- Novoselov, K.S.; Geim, A.K.; Morozov, S.V.; Jiang, D.; Zhang, Y.; Dubonos, S.V.; Grigorieva, I.V.; Firsov, A.A. Electric field effect in atomically thin carbon films. Science 2004, 306, 666–669. [Google Scholar] [CrossRef] [Green Version]
- Treacy, M.M.J.; Ebbesen, T.W.; Gibson, J.M. Exceptionally high Young’s modulus observed for individual carbon nanotubes. Nature 1996, 381, 678–680. [Google Scholar] [CrossRef]
- Dai, H. Carbon nanotubes: synthesis, integration, and properties. Acc. Chem. Res. 2002, 35, 1035–1044. [Google Scholar] [CrossRef]
- Soldano, C.; Mahmood, A.; Dujardin, E. Production, properties and potential of graphene. Carbon 2010, 48, 2127–2150. [Google Scholar] [CrossRef] [Green Version]
- Setaro, A. Advanced carbon nanotubes functionalization. J. Phys. Condens. Matter 2017, 29, 423003. [Google Scholar] [CrossRef] [PubMed] [Green Version]
- Sattar, T. Current review on synthesis, composites and multifunctional properties of graphene. Top. Curr. Chem. 2019, 377, 10. [Google Scholar] [CrossRef] [PubMed]
- Meunier, V.; Souza Filho, A.G.; Barros, E.B.; Dresselhaus, M.S. Physical properties of low-dimensional sp2-based carbon nanostructures. Rev. Mod. Phys. 2016, 88. [Google Scholar] [CrossRef] [Green Version]
- Escárcega-Bobadilla, M.V.; Rodriguez-Perez, L.; Teuma, E.; Serp, P.; Masdeu-Bultó, A.M.; Gómez, M. Rhodium complexes containing chiral P-donor ligands as catalysts for asymmetric hydrogenation in non conventional media. Catal. Lett. 2011, 141, 808–816. [Google Scholar] [CrossRef]
- Zhai, Y.; Zhu, Z.; Dong, S. Carbon-based nanostructures for advanced catalysis. ChemCatChem 2015, 7, 2806–2815. [Google Scholar] [CrossRef]
- Wang, Y.; Pan, C.; Chu, W.; Vipin, A.K.; Sun, L. Environmental remediation applications of carbon nanotubes and graphene oxide: Adsorption and catalysis. Nanomaterials 2019, 9, 439. [Google Scholar] [CrossRef] [PubMed] [Green Version]
- Düzgün, A.; Zelada-Guillén, G.A.; Crespo, G.A.; Macho, S.; Riu, J.; Rius, F.X. Nanostructured materials in potentiometry. Anal. Bioanal. Chem. 2011, 399, 171–181. [Google Scholar] [CrossRef] [PubMed]
- Hernández, R.; Vallés, C.; Benito, A.M.; Maser, W.K.; Rius, F.X.; Riu, J. Graphene-based potentiometric biosensor for the immediate detection of living bacteria. Biosens. Bioelectron. 2014, 54, 553–557. [Google Scholar] [CrossRef] [PubMed] [Green Version]
- Tran, T.T.; Mulchandani, A. Carbon nanotubes and graphene nano field-effect transistor-based biosensors. TrAC Trends Anal. Chem. 2016, 79, 222–232. [Google Scholar] [CrossRef] [Green Version]
- Sharifi, S.; Vahed, S.Z.; Ahmadian, E.; Dizaj, S.M.; Eftekhari, A.; Khalilov, R.; Ahmadi, M.; Hamidi-Asl, E.; Labib, M. Detection of pathogenic bacteria via nanomaterials-modified aptasensors. Biosens. Bioelectron. 2020, 150, 111933. [Google Scholar] [CrossRef]
- Oliveira, E.Y.S.; Bode, R.; Escárcega-Bobadilla, M.V.; Zelada-Guillén, G.A.; Maier, G. Polymer nanocomposites from self-assembled polystyrene-grafted carbon nanotubes. New J. Chem. 2016, 40, 4625–4634. [Google Scholar] [CrossRef]
- Zelada-Guillén, G.A.; Escárcega-Bobadilla, M.V.; Wegrzyn, M.; Giménez, E.; Maier, G.; Kleij, A.W. Enhanced conductivity for carbon nanotube based materials through supramolecular hierarchical self-assembly. Adv. Mater. Interfaces 2018, 5, 1701585. [Google Scholar] [CrossRef]
- Cha, J.; Kim, J.; Ryu, S.; Hong, S.H. Comparison to mechanical properties of epoxy nanocomposites reinforced by functionalized carbon nanotubes and graphene nanoplatelets. Compos. B Eng. 2019, 162, 283–288. [Google Scholar] [CrossRef]
- Li, Y.; Huang, X.; Zeng, L.; Liu, R.; Tian, H.; Fu, X.; Wuang, Y.; Zhong, W.H. A review of the electrical and mechanical properties of carbon nanofiller-reinforced polymer composites. J. Mater. Sci. 2019, 54, 136–1076. [Google Scholar] [CrossRef]
- Kumar, A.; Sharma, K.; Dixit, A.R. Carbon nanotube- and graphene-reinforced multiphase polymeric composites: Review on their properties and applications. J. Mater. Sci. 2020, 55, 2682–2724. [Google Scholar] [CrossRef]
- Goenka, S.; Sant, V.; Sant, S. Graphene-based nanomaterials for drug delivery and tissue engineering. J. Control. Release. 2014, 173, 75–88. [Google Scholar] [CrossRef] [PubMed]
- Cardano, F.; Frasconi, M.; Giordani, S. Photo-responsive graphene and carbon nanotubes to control and tackle biological systems. Front. Chem. 2018, 6, 102. [Google Scholar] [CrossRef] [PubMed] [Green Version]
- Cirillo, G.; Peitzsch, C.; Vittorio, O.; Curcio, M.; Farfalla, A.; Voli, F.; Dubrovska, A.; Iemma, F.; Kavallaris, M.; Hampel, S. When polymers meet carbon nanostructures: Expanding horizons in cancer therapy. Future Med. Chem. 2019, 11, 2205–2231. [Google Scholar] [CrossRef] [PubMed]
- Ramnani, P.; Saucedo, N.M.; Mulchandani, A. Carbon nanomaterial-based electrochemical biosensors for label-free sensing of environmental pollutants. Chemosphere 2016, 143, 85–98. [Google Scholar] [CrossRef] [PubMed] [Green Version]
- Liu, J.; Ye, Y.; Xue, Y.; Xie, X.; Mai, Y.W. Recent advances in covalent functionalization of carbon nanomaterials with polymers: Strategies and perspectives. J. Polym. Sci. Pol. Chem. 2017, 55, 622–631. [Google Scholar] [CrossRef] [Green Version]
- Nikdel, M.; Salami-Kalajahi, M.; Hosseini, M.S. Dual thermo- and pH-sensitive poly(2-hydroxyethyl methacrylate-co-acrylic acid)-grafted graphene oxide. Colloid Polym. Sci. 2014, 292, 2599–2610. [Google Scholar] [CrossRef]
- Roppolo, I.; Chiappone, A.; Boggione, L.; Castellino, M.; Bejtka, K.; Pirri, C.F.; Sangermano, M.; Chiolerio, A. Self-standing polymer-functionalized reduced graphene oxide papers obtained via a UV-process. RSC Adv. 2015, 5, 95805–95812. [Google Scholar] [CrossRef] [Green Version]
- Wong, S.S.; Joselevich, E.; Woolley, A.T.; Cheung, C.L.; Lieber, C.M. Covalently functionalized nanotubes as nanometer-sized probes in chemistry and biology. Nature 1998, 394, 52–55. [Google Scholar] [CrossRef] [Green Version]
- Arenas-García, J.; Escárcega-Bobadilla, M.V.; Zelada-Guillén, G.A. Grafting multiwalled carbon nanotubes with polystyrene to enable self-assembly and anisotropic patchiness. J. Vis. Exp. 2018, 134, e56267. [Google Scholar] [CrossRef]
- Anderson, G.W.; Zimmerman, J.E.; Callahan, F.M. Esters of N-hydroxysuccinimide in peptide synthesis. J. Am. Chem. Soc. 1964, 86, 1839–1842. [Google Scholar] [CrossRef]
- Lapidot, Y.; Rappoport, S.; Wolman, Y. Use of esters of N-hydroxysuccinimide in the synthesis of N-acylamino acids. J. Lipid Res. 1967, 8, 142–145. [Google Scholar] [PubMed]
- Nakajima, N.; Ikada, Y. Mechanism of amide formation by carbodiimide for bioconjugation in aqueous media. Bioconjugate Chem. 1995, 6, 123–130. [Google Scholar] [CrossRef] [PubMed]
- Eskandari, P.; Abousalman-Rezvani, Z.; Roghani-Mamaqani, H.; Salami-Kalajahi, M.; Mardani, H. Polymer grafting on graphene layers by controlled radical polymerization. Adv. Colloid Interface Sci. 2019, 273, 102021. [Google Scholar] [CrossRef]
- Roghani-Mamaqani, H.; Haddadi-Asl, V.; Khezri, K.; Zeinali, E.; Salami-Kalajahi, M. In situ atom transfer radical polymerization of styrene to in-plane functionalize graphene nanolayers: Grafting through hydroxyl groups. J. Polym. Res. 2014, 21, 333. [Google Scholar] [CrossRef]
- Liu, Y.; Meng, X.; Liu, Z.; Meng, M.; Jiang, F.; Luo, M.; Ni, M.; Qiu, J.; Liu, F.; Zhong, G. Preparation of a two-dimensional ion-imprinted polymer based on a graphene oxide-SiO2 composite for the selective adsorption of nickel ions. Langmuir 2015, 31, 8841–8851. [Google Scholar] [CrossRef] [PubMed]
- Yuan, W.; Wang, J.; Shen, T.; Ren, J. Surface modification of graphene oxide with thermoresponsive polymers via atom transfer radical polymerization: Transition from LCST to UCST. Mater. Lett. 2013, 107, 243–246. [Google Scholar] [CrossRef]
- Song, Y.; Lü, J.; Liu, B.; Lü, C. Temperature responsive polymer brushes grafted from graphene oxide: An efficient fluorescent sensing platform for 2,4,6-trinitrophenol. J. Mater. Chem. C 2016, 4, 7083–7092. [Google Scholar] [CrossRef]
- Sun, S.; Cao, Y.; Feng, J.; Wu, P. Click chemistry as a route for the immobilization of well-defined polystyrene onto graphene sheets. J. Mater. Chem. 2010, 20, 5605–5607. [Google Scholar] [CrossRef]
- Xu, G.; Xu, P.; Shi, D.; Chen, M. Modification of graphene oxide by a facile coprecipitation method and click chemistry for use as a drug carrier. RSC Adv. 2014, 4, 28807–28813. [Google Scholar] [CrossRef]
- Du, W.; Wu, H.; Chen, H.; Xu, G.; Li, C. Graphene oxide in aqueous and nonaqueous media: Dispersion behaviour and solution chemistry. Carbon 2019, in press. [Google Scholar] [CrossRef]
- Szabo, T.; Berkesi, O.; Forgo, P.; Josepovits, K.; Sanakis, Y.; Petridis, D.; Dekany, I. Evolution of surface functional groups in a series of progressively oxidized graphite oxides. Chem. Mater. 2006, 18, 2740–2749. [Google Scholar] [CrossRef]
- Jeon, I.Y.; Shin, Y.R.; Sohn, G.J.; Choi, H.J.; Bae, S.Y.; Mahmood, J.; Jung, S.M.; Seo, J.M.; Kim, M.J.; Chang, D.W.; et al. Edge-carboxylated graphene nanosheets via ball milling. Proc. Natl. Acad. Sci. USA 2012, 109, 5588–5593. [Google Scholar] [CrossRef] [PubMed] [Green Version]
- Jouikov, V.; Simonet, J. Efficient cathodic carboxylation of graphene. Electrochem. Commun. 2014, 43, 67–70. [Google Scholar] [CrossRef]
- Bjerglund, E.; Kongsfelt, M.; Shimizu, K.; Jensen, B.B.E.; Koefoed, L.; Ceccato, M.; Skrydstrup, T.; Pedersen, S.U.; Daasbjerg, K. Controlled electrochemical carboxylation of graphene to create a versatile chemical platform for further functionalization. Langmuir 2014, 30, 6622–6628. [Google Scholar] [CrossRef] [PubMed]
- Cortijo-Campos, S.; Alvarez-Fraga, L.; Goncalves, G.; Vila, M.; Alvarez, P.; Menendez, R.; De Andres, A.; Prieto, C. In-situ carboxylation of graphene by chemical vapor deposition growth for biosensing. Carbon 2019, 141, 719–727. [Google Scholar] [CrossRef]
- Lu, Q.; Jang, H.S.; Han, W.J.; Lee, J.H.; Choi, H.J. Stimuli-responsive graphene oxide-polymer nanocomposites. Macromol. Res. 2019, 27, 1061–1070. [Google Scholar] [CrossRef]
- Cui, K.; Li, G.; Wang, L.; Guo, W.; Pei, M. An ON/OFF Aptasensor for detection of AFB1 based on pH-sensitive polymer and GO composite. J. Electrochem. Soc. 2020, 167, 027508. [Google Scholar] [CrossRef]
- Su, Y.L.; Yu, T.W.; Chiang, W.H.; Chiu, H.C.; Chang, C.H.; Chiang, C.S.; Hu, S.H. Hierarchically targeted and penetrated delivery of drugs to tumors by size-changeable graphene quantum dot nanoaircrafts for photolytic therapy. Adv. Funct. Mater. 2017, 27, 1700056. [Google Scholar] [CrossRef]
- Wang, P.; Huang, C.; Xing, Y.; Fang, W.; Ren, J.; Yu, H.; Wang, G. NIR-light- and pH-responsive graphene oxide hybrid cyclodextrin-based supramolecular hydrogels. Langmuir 2019, 35, 1021–1031. [Google Scholar] [CrossRef]
- Pourjavadi, A.; Asgari, S.; Hosseini, S.H. Graphene oxide functionalized with oxygen-rich polymers as a pH-sensitive carrier for co-delivery of hydrophobic and hydrophilic drugs. J. Drug Deliv. Sci. Technol. 2020, 56, 101542. [Google Scholar] [CrossRef]
- Liu, Y.; Zhao, T.; Ju, W.; Shi, S. Materials discovery and design using machine learning. J. Materiomics 2017, 3, 159–177. [Google Scholar] [CrossRef]
- Cole, J.M. A Design-to-device pipeline for data-driven materials discovery. Acc. Chem. Res. 2020, 53, 599–610. [Google Scholar] [CrossRef] [PubMed]
- Shen, J.; Shi, M.; Ma, H.; Yan, B.; Li, N.; Hu, Y.; Ye, M. Synthesis of hydrophilic and organophilic chemically modified graphene oxide sheets. J. Colloid Interface Sci. 2010, 351, 366–370. [Google Scholar] [CrossRef] [PubMed]
- Jeon, O.; Bouhadir, K.H.; Mansour, J.M.; Alsberg, E. Photocrosslinked alginate hydrogels with tunable biodegradation rates and mechanical properties. Biomaterials 2009, 30, 2724–2734. [Google Scholar] [CrossRef] [PubMed]
- Lokuge, I.S.; Bohn, P.W. Voltage-tunable volume transitions in nanoscale films of poly(hydroxyethyl methacrylate) surfaces grafted onto gold. Langmuir 2005, 21, 1979–1985. [Google Scholar] [CrossRef]
- Mishra, S.; Ashaduzzaman, M.; Mishra, P.; Swart, H.C.; Turner, A.P.F.; Tiwari, A. Stimuli-enabled zipper-like graphene interface for auto-switchable bioelectronics. Biosens. Bioelectron. 2017, 89, 305–311. [Google Scholar] [CrossRef]
- Orth, E.S.; Ferreira, J.G.L.; Fonsaca, J.E.S.; Blaskievicz, S.F.; Domingues, S.H.; Dasgupta, A.; Terrones, M.; Zarbin, A.J.G. pKa determination of graphene-like materials: Validating chemical functionalization. J. Colloid Interface Sci. 2016, 467, 239–244. [Google Scholar] [CrossRef]


© 2020 by the authors. Licensee MDPI, Basel, Switzerland. This article is an open access article distributed under the terms and conditions of the Creative Commons Attribution (CC BY) license (http://creativecommons.org/licenses/by/4.0/).
Share and Cite
Noriega-Navarro, R.; Castro-Medina, J.; Escárcega-Bobadilla, M.V.; Zelada-Guillén, G.A. Control of pH-Responsiveness in Graphene Oxide Grafted with Poly-DEAEMA via Tailored Functionalization. Nanomaterials 2020, 10, 614. https://doi.org/10.3390/nano10040614
Noriega-Navarro R, Castro-Medina J, Escárcega-Bobadilla MV, Zelada-Guillén GA. Control of pH-Responsiveness in Graphene Oxide Grafted with Poly-DEAEMA via Tailored Functionalization. Nanomaterials. 2020; 10(4):614. https://doi.org/10.3390/nano10040614
Chicago/Turabian StyleNoriega-Navarro, Roxana, Jésica Castro-Medina, Martha V. Escárcega-Bobadilla, and Gustavo A. Zelada-Guillén. 2020. "Control of pH-Responsiveness in Graphene Oxide Grafted with Poly-DEAEMA via Tailored Functionalization" Nanomaterials 10, no. 4: 614. https://doi.org/10.3390/nano10040614