Article

Effective Detection of Nafion®-Based Theranostic Nanocapsules Through 19F Ultra-Short Echo Time MRI

by
Natalia Łopuszyńska
1,
Krzysztof Szczepanowicz
2,
Krzysztof Jasiński
1,
Piotr Warszyński
2 and
Władysław P. Węglarz
1,*
1
Institute of Nuclear Physics, Polish Academy of Sciences, 31–342 Krakow, Poland
2
Institute of Catalysis and Surface Chemistry, Polish Academy of Sciences, 30–239 Krakow, Poland
*
Author to whom correspondence should be addressed.
Nanomaterials 2020, 10(11), 2127; https://doi.org/10.3390/nano10112127
Submission received: 9 September 2020 / Revised: 9 October 2020 / Accepted: 18 October 2020 / Published: 26 October 2020
(This article belongs to the Special Issue Functional Polymeric Nanoparticles)

Abstract

:
The application of the Three-Dimensional Ultra-Short Echo Time (3D UTE)pulse sequence at a high magnetic field for visualization of the distribution of 19F loaded theranostic core-shell nanocapsules with Nafion® (1,1,2,2-tetrafluoroethene; 1,1,2,2-tetrafluoro-2- [1,1,1,2,3,3-hexafluoro-3-(1,2,2-trifluoroethenoxy)propan-2-yl] oxyethanesulfonic acid) incorporated into the shell is presented. The nanocarriers were formed via the layer-by-layer technique with biodegradable polyelectrolytes: PLL (Poly-L-lysine), and with Nafion®: polymer with high 19F content. Before imaging, an MR (magnetic resonance) spectroscopy and T1 and T2 measurements were performed, resulting in values of T2 between 1.3 ms and 3.0 ms, depending on the spectral line. To overcome limitations due to such short T2, the 3D UTE pulse sequence was applied for 19F MR imaging. First Nafion® solutions of various concentrations were measured to check the detection limit of our system for the investigated molecule. Next, the imaging of a phantom containing core-shell nanocapsules was performed to assess the possibility of visualizing their distribution in the samples. Images of Nafion® containing samples with SNR ≥ 5 with acquisition time below 30 min for 19F concentration as low as 1.53 × 10⁻² mmol 19F/g of sample, were obtained. This is comparable with the results obtained for molecules, which exhibit more preferable MR characteristics.

Graphical Abstract

1. Introduction

Since the results of the first study demonstrating the feasibility of fluorine magnetic resonance imaging (19F MRI) were published in 1977 [1], rapid advances in both MRI hardware and software allowed for the development and investigation of various applications of 19F MRI. The main research directions included the imaging of fluorinated drugs, cell tracking, inflammation imaging and cancer diagnostics, the developing of oxygen-sensing and -responsive probes, and designing targeted fluorinated imaging agents. Those applications were extensively described and their results were summarized in many reviews [2,3,4,5,6].
There are several preferable physical, chemical and biological properties making 19F MRI a potentially promising method for tracing theranostic agents—i.e., with combined therapeutic and diagnostic functionality. Gyromagnetic ratio of 19F nucleus is very close to the 1H value (40.08 vs. 42.58 MHz/T), which means that those spins process almost at the same resonance frequency (376.75 vs. 400.25 MHz at 9.4 T), allowing for the use of 1H MR hardware and software instrumentation with only a minimal adjustment for the 19F imaging [5]. Moreover, 19F has a natural abundance of 100%, resulting in nuclear magnetic resonance (NMR) receptivity (an overall NMR sensitivity of a nucleus at natural abundance) of 0.83 relative to 1H. The close to zero natural concentration of 19F nuclei in the human body makes fluorine atoms a perfect MRI marker without any natural background signal. This creates the opportunity of localizing and identifying only exogenous fluorinated compounds with 100% specificity of the signal, assuring excellent contrast-to-noise ratio. To track the distribution of 19F labeled therapeutics in an anatomical context, the 19F MRI results are overlaid over the conventional 1H image acquired in the same imaging session
Nafion® is a fluorinated polymer—high molecular weight, negatively charged molecule—which is relatively easy to incorporate it into nanocapsule shell via the layer by layer method [7,8]. From a synthesis point of view, this creates an excellent opportunity for designing a highly repetitive and efficient process for the production of theranostic nanocarriers for drug delivery. However, taking into consideration MR imaging, there are several issues making the visualization of the spatial distribution of Nafion®-containing nanocarriers in the sample challenging. Those challenges are complex, multipeak 19F NMR spectrum composed of relatively broad lines in order of 1–2 ppm which correspond to short (in range of single milliseconds) transverse magnetization decay.
The occurrence of multiple resonances in the 19F MR spectrum leads to chemical shift artifacts in 19F images, i.e., multiple, spatially shifted images in frequency encoding direction. While the simplest approach to avoid it is choosing molecules with multiple identical fluorine atoms, such as perfluoro-15-crown-5-ether (PFCE), using them it is not always straightforward due to their chemical properties. Alternatively, methods for compensation of unwanted resonance signals can be applied and, in some cases, if one of the resonances is separated enough from others, the compensation may be entirely omitted [9,10,11].
As many of the available 19F compounds exhibit short (in range of single milliseconds) transverse relaxation time, the choice of an adequate imaging sequence is of the utmost importance. There are only a few commercially available sequences allowing for the effective imaging of 19F fast-relaxing components. Those include the ultrashort echo time (UTE) or its 3D implementation (3D UTE) and the zero-echo time (ZTE) imaging sequences. Both sequences allow for the preservation of the signal from rapid-relaxing components, as they require very little time for preparation, maximizing the time for sampling [12,13]. Therefore, the optimization of imaging parameters of such sequences allows for the visualization of 19F compounds with less preferable characteristics.
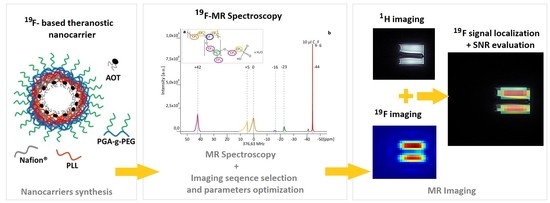
The present work has aimed to assess the possibility to use 3D UTE pulse sequences (Figure 1) at a high magnetic field for visualization of the distribution of 19F loaded theranostic nanocapsules with Nafion® molecules incorporated into the shell. The presented work and [8] present complementary parts of the research. While [8] is focused on nanocapsule synthesis and characterization, this paper provides the extensive description of MR imaging and spectroscopy experiments for both Nafion® solution and Nafion®-loaded nanocapsules, which were accomplished in order to optimize the 19F MRI-based visualization of the nanocapsules distribution.

2. Materials and Methods

Nafion® polymer (1,1,2,2-tetrafluoroethene;1,1,2,2-tetrafluoro-2-[1,1,1,2,3,3-hexafluoro-3- (1,2,2-trifluoroethenoxy)propan-2-yl] oxyethanesulfonic acid) is anionic polymer that is synthesized by the copolymerization of a perfluorinated vinyl ether comonomer with tetrafluoroethylene (TFE), resulting in the chemical structure given in Figure 2a [14,15].
The Nafion® molecule has five fluorine nuclei groups that give rise to multiple signals in the MR spectrum. The structure of a Nafion® unit illustrates the variability of the material—i.e., unreported by a vendor co-monomer distribution of molecular groups x and y that results in differences in 19F signal strength arising from a specified fluorine group from one synthesis to another.
The material used in experiments was Nafion® 20 wt. % solution in lower aliphatic alcohols and water (663492 Sigma-Aldrich; Poznań, Poland)). The stock solution was first used to acquire a full 19F MR spectrum and to measure T1 and T2 relaxation times. Next, a series of Nafion® dilutions in water with varied concentration were prepared to estimate the minimal number of 19F nuclei in a sample that can be visualized in reasonable scan time. Hexafluorobenzene purchased from Sigma Aldrich was used as a reference substance.
For theranostic nanocapsule synthesis, the polycation poly-L-lysine hydrobromide, PLL (MW 15 to 30 kDa) and polyanion: NAFION® (663492), as well as chloroform, sodium chloride and docusate sodium salt (AOT), were purchased from Sigma-Aldrich. All materials were used as received without further purification. The ultrapure water was produced using the Millipore Direct-Q5 UV Merck purification system.
All samples for MRI measurements were prepared in vials with micro-inserts containing a reference substance.

2.1. Polyelectrolyte Shell Liquid Core Nanocapsules Preparation and Characterization

The polyelectrolyte shell liquid core nanocapsules were prepared adopting the procedure proposed by us before [7]—i.e., by the encapsulation of nanoemulsion droplets in the polyelectrolyte multilayer shell. The details of the preparation procedure are given in [8]. Briefly, the oil phase for the nano emulsification was prepared by dissolving anionic surfactant AOT in chloroform at the concentration 340 g/L, while the water phase was prepared by dissolving poly-L-Lysine in 0.015 M NaCl solution (concentration varied from 10 to 300 ppm). The liquid core of capsules (nanoemulsion droplets) was formed by dispersing oil phase (0.1 mL) into the water phase (200 mL of polycation solution) during mixing with a magnetic stirrer at the rate 300 rpm. On such prepared liquid cores, the multilayer shell was formed by the subsequent adsorption of polyelectrolytes. After preparation, chloroform was evaporated with the final CHCl3 concentration not exceeding 0.04 mg/L [16].

2.2. MRI Equipment

Both 19F MR spectroscopy/relaxation measurements, as well as 1H and 19F 3DUTE imaging, were performed at the 9.4 T Bruker Biospec 94/20 research MRI scanner (Bruker Biospin, Ettlingen, Germany) with 210 mm bore diameter and high performance actively shielded BGA 12S HP gradient system (675 mT/m) with integrated shims. A small transmit-receive ribbon solenoid radiofrequency (RF) coil (ID of 14 mm), which can be tuned either to 1H or 19F resonant frequency (i.e., 400.130 vs. 376.498 MHz) was built and used for all experiments. Coil geometry was adjusted individually to analyzed sample size and shape to maximize the filling factor and thus Signal-To-Noise Ratio (SNR) values. Paravision 5.1 and Topspin 2.0 software was used to accomplish MR imaging and spectroscopy.

2.3. 19F Spectroscopy and Relaxometry

Prior to the imaging, an MR spectroscopy (with a 17 μs 90° pulse and SW: 59.52 kHz) and T1 and T2 measurements were performed in order to choose the peak with the largest area and consequently the highest NMR signal and to set imaging sequence parameters to values enabling an optimal visualization of Nafion® molecule distribution.
The T1 measurement was performed in TopSpin 2.0 (Bruker Biospin, Ettlingen, Germany) using the pseudo-2D version of a standard Inversion Recovery experiment exploiting an array of 10 different inversion recovery (IR) experiments with different inversion time values (0.15, 0.30, 0.75, 1.5, 3.0, 6.0 s). T2 values for individual resonances were estimated by calculating the reciprocal of their full width at half maximum (FWHM) values.

2.4. 3D UTE Pulse Sequence

Conventional MRI pulse sequences generate relatively long echo times (>> 1ms). Therefore, the majority of the signal from short transverse relaxation time components decays to near zero before echo formation or even during RF pulse excitation. The 3D Ultrashort TE sequence allows for measuring very short T2 compounds, because of non-selective RF excitation pulse [17,18], and the minimum echo time (TE) is limited only by RF pulse duration and the time necessary to change between RF excitation and acquisition mode. A timing diagram for a 3D UTE sequence is presented in Figure 1. Sampling is performed from the start of the rising gradient ramp; thus, it begins always in the center of a k-space and continues to the surface of a sphere. The image reconstruction is performed by regridding from radial k-space on a Cartesian grid followed by a conventional 3D fast Fourier transformation.

2.5. 3D UTE Imaging

The application of 3D UTE to actual experiments requires performing a preparation specific for this method, including gradient delay optimization and k-space trajectory measurement. The optimal gradient delay was determined using a glass sphere phantom filled with an aqueous solution of CuSO4 positioned in the isocenter of the scanner. Imaging with a gradient delay value of 1 µs resulted in the most homogenous image with the least apparent artifacts. The k-space trajectory was measured using the same phantom and stored to be used during actual imaging experiments. As the measured trajectory is valid only for specific scanning parameters (given matrix size, field of view, slice orientation, and acquisition bandwidth), thus this adjustment was repeated for each FOV and matrix size planned to be used in an imaging experiment.
The 3D UTE sequence was first applied to Nafion® solutions of a different concentration. Imaging parameters were as follows: repetition time (TR): 8 ms, TE: 0.16 ms, RF pulse bandwidth (BW): 4.27 kHz, FOV: 4.0 × 4.0 × 4.0 cm3. For 1H images: matrix size ( MTX): 128 × 128 × 128 and number of averages (NA):: 1, resulting in total acquisition time ∼6m 51s, while for 19F images: MTX: 32 × 32 × 32, NA: 64 and acquisition time: ∼27 m6 s. The flip angle (FA) was set to 6.4° according to the modified Ernst angle formula to account for the effects of a transverse relaxation during the RF excitation [3].
Subsequently, the imaging of a phantom containing theranostic nano-carriers was performed with imaging parameters, as follows: TR: 8 ms, TE: 0.16 ms, FA: 6.4°, RF pulse BW: 4.27 kHz, FOV: 4.0 × 4.0 × 4.0 cm. For 1H images: MTX: 128 ×128 × 128 and NA: 1, acquisition time ∼ 6 m 51 s, while for 19F images: MTX: 32 × 32 × 32, NA: 256 or 500 and acquisition time: ∼ 1 h 48 min 24 s and ∼ 3 h 31 m 44 s, respectively.

3. Results

The theranostic nanocapsules with liquid core and polyelectrolyte shells composed with PLL and Nafion were prepared using the layer by layer method and a saturation technique. The details of the preparation and characterization procedure are given in [8]. For the present study, nanocapsules containing two Nafion® layers were chosen. The sizes of those theranostic nanocapsules measured by the dynamic light scattering method were ~150 nm. The final particle concentration determined by nanoparticle tracking analysis was ∼ 1.5 × 10¹² nanocapsules/mL [8].

3.1. 19F MR Spectroscopy

Figure 2 shows the example of obtained 19F spectrum of NAFION® with five visible resonances. These signals were assigned to chemical groups containing equivalent fluorine nuclei. T1 and T2 relaxation times of individual groups, as well as half-widths of spectral lines and chemical groups assignment, are presented in Table 1. To estimate the number of 19F nuclei contributing to each resonance, 10 µL C6F6 was used as a reference.
The structure of a Nafion® unit is shown on the inset in Figure 2a. To estimate the minimum concentration of Nafion®, giving a sufficient amount of signal to perform imaging on a single peak, the MR spectroscopy of a series of solutions, with decreased Nafion® concentrations, was performed. Basing on a difference in 42 ppm peak area for subsequent concentrations, the estimation of a number of 19F nuclei in 1 ml of the sample giving a signal to the image was made. Using equivalent weight formula EW = 100x + 446 [14], and EW value 1100 g/mole, we calculated the average x length in the Nafion® molecule (Figure 2a). Assuming the average length of x chain was 6.6, the approximate molar concentration of Nafion® was calculated (Table 2).
To check if the incorporation of Nafion into nanocapsules alters the 19F spectrum, the MR spectroscopy was also performed for nanocapsules. Results were compared with the spectrum obtained for the Nafion solution and no significant shifts of peaks positions were observed (Figure 3). However, the peak broadening (between 1.5 to 2 times for the main peaks at 42 ppm and 0 ppm, respectively) is observed for sample with nanocapsules which correspond to faster decaying free induction decay (FID) (T2 in order 1–1.5 ms) available for imaging.

3.2. MR Imaging

In order to obtain good quality images, with the least apparent artifacts, a peak at +42 ppm was chosen for imaging experiments due to the relatively high MR signal and being well separated from the other resonances. Results of MR imaging are shown in Figure 4. SNR was calculated as a quotient of the mean signal intensity in the area of interest and the mean signal intensity measured with an entirely attenuated (150.00 dB) RF pulse. For a sample with an initial 20% Nafion® solution, SNR value for NA = 64 was higher than 600; therefore, imaging with only one average would still produce an image with SNR in order of 80. For the lowest analyzed concentration, imaging within a reasonable acquisition time of less than 30 min produced an image with SNR = 5, which is still sufficient to reliably determine the spatial distribution of 19F nuclei in a sample.
Next, the imaging of a phantom containing core-shell nanocapsules with Nafion® incorporated in one of the shell layers was performed to check the possibility of visualizing the distribution of complete theranostic carriers in samples.
The 3D UTE imaging of theranostic nanocapsules with total acquisition time ∼ 1 h 48 min (256 averages) gave SNR = 12, which was high enough for visualization of the 19F distribution (see [8]). Increasing the number of averages to 500 (acq. time: ∼ 3 h 32 min) caused improvement in SNR to ∼ 20 (Figure 5), which also improves the visualization of finer details of the 19F distribution, as illustrated in Figure 5.

4. Discussion

The most frequently reported substances in 19F MRI studies are perfluorocarbons (especially nanoemulsions of PFOB and PFCE). Depending on the chosen PFC and an MRI system that is used, the estimated number of 19F nuclei that can be visualized in a scan time below 1 hour is in the range of ∼1016 of 19F nuclei/voxel [19,20]. Nonetheless, different chemical forms, such as liposomes, micelles or 19F modified implants, have also been investigated. The application of liposomal structures for drug delivery was shown by Bo et al. [21]. The authors synthesized Doxorubicin (DOX)-loaded liposomes with high 19F content for use as 19F detectable drug-delivery at the therapeutic dose. They obtained a structure that resulted in a single 19F resonance line and a detection limit as low as 5 mmol of 19F for a scan time = 6 m 24 s. Other studies using various 19F copolymers for application as 19FMRI detectable tracers (spin-echo imaging with TE = 4.8 ms, TR = 3000 ms, and total imaging time restricted to 80 min) allowed the authors to obtain images with SNR values in the range from 3.9 to 6.9 (for samples with 2.3–9.3 mmol 19F/g concentration) [22]. Yet, the total scan time of that range is one of the limiting factors to introduce those substances to clinical applications.
As the NMR signal is proportional to field strength, high field systems provide higher SNR than typical clinical scanners enabling the imaging of 19F nuclei at very low concentrations. It is desirable that tracers should be characterized by the high fluorine content, simple 19F NMR spectrum, with a single, sharp, and intense peak, short T1 and long T2 [23]. Nevertheless, due to advances in MRI instrumentation, and ultrashort echo pulse sequence development, the range of fluorine compounds available as a new MRI marker can be expanded, including one with less optimal characteristics, but easier to incorporate into theranostic nanocapsules. The use of high field equipment in preclinical imaging, as well as a tendency towards increasing the magnetic field of clinical MRI scanners, pave the way for use of a broader range of 19F compounds as a tracer.
As the signal from 19F compounds is usually only a little above the detection limits, the low SNR is the biggest challenge in 19F imaging. To achieve a sufficient SNR value, a compromise between spatial resolution and total scan time must be made. Collecting the signal with multiple averages causes an increase in signal intensity by the factor of N A , but at the same time, total scan time scales directly with NA. Another option to increase SNR is sampling a larger volume, which results in loss of spatial resolution. However, the use of a high-resolution 1H MR image as an anatomical framework for the presentation of the 19F-compound distribution alleviates this inconvenience.
In the presented work we managed to obtain 19F MR images of polyelectrolyte theranostic nanocapsules containing Nafion® polymer as a tracer, with SNR ≥ 5 and an acquisition time below 30 min, for 19F concentration as low as 1.53 × 10⁻² mmol 19F/g of sample. This is comparable with the results obtained for molecules that are theoretically more suitable for application as 19F MRI tracers.
In our previous work, the effective contrasting properties of iron oxides and gadolinium-based compounds were effectively tested for the visualization of the distribution of the polyelectrolyte theranostic nanocapsules, using 1H MR imaging [24,25]. The possibility to use the 19F-containing Nafion® compound, which is relatively easy to incorporate into a nanocapsule’s layers, broadens the potential applicability of these theranostic nanocarriers. The use of a 3D UTE pulse sequence at a high magnetic field of 9.4T allows for effective imaging of the presence of nanocapsules with Nafion® incorporated into their shell. This indicates the possibility to use this approach in preclinical research, for the potential imaging of the in vivo distribution of nanocarriers, without a background signal, as is in the case with 1H MRI.

5. Conclusions

We showed that the application of the 3DUTE sequence at high field makes heteronuclear UHF MRI a promising tool for the assessment of theranostic nanocarriers distribution, even in the case of molecules without a single, narrow 19F spectrum line. We obtained 19F MR images of the Nafion® polymer containing samples with SNR ≥ 5 and with an acquisition time below 30 min for 19F concentrations as low as 1.53 × 10⁻² mmol 19F/g of a sample. This is comparable with the results obtained for molecules that are theoretically more suitable for applications as 19F MRI tracers. The obtained results show the potential possibility to use this approach for the assessment of nanocarrier distribution in preclinical research or clinical applications performed at a high magnetic field MRI.

Author Contributions

Conceptualization—W.P.W., P.W.; Methodology—W.P.W., K.J.; Investigation—N.Ł., K.J.; Resources—K.S., P.W., W.P.W.; Data Curation—N.Ł.; Writing—original draft preparation—N.Ł.; Writing—review and editing—W.P.W., K.S., P.W.; Visualization—N.Ł.; Supervision—W.P.W., P.W.; Funding Acquisition—P.W. All authors have read and agreed to the published version of the manuscript.

Funding

This work was supported by NCN (Poland) OPUS project no. UMO-2015/17/B/ST5/02808. Natalia Łopuszyńska acknowledges the support of InterDokMed project no. POWR.03.02.00-00-I013/16.

Conflicts of Interest

The authors declare no conflict of interest.

References

  1. Holland, G.; Bottomley, P.; Hinshaw, W. 19F magnetic resonance imaging. J. Magn. Reson. 1977, 28, 133–136. [Google Scholar] [CrossRef]
  2. Staal, X.; Koshkina, O.; Srinivas, M. In vivo 19-fluorine magnetic resonance imaging. Fluor. Life Sci. Pharm. Med. Diagn. Agrochem. 2019, 2019, 397–424. [Google Scholar] [CrossRef]
  3. Chen, J.; Lanza, G.M.; Wickline, S.A. Quantitative magnetic resonance fluorine imaging: Today and tomorrow. Wiley Interdiscip. Rev. Nanomed. Nanobiotechnol. 2010, 2, 431–440. [Google Scholar] [CrossRef] [PubMed] [Green Version]
  4. Bober, Z.; Aebisher, D.; Ożóg, Ł.; Tabarkiewicz, J.; Tutka, P.; Bartusik-Aebisher, D. 19F MRI as a tool for imaging drug delivery to tissue and individual cells. Eur. J. Clin. Exp. Med. 2017, 15, 109–119. [Google Scholar] [CrossRef]
  5. Diou, O.; Tsapis, N.; Giraudeau, C.; Valette, J.; Gueutin, C.; Bourasset, F.; Zanna, S.; Vauthier, C.; Fattal, E. Long-circulating perfluorooctyl bromide nanocapsules for tumor imaging by 19FMRI. Biomaterials 2012, 33, 5593–5602. [Google Scholar] [CrossRef]
  6. Knight, J.C.; Edwards, P.G.; Paisey, S. Fluorinated contrast agents for magnetic resonance imaging; a review of recent developments. RSC Adv. 2011, 1, 1415. [Google Scholar] [CrossRef]
  7. Szczepanowicz, K.; Hoel, H.J.; Szyk-Warszynska, L.; Bielańska, E.; Bouzga, A.M.; Gaudernack, G.; Simon, C.; Warszynski, P. Formation of Biocompatible Nanocapsules with Emulsion Core and Pegylated Shell by Polyelectrolyte Multilayer Adsorption. Langmuir 2010, 26, 12592–12597. [Google Scholar] [CrossRef]
  8. Szczepanowicz, K.; Łopuszyńska, N.; Tomal, W.; Jasiński, K.; Węglarz, W.P.; Warszynski, P.; Szczepanowicz, K.P. Nafion® based nanocarriers for 19F-MR Imaging. Langmuir 2020, 36, 9534–9539. [Google Scholar] [CrossRef]
  9. Srinivas, M.; Cruz, L.J.; Bonetto, F.; Heerschap, A.; Figdor, C.G.; De Vries, I.J.M. Customizable, multi-functional fluorocarbon nanoparticles for quantitative in vivo imaging using 19F MRI and optical imaging. Biomaterials 2010, 31, 7070–7077. [Google Scholar] [CrossRef]
  10. Lee, H.K.; Nalcioglu, O.; Buxton, R.B. Correction for chemical-shift artifacts in 19F imaging of PFOB: Simultaneous multislice imaging. Magn. Reson. Med. 1991, 21, 21–29. [Google Scholar] [CrossRef]
  11. Lee, H.K.; Nalcioglu, O.; Buxton, R.B. Correction of chemical-shift artifacts in 19F imaging of PFOB: A robust signed magnitude method. Magn. Reson. Med. 1992, 23, 254–263. [Google Scholar] [CrossRef]
  12. Schmid, F.; Höltke, C.; Parker, D.; Faber, C. Boosting 19F MRI-SNR efficient detection of paramagnetic contrast agents using ultrafast sequences. Magn. Reson. Med. 2012, 69, 1056–1062. [Google Scholar] [CrossRef] [PubMed]
  13. Weiger, M.; Pruessmann, K.P.; Hennel, F. MRI with zero echo time: Hard versus sweep pulse excitation. Magn. Reson. Med. 2011, 66, 379–389. [Google Scholar] [CrossRef]
  14. Mauritz, K.A.; Moore, R.B. State of Understanding of Nafion. Chem. Rev. 2004, 104, 4535–4586. [Google Scholar] [CrossRef]
  15. Lee, J.H.; Doo, G.; Kwon, S.H.; Choi, S.; Kim, H.-T.; Lee, S.G. Dispersion-Solvent Control of Ionomer Aggregation in a Polymer Electrolyte Membrane Fuel Cell. Sci. Rep. 2018, 8, 10739. [Google Scholar] [CrossRef] [PubMed] [Green Version]
  16. Łukasiewicz, S.; Szczepanowicz, K. In Vitro Interaction of Polyelectrolyte Nanocapsules with Model Cells. Langmuir 2014, 30, 1100–1107. [Google Scholar] [CrossRef] [PubMed]
  17. Rahmer, J.; Börnert, P.; Groen, J.; Bos, C. Three-dimensional radial ultrashort echo-time imaging with T2 adapted sampling. Magn. Reson. Med. 2006, 55, 1075–1082. [Google Scholar] [CrossRef] [PubMed]
  18. Robson, M.D.; Gatehouse, P.D.; Bydder, M.; Bydder, G.M. Magnetic Resonance: An Introduction to Ultrashort TE (UTE) Imaging. J. Comput. Assist. Tomogr. 2003, 27, 825–846. [Google Scholar] [CrossRef]
  19. Srinivas, M.; Boehm-Sturm, P.; Figdor, C.G.; De Vries, I.J.; Hoehn, M. Labeling cells for in vivo tracking using 19F MRI. Biomaterials 2012, 33, 8830–8840. [Google Scholar] [CrossRef] [PubMed]
  20. Partlow, K.C.; Chen, J.; Brant, J.A.; Neubauer, A.M.; Meyerrose, T.E.; Creer, M.H.; Nolta, J.A.; Caruthers, S.D.; Lanza, G.M.; Wicldine, S.A. 19F magnetic resonance imaging for stem/progenitor cell tracking with multiple unique perfluorocarbon nanobeacons. FASEB J. 2007, 21, 1647–1654. [Google Scholar] [CrossRef] [PubMed]
  21. Bo, S.; Yuan, Y.; Chen, Y.; Yang, Z.; Chen, S.; Zhou, X.; Jiang, Z.-X. In vivo drug tracking with 19F MRI at therapeutic dose. Chem. Commun. 2018, 54, 3875–3878. [Google Scholar] [CrossRef] [PubMed]
  22. Nurmi, L.; Peng, H.; Seppälä, J.; Haddleton, D.M.; Blakey, I.; Whittaker, A.K. Synthesis and evaluation of partly fluorinated polyelectrolytes as components in 19F MRI-detectable nanoparticles. Polym. Chem. 2010, 1, 1039. [Google Scholar] [CrossRef]
  23. Tirotta, I.; Dichiarante, V.; Pigliacelli, C.; Cavallo, G.; Terraneo, G.; Bombelli, F.B.; Metrangolo, P.; Resnati, G. 19F Magnetic Resonance Imaging (MRI): From Design of Materials to Clinical Applications. Chem. Rev. 2014, 115, 1106–1129. [Google Scholar] [CrossRef]
  24. Szczepanowicz, K.; Piechota, P.; Węglarz, W.P.; Warszyński, P. Polyelectrolyte nanocapsules containing iron oxide nanoparticles as MRI detectable drug delivery system. Colloids Surfaces A Physicochem. Eng. Asp. 2017, 532, 351–356. [Google Scholar] [CrossRef]
  25. Szczęch, M.; Karabasz, A.; Łopuszyńska, N.; Bzowska, M.; Węglarz, W.P.; Warszyński, P.; Szczepanowicz, K. Gadolinium labeled polyelectrolyte nanocarriers for theranostic application. Colloids Surfaces B Biointerfaces 2019, 183, 110396. [Google Scholar] [CrossRef] [PubMed]
Figure 1. Three-Dimensional UTE Imaging pulse sequence diagram.
Nanomaterials 10 02127 g001
Figure 2. (b) 19F MR spectrum of original Nafion® used as a source for further sample preparation with C6F6 used as a reference. Different colors correspond to individual chemical groups, as marked on chemical structure (a).
Nanomaterials 10 02127 g002
Figure 3. Comparison of acquired 19F MR spectra of Nafion® loaded nanocapsules (NA = 5800) and solution (sample N1, NA = 256). The corresponding fluorine concentrations (in terms of the number of 19F molecules per 1 mL of the sample) were 2.8 × 10¹⁸ and 1.5 × 10²⁰, respectively.
Nanomaterials 10 02127 g003
Figure 4. MR Imaging results. Series of 1H and 19F axial images with absolute intensities as displayed on bars. First column 1H MR Images of Nafion® solutions of a different concentration; second column: corresponding 19F MR images and (third column) an overlay of 1H and 19F images. Parameters of UTE3D sequence TR: 8 ms, TE: 0.16 ms, FA: 6.4°, RF pulse length: 0.3 ms, FOV: 4.0 cm, NA:1 or 64 (for 1H or 19F) MTX: 128 × 128 × 128 or 32 × 32 × 32 (1H/19F), total acquisition time: ∼ 6 m 51 s/27 m 6 s(1H/19F).
Nanomaterials 10 02127 g004
Figure 5. (a) 1H MR Image of a phantom containing nanocapsules (UTE3D, FOV: 4.0 cm, MTX 128, NA:1), (b) corresponding 19F MR image (UTE3D, FOV: 4.0 cm, MTX: 32, NA: 500) and (c) an overlay of 1H and 19F images.
Nanomaterials 10 02127 g005
Table 1. Observed resonances with chemical groups assignment and calculated T1 and T2 relaxation times of individual peaks.
Chemical Shift (ppm)Corresponding Chemical GroupsFWHM (Hz)T1 (ms)T2 (ms)
+42OCF2, OCF2, CF34839092.1
+5CF2, CF2, SCF27396911.4
0(CF2)a7897331.3
−16CF (II)6407751.6
−23CF (I)3298643.0
Table 2. Estimated number of 19F nuclei in 1 ml of the sample based on peak area changes.
Sample Relative Concentration of 20% Nafion® Solution in H2O (mL)Number of 19F Nuclei in 1 mL of the Sample Giving a Signal in + 42 ppm PeakTotal Number of 19F Nuclei in 1 mL of the Sample Estimated Concentration
(mM)
N01.0006.4 × 1020 2.1 × 10²¹ 88.50
N10.1004.5 × 1019 1.5 × 10²⁰ 6.32
N20.0106.0 × 1018 2.0 × 10¹⁹ 0.84
N30.0052.8 × 1018 9.2 × 10¹⁸ 0.39
Publisher’s Note: MDPI stays neutral with regard to jurisdictional claims in published maps and institutional affiliations.

