Article

A Mathematical Analysis of Maria Valtorta’s Mystical Writings

by
Emilio Matricciani
1,* and
Liberato De Caro
2
1
Dipartimento di Elettronica, Informazione e Bioingegneria, Politecnico di Milano, Piazza L. da Vinci, 32, 20133 Milan, Italy
2
Istituto di Cristallografia, Consiglio Nazionale delle Ricerche (IC-CNR), Via Amendola 122/O, 70126 Bari, Italy
*
Author to whom correspondence should be addressed.
Religions 2018, 9(11), 373; https://doi.org/10.3390/rel9110373
Submission received: 2 November 2018 / Revised: 13 November 2018 / Accepted: 14 November 2018 / Published: 19 November 2018

Abstract

:
We have studied the very large amount of literary works written by the Italian mystic Maria Valtorta to assess similarities and differences in her writings, because she claims that most of them are due to mystical visions. We have used mathematical and statistical tools developed for specifically studying deep linguistic aspects of texts. The general trend indicates that the literary works explicitly attributable to Maria Valtorta differ significantly from her other literary works, which she claims are attributable to the alleged characters Jesus and Mary. Mathematically, they seem to have been written by different authors. The comparison with the Italian literature is very striking. A single author, namely Maria Valtorta, seems to be able to write texts so diverse as to cover the entire mathematical range (suitably defined) of the Italian literature spanning seven centuries.

1. Introduction

The history of Christianity has always been characterized by mystics, people who say they have had direct talks with Jesus, visions of Mary and saints, and have knowledge of future and past events. Faced with these phenomena, any scientific verification would seem impossible. There are, moreover, psychic pathologies that cause hallucinations, visions, psycho-somatic phenomena that also influence the religious lives of people. For this reason, we usually tend to reduce all mystical phenomena to the sphere of faith or psychic pathologies and, always, we abandon any idea of scientific research.
In recent years, however, it has been demonstrated that, in some favourable circumstances, a scientific approach can be used to analyse the writings of mystics, with unexpected results. Indeed, in some recent works (Matricciani and De Caro 2017; De Caro 2014, 2015, 2017), a series of studies carried out on the writings of an Italian mystic of the 20th century, Maria Valtorta, are summarized. Her writings, concerning the life of Jesus, have the peculiarity of containing a large amount of historical, biblical, geographical, archaeological, even astronomical and meteorological information, hardly attributable to the skills of the author, who received an education certainly higher than the average of her times, but surely not enough to justify what emerged from a careful analysis of her writings.
In this paper, we analyse her writings to assess similarities and differences that allegedly are due to mystical visions and dictations of Jesus, Mary, her guardian angel, the Father, and the Holy Spirit. This is her religious claim. We have therefore performed a mathematical analysis of her writings, to be not influenced by any a priori assumption about what she writes.
We have used mathematical and statistical tools developed for specifically studying deep linguistic aspects of literary texts, such as the readability index, the number of characters per word, the number of words per sentence, the number of punctuation marks per sentence and the number of words per punctuation marks, known as the word interval, all peculiar to a writer’s style. Our innovative approach allows assessing, from a probabilistic point of view, similarities and differences in her many different writings. Our findings show that she has written so radically diverse texts, mathematically speaking, that, as shown in the following, no author has been able to do in seven centuries of Italian literature.
After this Introduction, Section 2 summarizes Maria Valtorta’s life and lists her writings; Section 3 recalls only some simple mathematical parameters used in the text analysis, reporting detailed formulae and analytical data in technical appendices; Section 4 reports and discusses the statistical results of Maria Valtorta’s writings; Section 5 discusses the results of Kolmogorov−Smirnov test for comparing probability distributions; Section 6 compares, with Euclidean distances, Maria Valtorta’s writings and shows where they are located in the framework of the Italian literature; and finally Section 7 draws some conclusions.

2. Maria Valtorta’s Life and Literary Production

To give an idea of her school education and skills let us briefly reassume some biographical information. Maria Valtorta (Valtorta 1997; Pisani 2010) was born on 14 March 1897 in Caserta, the only daughter of parents from Lombardy, a marshal of the 19th Cavalry Regiment, at that time stationed in Caserta, and a French teacher, Iside Fioravanzi. Because of the frequent transfers of the family, caused by the Regiment different stationing, she spent her first years in Faenza (Romagna) and later in Milan (Lombardy), where she attended a nursery school with the Ursuline nuns. Still in Milan, Maria Valtorta started the elementary school with the Marceline nuns and then finished the primary formation in the municipal school of Voghera (Piedmont). There she learned French from some nuns. At the age of 12 she entered the Collegio Bianconi in Monza (Lombardy), held by the Sisters of Maria Ss. Bambina, where she received an education comparable to that of the first years of classical high school, remaining there for 4 years.
In 1917, in the middle of World War I, she entered the body of the voluntary Samaritan nurses, which took care of wounded soldiers in military hospitals. In 1920, her back received a stroke by a subversive, a fact that predisposed her to illness and sufferings that would mark the rest of her life, making her semi−paralyzed from the waist down in later years. In 1924, her parents bought a house in Viareggio (Tuscany), where the family settled down. There, in the parish, Maria Valtorta became a delegate of culture for the young people of the Catholic Action. Her physical conditions worsened quickly and, on 4 January 1933, she left home for the last time. From Easter 1934, she was bedridden until her death on 12 October 1961.
At the beginning of 1943, Father Rumualdo Migliorini (1884–1953), who was her spiritual director from 1942 to 1946, asked her to write an autobiography. Sitting in bed, writing on her knees, Maria Valtorta filled seven notebooks (of the kind used at that time at school), in less than two months, producing 760 manuscript pages, a fact that shows her writing skills. It is, in fact, a work written in fluent and excellent Italian that reflects the level of culture of the author and her personal literary style (Valtorta 1997).
This text, however, is of a completely different nature of those that she would start writing few months later. On 23 April 1943, Good Friday1, Maria Valtorta began to write texts on notebooks, while listening to a “voice” already known to her spirit. It was mainly the voice of Jesus and, from that moment on, her mystical locutions and visions began. The visions concerned mainly the life of Jesus. Gifted with a very good memory—witnessed by Marta Diciotti, her servant maid (Diciotti in Centoni 1987, p. 230)—and invited to do so by Jesus himself (Diciotti in Centoni 1987, p. 309), she noted everything she was watching, hearing, and smelling (Diciotti in Centoni 1987, p. 224), writing the speeches of the many characters that animated the visions, describing the places where they took place (Hopfen 1995). At least this is what Maria Valtorta said. Father Migliorini invited her to go on, writing everything she would “hear” or “see”, including the date of the vision (Diciotti in Centoni 1987, p. 303). He continuously furnished her the notebooks in which to write. She wrote without making any corrections, incessantly (Diciotti in Centoni 1987, p. 42), some days for several hours without any break, with several fountain pens always filled with ink (Diciotti in Centoni 1987, p. 229) on her knees, while she became exhausted by sufferings of every kind—even at night when she had to rest–almost every day until 1947, and later intermittently till 1951. In the end, she filled 122 notebooks (over 13,000 pages), excluding the seven notebooks of her Autobiography previously cited.
She did not prepare outlines and drafts, and had no books to consult except the Bible and the Catechism of Pius X (Diciotti in Centoni 1987, pp. 304, 311). In fact, it was not for her to decide when, and for how long, she would receive dictations and visions. Even if visitors interrupted the visions, they would restart after the visitors went away, and just from the point where they had stopped (Diciotti in Centoni 1987, p. 309). In any case, Maria Valtorta was always aware of what she was watching, hearing, or even smelling the scent of flowers, as if she were physically present at the site. She did not stop writing even when, because of airstrikes, she was forced to move to a small village near Lucca, Sant’Andrea di Compito, away from her loved house in Viareggio, from April to December 1944.
In spite of daily mystical experiences, Maria Valtorta did not estrange herself from the world, but followed important events through newspapers and radio. For example, in the 1948 political elections, very important for the recently proclaimed Republic of Italy, she wanted to be taken to the poll site by ambulance, to fulfil her duty as a Christian and Italian citizen. She usually received visiting friends and did not neglect correspondence, despite her busy mystical writing. To any visitor she appeared as a normal person, though seriously ill and bedridden. She even did domestic work that could be done while seated in bed, such as embroidering or cleaning vegetables.
In her last years, until her death in 1961, she estranged herself from the world. In 1956 signs of psychic detachment started, which lead in a short time to total incommunicability. In one of her letters to the Carmelite Mother Teresa Maria (Valtorta 2006g)—part of her correspondence is published (Valtorta 2006f, 2006g, 2006h)—she confided to have offered all her life, sufferings, even her intellect to God. It is touching that in June 1956 (Diciotti in Centoni 1987, p. 385) when she received the first voluminous printed copy of her writings she did not show any sign of joy or interest, from her who had fought so much for publishing them anonymously with the Catholic Church imprimatur (which was not given). In all these years, she was lovingly assisted and served by Maria Diciotti, who recorded on tape memories of the years working with the Valtorta family, reported in the mentioned book (Diciotti in Centoni 1987). Maria Valtorta died in the morning of Thursday, 12 October 1961, at the age of 64, after 27 and half years of being bedridden with much suffering.
From her writings, various publications have been compiled. The main work, in 10 volumes, entitled The Gospel as Revealed to Me, referred to as the EMV2, concerns mainly, as already mentioned, the public life of Jesus (Valtorta 2001). Its chapters3 were mostly written in the years 1943 to 1946. Some of the last episodes are dated up to 1951. Literally high, the work describes landscapes, environments, people, events, with rare vivacity, and delineates characters and narrative situations with introspective skill. The work is particularly rich in environmental narrative elements, customs, rites, and cultural aspects of the Jewish and Greco−Roman world of the time when Jesus of Nazareth lived.
Curiously, in writing this work Maria Valtorta has not always followed the sequential order of the events narrated. Several episodes are written outside the linear plot of the narration, and later Jesus himself would indicate her where they had to be inserted. Even though there are several flash–forwards, nevertheless the EMV has a perfectly organic and coherent structure, from the first to the last page, and involves about 700 major and minor characters (Hopfen 1995).
Indeed, in her writings there are many narrative elements that convey chronological information, like days of worship rest, references to major Jewish holy days, market days, seasons, and months related both to the Jewish lunar–solar and Julian calendars used 2000 years ago in the Holy Land under the Roman Empire. No date, however, is stated explicitly with respect to the Julian calendar. We find also many references to the moon in the night sky (moon phases), to planets, constellations, weather conditions, all narrative elements that enrich the events of Jesus’ life described, so detailed that they seem to be real data, as if they were recorded by a careful observer present at the scene. The astronomical data contained in Valtorta’s work are so accurate that they have allowed for pursuing several scientific investigations on them and deriving dates for every episode of Jesus’ life narrated (De Caro 2014, 2015, 2017; Matricciani and De Caro 2017; La Greca and De Caro 2017).
However, in the 122 notebooks, there are not only the episodes now published in the EMV, but also many other mystic writings. Maria Valtorta has, in fact, intercalated the writings on the main work with a huge amount of pages on various topics, now published in other books: (Valtorta 2006a, 2006b, 2006c, 2006e, 2007)4 and Lessons on the Epistle of St. Paul to the Romans5 (Valtorta 2006d). Nevertheless, when extracted from her notebooks, the EMV episodes regarding Jesus’ and Mary life have a perfectly organic and coherent structure, from the first to the last page. Without reporting any explicit date, they imply an accurate chronology, reconstructed by an astronomical analysis (De Caro 2014, 2015, 2017; Matricciani and De Caro 2017) from Maria Valtorta’s descriptions of night skies that enrich her narration. These episodes, collected and reordered following the indication given by Jesus to Maria Valtorta herself, constitute the main opera—the EMV—published in 10 volumes (about 5000 pages). In the main opera, and especially in the Notebooks, there are many dictations and monologues addressed personally to Maria Valtorta by Jesus or Mary. In Azariah, Maria Valtorta’s guardian angel, Azariah, dictates her theological and spiritual comments on the readings of 58 holiday masses. In the Lessons on the Epistle of St. Paul to the Romans, the Holy Author dictates her, 48 lessons on the Epistle to the Romans.
To get an idea of her literary production, it suffices to consider the 10 volumes of about 5000 total pages that make up the EMV. However, it is not only the large quantity of pages to impress the reader. As already noted, the EMV contains a lot of information on the historical time when Jesus lived, so detailed and precise to give the impression of reading the report of an eyewitness of the events narrated, occurring in the Holy Land two thousand years ago. This is the unexplained conclusion of the astronomical and meteorological analysis of a large amount of data reported in her work (Matricciani and De Caro 2017; De Caro 2014, 2015, 2017). It would be very interesting and useful if scholars of other disciplines studied her writings such as, for example, archeology and ancient history.
In this paper, our goal, more limited, is to study and assess fundamental statistics concerning her writings, that is to saysome deep linguistic characteristics of the speeches and sayings of fundamental characters acting in the EMV and in the Notebooks—such as Jesus and his mother Mary–, and the two self–consistent books Azariah and Romans. In the EMV Jesus tells many more parables (46) and more sermons and speeches (77) to crowds than those reported in the canonical Gospels. Moreover, outside the plot of Jesus’ public−life visions, Jesus and Mary, as mentioned, speak directly to Maria Valtorta, addressing her with monologues that she carefully wrote. The monologues−dictations are easily singled out because they always start with the incipit “Dice Gesù” (“Jesus says”) and “Dice Maria” (“Mary says”). The parables, sermons and speeches are also easily singled out by carefully reading the EMV.
The analysis of these texts should be as unbiased and objective as possible. This can be done by using mathematical tools that are not known or perceived, a priori, by the writer, as those discussed in (Matricciani 2018) for the Italian literature spanning seven centuries. The aim of our particular textual and linguistic analysis, conducted mathematically for the first time on Maria Valtorta’s writings, is meant to verify whether she might have affected the texts of the alleged characters of the EMV.
If we credit what Maria Valtorta says, that real persons, not invented by her, have pronounced all these different texts, then it should be possible to start examining this claim by using unbiased tools, such as mathematical and statistical tools. Indeed, as for Maria Valtorta considered a direct author, we can analyse her Autobiography (Valtorta 1997)—written before any visions and dictations—and the many detailed descriptions of landscapes, roads, towns etc., written in the EMV. Therefore, these latter texts can be taken as a reference to which any other text could be compared. The hypothesis that we want to test is whether there are texts not directly ascribable to her personal linguistic skills and style, both measured mathematically using significant linguistic variables (Matricciani 2018). In fact, the involvement of the subject of a mystical experience and the influence of her knowledge and culture in what she sees, hears, perceives, is never null. Rather it depends on the kind of mystical experience that she lives. Indeed, the subject is more or less active with her intelligence, memory, knowledge, as a function of the specific mystical experience.
After these general remarks, the question that arises is how the style of writing, which is peculiar to each person, culture, school education and so on, can influence what mystics write. If there were mystics’ writings showing linguistic skills and style very different, mathematically extending in a very large range (suitably defined), then this fact may give some hints on the nature of the claim about the alleged mystical experience. Thanks to its hugeness, Maria Valtorta’s literary production constitutes an ideal test bench for this research.
Before proceeding with the mathematical/statistical analysis of Maria Valtorta’s writings, in the next section we will summarize what are the useful mathematical parameters that can be extracted from literary texts.

3. Some Mathematical Parameters of Text Analysis

Statistics of languages are usually calculated by counting characters, words, sentences, and word rankings (Grzybeck 2007). Some of these parameters are also the main “ingredients” of readability formulae, mathematical tools that measure quantifiable textual characteristics, mainly the length of words and sentences. According to these formulae, different texts can be compared automatically to assess their differences. Readability indices allow matching texts to expected readers by avoiding over difficulty and inaccessible texts, or oversimplification, and are based on quantities that any writer (or reader) can calculate directly, easily, by means of the same tool used for writing (e.g., WinWord). Every readability formula, however, gives a partial measurement of reading difficulty because its result is mainly linked to words and sentences length. It gives no clues as to the correct use of words, to the variety and richness of the literary expression, to its beauty or efficacy. The comprehension of a text is the result of many other factors, the most important being reader’s culture and sensibility.
Besides the ingredients of readability formulae (sentences and words), another very important parameter, never considered before, is the word interval I P (Matricciani 2018), defined as the average number of words between two successive punctuation marks. There is, in fact, an interesting and striking empirical connection with the short–term memory of readers, the latter described by Miller’s “ 7 2 law” (Miller 1955). In fact, the word interval is spread in the same range of Miller’s law and, if converted into a time interval through an average reading speed, it is spread in the same range of time that the immediate memory needs to record the stimulus for later memorizing it in the short–term memory (Matricciani 2018).
In this paper, therefore, we use both the readability formula for Italian (and its components) and the word (and time) interval for studying the statistical characteristics of Maria Valtorta’s different writings mentioned above. Our aim is to assess whether all writings show the same statistics, so that we can assign their authorship to a single writer, Maria Valtorta herself, or different statistics so that we can assign their authorship to the allegedly characters of the EMV. The reliability of our assessing is based on standard tests of statistical confidence.
For Italian, the most used formula, known with the acronym GULPEASE (Lucisano and Piemontese 1988; Matricciani 2018) is given by:
G = 89 G C + G F
where
G C = 10 × c p
G F = 300 × f p
The numerical values of Equation (1) can be interpreted, for people educated in Italian schools, as a readability index of Italian, as a function of the number of years of school attended (Figure 1 of Matricciani 2018). The larger G , the more readable the text is; p is the total number of words in the text considered, c is the number of letters contained in the p words, and f is the number of sentences contained in the p words. Equation (1) says that a text, with the same amount of words, is more difficult to read if f / p is small, that is to say, if sentences are long and the number of characters per word C P = c / p is large (words are long). Long sentences mean that the reciprocal value (the number of words per sentence) P F = p / f = 300 / G F is large; therefore, if there are many words in a sentence, G F decreases and thus G decreases. G F is referred to as the syntactic index, G C as to the semantic index. In other words, a text is easier to read if it contains short words and short sentences, a known result applicable to readability formulae of any language. However, the semantic index G C , and the syntactic index G F , affect very differently the final value of G (Equation (1)).
As shown by (Matricciani 2018), in Italian the number of characters per word C P has been very stable over many centuries, so that the semantic index G C changes very little from author to author. On the contrary, the syntactic index G F changes significantly. In other words, the readability of a text using (1) is practically due only to the syntactic index G F , therefore, to the number of words per sentence. Each author has his own “dynamics”, in the sense that the length of sentences can be modulated much more than the length of words.
An interesting comparison among different authors and their literary works can also be done by considering the number of words per punctuation mark, that is to say the average number of words between two successive punctuation marks, a random variable that is the word interval I p mentioned before, defined by:
I P = p / i
This parameter is very robust against changing habits in the use of punctuation marks throughout decades. It is important because it sets the size of the short−term memory capacity that the reader (or the listener) should have to read (listen to) the literary work more easily (Matricciani 2018).
Of great interest is also the connected time interval I T , defined by:
I T = 60 × I P / v
with v the reading speed measured in words per minute and I T in seconds.
These two intervals describe, respectively, the capacity and response time of the short–term memory that the reader/listener should have. The response time is the time that the short–term memory can use for processing information. The longer the two intervals are, the more powerful the short−term memory.

4. Statistical Results on Maria Valtorta’s Writings

Table 1 lists the average values of G , G C e G F and their standard deviations found in Maria Valtorta’s writings recalled in Section 2. Table 2 lists the average value and standard deviations of the number of text characters per word ( C P ) , the number of words per sentence ( P F ) , the number of punctuation marks per sentence ( M F ) (this parameter indicates, also, the number of word intervals per sentence), and the number of words per punctuation markes, that is the word interval ( I P ) . There are also single results concerning some letters, addressed to the alleged Jesus, found in the EMV, which will be discussed in Section 6. All the statistical parameters have been calculated by weighting any text block with its number of words, so that longer blocks weigh statistically more than shorter ones. The standard deviation of each text is referred to text blocks of 1000 words so that different texts can be compared, as done by (Matricciani 2018). Notice that M F I P = P F , C P = G C / 10 .
Just like the findings concerning the Italian literature (Matricciani 2018), G C varies much less than G F , therefore the alleged authors of Maria Valtorta’s writings can modulate the length of sentences, P F , much more than the number of characters per word, C P 
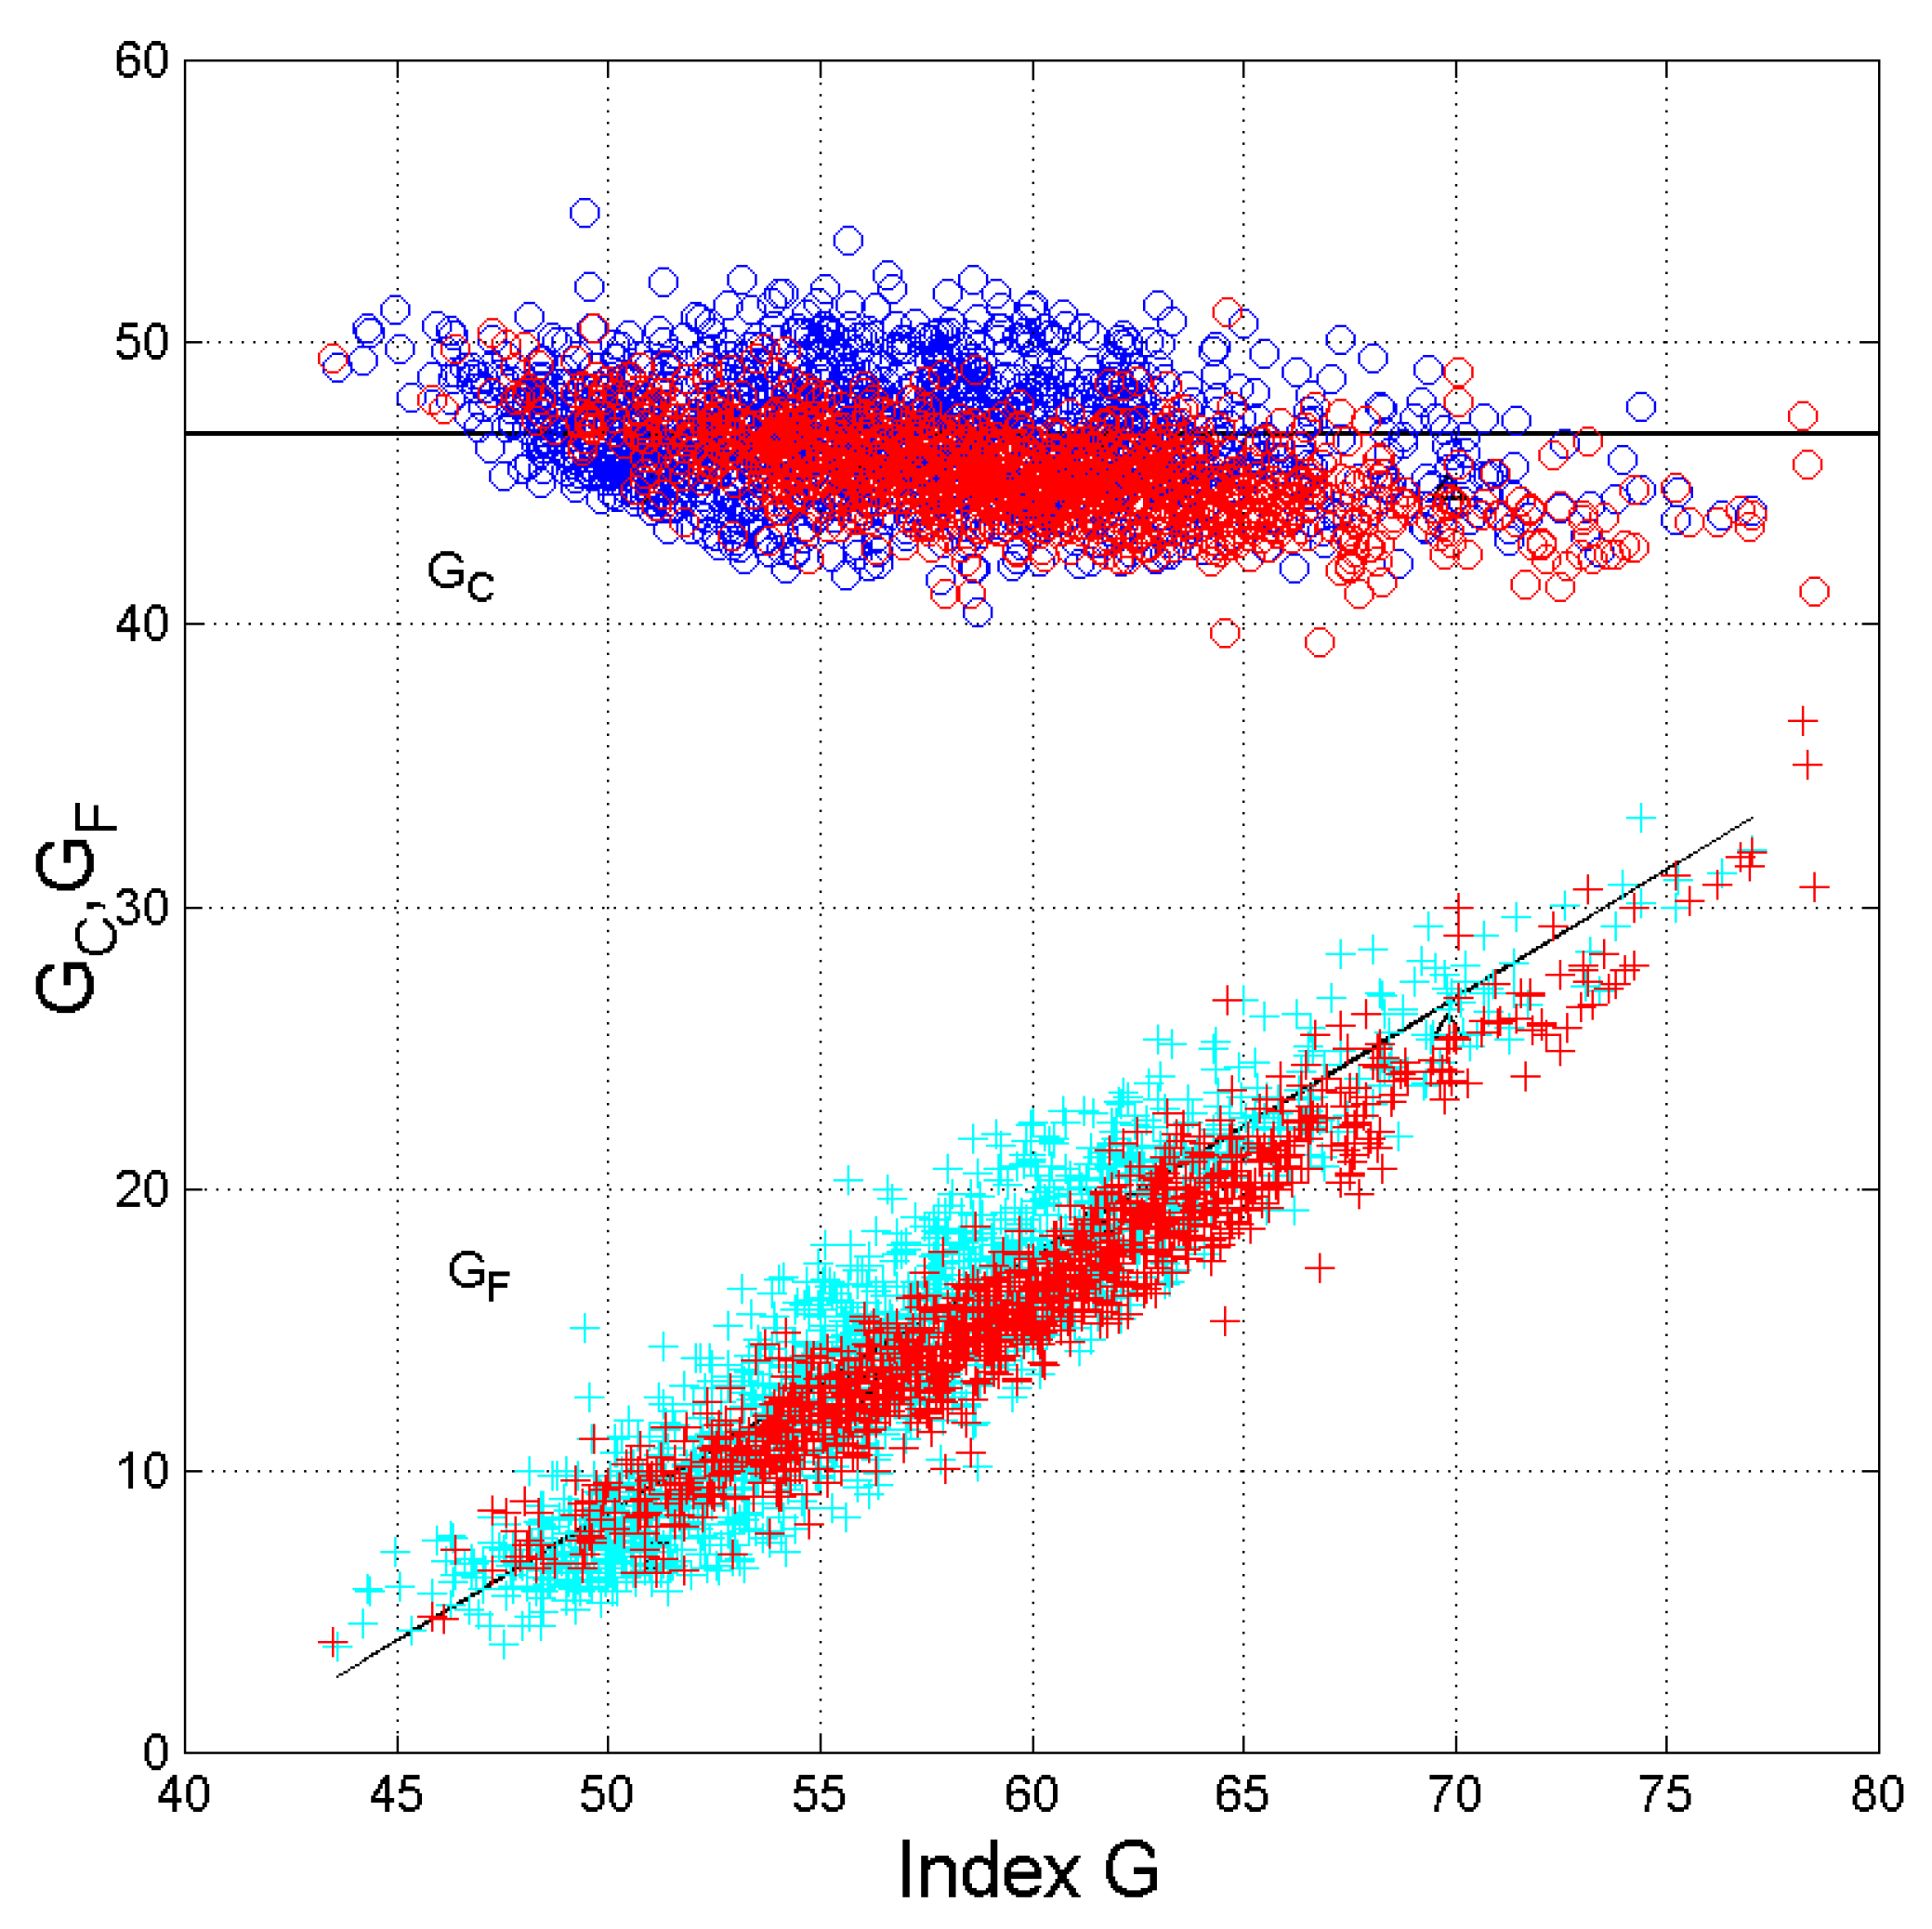
. This is clearly visible in Figure 1, which shows the overall results concerning the singles text blocks of the literary texts listed in Table 1, superposed to those concerning seven centuries of Italian literature (
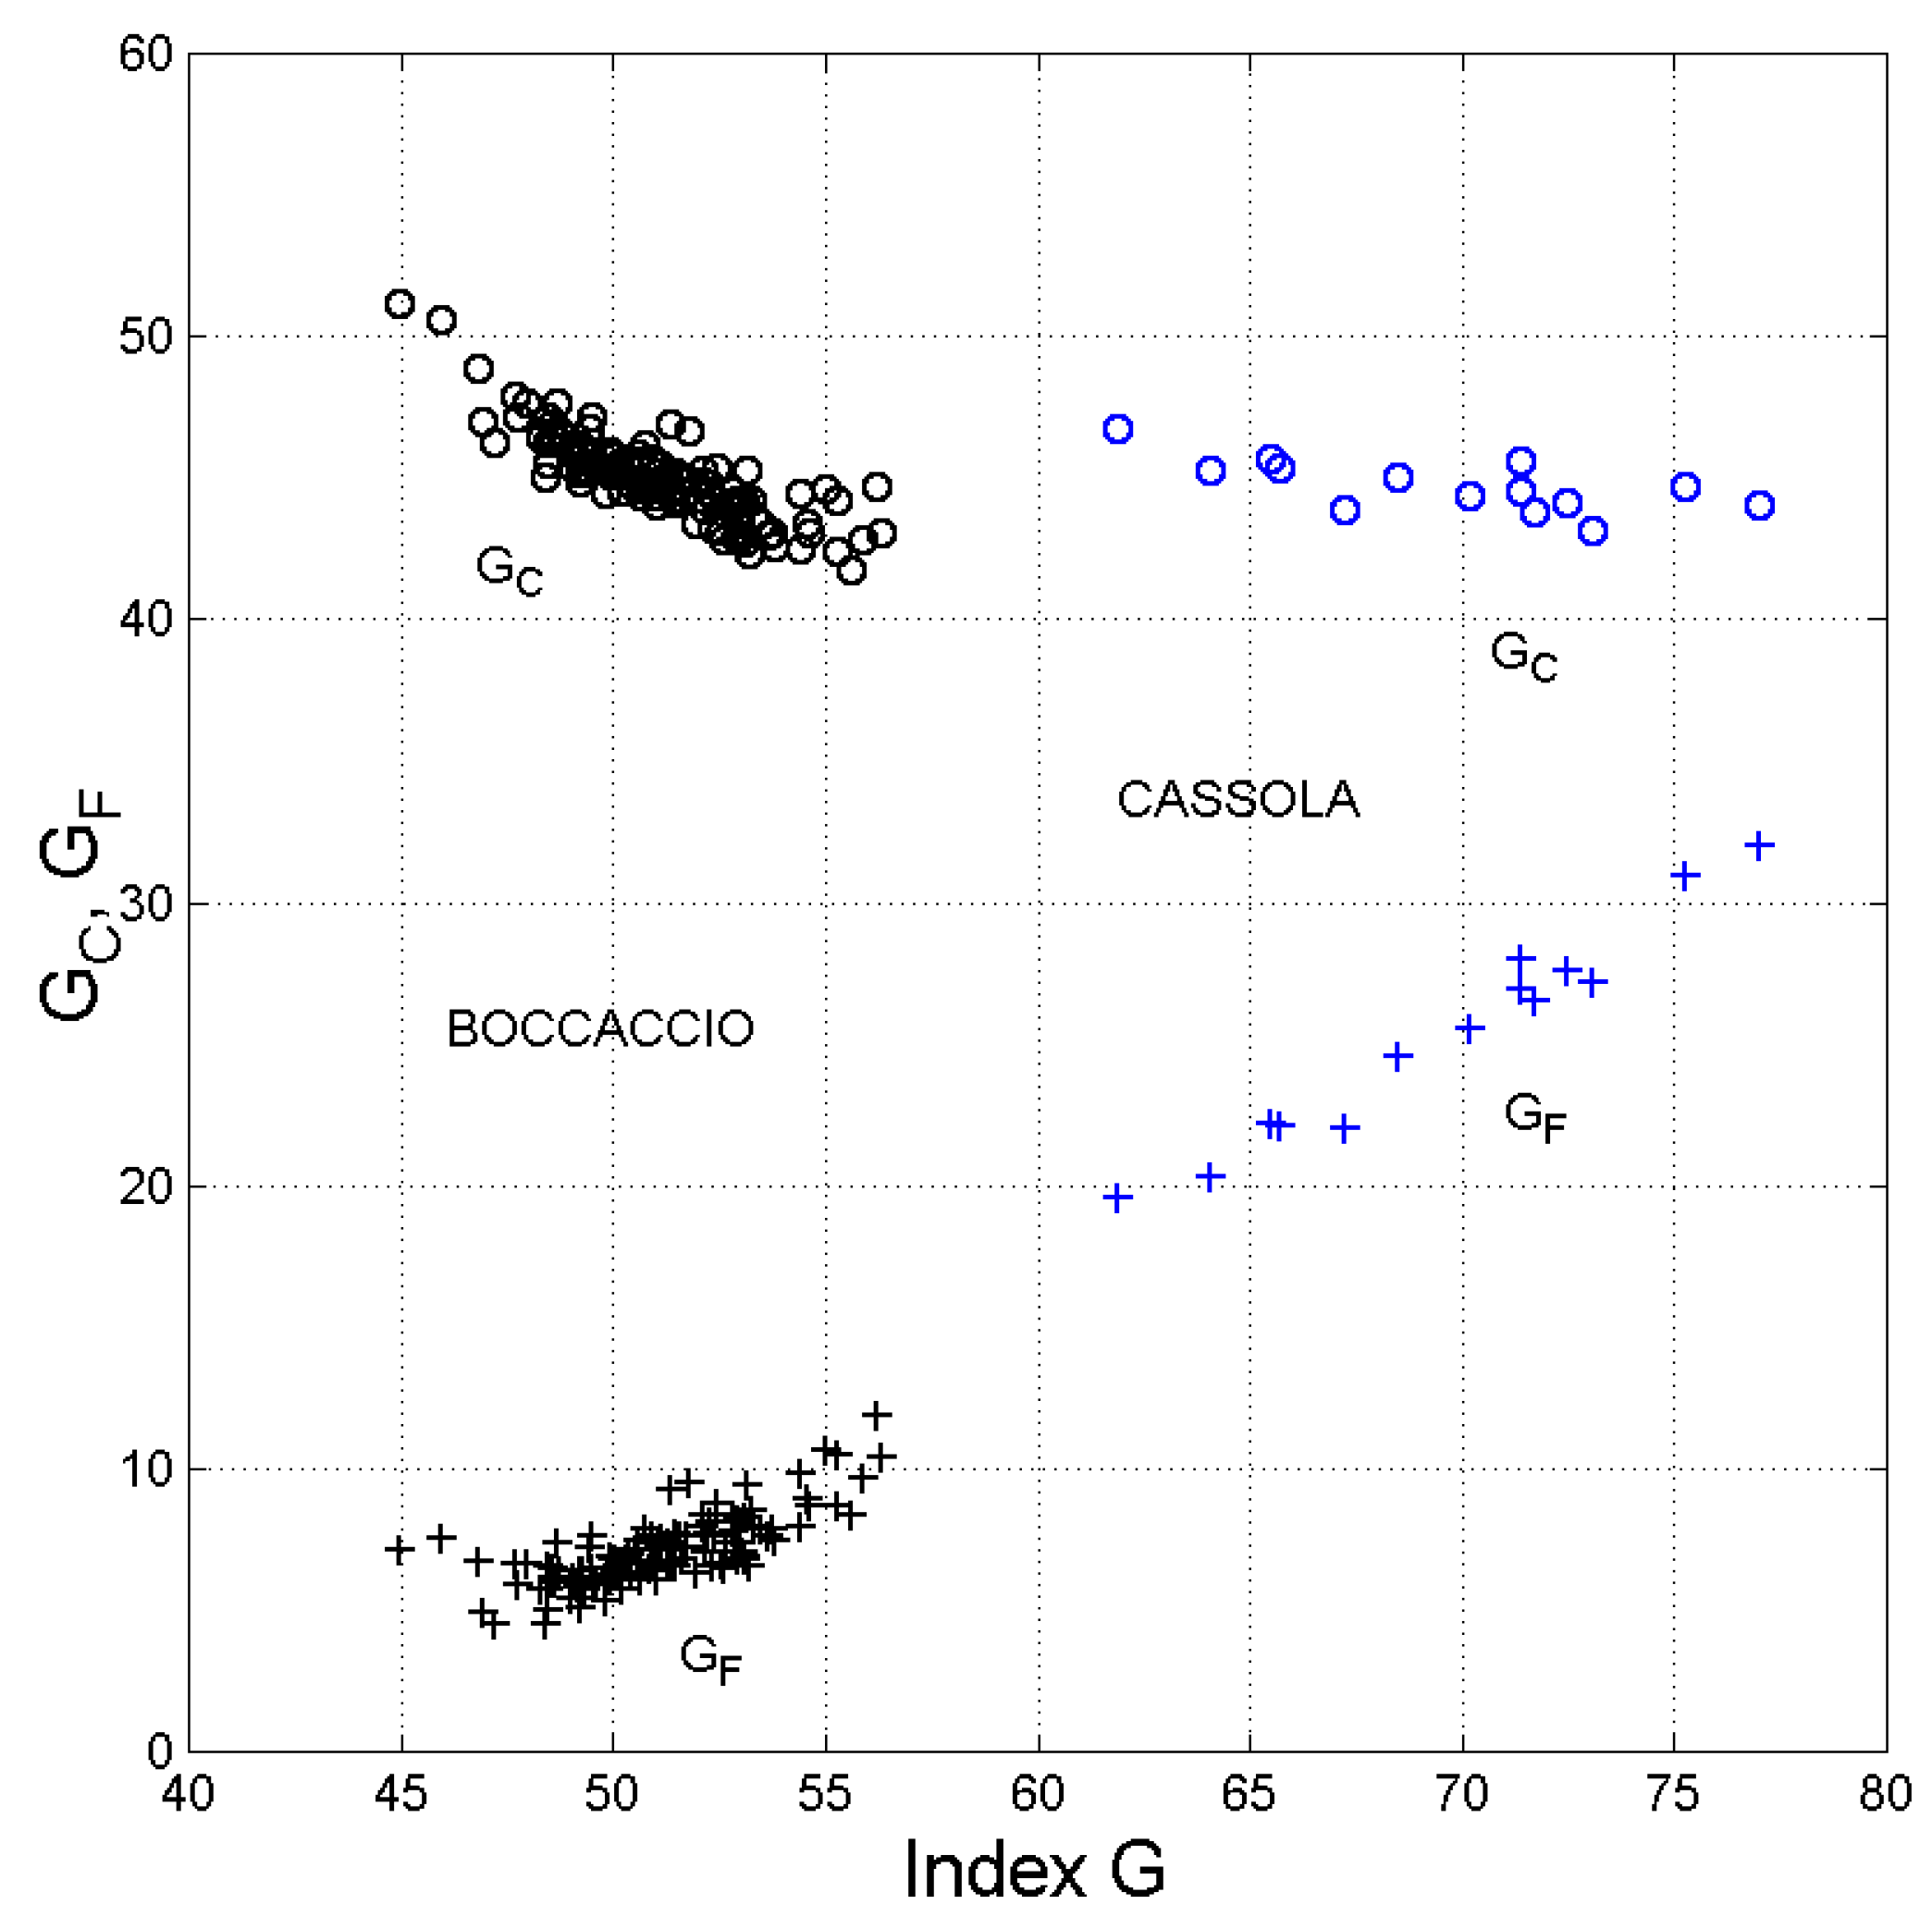
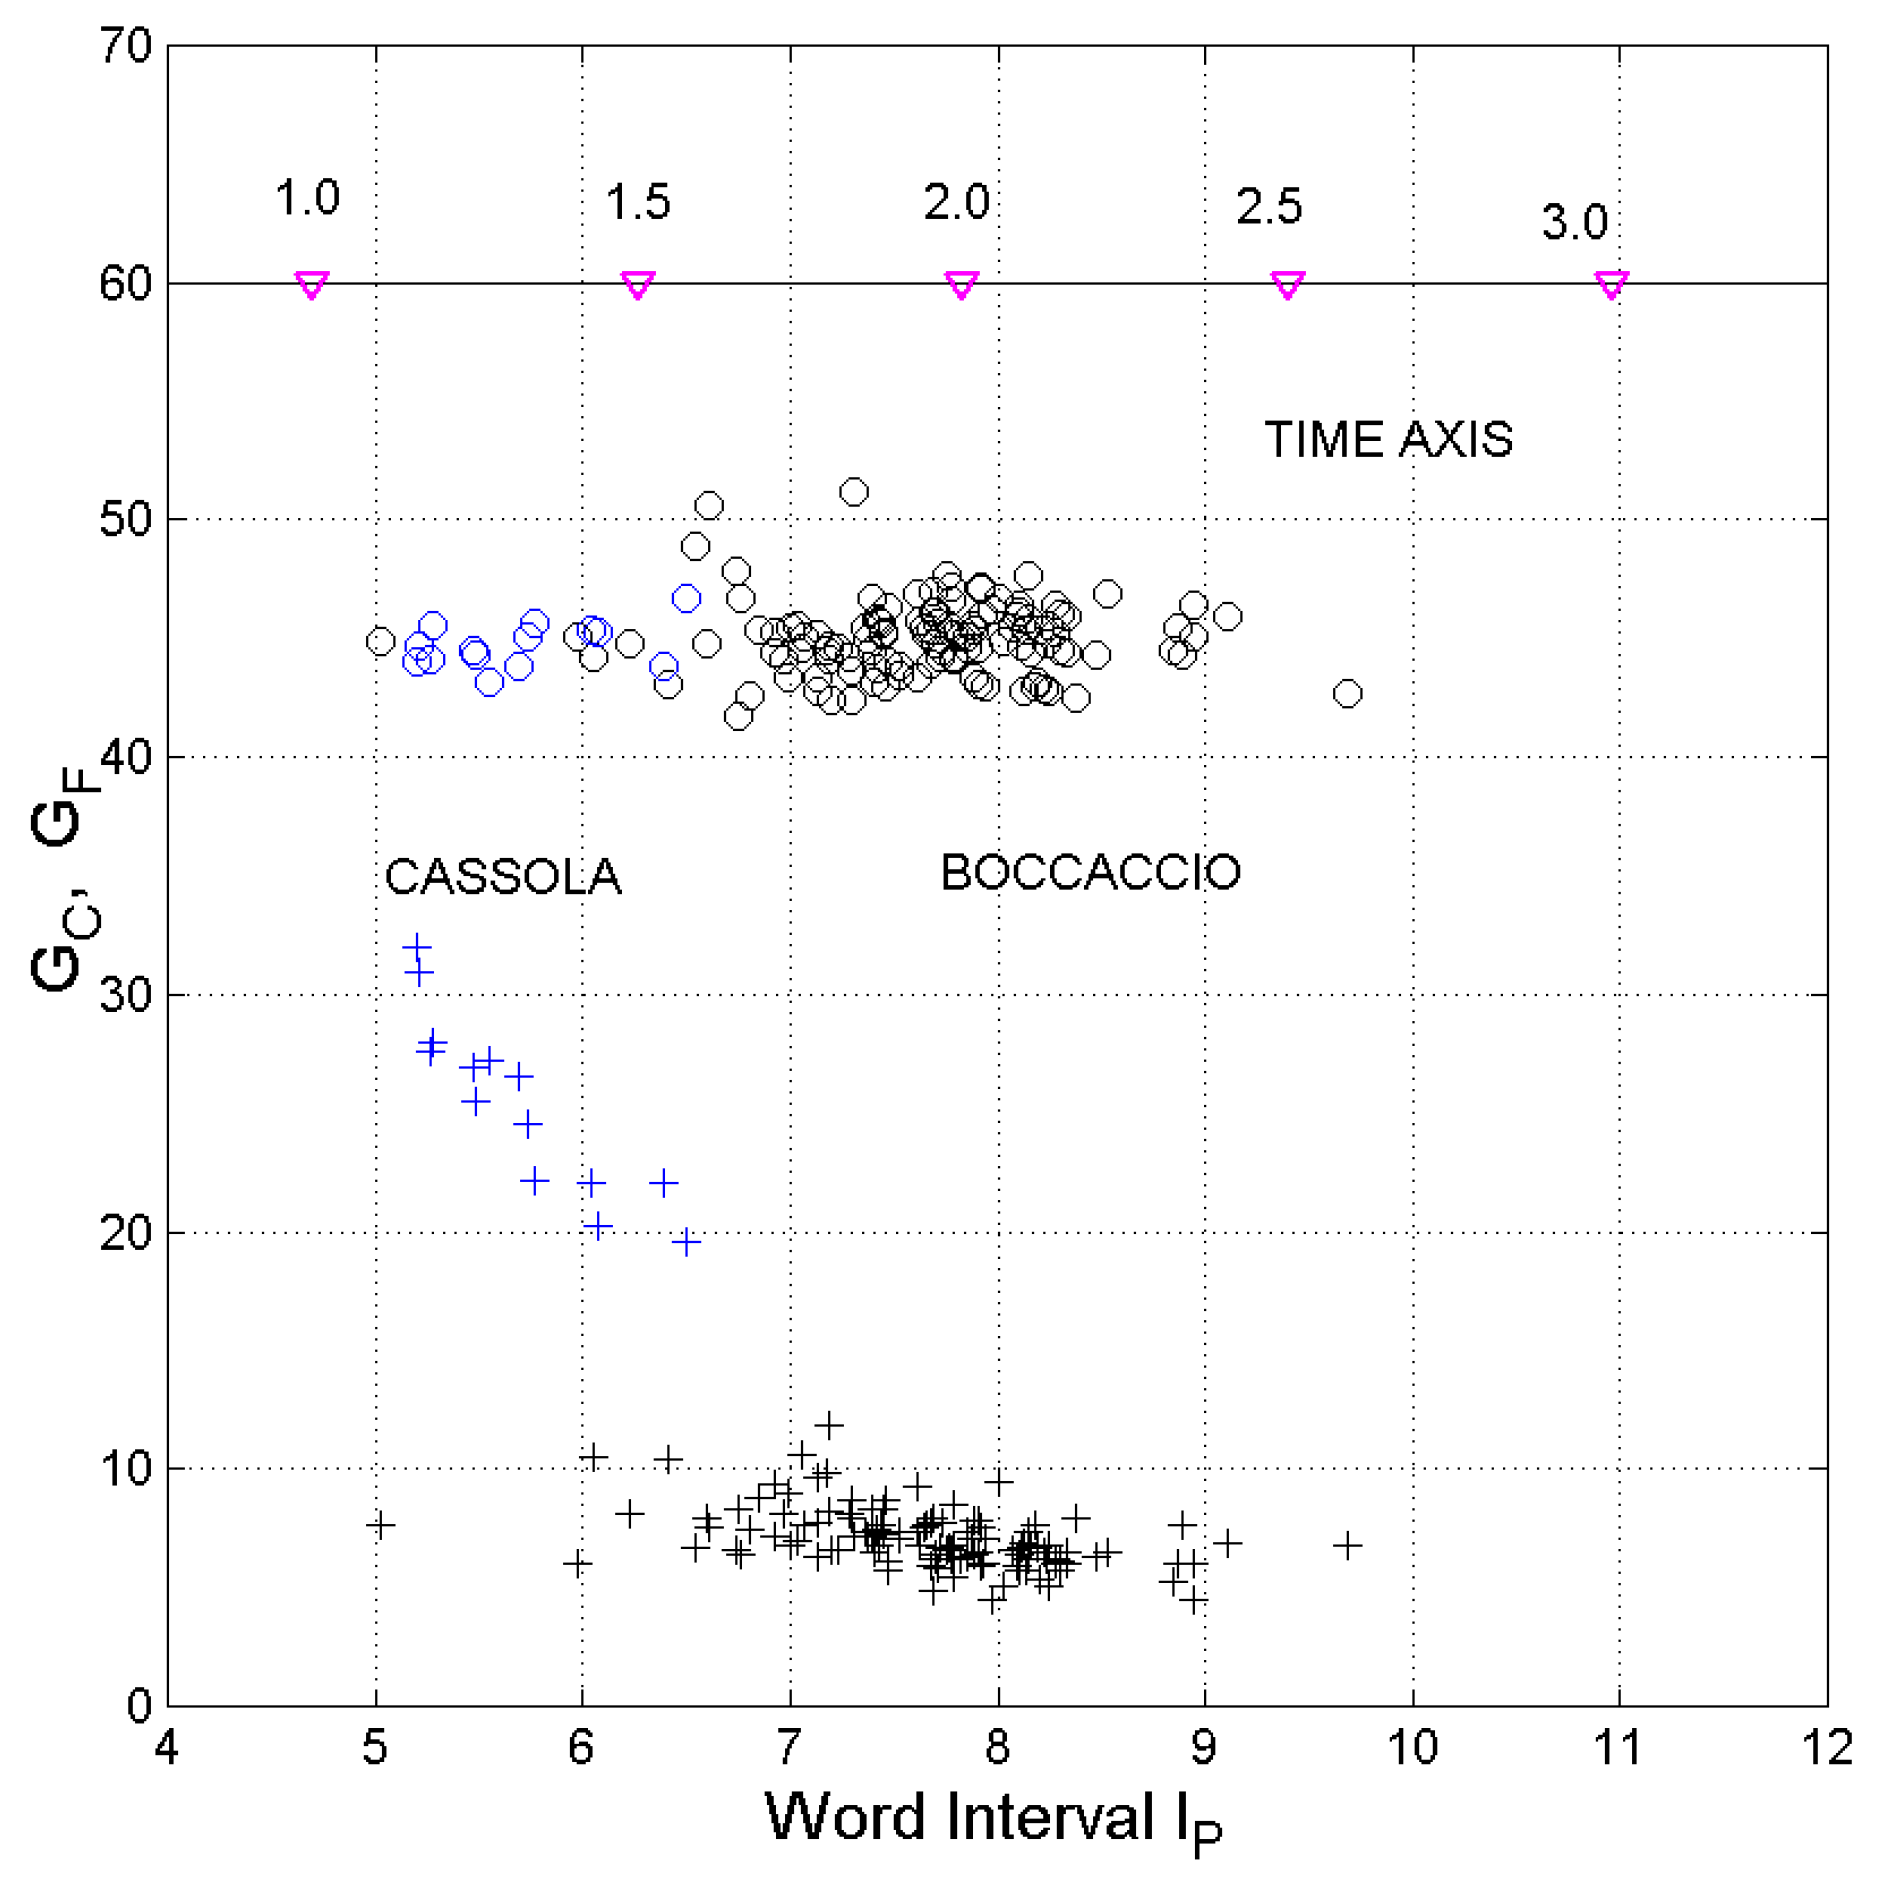
Matricciani 2018). To appreciate the striking fact that Maria Valtorta’s writing range extends almost as much as the Italian literature, Figure 2 shows the results concerning the two extremes of Italian literature examined, namely Boccaccio (14th century) and Cassola (20th century), see (Matricciani 2018). For these two authors, even if they have the same average value of G C , their G range is clearly distinct.
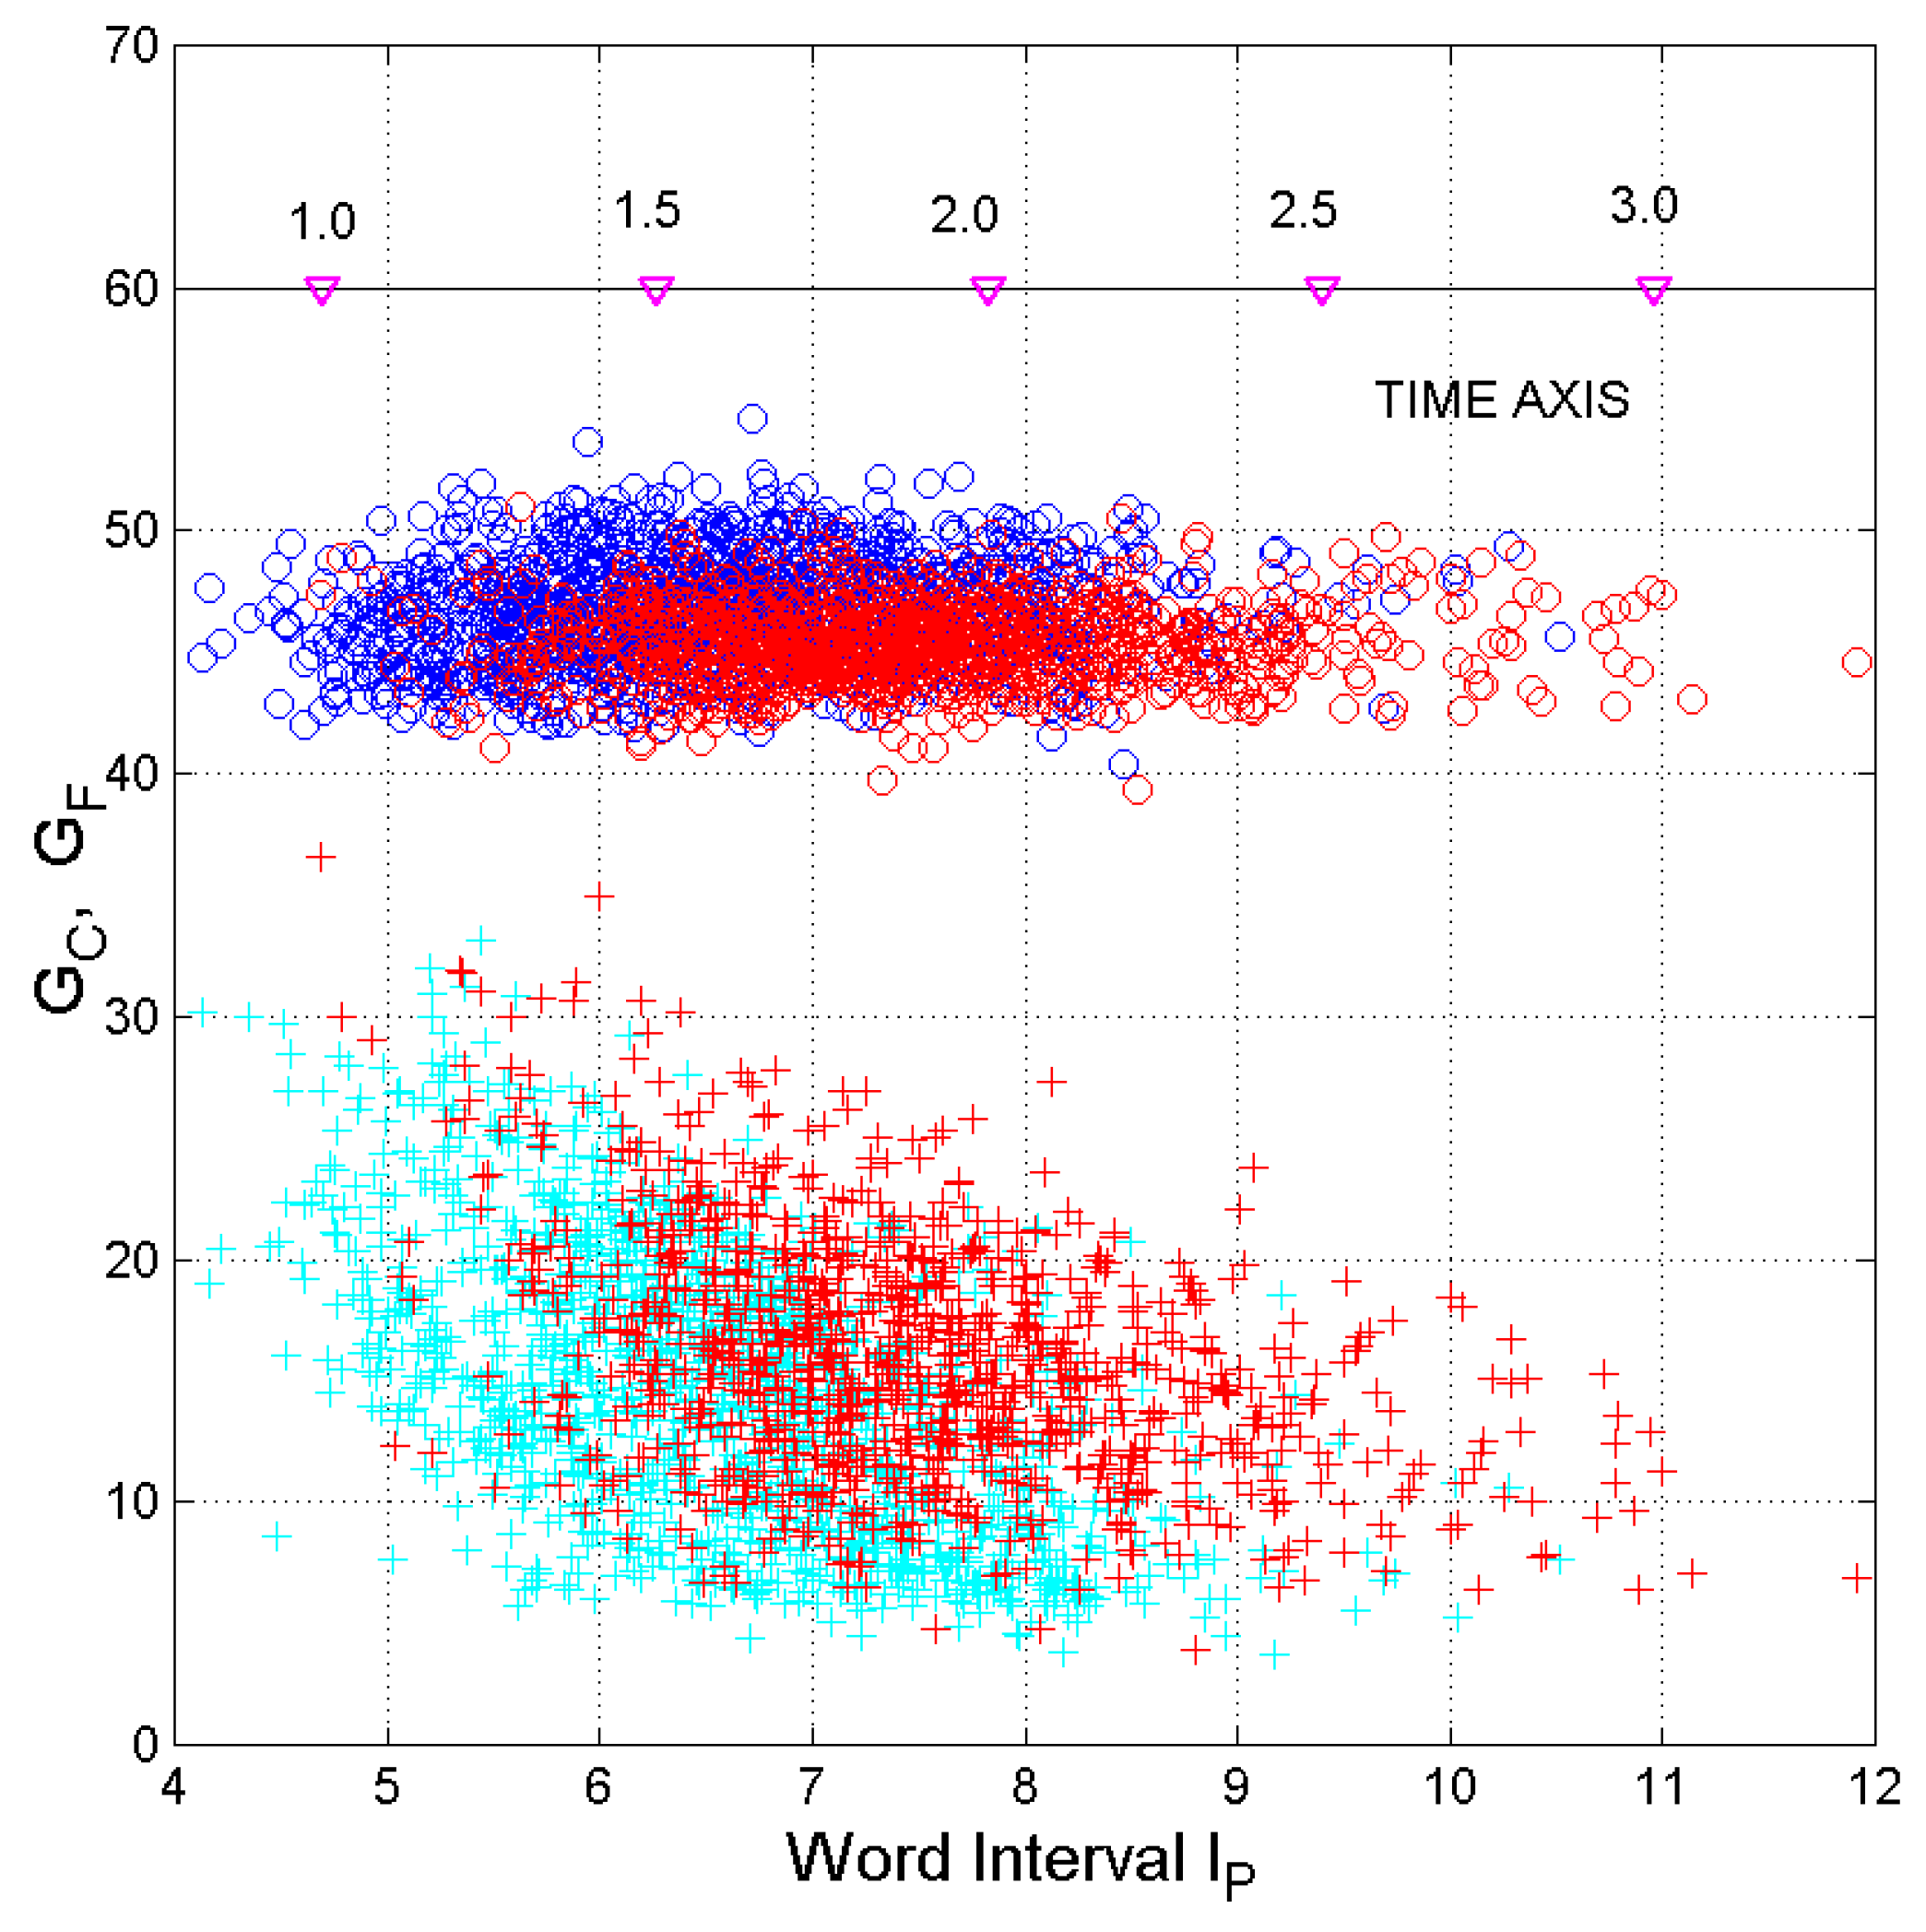
As for the relationship between I P and the two components of the readability index, G C and G F , Figure 3 and Figure 4 show, again, that Maria Valtorta’s writings are spread in about the same range of the Italian literature. The time axis shown is useful to convert, with (4), the word interval into the time interval I T , by assuming the average reading speed of Italian texts, namely 188 words per minute (Trauzettel-Klosinski and Dietz 2012). These intervals correspond to the range of the short−term memory processing time necessary to read the word interval given in abscissa. Notice that G C does not depend on I P and that G F and I P are linked with an approximate negative exponential relationship indicating that longer word intervals correspond to lower readability indices, as observed in (Matricciani 2018). In other words, a more powerful short−term memory can read more easily texts with lower readability index.
In conclusions, according to these findings, a single author, namely Maria Valtorta, seems to be able to write texts so diverse to cover the entire range of the Italian literature. In Section 6, we will return to this issue for further comparisons.

5. Kolmogorov−Smirnov Test for Comparing Probability Distributions

In this Section, we apply and discuss the results of the Kolmogorov−Smirnov test for comparing probability distributions concerning the readability index G , the number of characters per word C P , the number of words per sentence P F , and the word interval I P . We do not consider, at this stage, the number of punctuation marks per sentence, M F , because its assessment is already contained, in a way, in those of P F and I P because M F = P F / I P . First, we have to calculate the main ingredients of the test, namely the probability distribution of the random variables to be tested.

5.1. Density and Probability Distribution Functions

Figure 5, Figure 6, Figure 7 and Figure 8 show density and probability distribution functions of each of the parameters whose (linear) averages and standard deviations are reported in Table 1 and Table 2. The functions shown in these figures are three–parameter log–normal models established from the experimental data (see Appendix B for more details) as shown for the word interval in (Matricciani 2018). The threshold of the three–parameter log–normal model (Bury 1975) is the minimum theoretical value of the variable, namely 42.3 for G and 1 for C P , P F , M F , and I P (Matricciani 2018).
As Figure 5, Figure 6, Figure 7 and Figure 8 show, there are striking differences between some of these functions that deserve to be investigated. The principal tool of this investigation is a statistical assessment of their similarity. The following question must be answered: are these probability distributions produced by the same “population” and with which statistical confidence? The answer can only be of probabilistic nature. Let us now test the “null” hypothesis, that is the hypothesis that, for a given random variable, the probability distributions concerning any combination of two different texts are produced by the same population (a standard term used in statistics, e.g., (Lindgren 1968)). This means, in our case, texts written by a single author or texts with a high degree of similarity written by different authors.
Different populations have different distribution functions and it is expected that samples from these different populations will have sample distribution functions that differ. Of course, random fluctuations can introduce a difference in sample distribution functions, even though the samples are from the same population, but a very large discrepancy might reasonably serve to infer that the populations are different. The classical tool for comparing different distributions is the Kolmogorov−Smirnov test (e.g., Lindgren 1968), whose results we now discuss in detail, for each variable.

5.2. Readability Index G

Figure 9 reports the result of the Kolmogorov−Smirnov test, in particular the probability of the test variable (see Appendix C for more details) concerning the readability index G of all possible couples of literary texts listed in Table 1, except the letters which are single samples. The meaning of this probability is that the null hypothesis is rejected with a probability given by the mark on the continuous curve. For example (Figure 9a, left panel), the test probability of the couple Jesus’ Sermons and Speeches and Mary says (SM) is about 0.3, therefore indicating that with probability 0.30 the null hypothesis is rejected; therefore, with probability 1 0.3 = 0.7 , the probability distributions of G of these two texts are likely produced by the same population, i.e., by authors who have the same linguistic characteristics or, of course, by the same author.
In these figures we have explicitly labeled only the couples of texts which, at the 95% (probability 0.95 in Figure 9) confidence level—the confidence level traditionally assumed in these tests—should belong to the same “population” (using the term typical of these tests). As already mentioned, in our case the “same population” means literary texts that share the same linguistic characteristics, likely due to a single author or to very similar texts written by different authors. The couples not explicitly labeled should thus belong to different populations with probability larger than 0.95, most of them with probability very close to 1.
According to the results shown in Figure 9, the following couples of texts have probability distributions of G (Figure 5) that, with different confidence levels, seem to belong to the same population: Jesus’ Sermons and Speeches and Mary says; Jesus says and Mary says; Parables and Jesus’ Sermons and Speeches; Parables and Mary says; Azariah and Maria Valtorta’s Descriptions. Therefore, Maria Valtorta’s writings cannot be confused with the literary texts found in the EMV or in the Notebooks. Only her Descriptions are similar to Azariah. Notice, however, that her Descriptions may belong to different populations with still a high probability, namely 0.85 instead of 0.95 currently assumed in the test. Azariah and Romans differ definitely from all EMV, notebooks texts and Maria Valtorta’s writings, even considering the couple Azariah and Maria Valtorta’s Descriptions.
In conclusion, for the readability index—an overall index that includes both the number of words per sentence and the number of characters per word−, the texts attributed to Jesus and Mary differ from those explicitly signed by Maria Valtorta at the 95%, or higher, confidence level. The same can also be said of Romans compared to her writings.

5.3. Characters per Word C P

According to the results shown in Figure 10, the following couples of texts have probability distributions of C P that, with different confidence level, seem to belong to the same population: Parables and Mary says; Jesus’ Sermons and Speeches and Mary says; Parables and Jesus says; Parables and Jesus’ Sermons and Speeches; Jesus says and Mary says. Therefore, Maria Valtorta’s writings cannot be confused with the literary texts found in the EMV and in the Notebooks. Only her Autobiography is similar to Azariah, because her Descriptions may not belong to the same population with still a significant probability, namely 0.85 instead of 0.95. Azariah and Romans are definitely different form all EMV, notebooks texts and Maria Valtorta’s writings, even considering the couple Azariah and Maria Valtorta’s Descriptions.
In conclusion, the alleged authors Jesus and Mary have very similar probability distributions, a finding that seems to indicate that, statistically, they use words of similar length. Again, Maria Valtorta’s works show very different probability distributions. Her writings are statistically a little similar only to Azariah.

5.4. Words per Sentence P F

According to the results shown in Figure 11, the following couples of texts have probability distributions of P F that, with different confidence level, seem to belong to the same population: Jesus says and Mary says; Jesus’ Sermons and Speeches and Mary says; Parables and Jesus’ Sermons and Speeches; Parables and Mary says; Mary says and Maria Valtorta’s Autobiography; Jesus says and Maria Valtorta’s Autobiography. Notice that there always are similarities between Jesus and Mary texts, and for this parameter, Maria Valtorta’s writings can be confused with Mary says and Jesus says. Azariah and Romans are different from all other writings (Figure 11b).

5.5. Word Interval I P

According to the results shown in Figure 12, the following couples of texts have probability distributions of I P that, with different confidence level, seem to belong to the same population: Jesus says and Mary says; Parables and Jesus’ Sermons and Speeches; Maria Valtorta’s Autobiography and Maria Valtorta’s Descriptions; Mary says and Maria Valtorta’s Autobiography; Mary says and Maria Valtorta’s Descriptions; Jesus says and Maria Valtorta’s Autobiography.
Again, Maria Valtorta’s writings can be confused with Mary says and Jesus says. As for Azariah and Romans, we find similarity only in the following couples: Azariah and Jesus’ Sermons and Speeches; Romans and Parables; Romans and Jesus’ Sermons and Speeches. Maria Valtorta’s work is completely different from these texts.

5.6. Test Conclusions

The general trend found with the Kolmogorov−Smirnov test is enough clear. The literary texts Azariah and Romans are evidently very distinct from all other texts.
The literary works explicitly attributable to Maria Valtorta (Autobiography and Descriptions) have probability distributions that differ significantly from those of the literary works attributable to the alleged Jesus and Mary characters, and when this is not true, as with the number of words per sentence, P F (Figure 11a, right panel), and the word interval I P (Figure 12a, right panel), this happens only with Jesus says and Mary says.
Another interesting finding is the great similarity of the texts attributed to Jesus (Parables and Sermons and Speeches), a fact that should be expected because this character in both cases allegedly speaks to a popular audience. These findings deserve some more comments.
Let us consider the number of words per sentence P F and the word interval I P . The latter variable is a very important parameter because it seems to be linked, empirically, to the short−term memory capacity and response (processing) time (Matricciani 2018). When Jesus speaks to the people (Parables and Sermons and Speeches), this parameter is significantly lower (average values I P = 6.63 and I P = 6.91 , respectively, Table 2) than that found when he speaks to Maria Valtorta (Jesus says), namely I P = 7.59 (Table 2). This latter value is strikingly identical, in practice, to that found in Maria Valtorta’s Descriptions ( I P = 7.60 ) and Autobiography ( I P = 7.71 ). The same can be said for Mary says, being in this case I P = 7.64 . The number of words per sentence P F agrees with I P ; in fact it steadly increases, therefore lowering the readability index G , from Parables and Sermons and Speeches to Jesus says (Table 1 and Table 2).
What does all this mean? That Maria Valtorta is such a good writer to be able to modulate the linguistic parameters in so many different ways, and as a function of characters of the plot and type of literary text, so as to cover almost the entire range of the Italian literature? Our opinion and our conjecture, if Maria Valtorta’s visions were real, is that the alleged characters Jesus and Mary, when they speak directly to her, adapt their communication to the capacity and robust processing time of her short-term memory. On the contrary, when Jesus speaks to a general audience (Parables and Sermons and Speeches) he adopts a significant lower word interval, because the people may not have the very good memory that Maria Valtorta had, witnessed by Marta Diciotti (Diciotti in Centoni 1987, p. 230) and clearly evidenced by the values of the word interval found in the writings she directly signed.

6. Comparing Different Literary Texts: Euclidean Distances

A useful graphical and mathematical tool for comparing different literary texts is the vector representation, discussed by (Matricciani 2018), obtained by considering the following six vectors of components13 x and y : R 1 = ( C P , P F ), R 2 = ( M F , P F ), R 3 = ( I P , P F ), R 4 = ( C P , M F ), R 5 = ( I P , M F ), R 6 = ( I P , C P ) and their resulting vector of coordinates, x and y 14, given by:
R = k = 1 6 R k
By using the average values of Table 1 and 
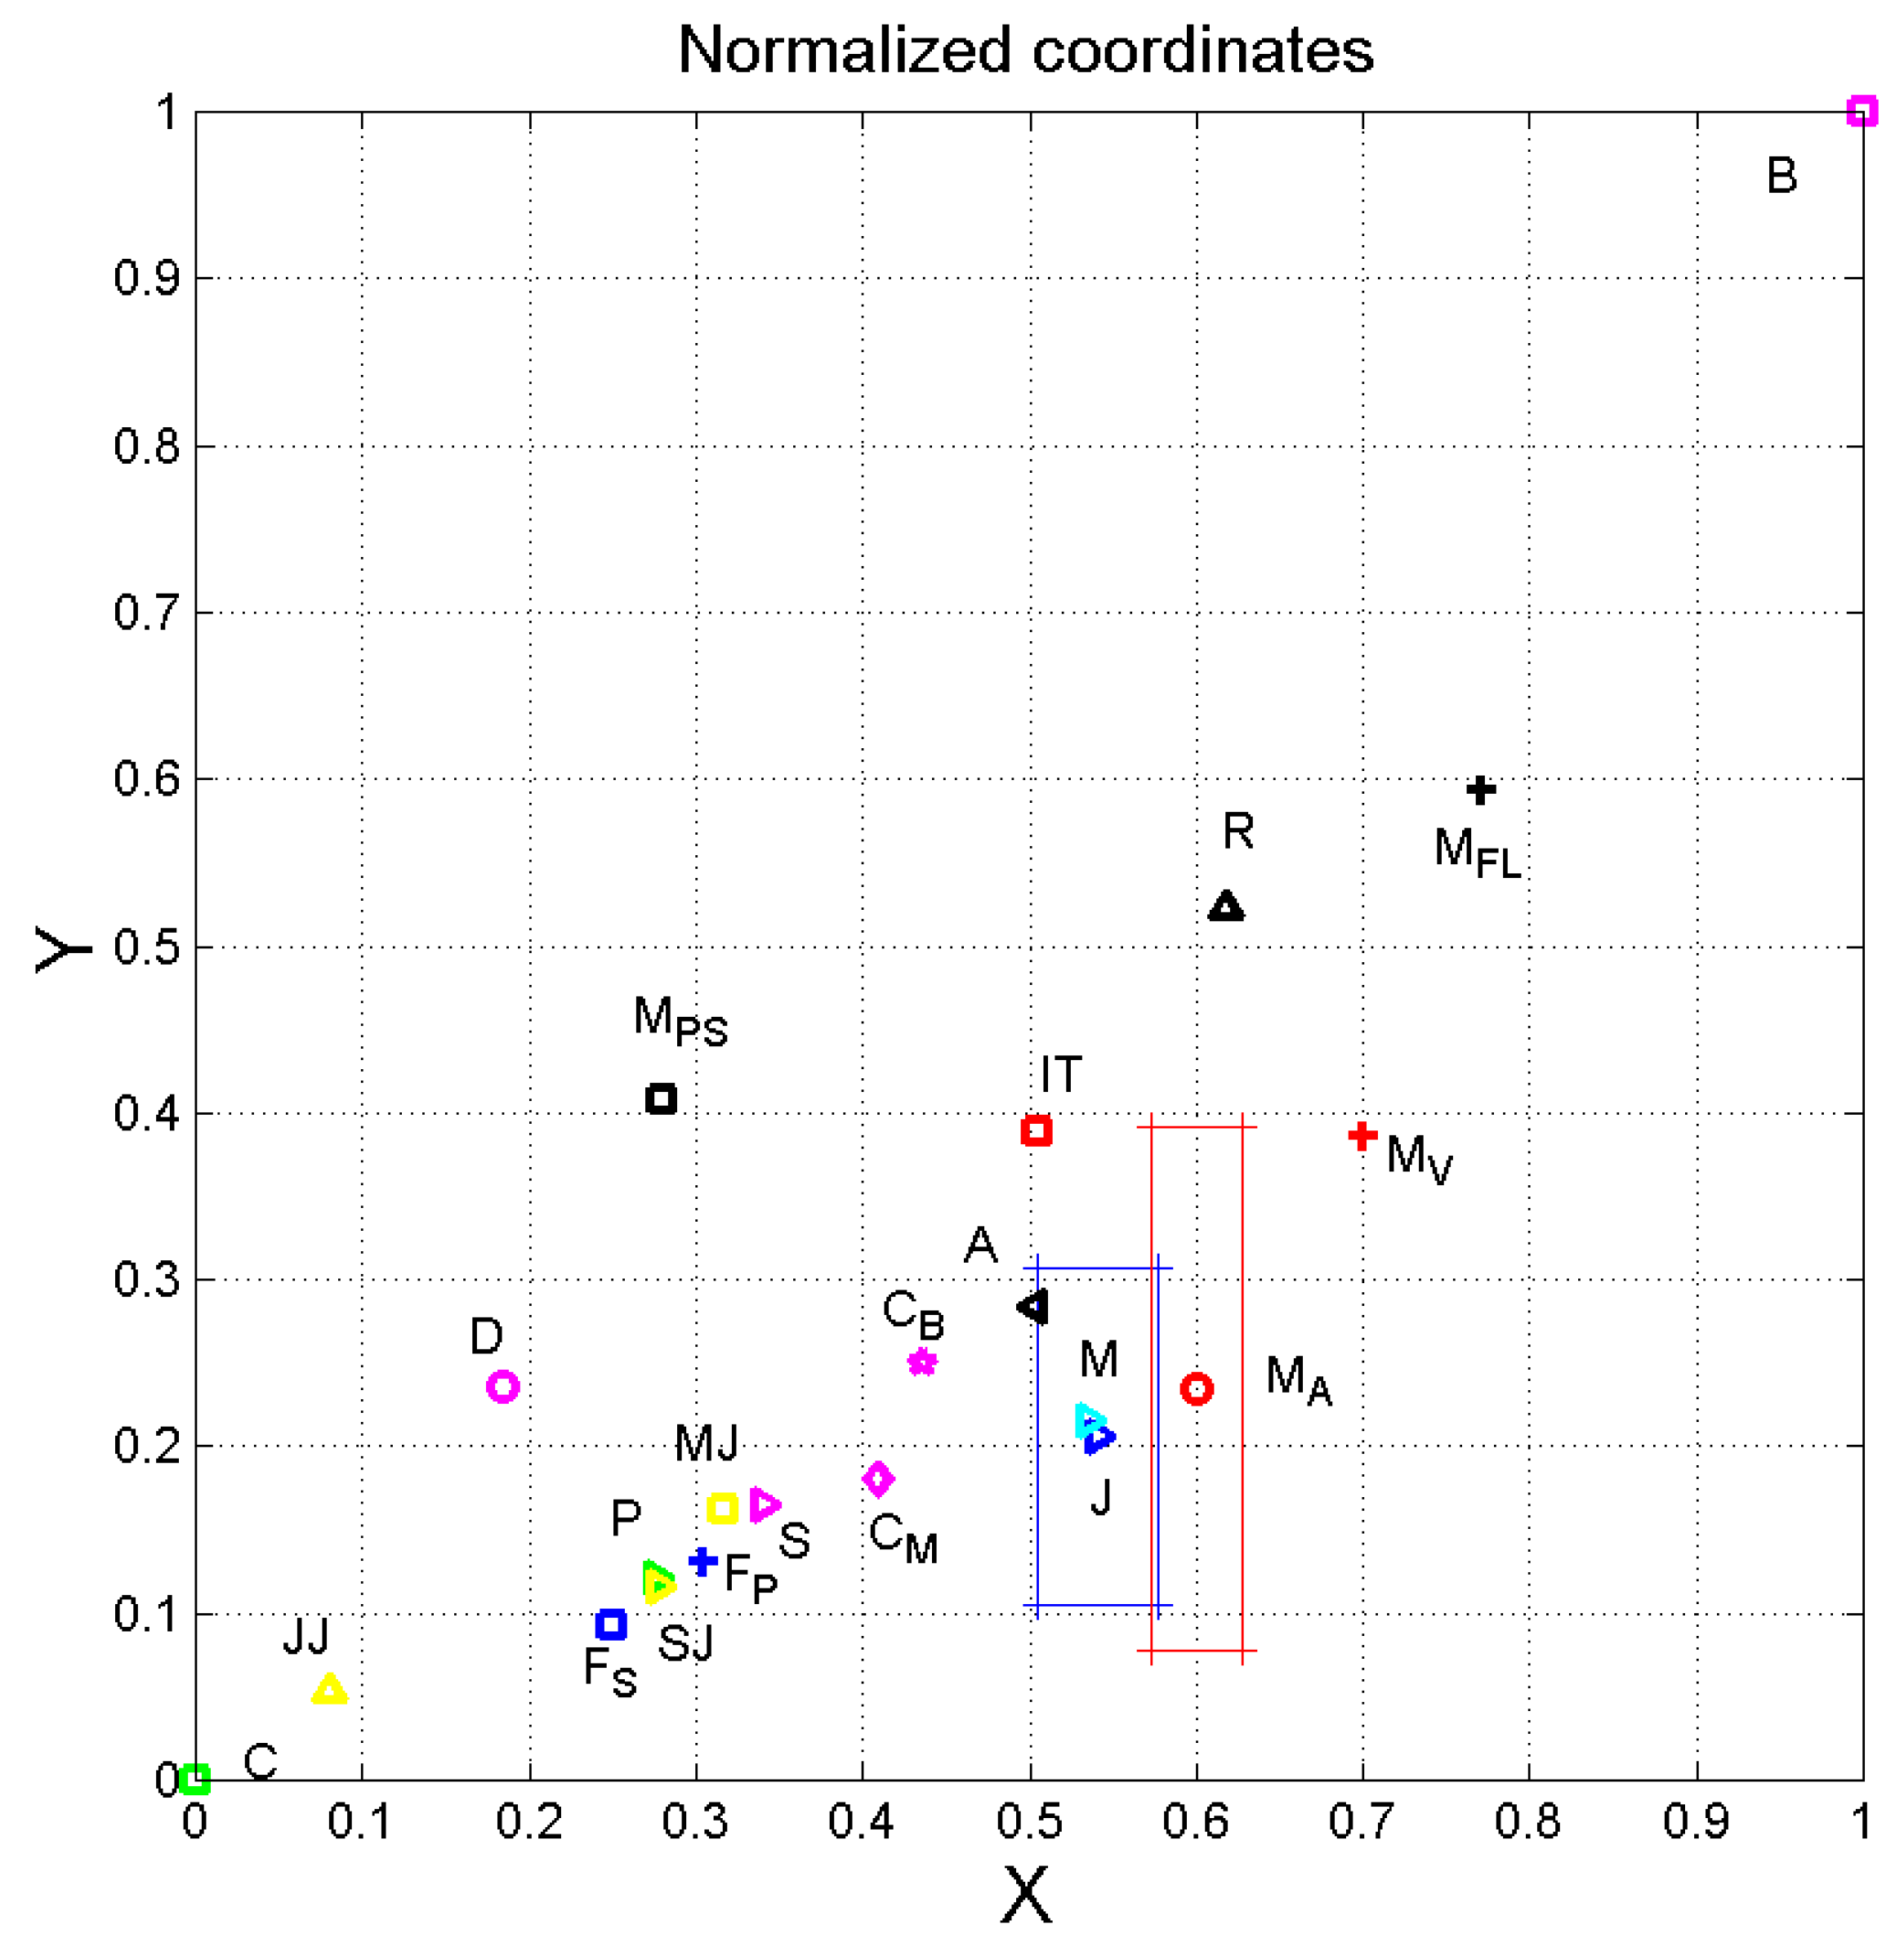
Table 2, with this vector representation a literary text ends up in a point of coordinates x and y in the first Cartesian quadrant, as shown in Figure 13. Notice that the coordinates x and y of each work are referred (normalized) to coordinates of the two extremes Boccaccio and Cassola, by assuming Cassola as the origin, coordinates (0,0), and Boccaccio located at (1,1). In other words, with this relative representation it is possible to appreciate directly, once more, the range occupied by Maria Valtorta’s writings, compared to the Italian literature.
As done in Figure 1, Figure 2, Figure 3 and Figure 4, some other works of the Italian literature are also reported, for comparison (Matricciani 2018). It is very interesting, for example, to compare the vector representing Manzoni’s masterpiece15 I Promessi Sposi (published in 1840) and that representing Manzoni’s Fermo e Lucia (published in 1827). The latter novel was the first version of I Promessi Sposi and the great improvement pursued by Manzoni in many years of revision, well known to experts of Italian literature, is observable graphically.
As already observed with other visual aids (Figure 1, Figure 2, Figure 3 and Figure 4), the range of Maria Valtorta’s writings is extremely large for a single author; it extends for about 65% of the full range in abscissa (from J J to M V ), and about 50% in abscissa (from J J to R ). Notice, for instance, the relative distance between Calvino’s works Marcovaldo and Il Barone Rampante, or between Fogazzaro’s works Piccolo Mondo Antico and Il Santo. Compared to what Maria Valtorta writes, their relative range is small. Il Santo was read and very much appreciated by Maria Valtorta (Autobiography, chp. 15), nevertheless its vector tip is close to the EMV vectors tips not to the Autobiography and Descriptions vectors tips.
As for Jesus says and Mary says, monologues addressed to Maria Valtorta, their vectors tips practically coincide, therefore furtherly confirming that these characters allegedly adapt their communication for speaking to a specific person. Notice also that the texts attributed to Jesus (Parables and Sermons and Speeches) are very close, and close to three of the letters (two from Sintica to Jesus, one from Mary to Jesus). The other letter listed in Table 1 (from John of Endor to Jesus), is quite displaced towards Cassola. Romans is significantly displaced from all other writings. Notice that, as examples of the likely variations of the vectors tips because of the standard deviation of the average value of each parameter, the blue box gives the δ overall standard deviation16 of the vector’s coordinates for Jesus says, the red box for Maria Valtorta’s Autobiography. It is clear that Autobiography is only a little connected with Jesus Says and Mary says and that the latter two texts are very similar.
In our opinion, this vector representation gives, again, the striking impression that Maria Valtorta may be either a very able writer, capable of modulating deep linguistic parameters of Italian in many different ways, and according to the character considered; or that, what she says and writes should be considered real, that she had real dictations and visions, carefully and tirelessly written by a very talented person, but nevertheless only a mystical “tool”.

7. Conclusions

We have examined and studied the huge amount of literary works written by the Italian mystic Maria Valtorta, to assess similarities and differences. We have used mathematical and statistical tools developed for specifically studying deep linguistic aspects of texts, such as the readability index, the number of characters per word, the number of words per sentence, the number of punctuation marks per sentence and the number of words per punctuation marks, known as the word interval, an index that links the previous indices to fundamental aspects of the short−term memory of reader/listener.
The general trend obtained with statistical confidence tests is enough clear. The literary works explicitly attributable to Maria Valtorta (Autobiography and 
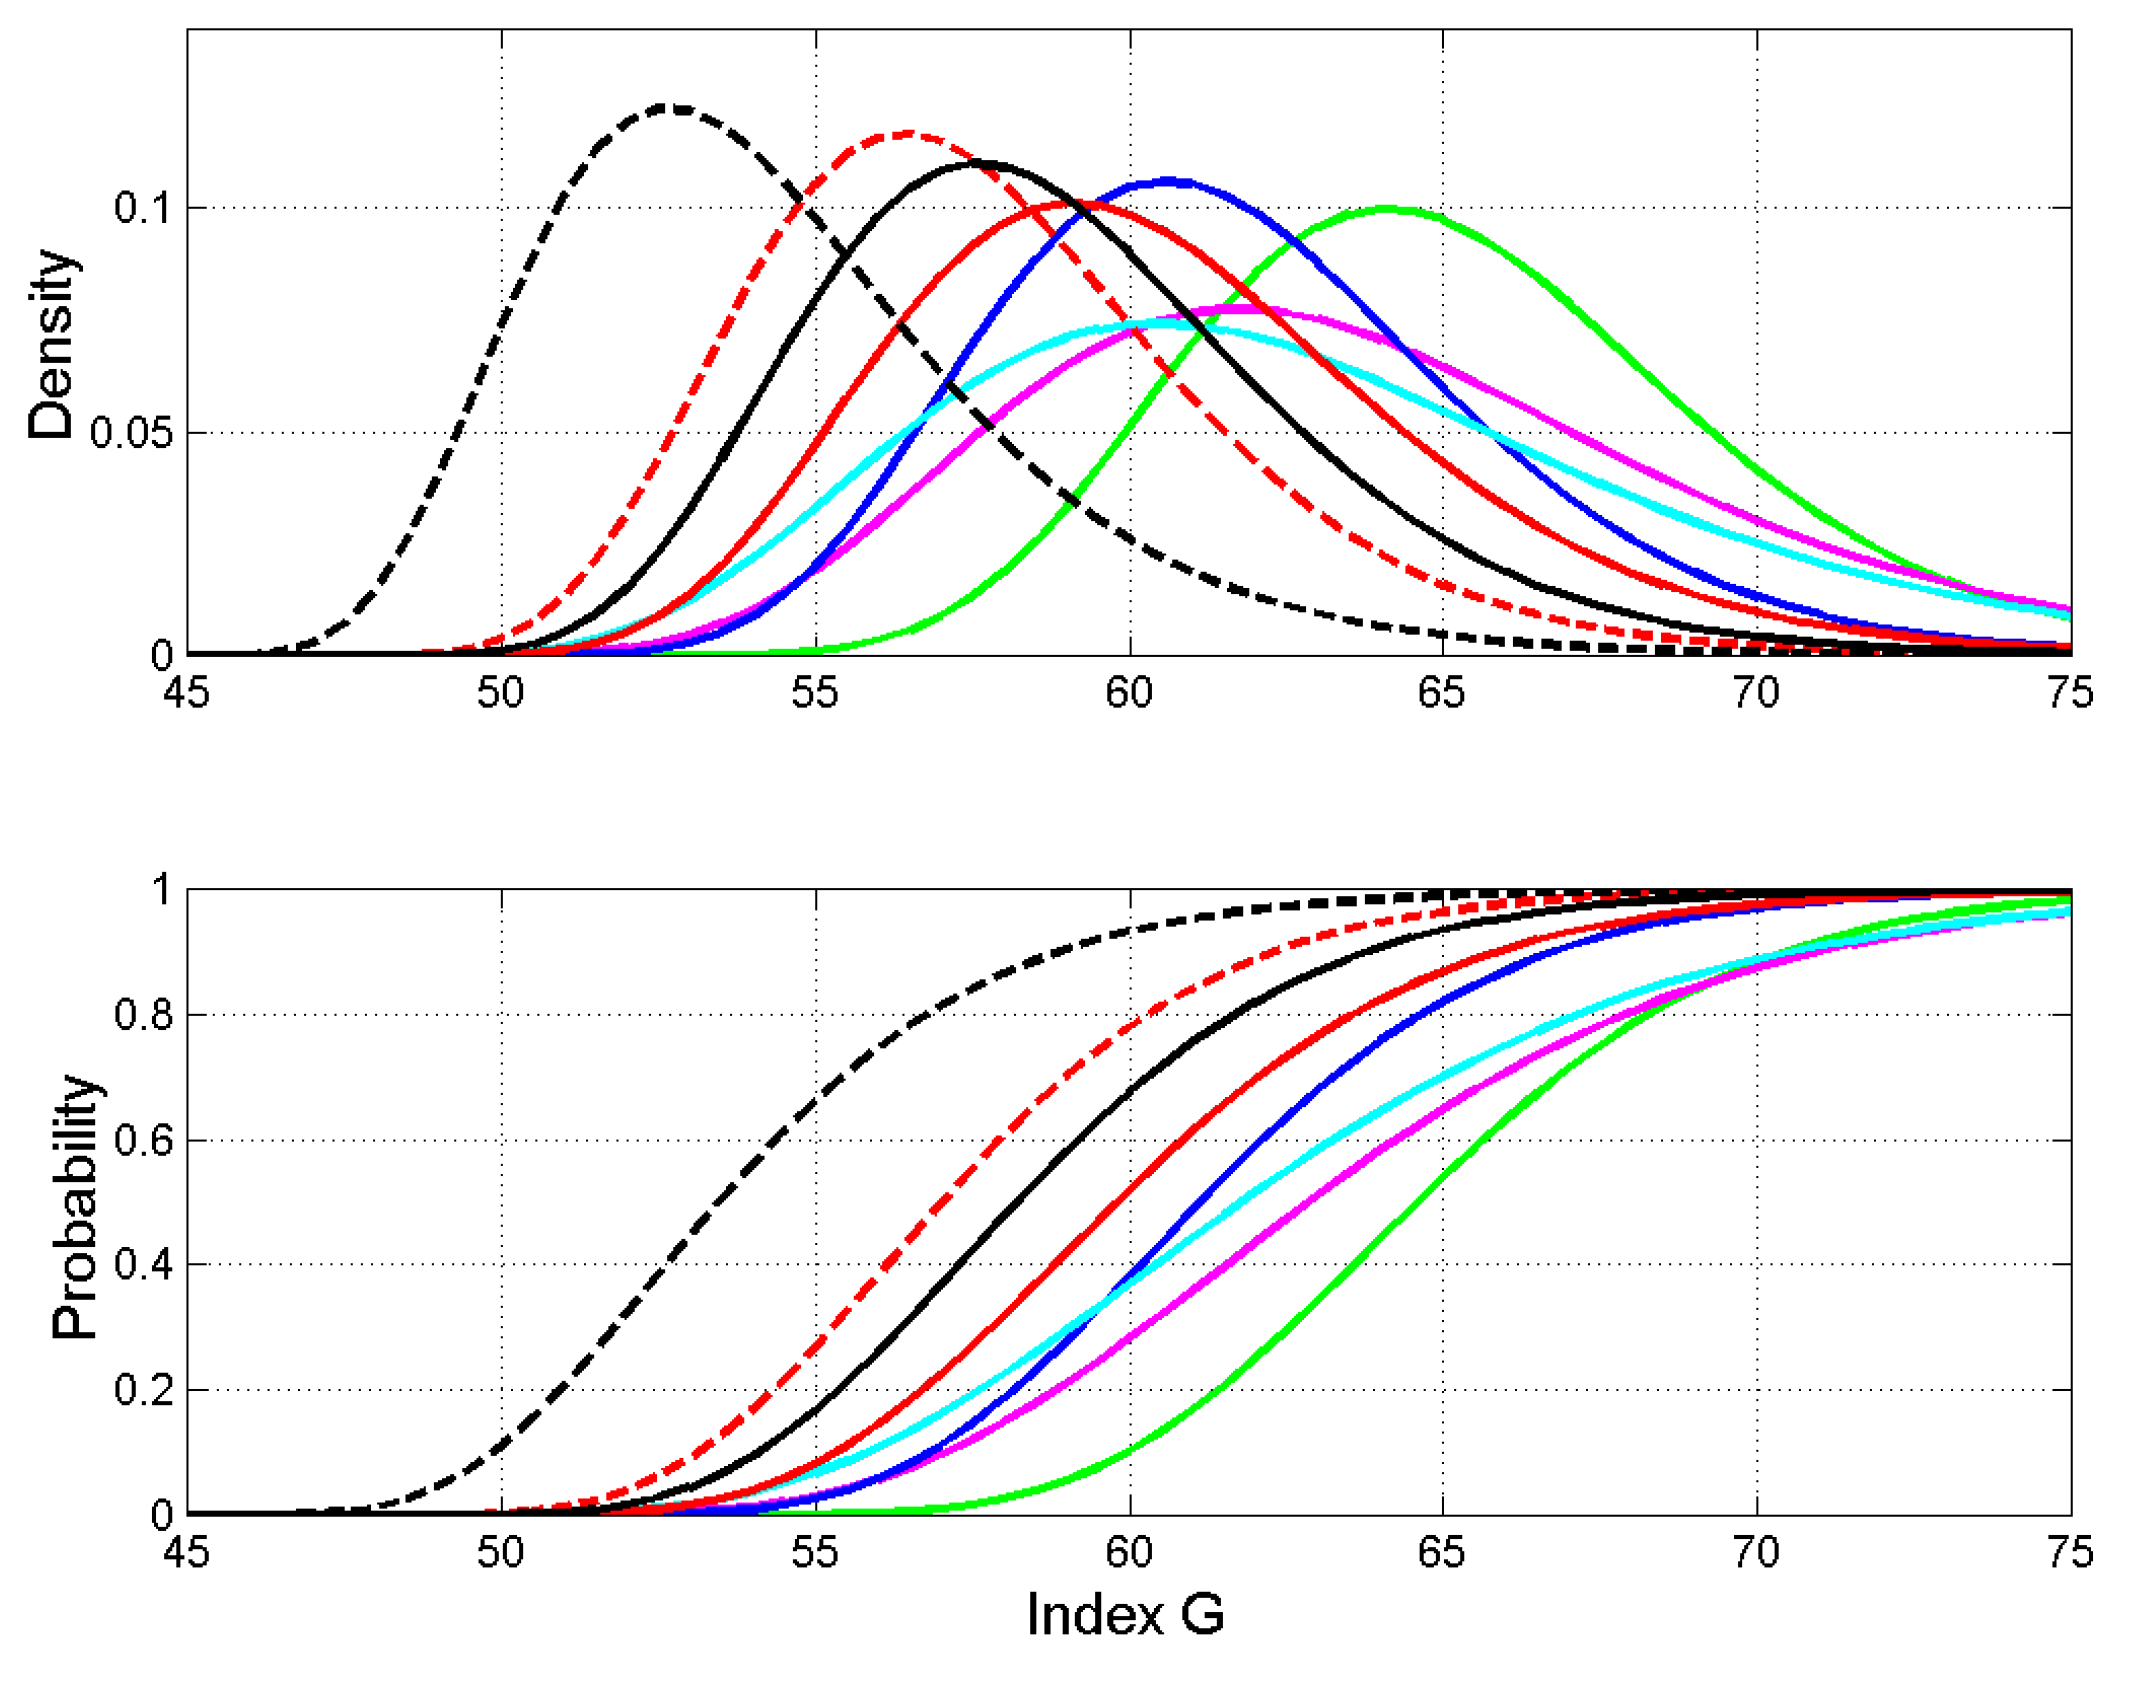
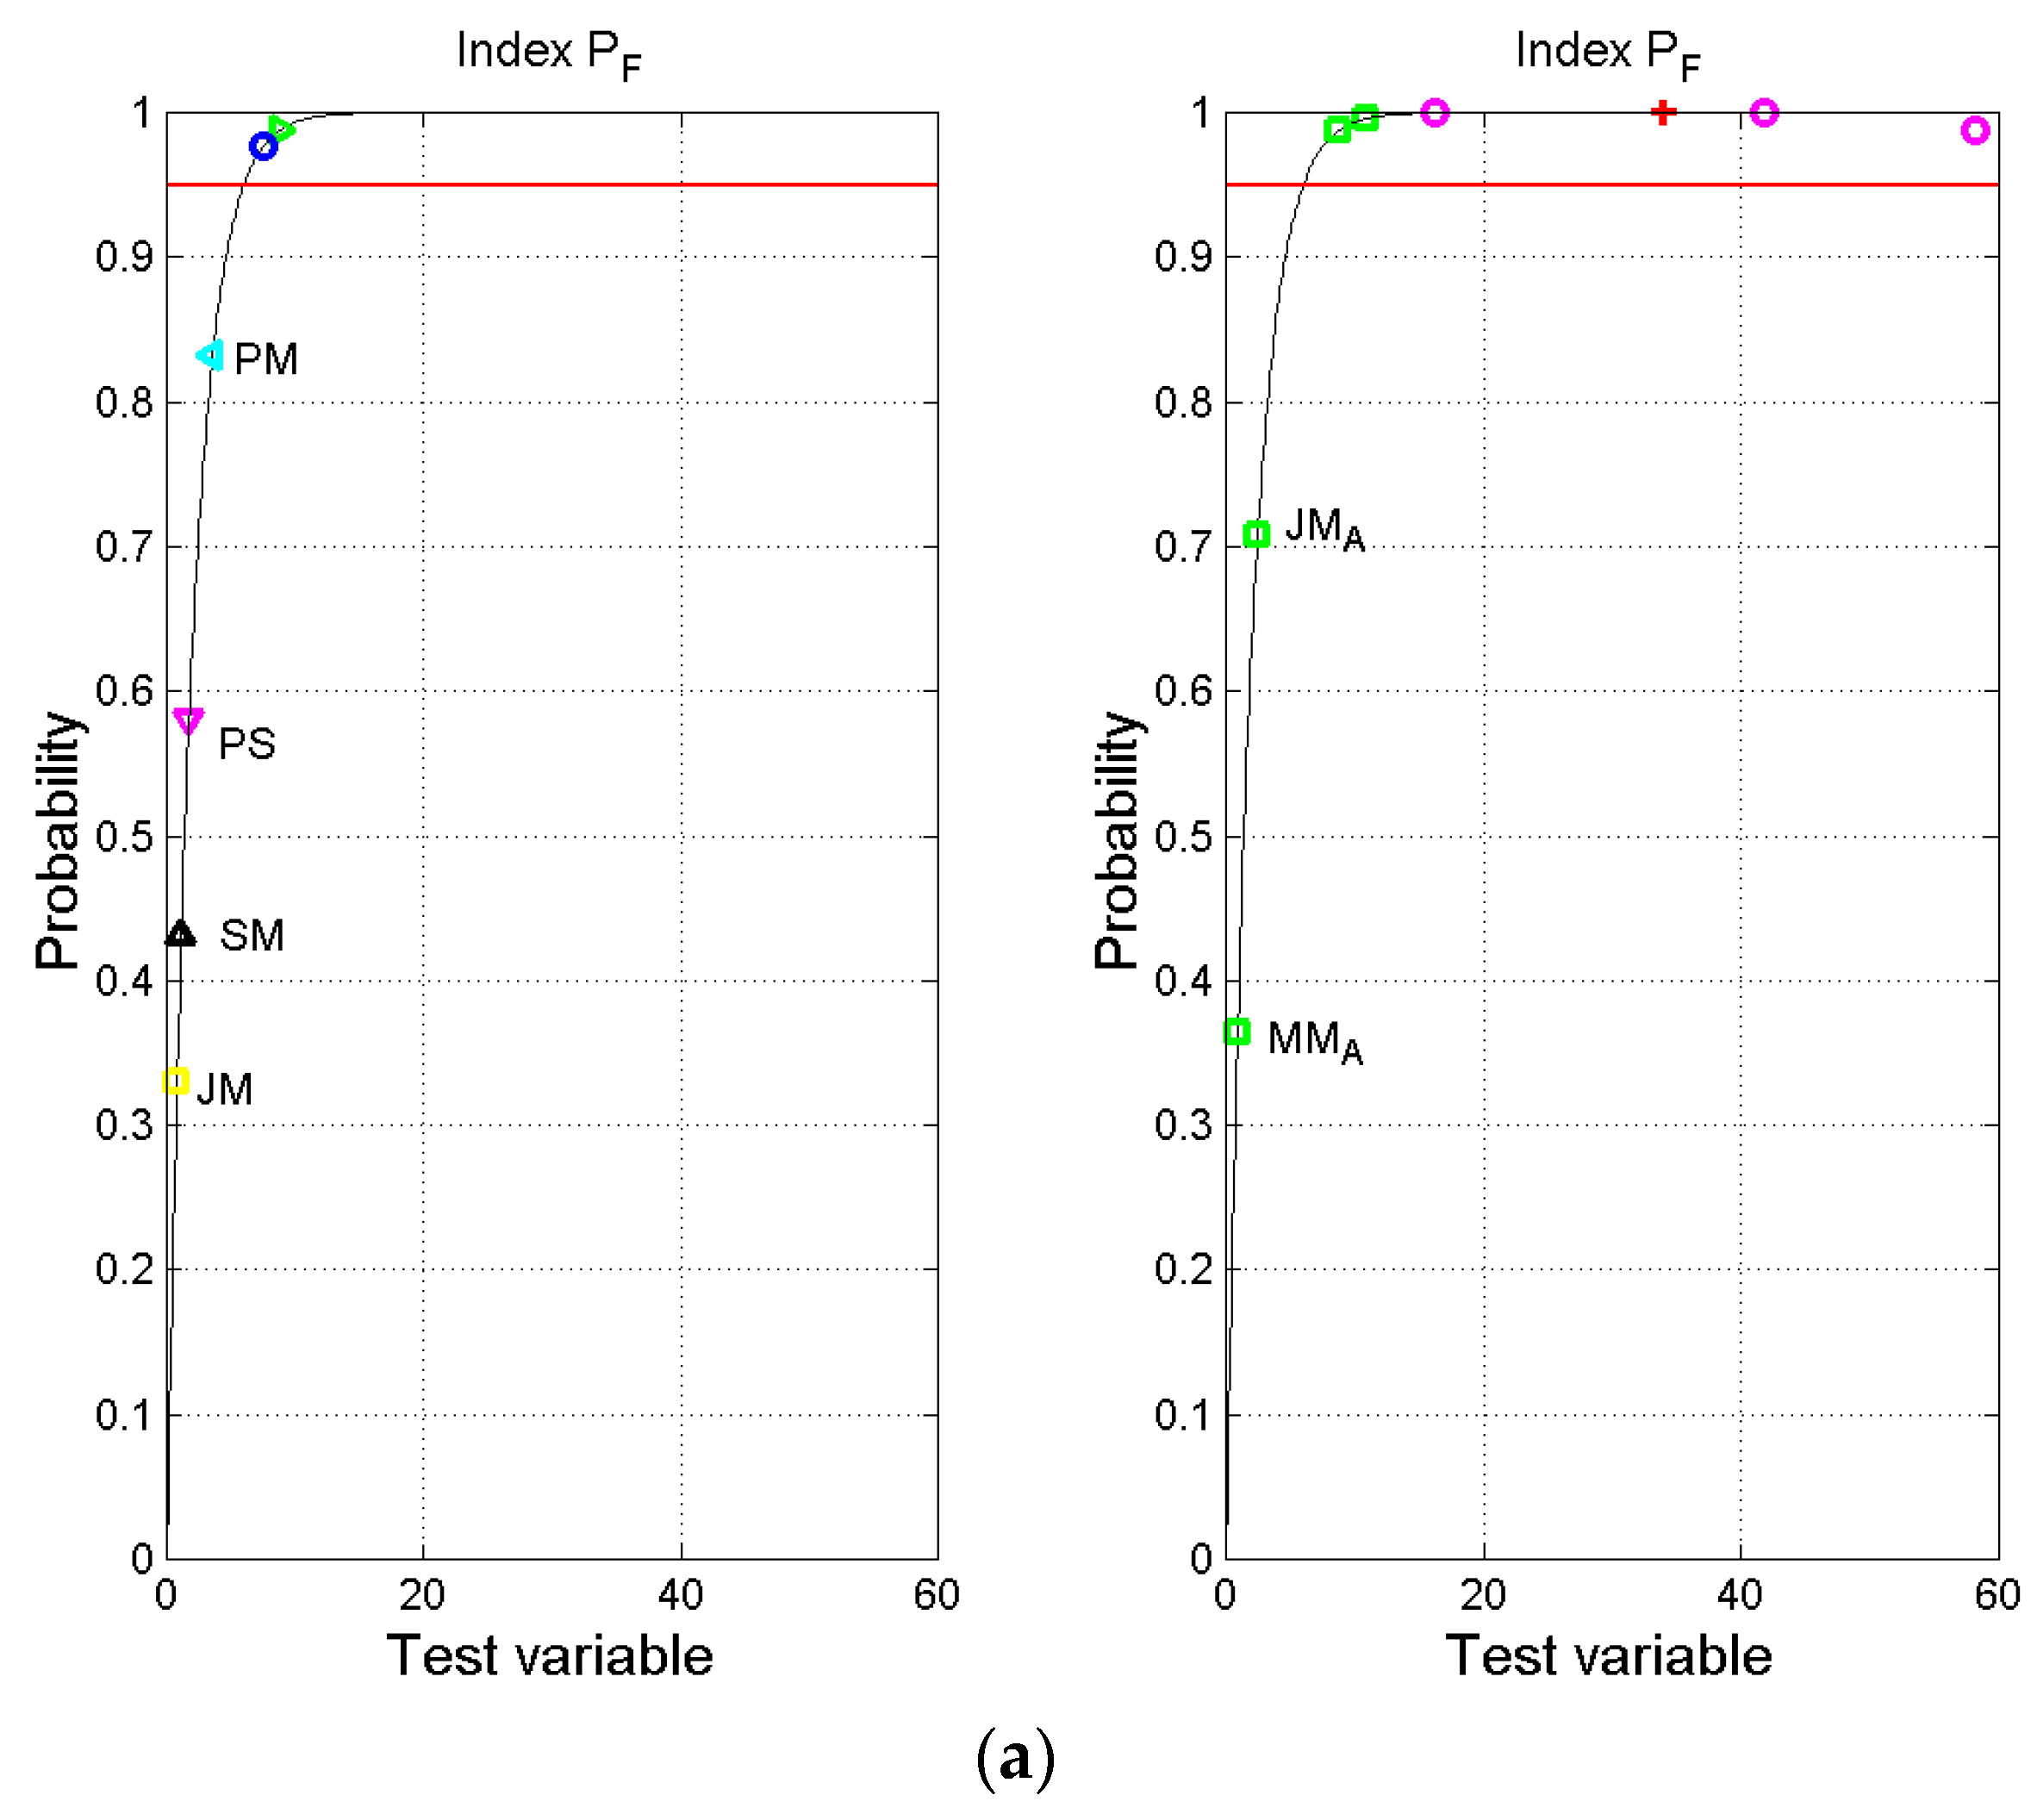
Descriptions) differ significantly from those of the literary works that, according to her claim, are attributable to the alleged characters Jesus and Mary, and when this is not true, as with the number of words per sentence,
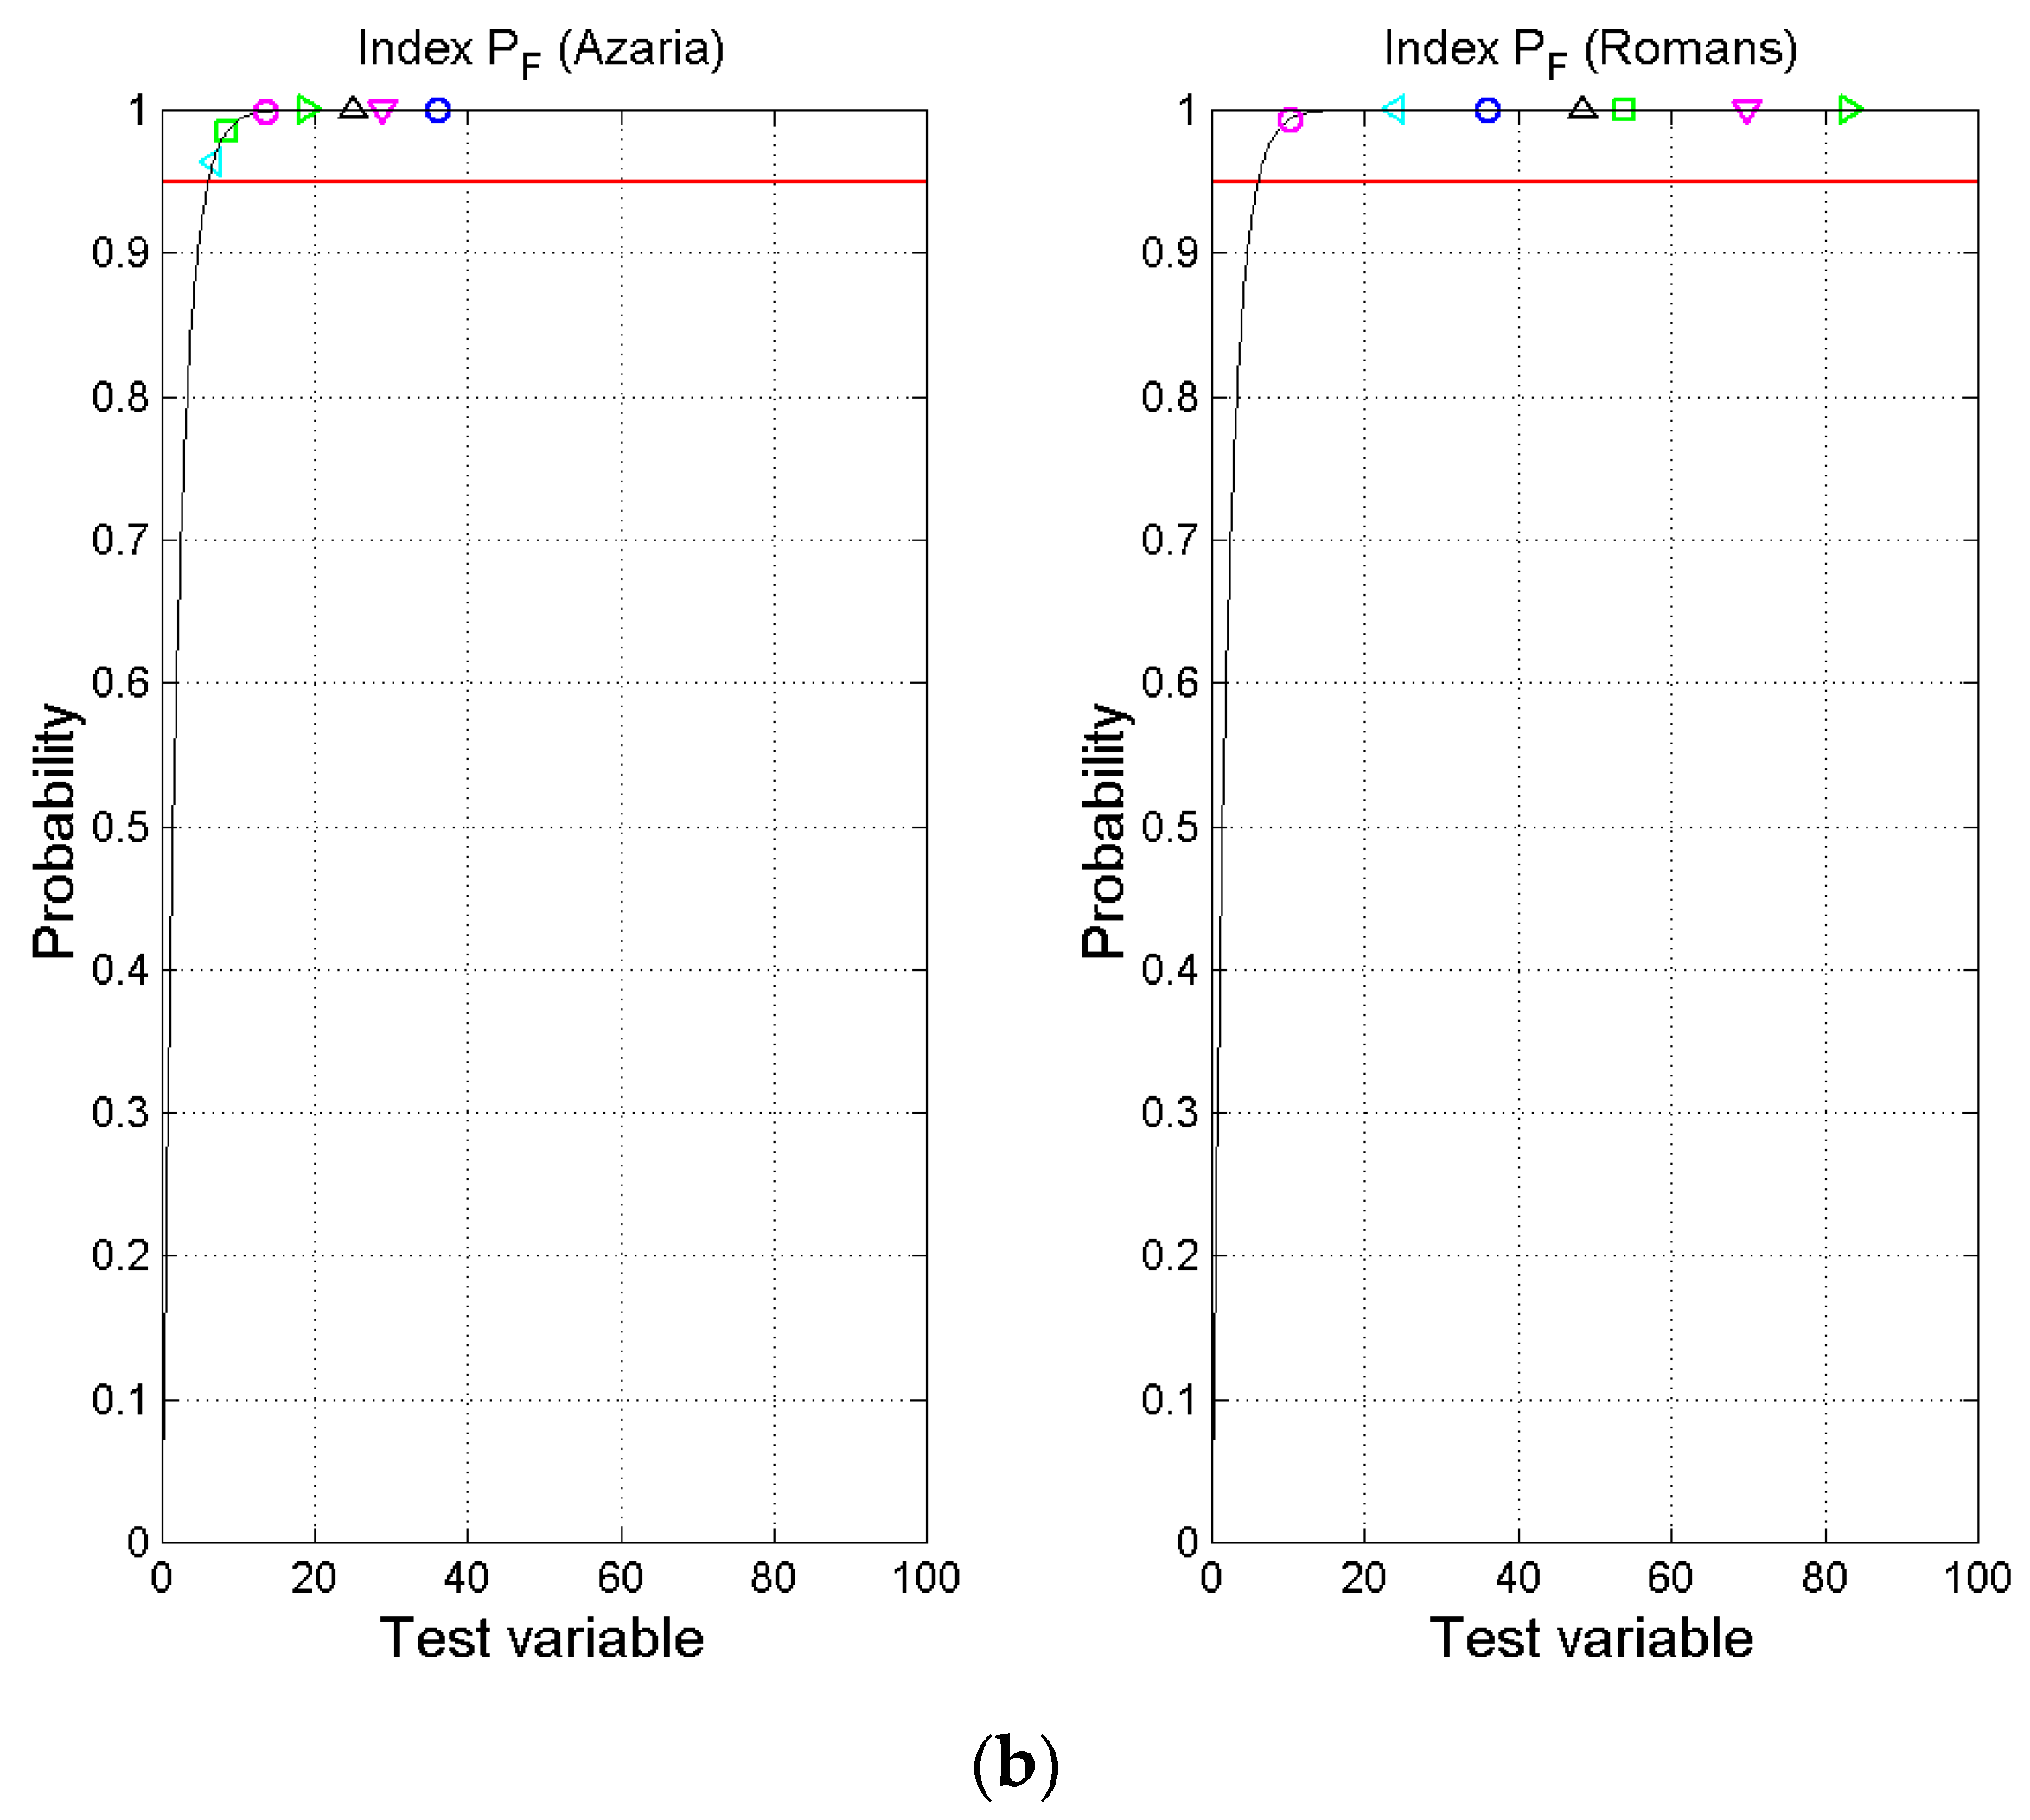
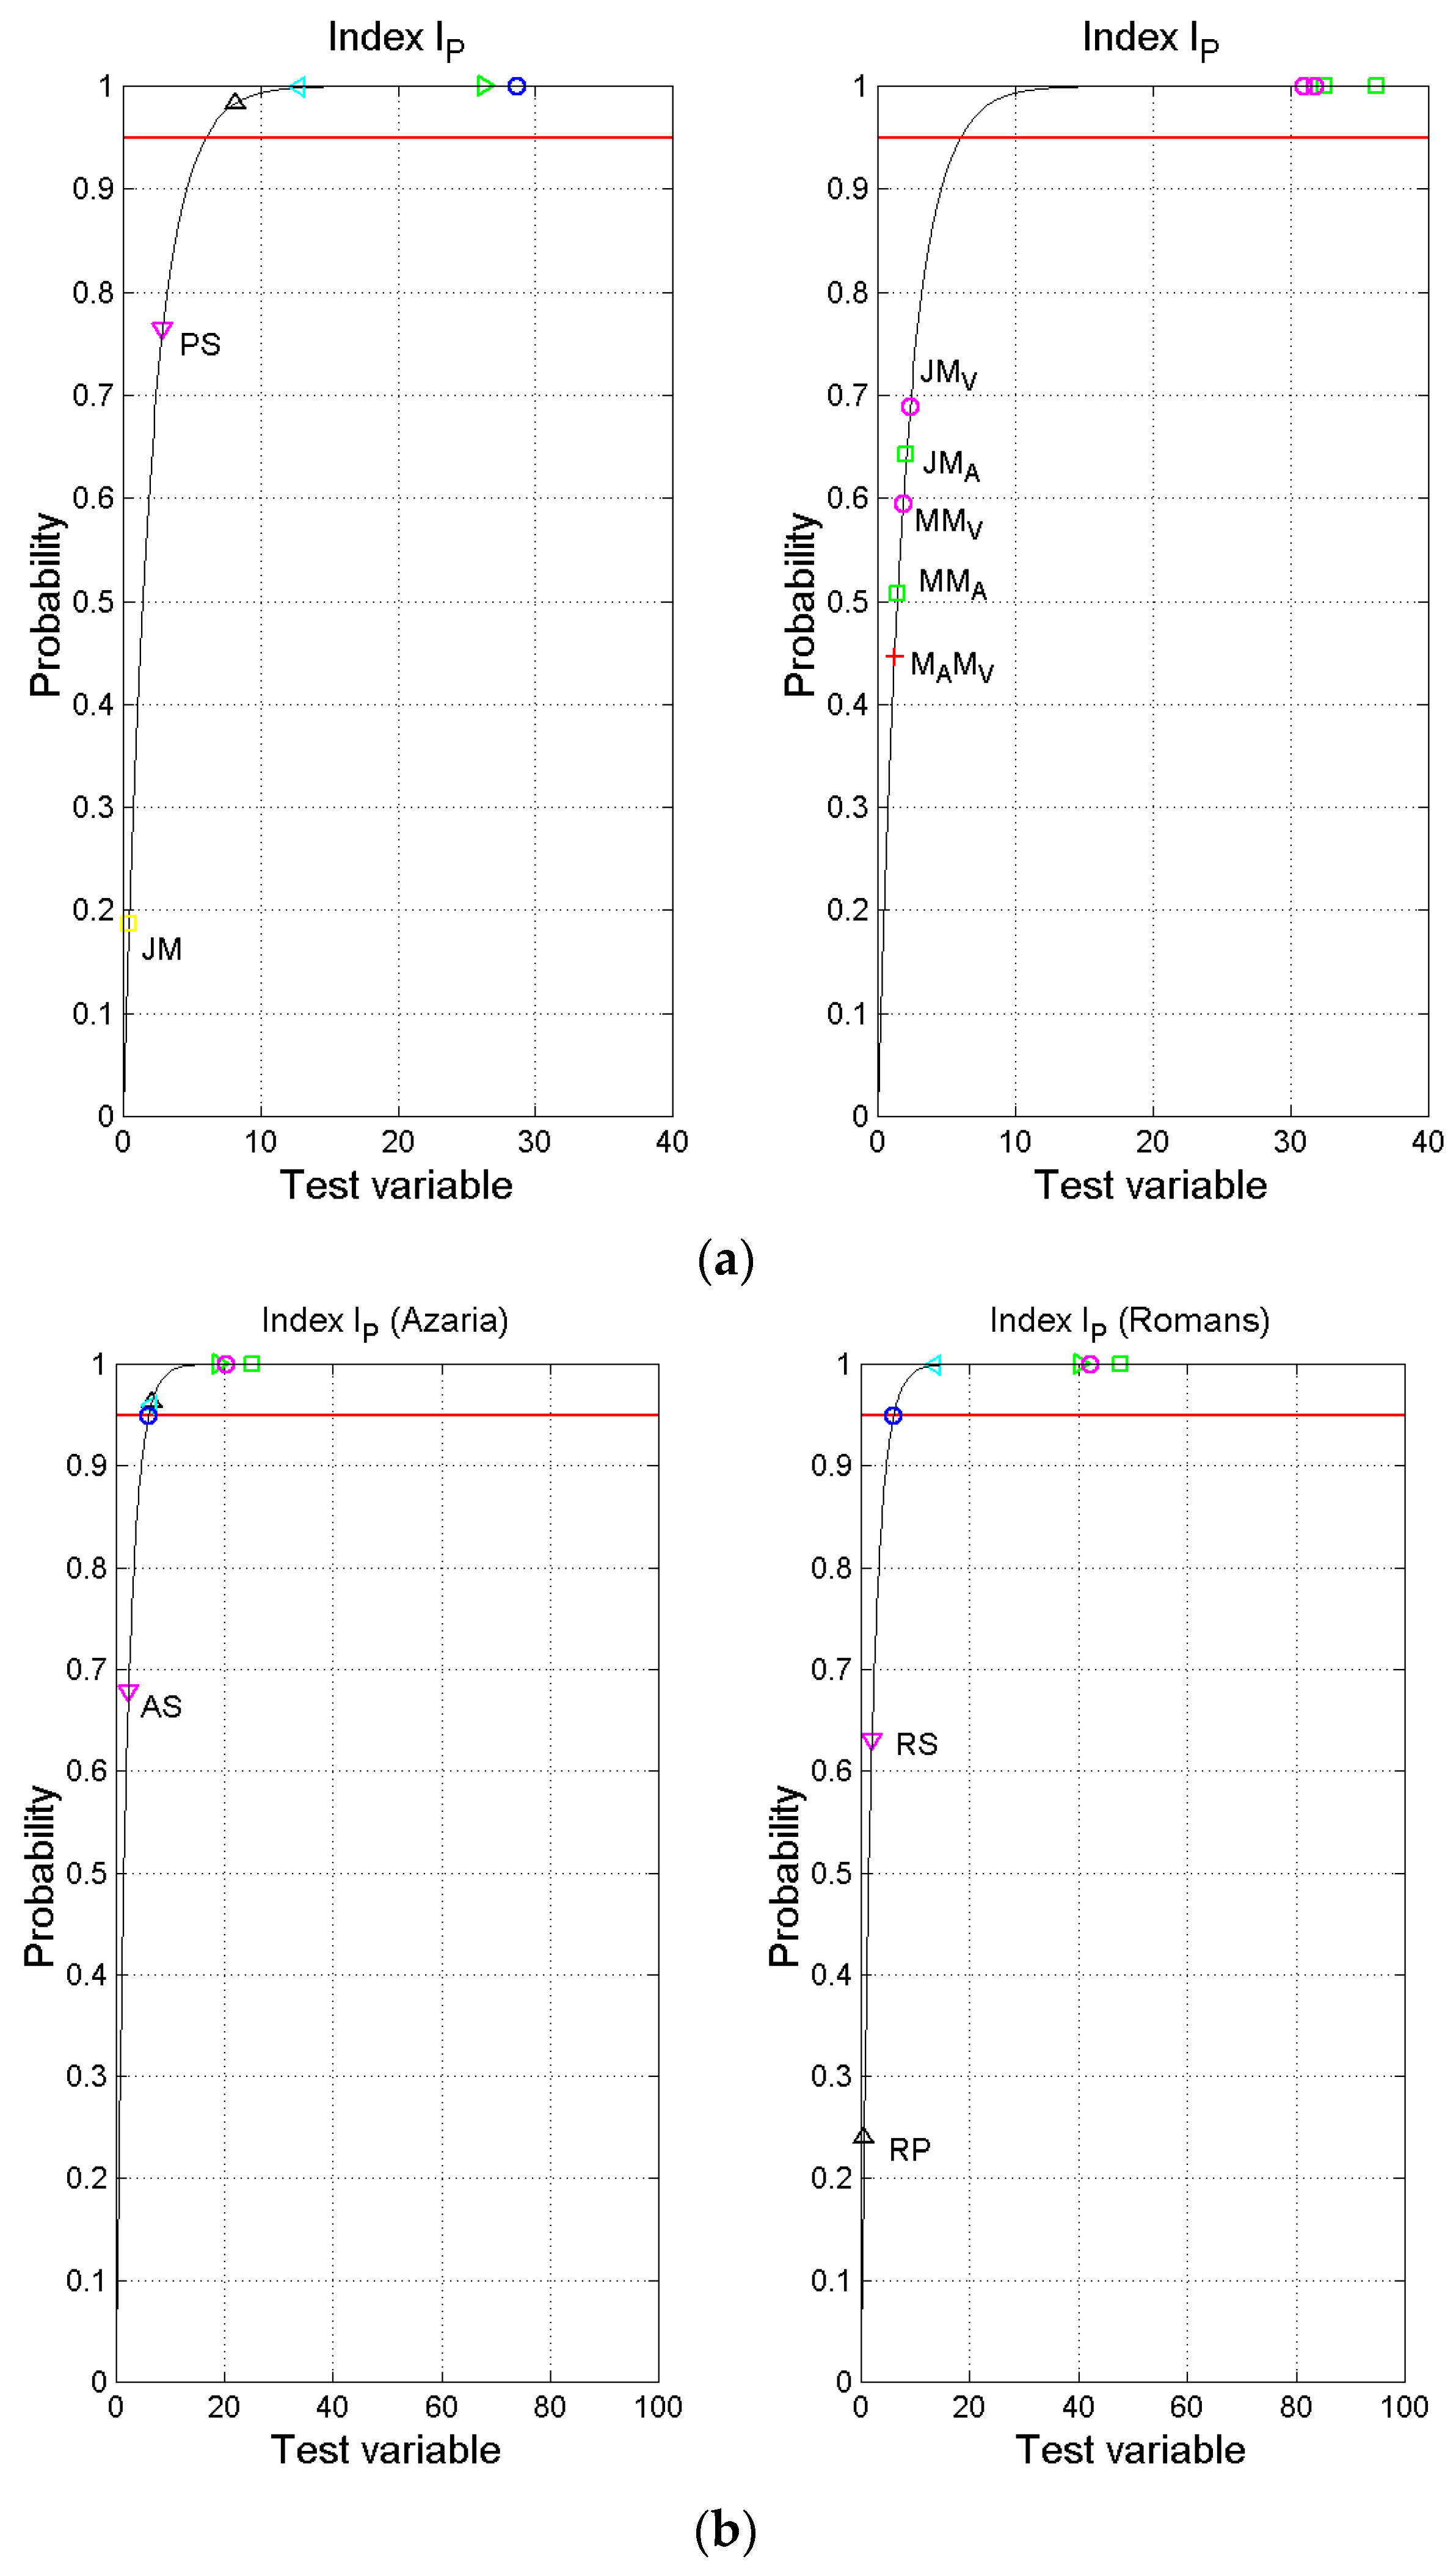
 P F , (Figure 11a, right panel) and the word interval I P (Figure 12a, right panel), this happens only with Jesus says and Mary says. It seems that when Jesus and Mary allegedly speak directly to her, according to her claim, they adapt their communication to the capacity and robust processing time of her short−term memory. On the contrary, when Jesus speaks to a general audience (Parables and Sermons and Speeches) he adopts a significant lower word interval and shorter sentences, because the people may not have had such a good short-term memory as Maria Valtorta did.
Another interesting finding is the great similarity of the texts attributed to Jesus (Parables and Sermons and Speeches), a fact that should be expected in a real situation because this character, in both cases, allegedly speaks to a popular audience.
The comparison with the Italian literature is very striking. A single author, namely Maria Valtorta, seems to be able to write texts so diverse to cover the entire range of the Italian literature.
In conclusion, what do these findings mean? That Maria Valtorta is such a good writer to be able to modulate the linguistic parameters in so many different ways and as a function of character of the plot and type of literary text, so as to cover almost the entire range of the Italian literature? Or that visions and dictations really occurred and she was only a mystical, very intelligent and talented “writing tool”? Of course, no answer grounded in science can be given to the latter question.
As a final observation, the analysis performed in this paper could be done, of course, on other similar mystics’ writings. This could help theologians, working in team with scholars accustomed to using mathematics in their research, to better study mystical revelations by mathematically studying the alleged divine texts.

Author Contributions

Both authors selected and researched Maria Valtorta’s writings, discussed the results, and wrote the paper.

Funding

This research received no external funding.

Conflicts of Interest

The authors declare no conflict of interest.

Appendix A. Scaling Statistics to Text Blocks of Same Length

With reference to Table 1, the standard deviation found in n text blocks σ = x 2 μ 2 ( < > indicates the average value operator, m indicates the average value) is scaled to a reference text of p r = 1000 words by first calculating the number of text blocks with this length, namely n r = p T p r , where and p T = i = 1 n p i is the total number of words, and then scaling σ to σ r = σ × n r n .
Let n be the number of text blocks contained in a literary work and p T = i = 1 n p i the total number of words in it. The average value μ and the standard deviation of the average value σ μ of each parameter are calculated by weighing each text block with its number of words. For example, for G F the average value is given by = 300 × i = 1 i = n f i p i × p i p T , with p i , f i the number of words and sentences, respectively, contained in the text block i t h . For the standard deviation of the average value, we calculate first the average square value v = 300 2 i = 1 i = n ( f i p i ) 2 × p i p T and the standard deviation in the n text blocks = v μ 2 , and finally we calculate σ μ = σ n . In this way, different literary works can be reliably compared with regard to the average value of any parameter, regardless of the choice of the length of text blocks.

Appendix B. Log-Normal Probability Density and Distribution Functions

A log-normal probability density function with three parameters of a random variable x is given (Bury 1975) by:
f ( x ) = 1 2 π s x ( x x 0 ) e x p { 1 2 [ l o g ( x x 0 ) m x ) s x ] 2 } ,   x x 0  
The density function is valid only for x x 0 , being x 0 the minimum theoretical value of x , namely the threshold. The calculation of μ x and σ x from the average value and standard deviations calculated for 1000 words (as shown in (Matricciani 2018)), listed in Table 1 and Table 2, is straight. For example, let us do this exercise for I P of the Jesus’ Sermons and Speeches, where the linear average value μ I p = 6.63 , the standard deviation σ I p = 0.61 ,   x 0 = 1 . The standard deviation s I p and the average value m I p of the random variable l o g ( I P ) of a three-parameter log-normal probability density function are given (natural logs) by:
s I P = l o g [ ( σ I P μ I P 1 ) 2 + 1 ]     =   0.092
m I P = l o g [ ( μ I P x 0 ) σ I P 2 2 ]   =   1.727
The mode (the most likely value) is given by m = e x p ( m I P s I P 2 ) + x 0 = 6.58 . The Kolmogorv−Smirnov test ensures that there are no significant differences between the experimental and theoretical probability distributions, and for all the variables considered in this paper.

Appendix C. Test Variable in the Kolmogorov−Smirnov Test

The test variable (Lindgren 1968, p. 336) for testing and comparing two different probability distributions of the random variable x is given by u = 4 D 2 m n m + n , where D = max x [ F m ( x ) G n ( x ) ] , with F m ( x ) G n ( x ) , these being functions the probability distributions compares; m and n are the number of samples that determine the sample distribution functions F m ( x ) ,   G n ( x ) . In our case m and n are the number of text blocks estimated for 1000 words—see (Matricciani 2018). The probability distribution function drawn in Figure 9, Figure 10, Figure 11 and Figure 12 of not exceeding the indicated abscissa are then calculated, for each possible couple, from P ( y u ) = 1 exp ( u 2 ) , with y a dummy variable.

References

  1. Bury, Karl V. 1975. Statistical Models in Applied Science. Hoboken: John Wiley. [Google Scholar]
  2. Centoni, Albo. 1987. Una Vita con Maria Valtorta. Testimonianze di Marta Diciotti. Isola del Liri: Centro Editoriale Valtortiano. [Google Scholar]
  3. De Caro, Liberato. 2014. I Cieli Raccontano. Indagine Sulla vita di Gesù Nell’opera di Maria Valtorta Attraverso l’Astronomia. Isola del Liri: Centro Editoriale Valtortiano, vol. I. [Google Scholar]
  4. De Caro, Liberato. 2015. I Cieli Raccontano. Indagine Sulla vita di Gesù nell’opera di Maria Valtorta Attraverso l’Astronomia. Isola del Liri: Centro Editoriale Valtortiano, vol. II. [Google Scholar]
  5. De Caro, Liberato. 2017. I Cieli Raccontano. Indagine Sulla Vita di Gesù Nell’opera di Maria Valtorta Attraverso l’Astronomia. Isola del Liri: Centro Editoriale Valtortiano, vol. III. [Google Scholar]
  6. Grzybeck, P. 2007. History and methodology of word length studies. In Contributions to the Science of Text and Language. Dordrecht: Spinger, pp. 15–90. [Google Scholar]
  7. Hopfen, Hans J. 1995. Indice e Carta della Palestina per l’ “Evangelolo come mi è stato rivelato di Maria Valtorta”. Isola del Liri: Centro Editoriale Valtortiano. [Google Scholar]
  8. La Greca, Fernando, and Liberato De Caro. 2017. Nuovi Studi Sulla Datazione Della Crocifissione Nell’anno 34 e Della Nascita di Gesù il 25 Dicembre dell’1 aC. Annales Theologici 31: 11–52. [Google Scholar]
  9. Lindgren, Bernard W. 1968. Statistical Theory, 2nd ed. London: The MacMillan Company. [Google Scholar]
  10. Lucisano, Pietro, and Maria Emanuela Piemontese. 1988. GULPEASE: una formula per la predizione della difficoltà dei testi in lingua italiana. Scuola e città 3: 110–24. [Google Scholar]
  11. Matricciani, Emilio. 2018. Revisiting the GULPEASE readability formula of Italian and its relationship with Miller’s law 7 2 accepted for publication Scienze e Ricerche. in press. [Google Scholar]
  12. Matricciani, Emilio, and Liberato De Caro. 2017. Literary Fiction or Ancient Astronomical and Meteorological Observations in the Work of Maria Valtorta? Religions 8: 110. [Google Scholar] [CrossRef]
  13. Miller, George A. 1955. The Magical Number Seven, Plus or Minus Two. Some Limits on Our Capacity for Processing Information. Psychological Review 63: 343–52. [Google Scholar]
  14. Pisani, Emilio. 2010. A Brief Biography of Maria Valtorta. Available online: http://www.valtorta.org/about_the_author_defaultpage.html (accessed on 17 September 2018).
  15. Trauzettel-Klosinski, Susanne, and Klaus Dietz. 2012. Standardized Assessment of Reading Performance: The New International Reading Speed Texts IreST. IOVS 53: 5452–61. [Google Scholar] [CrossRef] [PubMed]
  16. Valtorta, Maria. 1997. Autobiografia, 3rd ed. Isola del Liri: Centro Editoriale Valtortiano. [Google Scholar]
  17. Valtorta, Maria. 2001. L’Evangelo Come mi è stato Rivelato. Isola del Liri: Centro Editoriale Valtortiano, vol. 10. [Google Scholar]
  18. Valtorta, Maria. 2006a. I Quaderni del 1943. Isola del Liri: Centro Editoriale Valtortiano. [Google Scholar]
  19. Valtorta, Maria. 2006b. I Quaderni del 1944. Isola del Liri: Centro Editoriale Valtortiano. [Google Scholar]
  20. Valtorta, Maria. 2006c. I Quaderni del 1945–50. Isola del Liri: Centro Editoriale Valtortiano. [Google Scholar]
  21. Valtorta, Maria. 2006d. Lezioni sull’Epistola di Paolo ai Romani. Isola del Liri: Centro Editoriale Valtortiano. [Google Scholar]
  22. Valtorta, Maria. 2006e. Quadernetti. Isola del Liri: Centro Editoriale Valtortiano. [Google Scholar]
  23. Valtorta, Maria. 2006f. Lettere a Madre Teresa Maria, voll. I and II. Isola del Liri: Centro Editoriale Valtortiano. [Google Scholar]
  24. Valtorta, Maria. 2006g. Lettere a Mons. Carinci. Isola del Liri: Centro Editoriale Valtortiano. [Google Scholar]
  25. Valtorta, Maria. 2006h. Lettere a padre Migliorini. Isola del Liri: Centro Editoriale Valtortiano. [Google Scholar]
  26. Valtorta, Maria. 2007. Il Libro di Azaria, 2nd ed. Isola del Liri: Centro Editoriale Valtortiano. [Google Scholar]
1
Notice that Jesus’ crucifixion date, derived by the astronomical analyses of Maria Valtorta writings, is April 23 of the year 34. Thus, her visions seems to begin just in the anniversary of Jesus’ crucifixion (Matricciani and De Caro 2017; De Caro 2014, 2015, 2017; La Greca and De Caro 2017).
2
The Italian title is l’Evangelo come mi è stato rivelato, therefore E stands for Evangelo (i.e., Gospel) and MV for Maria Valtorta’s initials.
3
Defined by the editor Emilio Pisani.
4
Referred to as Azariah in the following.
5
Referred to as Romans in the following.
6
EMV chapters: 241, 245, 252, 276, 278, 281, 281, 329, 337, 338, 352, 364, 381, 385, 394, 407, 419, 425, 448, 452, 467, 484, 489, 501, 505, 513, 515, 523, 554, 558, 567, 569, 570, 572, 584, 584.
7
EMV chapters: 49, 50, 64, 68, 79, 92, 93, 96, 98, 108, 119, 120, 122, 123, 125, 127, 128, 129, 131, 145, 154, 157, 159, 169, 170, 171, 172, 173, 174, 176, 180, 211, 212, 277, 288, 297, 342, 344, 352, 354, 363, 371, 378, 397, 398, 399, 421, 423, 428, 447, 448, 451, 455, 457, 463, 487, 491, 493, 506, 507, 514, 518, 526, 532, 534, 540, 551, 554, 567, 577, 583, 591, 596, 596, 596, 597, 600. From 119 to 131 sermons at the Acqua Speciosa. From 169 to 176 sermons on the mount. Speech to Judas thief, 567. Last Supper, 600.
8
Only the texts attributed specifically to Azariah are considered.
9
Only the texts attributed specifically to the Holy Author are considered.
10
“366” indicates the chapter, “9” indicates the subdivision of the chapter.
11
In this case, the number refers to text blocks of about 1000 words. Notice that the reference to text blocks of a given number of words does affect the standard deviation of the random variable, but does not change its average value and standard deviation of the average value.
12
In this case, text blocks of about 1000 words have been analyzed. Notice that this choice has no impact on average values.
13
The choice of which parameter represents the component x or y is not important. Once the choice is made, the numerical results will depend on it, but not the relative comparisons and general conclusions.
14
From vector analysis, the two components of a vector are given by x = k = 1 6 x k , y = k = 1 6 y k . The magnitude is given by the Euclidean (Pythagorean) distance R = x 2 + y 2 .
15
A compulsory reading in any Italian High School.
16
According to the definition of the components of the resulting vector (5), the overall standard deviation of coordinates x and y can be estimated, to a first approximation, as δ x = σ M F 2 + 4 σ C P 2 + 9 σ I P 2 and δ y = σ C P 2 + 4 σ F 2 + 9 σ P F 2 , where the standard deviation of the average value of each variable is given in Table 2.
Figure 1. Syntactic G C (circles) and semantic G F (crosses) indices versus the readability index G for single text blocks examined. Cyan and blue marks refer to the Italian literature (Matricciani 2018), corresponding red marks refer to all Maria Valtorta’s literary texts. The horizontal line is the average value of G C , the slant line is the average value of G F , both relative to the Italian literature.
Religions 09 00373 g001
Figure 2. Syntactic G C (circles) and semantic G F (crosses) indices versus the readability index G for single text blocks examined in Boccaccio’s Decameron (14th century), black marks, and in Cassola’s La ragazza di Bube (20th century), blue marks.
Religions 09 00373 g002
Figure 3. Syntactic G C (circles) and semantic G F (crosses) indices versus the word interval I P for single text blocks examined. Cyan and blue marks refer to the Italian literature (Matricciani 2018), red marks refer to Maria Valtorta’s literary texts. The time axis (seconds) refers to the time interval I T calculated by applying (4) with v = 188 words per minute.
Religions 09 00373 g003
Figure 4. Syntactic G C (circles) and semantic G F (crosses) indices versus the word interval I P for single text blocks examined in Boccaccio’s Decameron (XIV century), black marks, and in Cassola’s La ragazza di Bube (XX century), blue marks. Time axis in seconds.
Religions 09 00373 g004
Figure 5. Probability density functions (upper panel) and probability distribution functions (lower panel) of the readability index G . Parables: green line; Jesus’ Sermons and Speeches: magenta; Jesus says: blue; Mary says: cyan; Azariah: black continuous line; Romans: black dashed line; Autobiography: red continuous line; Maria Valtorta’s Descriptions: red dashed line.
Religions 09 00373 g005
Figure 6. Probability density functions (upper panel) and probability distribution functions (lower panel) of the number of characters per word I P . Parables: green line; Jesus’ Sermons and Speeches: magenta; Jesus says: blue; Mary says: cyan; Azariah: black continuous line; Romans: black dashed line; Autobiography: red continuous line; Maria Valtorta’s Descriptions: red dashed line.
Religions 09 00373 g006
Figure 7. Probability density functions (upper panel) and probability distribution functions (lower panel) of the number of words per sentence P F . Parables: green line; Jesus’ Sermons and Speeches: magenta; Jesus says: blue; Mary says: cyan; Azariah: black continuous line; Romans: black dashed line; Autobiography: red continuous line; Maria Valtorta’s Descriptions: red dashed line.
Religions 09 00373 g007
Figure 8. Probability density functions (upper panel) and probability distribution functions (lower panel) of the word interval I P . Parables: green line; Jesus’ Sermons and Speeches: magenta; Jesus says: blue; Mary says: cyan; Azariah: black continuous line; Romans: black dashed line; Autobiography: red continuous line; Maria Valtorta’s Descriptions: red dashed line.
Religions 09 00373 g008
Figure 9. (a) Kolmogorov−Smirnov test probability of the test variable concerning the readability index G of two literary texts. The left panel refers only to the EMV texts, the right panel refers to couples that include Maria Valtorta’s Autobiography and Descriptions. Explicitly labeled only the couples of texts for which, at the 95% confidence level (probability less than 0.95, horizontal red line) they are likely attributable to the same population. Colours are used only to better point out the position of values of Kolmogorov−Smirnov test. Their key is made explicit in the following captions. SM: Jesus’ Sermons and Speeches and Mary says; JM: Jesus says and Mary says; PS: Parables and Jesus’ Sermons and Speeches; PM: Parables and Mary says; MM A : M a r y   s a y s   and   M a r i a   V a l t o r t a s   A u t o b i o g r a p h y . The couples not explicitly labeled should thus belong to different populations with probability larger than 0.95 and most of them with probability close to 1; (b) Kolmogorov−Smirnov test probability of the test variable concerning the readability index G of two literary texts. The left panel refers to couples that include Azariah, the right panel refers to couples that include Romans. Explicitly labeled only the couples of texts for which, at the 95% confidence level (probability less than 0.95, horizontal red line), they are likely attributable to the same population. A M V : Azariah and Maria Valtorta’s Descriptions. The couples not explicitly labeled should thus belong to different populations with probability larger than 0.95 and most of them with probability very close to 1.
Religions 09 00373 g009aReligions 09 00373 g009b
Figure 10. (a) Kolmogorov−Smirnov test probability of the test variable concerning the number of characters per word C P of two literary texts. The left panel refers only to the EMV texts; the right panel refers to couples that include Maria Valtorta’s Autobiography and Descriptions. Only the couples of texts which at the 95% confidence level (probability less than 0.95, horizontal red line) are likely attributable to the same population are explicitly labeled. Colours are used only to better point out the position of values of Kolmogorov−Smirnov test. Their key is made explicit in the following captions. PM: Parables and Mary says; SM: Jesus’ Sermons and Speeches and Mary says; PJ: Parables and Jesus says; PS: Parables and Jesus’ Sermons and Speeches; JM: Jesus says and Mary says. The couples not explicitly labeled should thus belong to different populations with probability larger than 0.95 and most of them with probability close to 1; (b) Kolmogorov−Smirnov test probability of the test variable concerning the number of characters per word C P of two literary texts. The left panel refers to couples that include Azariah; the right panel refers to couples that include Romans. Explicitly labeled only the couples of texts for which, at the 95% confidence level (probability less than 0.95, horizontal red line), they are likely due to the same population. A M A : Azariah and Maria Valtorta’s Autobiography; A M V : Azariah and Maria Valtorta’s Descriptions. The couples not explicitly labeled should thus belong to different populations with probability larger than 0.95 and most of them with probability very close to 1.
Religions 09 00373 g010
Figure 11. (a) Kolmogorov−Smirnov test probability of the test variable concerning the number of words per sentence P F of two literary texts. The left panel refers only to the EMV texts, the right panel refers to couples that include Maria Valtorta’s Autobiography and Descriptions. Only the couples of texts which at the 95% confidence level (probability less than 0.95, horizontal red line) are likely attributable to the same population are explicitly labeled. Colours are used only to better point out the position of values of Kolmogorov−Smirnov test. Their key is made explicit in the following captions. JM: Jesus says and Mary says. SM: Jesus’ Sermons and Speeches and Mary says; PS: Parables and Jesus’ Sermons and Speeches; PM: Parables and Mary says; MM A : Mary says and Maria Valtorta’s Autobiography; JM A : Jesus says and Maria Valtorta’s Autobiography. The couples not explicitly labeled should thus belong to different populations with probability larger than 0.95 and most of them with probability close to 1; (b) Kolmogorov−Smirnov test probability of the test variable concerning the number of words per sentence P F of two literary texts. The left panel refers to couples that include Azariah, the right panel refers to couples that include Romans. No couple is found at the 95% confidence level (horizontal red line). All literary texts are due to different populations with probability larger than 095; most of them with probability very close to 1.
Religions 09 00373 g011aReligions 09 00373 g011b
Figure 12. (a) Kolmogorov−Smirnov test probability of the test variable concerning the word interval I P of two literary texts. The left panel refers only to the EMV texts, the right panel refers to couples that include Maria Valtorta’s Autobiography and Descriptions. Only the couples of texts which at the 95% confidence level (probability less than 0.95, horizontal red line) are likely attributable to the same population are explicitly labeled. Colours are used only to better point out the position of values of Kolmogorov−Smirnov test. Their key is made explicit in the following captions. JM: Jesus says and Mary says. PS: Parables and Jesus’ Sermons and Speeches; M A M V : Maria Valtorta’s Autobiography and Maria Valtorta’s Descriptions; MM A : Mary says and Maria Valtorta’s Autobiography; MM V : Mary says and Maria Valtorta’s Descriptions; JM A : Jesus says and Maria Valtorta’s Autobiography. The couples not explicitly labeled should thus belong to different populations with probability larger than 0.95 and most of them with probability close to 1; (b) Kolmogorov−Smirnov test probability of the test variable concerning the word interval I P of two literary texts. The left panel refers to couples that include Azariah, the right panel refers to couples that include Romans. AS: Azariah and Jesus’ sermons and Speeches; RP: Romans and Parables; RS: Romans and Jesus’ Sermons and Speeches. The couples not explicitly labeled should thus belong to different populations with probability larger than 0.95 (horizontal red line), most of them with probability very close to 1.
Religions 09 00373 g012
Figure 13. Coordinates x and y of the resulting vector (5) of a literary work, referred (normalized) to the coordinates of the Boccaccio and Cassola, by assuming Cassola’s La Ragazza di Bube as the origin, coordinates (0,0), and Boccaccio’s Decameron located at (1,1). Colours are used only to better point out the position of values. Their key is made explicit in the following captions. P: Parables; S: Jesus’ Sermons and Speeches; J: Jesus says; M: Mary says. A: Azariah; R: Romans; JJ: letter of John of Endor to Jesus; SJ: letters of Sintica to Jesus; MJ: letter of Mary to Jesus; M A : Maria Valtorta’s Autobiography; M V : Maria Valtorta’s Descriptions; C: Cassola; D: De Amicis’ Cuore; M PS : Manzoni’s I Promessi 200; M FL : Manzoni’s Fermo e Lucia; F S : Fogazzaro’s Il Santo; F P : Fogazzaro’s Piccolo Mondo Antico; C M : Calvino’s Marcovaldo; C B : Calvino’s Il Barone Rampante; IT: barycenter of the Italian literature. The blue box gives δ overall standard deviation of the vector’s coordinates of Jesus says; the red box gives the δ overall standard deviation of the vector’s coordinates of Maria Valtorta’s Autobiography.
Religions 09 00373 g013
Table 1. Characters, words and sentences in Maria Valtorta’s writings, and average values of the corresponding readability index G , the semantic index G C , and the syntactic index G F , the standard deviation of averages (in parentheses) and the standard deviation estimated for text blocks of 1000 words (see Appendix A for more details). The characters are those contained in the words. All parameters have been computed by weighting the text blocks according to the number of the words contained in them (Appendix A) For instance, in Parables the average value of G can be estimated in 64.71 ± 0.72 and its standard deviation for text blocks of 1000 words is 4.17.
Maria Valtorta’s WritingCharactersWordsSentences G G C G F
Parables6 (EMV)150,76433,808228964.7144.5920.31
(0.72)(0.18)(0.69)
4.171.063.89
Jesus’ sermons and speeches7 (EMV)489,162111,033683163.3344.0618.46
(0.53)(0.14)(0.48)
5.631.435.03
Jesus says (Valtorta 2001, 2006a)1,179,975262,45015,07861.2844.9617.24
(0.25)(0.07)(0.23)
3.981.103.68
Mary says (Valtorta 2001, 2006a, 2006b, 2006c)138,85031,234186262.3944.4517.88
(1.07)(0.21)(0.96)
5.991.195.35
Azariah8502,182110,261549458.4245.5514.95
(0.37)(0.13)(0.30)
3.911.373.19
Romans9375,04780,756301453.78 46.44 11.20
(0.41)(0.15)(0.35)
3.711.333.19
Letters of Sintica to Jesus (EMV 366.910; EMV 461.13)14,151318420563.8744.4419.32
Letter of Mary to Jesus (EMV,133.4)37999175465.2441.4317.67
Letter of John of Endor to Jesus (EMV, 366.6)41369386963.7844.0922.07
Maria Valtorta’s descriptions (EMV)491,612107,183503057.2045.8714.08
(0.36)(0.10)(0.31)
3.691.013.22
Autobiography11688,003151,334832560.04 45.4616.50
(0.35)(0.11)(0.32)
4.241.353.88
Table 2. Average values of number of characters per word C P , words per sentence P F , punctuation marks per sentence M F and word interval I P . Standard deviations are calculated as in Table 1.
Maria Valtorta’s WritingCharacters per Word C P Words per Sentence P F Punctuation Marks (and Word Intervals) per Sentence M F Word Interval (Words per Punctuation Marks) I P
Parables4.45915.712.366.63
(0.018)(0.66)(0.08)(0.11)
0.1063.830.470.61
Jesus’ Sermons and Speeches4.40617.132.476.91
(0.136)(0.46)(0.06)(0.08)
0.1434.850.62(0.82)
Jesus says4.49618.372.427.59
(0.068)(0.26)(0.03)(0.06)
0.1104.160.460.94
Mary says4.44518.712.427.64
(0.021)(1.05)(0.11)(0.22)
0.1195.900.571.20
Azariah4.55520.962.977.0781
(0.013)(0.43)(0.06)(0.07)
0.1374.460.600.74
Romans4.64428.684.236.76
(0.015)(1.02)(0.14)(0.07)
0.1339.201.230.66
Letters of Sintica to Jesus4.44415.532.336.68
Letter of Mary to Jesus4.14316.982.337.28
Letter of John of Endor to Jesus4.40913.592.285.98
Maria Valtorta’s Descriptions4.58724.223.187.60
(0.10)(0.57)(0.07)(0.07)
0.1015.860.700.69
Autobiography124.54619.292.507.71
(0.011)(0.41)(0.05)(0.07)
0.1355.0260.580.83

