
Religious Diversity Predicts Religions’ Population Growth in Tighter (vs. Looser) Cultures: A Study of Personality & Self-Reported Religion across 111 Countries
Abstract
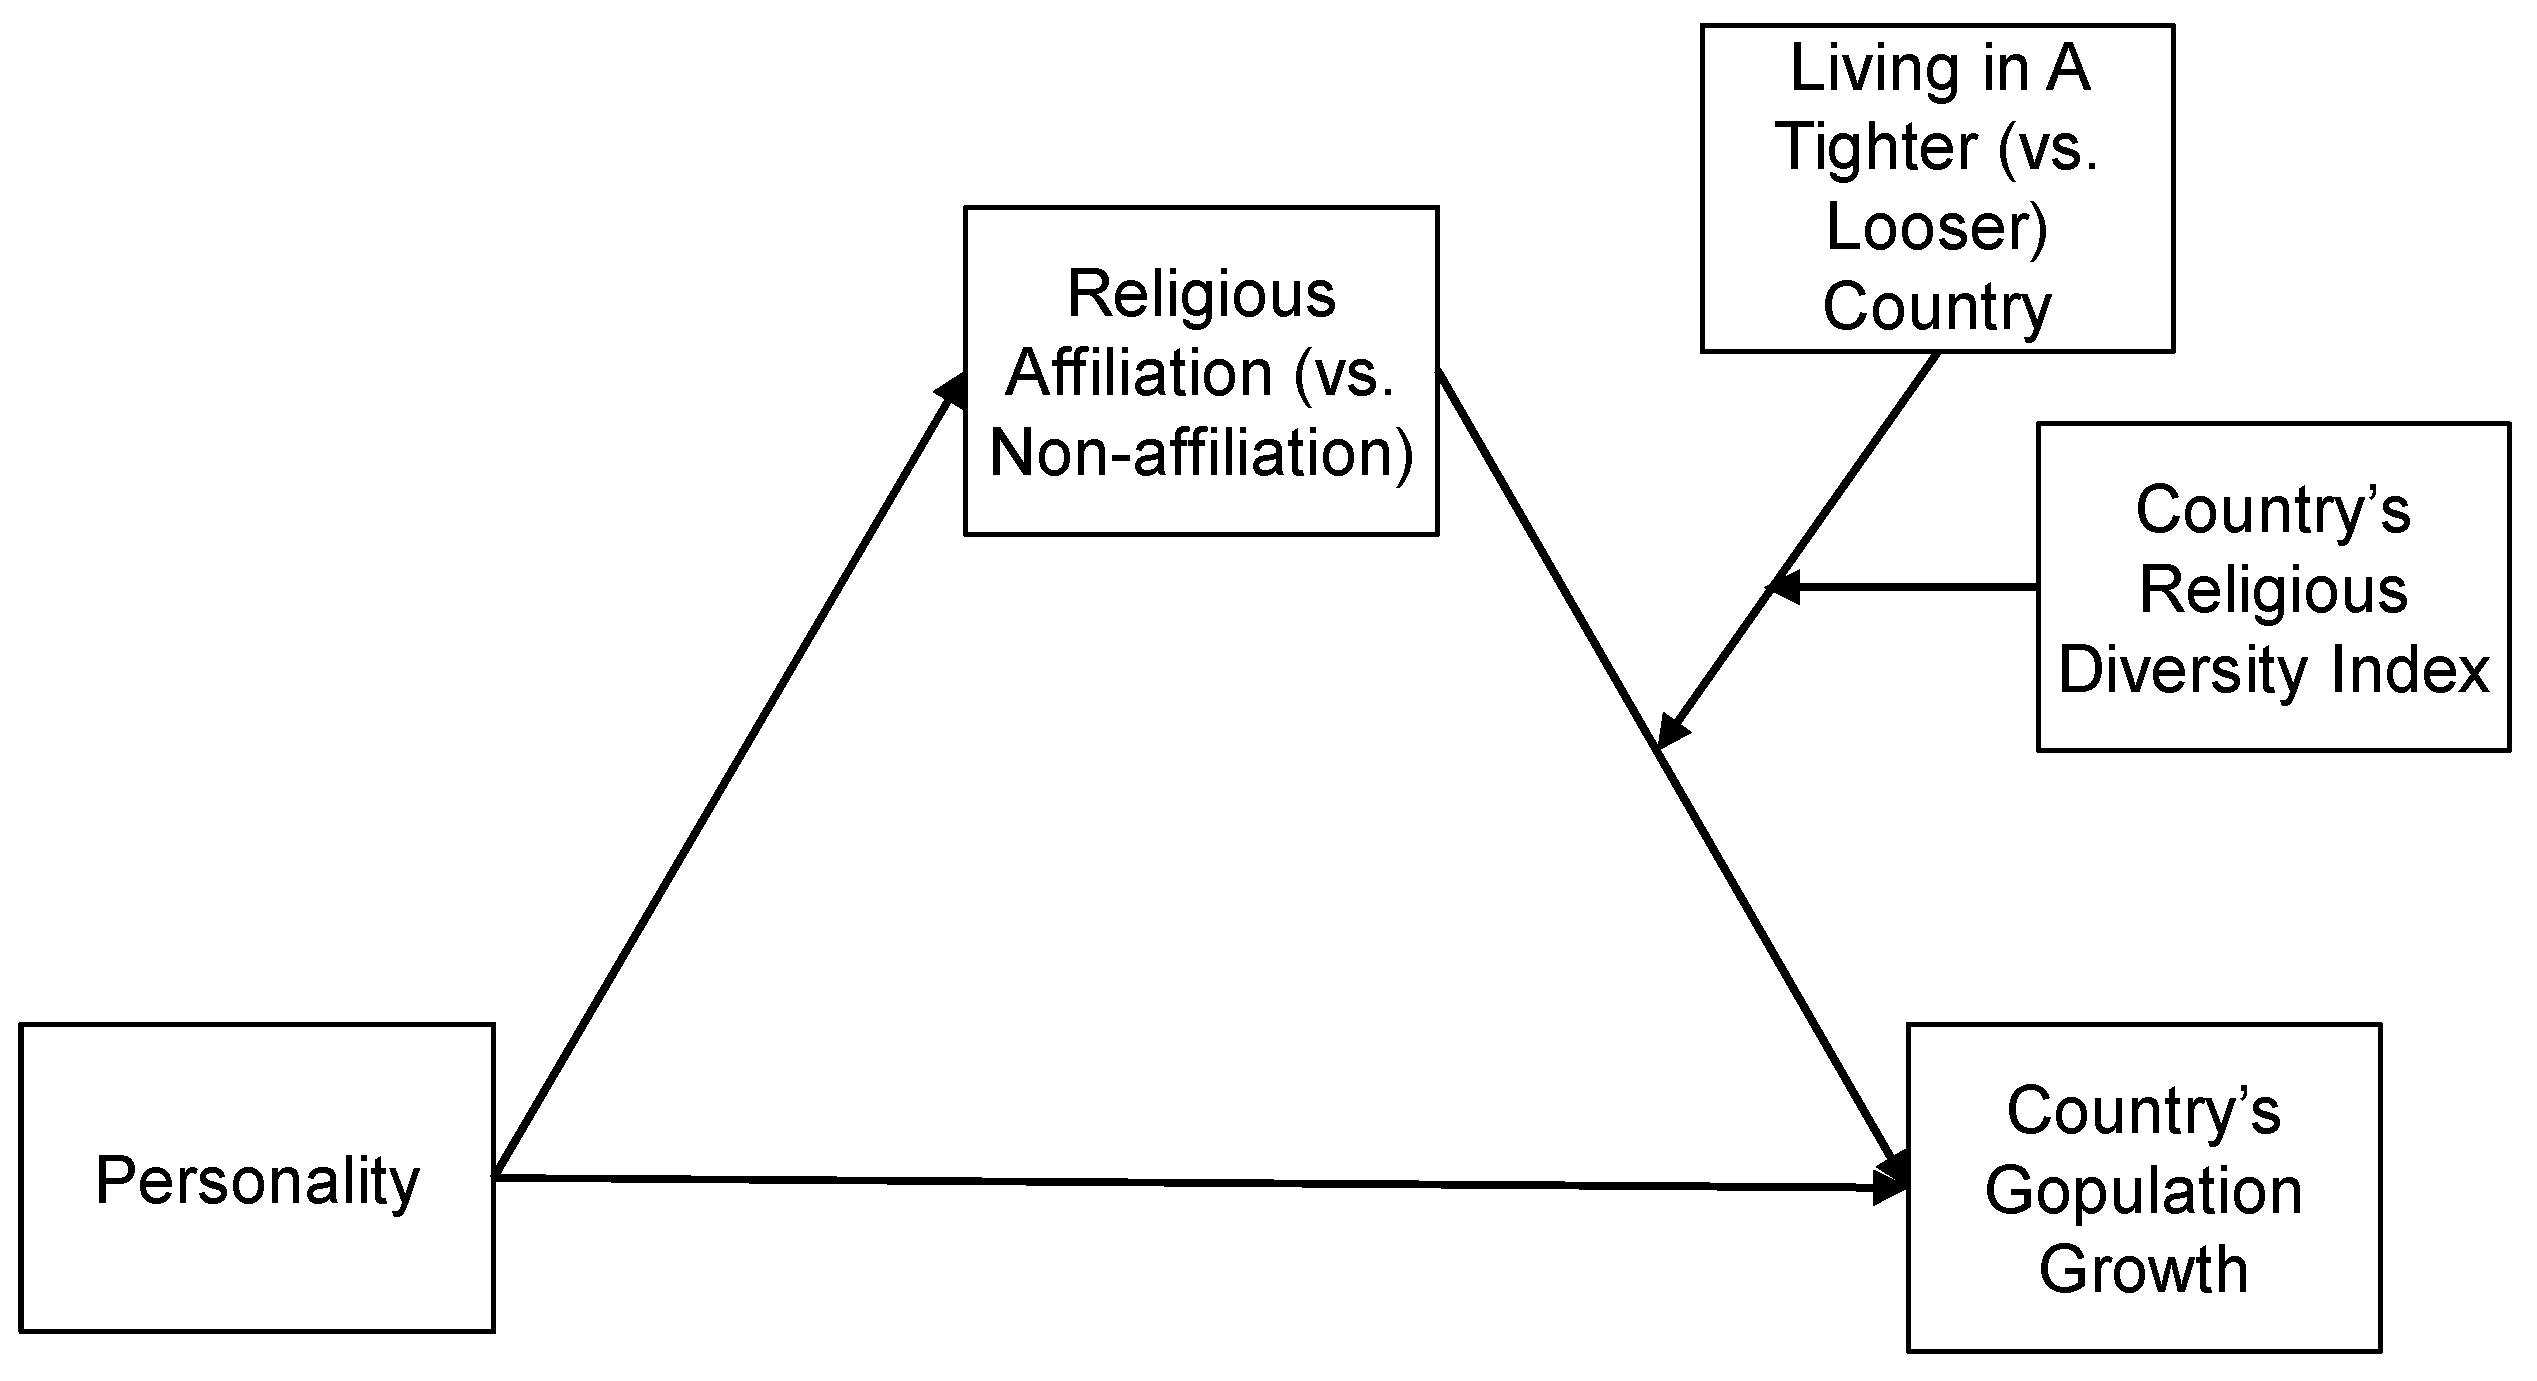
:1. Introduction
2. Results
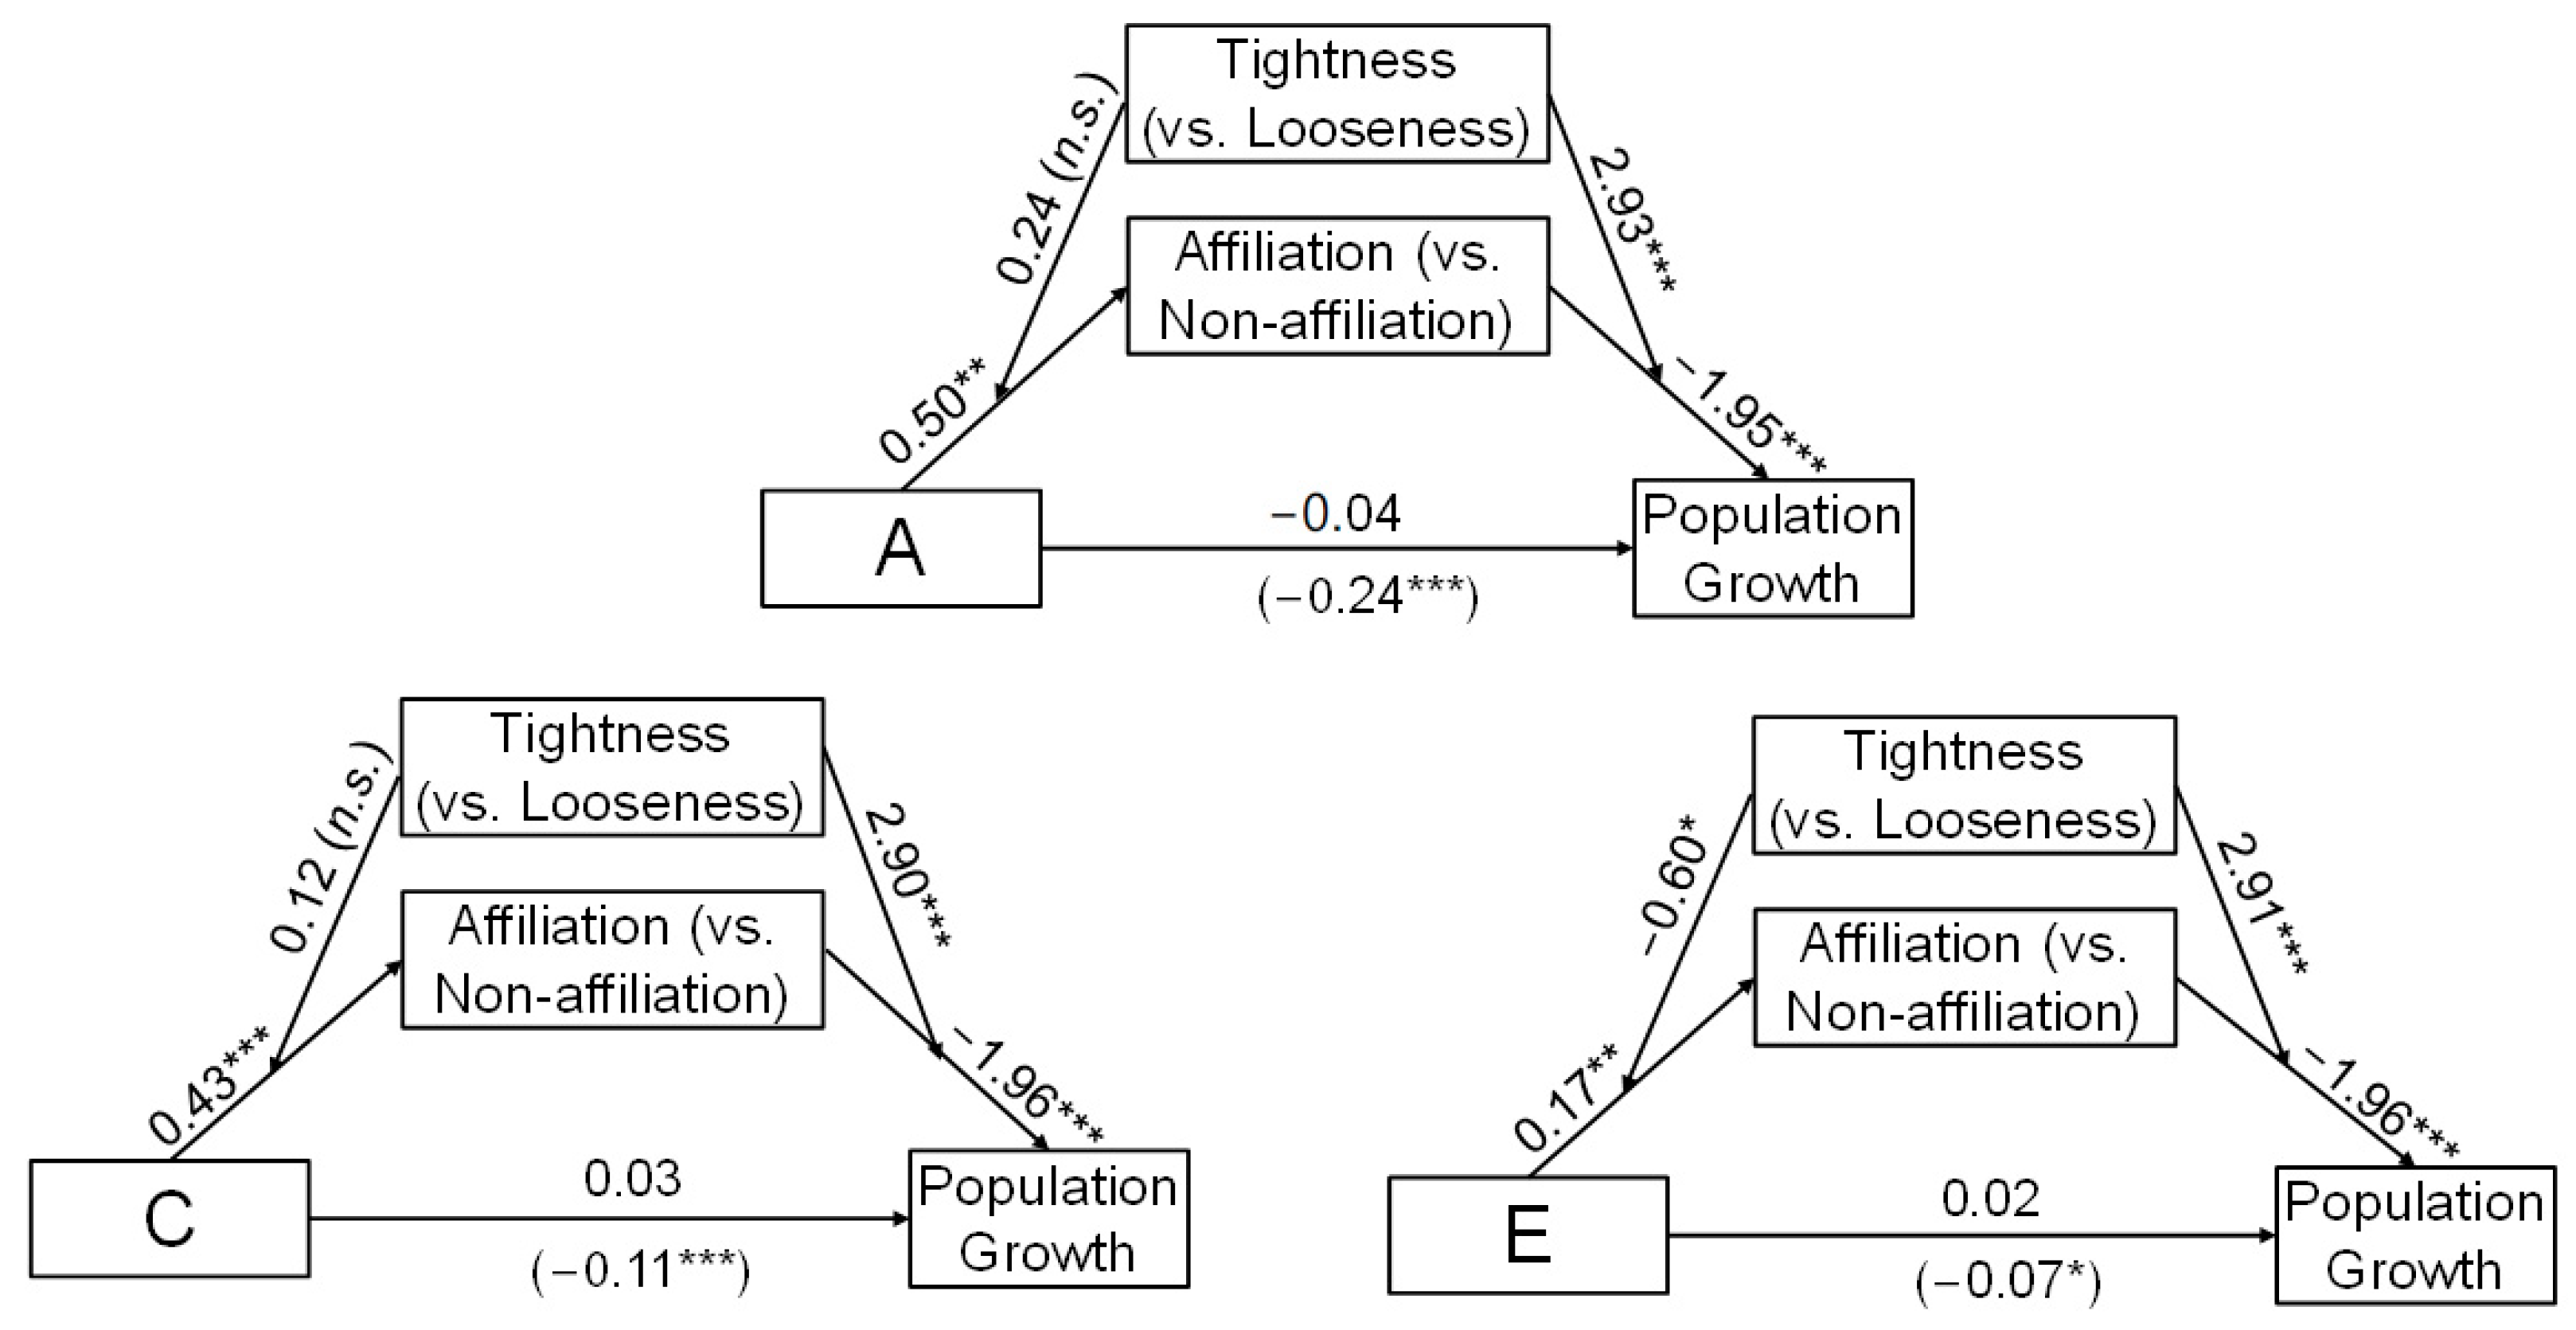
2.1. Personality × Tightness (vs. Looseness) Interaction Effects
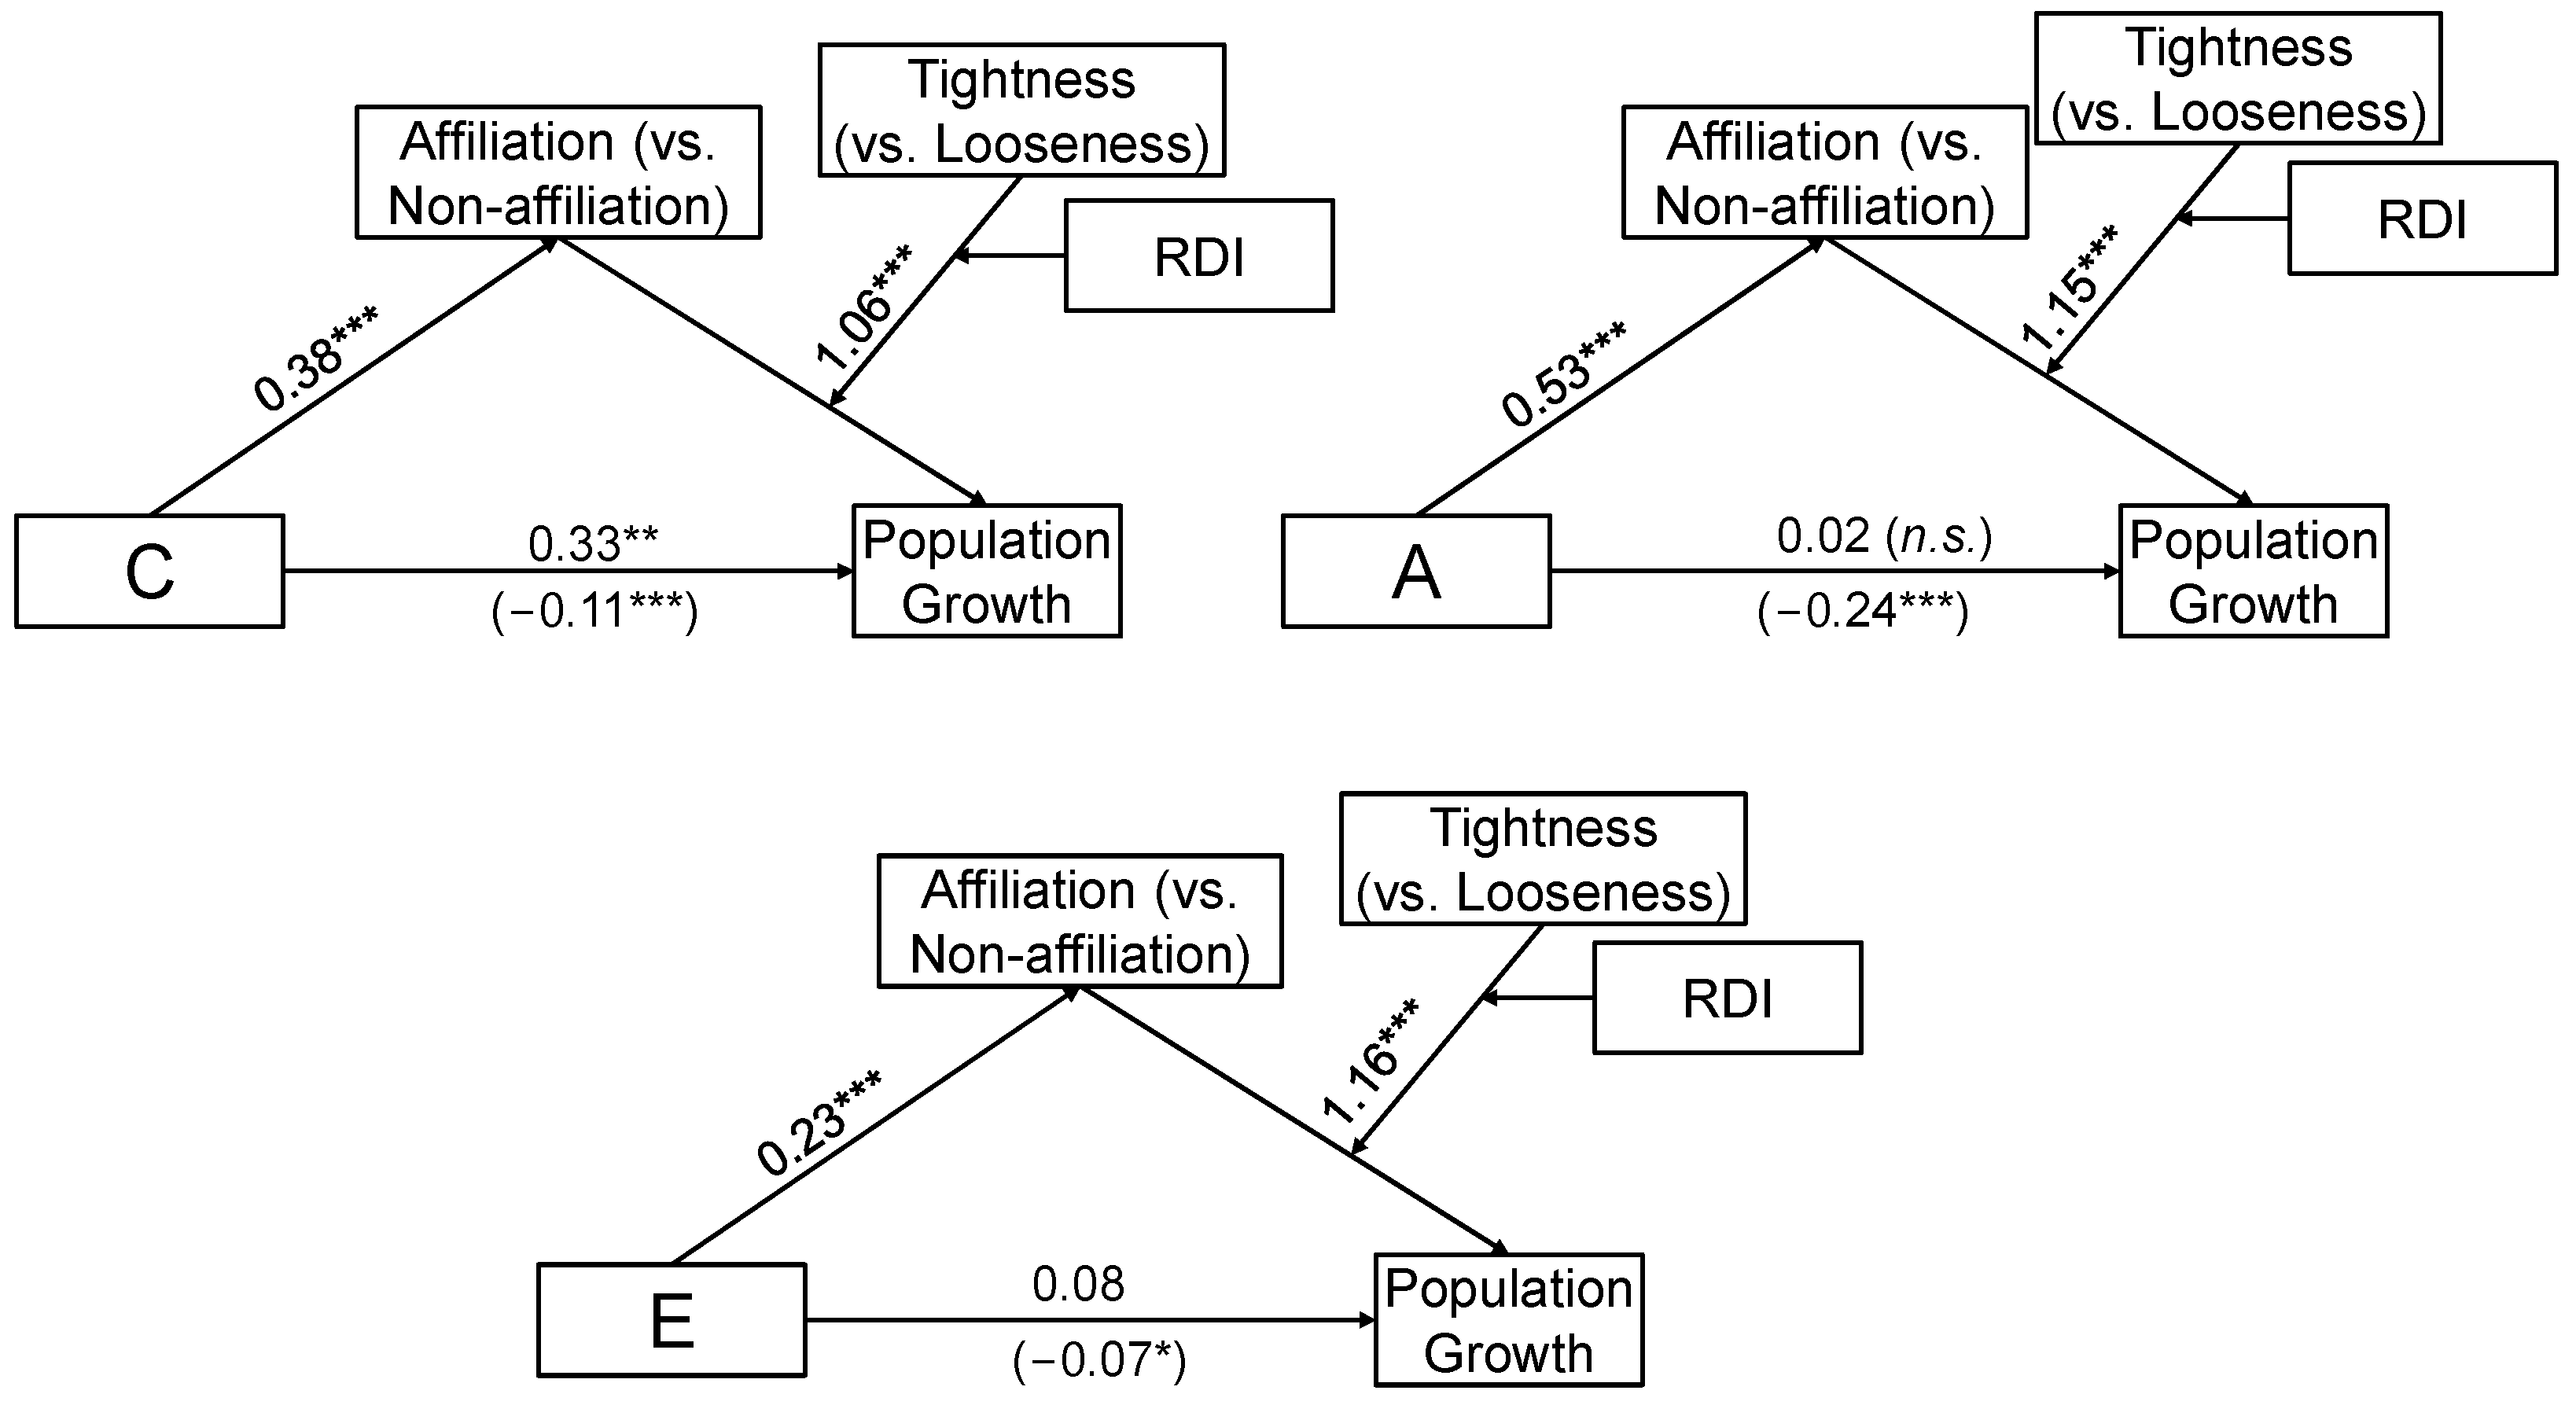
2.2. Personality × Tightness (vs. Looseness) × Religious Diversity Interaction Effects
3. Discussion
4. Materials and Methods
4.1. Sample
4.2. Power Analysis
4.3. Measure
4.4. Data Analysis
Funding
Institutional Review Board Statement
Informed Consent Statement
Data Availability Statement
Conflicts of Interest
References
- Ananth, Cande V. 2019. Proportion mediated in a causal mediation analysis: How useful is this measure? BJOG: An International Journal of Obstetrics and Gynaecology 126: 983. [Google Scholar] [CrossRef]
- Bentzen, Jeanet Sinding. 2021. In crisis, we pray: Religiosity and the COVID-19 pandemic. Journal of Economic Behavior & Organization 192: 541–83. [Google Scholar] [CrossRef]
- Berzonsky, Michael D., Bart Soenens, Koen Luyckx, Ilse Smits, Dennis R. Papini, and Luc Goossens. 2013. Development and validation of the revised Identity Style Inventory (ISI-5): Factor structure, reliability, and validity. Psychological Assessment 25: 893–904. [Google Scholar] [CrossRef] [PubMed]
- Brown, Davis, and Patrick James. 2019. Religious Characteristics of States Dataset Project—Demographics v. 2.0 (RCS-Dem 2.0), COUNTRIES ONLY. Available online: https://www.thearda.com/data-archive?fid=RCSDEM2&tab=1 (accessed on 22 July 2023).
- Casanova, José. 2018. The Karel Dobbelaere lecture: Divergent global roads to secularization and religious pluralism. Social Compass 65: 187–98. [Google Scholar] [CrossRef]
- Chaves, Mark, and Philip S. Gorski. 2001. Religious Pluralism and Religious Participation. Annual Review of Sociology 27: 261–81. [Google Scholar] [CrossRef]
- Cheek, Jonathan M., Linda R. Tropp, Lisa C. Che, and Marion K. Underwood. 1994. Identity Orientations: Personal, social, and collective aspects of identity. Paper presented at the Meeting of the American Psychological Association, Los Angeles, CA, USA, August 11 and 14. [Google Scholar]
- Cohen, Jacob. 1988. Statistical Power Analysis for the Behavioral Sciences, 2nd ed. Hillsdale: Lawrence Erlbaum Associates. [Google Scholar]
- Finke, Roger, and Rodney Stark. 1988. Religious economies and sacred canopies: Religious mobilization in American cities, 1906. American Sociological Review 53: 41–49. [Google Scholar] [CrossRef]
- Gebauer, Jochen E., Wiebke Bleidorn, Samuel D. Gosling, Peter J. Rentfrow, Michael E. Lamb, and Jeff Potter. 2014. Cross-cultural variations in Big Five relationships with religiosity: A socio-cultural motives perspective. Journal of Personality and Social Psychology 107: 1064–91. [Google Scholar] [CrossRef] [PubMed]
- Gelfand, Michele J., Jana L. Raver, Lisa Nishii, Lisa M. Leslie, Janetta Lun, Beng Chong Lim, Lili Duan, Assaf Almaliach, Soon Ang, Jakobina Arnadottir, and et al. 2011. Differences between tight and loose cultures: A 33-nation study. Science 332: 1100–4. [Google Scholar] [CrossRef] [PubMed]
- Gelfand, Michele J., Joshua Conrad Jackson, Xinyue Pan, Dana Nau, Dylan Pieper, Emmy Denison, Munqith Dagher, Paul A. M. Van Lange, Chi-Yue Chiu, and Mo Wang. 2021. The relationship between cultural tightness–looseness and COVID-19 cases and deaths: A global analysis. The Lancet Planetary Health 5: e135–e44. [Google Scholar] [CrossRef] [PubMed]
- Goldberg, Lewis R., John A. Johnson, Herbert W. Eber, Ro bert Hogan, Michael C. Ashton, C. Robert Cloninger, and Harrison G. Gough. 2006. The international personality item pool and the future of public domain personality measures. Journal of Research in Personality 40: 84–96. [Google Scholar] [CrossRef]
- Gorski, Philip S., and Ateş Altınordu. 2008. After Secularization? Annual Review of Sociology 34: 55–85. [Google Scholar] [CrossRef]
- Granovetter, Mark S. 1973. The strength of weak ties. American Journal of Sociology 78: 1360–80. [Google Scholar] [CrossRef]
- Harrington, Jesse R., and Michele J. Gelfand. 2014. Tightness–looseness across the 50 united states. Proceedings of the National Academy of Sciences 111: 7990–95. [Google Scholar] [CrossRef] [PubMed]
- Johnson, Todd M., and Brian J. Grim. 2013. The World’s Religions in Figures: An Introduction to International Religious Demography. West Sussex: John Wiley and Sons. [Google Scholar]
- Liu, Pan, David Chan, Lin Qiu, William Tov, and Victor Joo Chuan Tong. 2018. Effects of cultural tightness-looseness and social network density on expression of positive and negative emotions: A large-scale study of impression management by Facebook users. Personality and Social Psychology Bulletin 44: 1567–81. [Google Scholar] [CrossRef]
- Nakagawa, Shinichi, and Holger Schielzeth. 2013. A general and simple method for obtaining R2 from generalized linear mixed-effects models. Methods in Ecology and Evolution 4: 133–42. [Google Scholar] [CrossRef]
- Pew Research Center. 2014a. Global Religious Diversity. Available online: https://www.pewresearch.org/religion/wp-content/uploads/sites/7/2014/04/Religious-Diversity-full-report.pdf (accessed on 15 July 2023).
- Pew Research Center. 2014b. Religious Landscape Study (RLS-II) Final Topline. Available online: https://www.pewresearch.org/religion/wp-content/uploads/sites/7/2015/05/RLS-II-FINAL-TOPLINE-FOR-FIRST-RELEASE.pdf (accessed on 21 December 2022).
- Saroglou, Vassilis, Magali Clobert, Adam B. Cohen, Kathryn A. Johnson, Kevin L. Ladd, Matthieu Van Pachterbeke, Lucia Adamovova, Joanna Blogowska, Pierre-Yves Brandt, Cem Safak Çukur, and et al. 2020. Believing, bonding, behaving, and belonging: The cognitive, emotional, moral, and social dimensions of religiousness across cultures. Journal of Cross-Cultural Psychology 51: 551–75. [Google Scholar] [CrossRef]
- Shahabi, Leila, Lynda H. Powell, Marc A. Musick, Kenneth I. Pargament, Carl E. Thoresen, David Williams, Lynn Underwood, and Marcia A. Ory. 2002. Correlates of self-perceptions of spirituality in American adults. Annals of Behavioral Medicine 24: 59–68. [Google Scholar] [CrossRef]
- Stark, Rodney, Roger Finke, and Laurence R. Iannaccone. 1995. Pluralism and Piety: England and Wales, 1851. Journal for the Scientific Study of Religion 34: 431–44. [Google Scholar] [CrossRef]
- Tingley, Dustin, Teppei Yamamoto, Kentaro Hirose, Luke Keele, and Kosuke Imai. 2014. Mediation: R Package for causal mediation analysis. Journal of Statistical Software 59: 1–37. [Google Scholar] [CrossRef]
- Wallace, Anthony F. C. 1966. Religion: An Anthropological View. New York: Random House. [Google Scholar]
- Wilson, Bryan. 1966. Religion in Secular Society. London: C.A. Watts. [Google Scholar]
- Zaiontz, Charles. 2020. Real Statistics Using Excel. Available online: www.real-statistics.co (accessed on 6 January 2022).
- Zuur, Alain F., Elena N. Ieno, and Chris S. Elphick. 2010. A protocol for data exploration to avoid common statistical problems. Methods in Ecology and Evolution 1: 3–14. [Google Scholar] [CrossRef]


| 1 | 2 | 3 | 4 | 5 | 6 | 7 | 8 | 9 | |
|---|---|---|---|---|---|---|---|---|---|
| 1. Religious Affiliations (vs. Non-affiliations) | 1 | 0.138 | −0.110 | 0.159 | −0.174 | 0.135 | 0.092 | 0.176 | −0.058 |
| 2. Country’s Tightness (vs. Looseness) | 1 | 0.187 | 0.455 | −0.107 | −0.012 | −0.029 | −0.036 | 0.016 | |
| 3. Country’s Religious Diversity Index | 1 | 0.110 | −0.042 | −0.039 | 0.002 | 0.019 | 0.003 | ||
| 4. Religion’s Population Growth In A Country | 1 | −0.107 | −0.005 | −0.024 | −0.041 | 0.014 | |||
| 5. Openness to Experience | 1 | 0.075 | 0.194 | 0.139 | −0.105 | ||||
| 6. Conscientiousness | 1 | 0.083 | 0.159 | −0.241 | |||||
| 7. Extraversion | 1 | 0.299 | −0.250 | ||||||
| 8. Agreeableness | 1 | −0.106 | |||||||
| 9. Neuroticism | 1 |
| Religious Non-Affiliations | Religious Affiliations | |||||||||||
|---|---|---|---|---|---|---|---|---|---|---|---|---|
| Agn. 5 | Athe. 6 | Bud. 7 | Cath. 8 | Prot. 9 | Mrm. 10 | Chr. Oth. 11 | Hind. 12 | Sikh | Mslm. 13 | Jew 14 | Oth. Rel. 15 | |
| N | ||||||||||||
| No. of People | 620 | 658 | 105 | 835 | 445 | 41 | 658 | 173 | 19 | 227 | 58 | 371 |
| No. of Countries | 61 | 63 | 25 | 51 | 37 | 8 | 47 | 19 | 7 | 38 | 7 | 38 |
| % | ||||||||||||
| Education | ||||||||||||
| LTHS 4 | 13.1 | 16.1 | 10.5 | 15.8 | 13.0 | 19.5 | 16.1 | 11.6 | 26.3 | 10.1 | 24.1 | 11.3 |
| HS 3 | 41.9 | 42.7 | 46.7 | 47.5 | 37.8 | 39.0 | 46.7 | 22.5 | 21.1 | 36.6 | 34.5 | 50.4 |
| Univ. 2 | 31.5 | 28.6 | 23.8 | 24.8 | 31.2 | 24.4 | 26.3 | 19.1 | 36.8 | 33.0 | 20.7 | 26.4 |
| Grad. 1 | 13.2 | 12.2 | 19.0 | 10.8 | 17.1 | 14.6 | 10.2 | 45.1 | 15.8 | 19.4 | 20.7 | 10.8 |
| Total | 99.6 | 99.5 | 100 | 98.9 | 99.1 | 97.5 | 99.2 | 98.3 | 100 | 99.1 | 100 | 98.9 |
| Race | ||||||||||||
| Asian | 9.2 | 9.3 | 62.9 | 17.8 | 13.7 | 7.3 | 5.9 | 84.4 | 89.5 | 52.4 | 3.4 | 11.6 |
| Arab | 0.6 | 0.2 | 1.0 | 0.7 | 0.0 | 2.4 | 0.5 | 0.0 | 0.0 | 22.0 | 0.0 | 0.8 |
| Black | 1.3 | 0.9 | 1.9 | 5.1 | 8.8 | 2.4 | 18.4 | 2.9 | 0.0 | 3.5 | 1.7 | 4.6 |
| White | 77.6 | 81.8 | 27.6 | 58.6 | 70.3 | 80.5 | 63.8 | 2.3 | 0.0 | 6.2 | 87.9 | 67.9 |
| Other | 11.1 | 7.8 | 6.7 | 16.8 | 6.3 | 7.3 | 10.2 | 10.4 | 10.5 | 12.8 | 6.9 | 14.6 |
| Total | 99.8 | 99.8 | 100 | 99 | 99.1 | 100 | 98.8 | 100 | 100 | 96.9 | 100 | 99.5 |
| Gender | ||||||||||||
| Male | 35.2 | 45.7 | 41.9 | 29.1 | 28.3 | 39.0 | 28.1 | 46.2 | 26.3 | 37.0 | 39.7 | 29.9 |
| Female | 63.4 | 53.3 | 56.2 | 70.1 | 71.5 | 61.0 | 71.4 | 53.8 | 73.7 | 63.0 | 60.3 | 68.7 |
| Other | 1.1 | 0.8 | 1.9 | 0.7 | 0.2 | 0.0 | 0.3 | 0.0 | 0.0 | 0.0 | 0.0 | 1.3 |
| Total | 99.7 | 99.8 | 100 | 99.9 | 100 | 100 | 99.8 | 100 | 100 | 100 | 100 | 100 |
Disclaimer/Publisher’s Note: The statements, opinions and data contained in all publications are solely those of the individual author(s) and contributor(s) and not of MDPI and/or the editor(s). MDPI and/or the editor(s) disclaim responsibility for any injury to people or property resulting from any ideas, methods, instructions or products referred to in the content. |
© 2023 by the author. Licensee MDPI, Basel, Switzerland. This article is an open access article distributed under the terms and conditions of the Creative Commons Attribution (CC BY) license (https://creativecommons.org/licenses/by/4.0/).
Share and Cite
Senay, I. Religious Diversity Predicts Religions’ Population Growth in Tighter (vs. Looser) Cultures: A Study of Personality & Self-Reported Religion across 111 Countries. Religions 2023, 14, 1126. https://doi.org/10.3390/rel14091126
Senay I. Religious Diversity Predicts Religions’ Population Growth in Tighter (vs. Looser) Cultures: A Study of Personality & Self-Reported Religion across 111 Countries. Religions. 2023; 14(9):1126. https://doi.org/10.3390/rel14091126
Chicago/Turabian StyleSenay, Ibrahim. 2023. "Religious Diversity Predicts Religions’ Population Growth in Tighter (vs. Looser) Cultures: A Study of Personality & Self-Reported Religion across 111 Countries" Religions 14, no. 9: 1126. https://doi.org/10.3390/rel14091126