Article

Summer Wind Effects on Coastal Upwelling in the Southwestern Yellow Sea

1
Key Laboratory of Marine Hazards Forecasting, Ministry of Natural Resources, Hohai University, Nanjing 210098, China
2
College of Oceanography, Hohai University, Nanjing 210098, China
3
Research Institute for Global Change, Japan Agency for Marine-Earth Science and Technology, Yokosuka 2370061, Japan
4
Research Institute for Applied Mechanics, Kyushu University, Kasuga 8168580, Japan
*
Author to whom correspondence should be addressed.
J. Mar. Sci. Eng. 2021, 9(9), 1021; https://doi.org/10.3390/jmse9091021
Submission received: 7 July 2021 / Revised: 19 August 2021 / Accepted: 16 September 2021 / Published: 17 September 2021
(This article belongs to the Special Issue Ocean Conservation and Pollution in an Era of Blue Economy)

Abstract

:
The features of coastal upwelling in the southwestern Yellow Sea were investigated based on oceanology data from a research cruise and a regional circulation model. The observation data suggest that a relatively colder and saltier water core exists from the deeper layer to the surface, off the Subei Bank. The concentrations of nutrients also suggest that coastal upwelling is beneficial for nutrient enrichment in the upper layer. The numerical simulations are in good agreement with oceanology observations. Furthermore, sensitivity experiments indicate that, in addition to the tidal-induced upwelling and tidal mixing proposed in previous studies, the summer monsoon is also critical to vertical circulation in the southwestern Yellow Sea. The southwesterly wind stress and positive wind stress curl make considerable contributions to upwelling off the Subei coast compared with tidal motions. Moreover, this study also proposes that changes in the summer monsoon and its curl may have been helpful to the formation of upwelling during the past decade, which may have provided a favorable marine environment for the frequent occurrence of green tides. This study provides a theoretical basis for the mechanisms of coastal upwelling and the nitrogen cycle in the Yellow Sea.

1. Introduction

The Yellow Sea is a shallow sea surrounded by mainland China and the Korean peninsula. It connects with the Bohai Sea in the northwest, the East China Sea in the south, and the Japan Sea in the southeast through Tsushima Strait and is a characteristic continental shelf sea (Figure 1). The Yellow Sea plays an important role in the environment of China, North and South Korea, and Japan. The water depth of the southwestern Yellow Sea is generally shallower than 50 m. Especially due to the rich sediment accumulation from the Yangtze River and the old Yellow River, the water depth off Subei (northern part of Jiangsu Province) is shallower than 20 m, which is the so-called Subei Bank (Figure 1). As the important conduit of water exchange between the central and coastal waters, the north–south elongated Yellow Sea Trough has its axis closer to the eastern (Korea) coast than the western (China) coast in the center of the Yellow Sea. The depth of the Yellow Sea Trough gradually decreases from 90 m in the northwest of Cheju Island to 60 m in the northern Yellow Sea. The water depth on the western (China) side changes more slowly than that on the eastern (Korea) side.
Traditionally, our understanding of the circulation in the southwestern Yellow Sea has been unclear due to the lack of observations and insufficient attention. As an important shallow sea of China, the Yellow Sea is listed as one of the world’s 50 major marine ecosystems. At the same time, it is also an area where various processes of land, ocean, and atmosphere interact intensively, so it has been the focus of comprehensive multidisciplinary research for recent years. Over the past 15 years (from 2007 to 2021), dramatic occurrences of green tide (Ulva prolifera) have become a striking recurrent phenomenon in Subei and Lunan coastal waters. The bloom of the harmful algae has attracted more attention. However, due to complicated topographic steering [1,2,3], the three-dimensional circulation structure of the Yellow Sea, especially in the southwestern part, and its mechanism are not fully understood.
In warm seasons, the Yellow Sea cold water mass (YSCWM), first reported by Uda [4], is believed to be the most important oceanology feature. The summer horizontal [5,6,7,8] and vertical [2,9,10] circulations in the Yellow Sea were generally considered as being associated with the YSCWM.
Later, our understanding of the horizontal circulation in the southwestern Yellow Sea was expanded due to the outburst of large-scale Ulva prolifera blooms in the summer of 2008. It is suggested that the Subei coast current flows northward during the summer under the force of the southwesterly monsoon [11,12,13]. Meanwhile, in the Yellow Sea, although it has attracted many investigations on the circulation system, there has never been a systematic investigation of the vertical current. Zhao [14] found that upwelling in the southwestern Yellow Sea is related to the tidal mixing fronts. Under strong tidal mixing, a considerable baroclinic gradient across the tidal mixing fronts causes a distinct upwelling branch as the secondary circulation occurs mainly on the mixed side of the front [2]. Furthermore, it was suggested that sloping topography is essential to trigger upwelling in the southwestern Yellow Sea. Huang et al. [15] then suggested that the spring neap tide period also has strong effects on the coastal upwelling system. However, Yuan et al. [3] pointed out that the onshore bottom Ekman transport, associated with the northward summer Subei coast current, generates upwelling off the Subei coast; however, tidal effects were not considered in their study. There have been few studies on upwelling in the southwestern Yellow Sea, thus, the synoptic variation and dynamics of Subei coastal upwelling remain unclear.
Based on the on-site observation data of a research cruise in summer 2019 and numerical simulations, the distribution characteristics, synoptic variations, and response to wind stress of upwelling off the Subei coast were analyzed. Section 2 provides a description of the data used in this study and the model configurations. The observed summer oceanology features in the southwestern Yellow Sea are presented in Section 3. Section 4 addresses the simulations and discusses the dynamics of coastal upwelling. Section 5 provides a summary of this study.

2. Data and Model Configurations

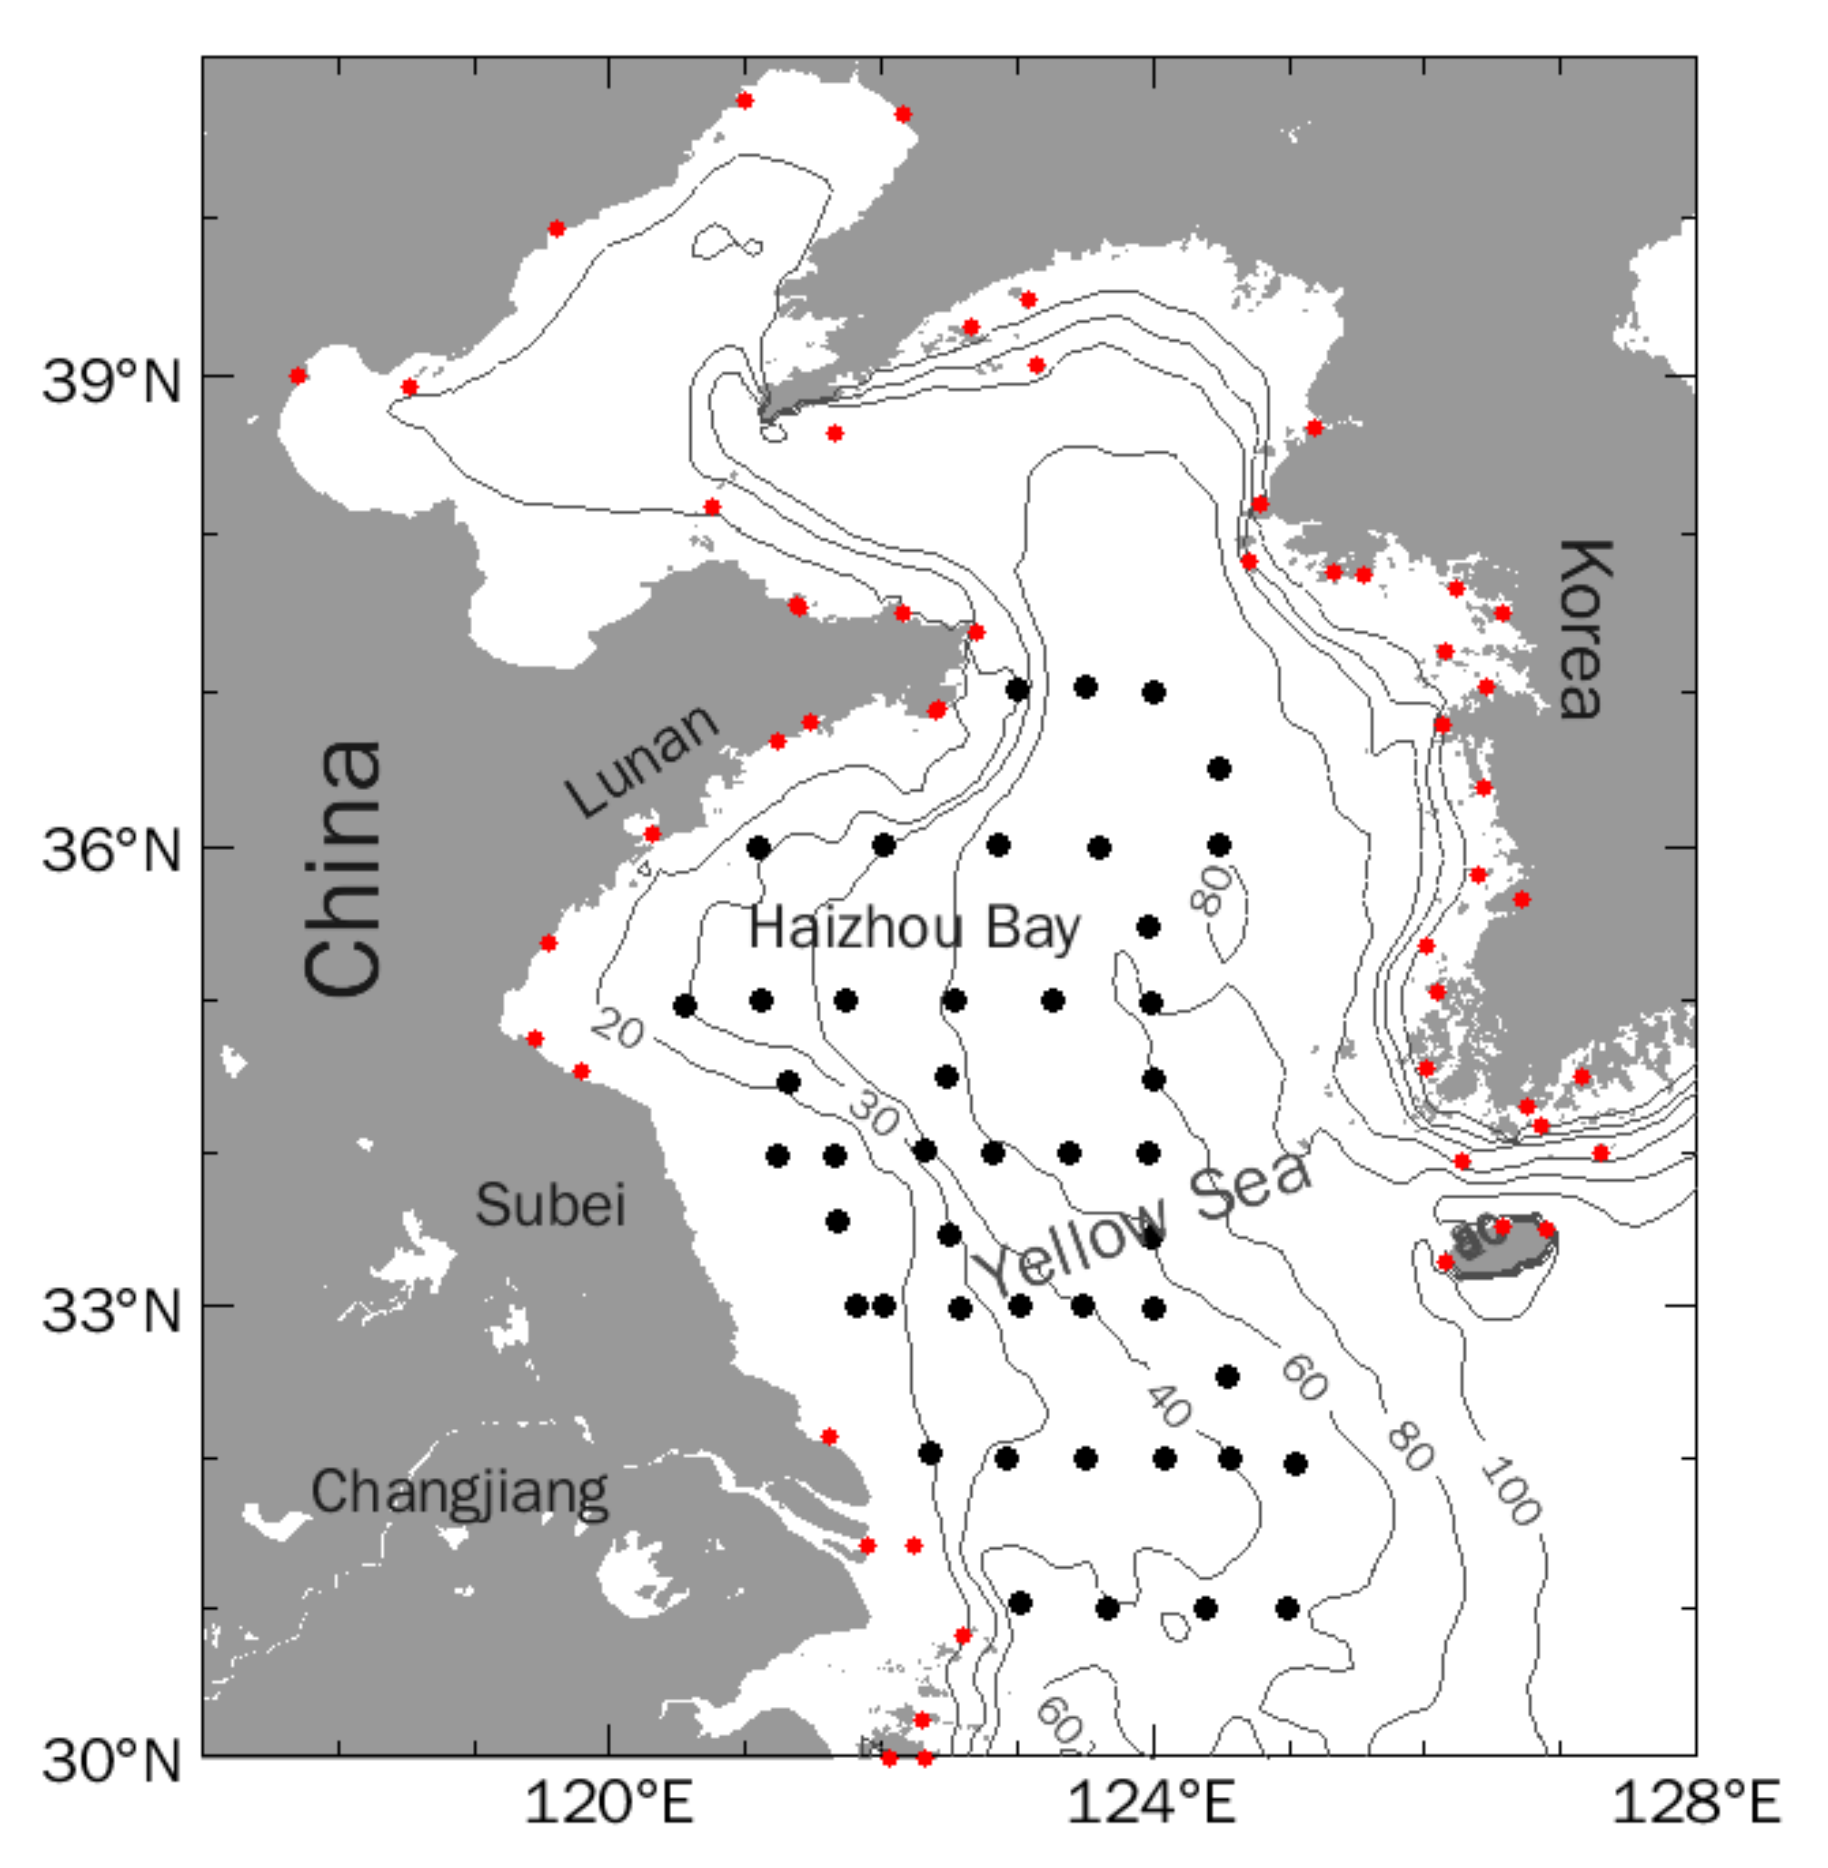
2.1. Cruise Observation Data

Direct measurement of vertical motions in the ocean is difficult to achieve due to the small magnitude (10−7 to 10−5 m/s). Upwelling is usually described based on hydrological distribution. The oceanology data used in this study were collected during a research cruise in the summer of 2019 in the Bohai and Yellow Seas. The major survey took place on 1 and 2 August, and was organized as part of the Oceanographic Research Vessel Sharing Plan of the National Natural Science Foundation of China (NSFC). Figure 1 shows the region covered by this cruise and the locations of the observation stations (black dots).
Temperature and salinity data in the southwestern Yellow Sea were directly measured using a Sea-Bird 911/17 plus conductance–temperature–depth (CTD) system (Sea-Bird Electronics Inc., Bellevue, WA, USA). Water samples collected during the survey were filtrated using 0.45 µm cellulose acetate fiber filters, which had been soaked in 1:1000 HCl for 24 h and then washed with Milli-Q water until they were neutral. They were stored in Niskin bottles and quickly cryopreserved at −20 °C for later measurement of nutrient concentrations in the laboratory. Dissolved inorganic nitrogen (DIN) is the total nitrogen in NO3–N, NO2–N, and NH4+–N. We determined NO3–N, NO2–N using the cadmium-copper reduction method and NH4+–N with the indophenol blue method.

2.2. Satellite Data

Merged satellite and in situ global daily sea surface temperatures (MGDSSTs) of the Japan Meteorological Agency, with a resolution of 0.25° × 0.25°, were used to validate the model results. Sea level gridded data (0.25° × 0.25°) from satellite observations of the Copernicus Climate Change Service (C3S) provided by the European Centre for Medium-Range Weather Forecasts (ECMWF) were also used in the present study.

2.3. Tidal Harmonic Constant and Tide Gauge Data

The M2 tidal harmonic constants at 51 sites (red dots in Figure 1) based on historical observation reported [16,17] were used to validate the model results. Tide gauge data from the Dafeng (33.28° N, 120.81° E) automatic tide level telemetry station built by Hohai University [18] were used to validate the simulated sea-level time series.

2.4. Numerical Modeling

The Princeton Ocean Model (POM) was established for the Yellow and East China Seas. It is a three-dimensional primitive equation and free surface ocean model with the Mellor–Yamada turbulence closure scheme embedded. Its vertical sigma coordinate (terrain-following) is suitable for complex bottom topography. The POM has been widely utilized to study circulation in the continental seas [19,20,21]. In the present study, the model covered a domain of 28–41° N, 117–127° E, with a horizontal resolution of 1/24° × 1/30°. There were 16 vertical layers, with sigma coordinates 0.000, −0.003, −0.006, −0.013, −0.025, −0.050, −0.100, −0.200, −0.300, −0.400, −0.500, −0.600, −0.700, −0.800, −0.900, and −1.00 from surface to bottom. The topography was averaged from the 1′ × 1′ database, which is part of the Shuttle Radar Topography Mission (SRTM). SRTM is an international project spearheaded by the National Geospatial Intelligence Agency (NGA), NASA, and the German and Italian space agencies that contain a high-resolution digital topographic database of Earth on a near-global scale. The topography data captures two important features in the southwestern Yellow Sea (Figure 1): the shallow Subei Bank and the relative deep trough of the Haizhou Bay surrounded by the Lunan and Subei coasts. Compared with the digitized local navigational chart data, which only covers a small region (32–36° N, 119–124° E) in the southwestern Yellow Sea [1], the present topography is slightly shallower. The area-averaged difference is around −2.34 m.
The bottom friction in the model is given by quadratic parameterization with a drag coefficient of 2.6 × 10⁻³ [22].
The initial and boundary conditions for temperature, salinity, and velocity were determined from a 1/12° × 1/15° East Asian Marginal Seas data assimilation model [22]. Details of the model are reported by Hirose et al. [23]. The monthly mean results of the DR_M in 2019 were averaged as the open boundary of the present study. Additionally, to investigate the tidal effects, the eight main tidal components (M2, S2, K1, O1, N2, P1, K2, and Q1) in the Yellow and East China Seas were explicitly considered from the open boundary. The boundary tidal harmonic constants were taken from the NAO.99b model [24], which has the best accuracy for the seas adjacent to China [25].
The ECMWF providing the daily mean ERA5 (ECMWF reanalysis) wind speed was used for surface forcing. The high horizontal resolution of the ERA5 data is 0.25° × 0.25°. The net heat flux through the air–sea interface is expressed as the sum of shortwave radiation, longwave radiation, and sensible and latent heat fluxes according to the bulk formula. The transfer coefficients are the same as those of Kondo [26]. All of these components of net heat flux also come from the ERA5 data. The analytical formula of water type II was chosen to model the penetration of solar radiation [27]. The surface freshwater flux was estimated by precipitation, evaporation, and river discharge; this is important to sea surface salinity. Precipitation and evaporation were also obtained from the daily mean ERA5 dataset. The discharge of the Changjiang River was provided by the monthly mean data of the Chinese River Sediment Bulletin. There are no other relaxations for simulated temperature and salinity.
The model was integrated for 4 years under the meteorological conditions of 2019 to start. To remove the initial shock of vertical coordinate interpolation of the initial conditions, the results of the first three years were discarded. The analysis of this study was based on a simulation of the last year. The above experiment was conducted as the control run (Exp.C). To investigate the mechanism of upwelling in the southwestern Yellow Sea, a series of sensitivity experiments were designed, as shown in Table 1. The experiments were restarted from the status of Exp.C at the end of July as the initial conditions. Wind stress in the momentum equation was removed for the first experiment, so it was named Exp.nw (referring to no wind). In Exp.cw (referring to constant wind), the steady and uniform wind stress in time and space was applied, which was the average value from 1 and 11 August 2019 over the study area. Exp.curl (referring to wind stress curl) was established using weak shear wind stress with positive curl in the study region. The details of Exp.cw and Exp.curl will be provided in sub-Section 4.3.

3. Oceanographic Observations

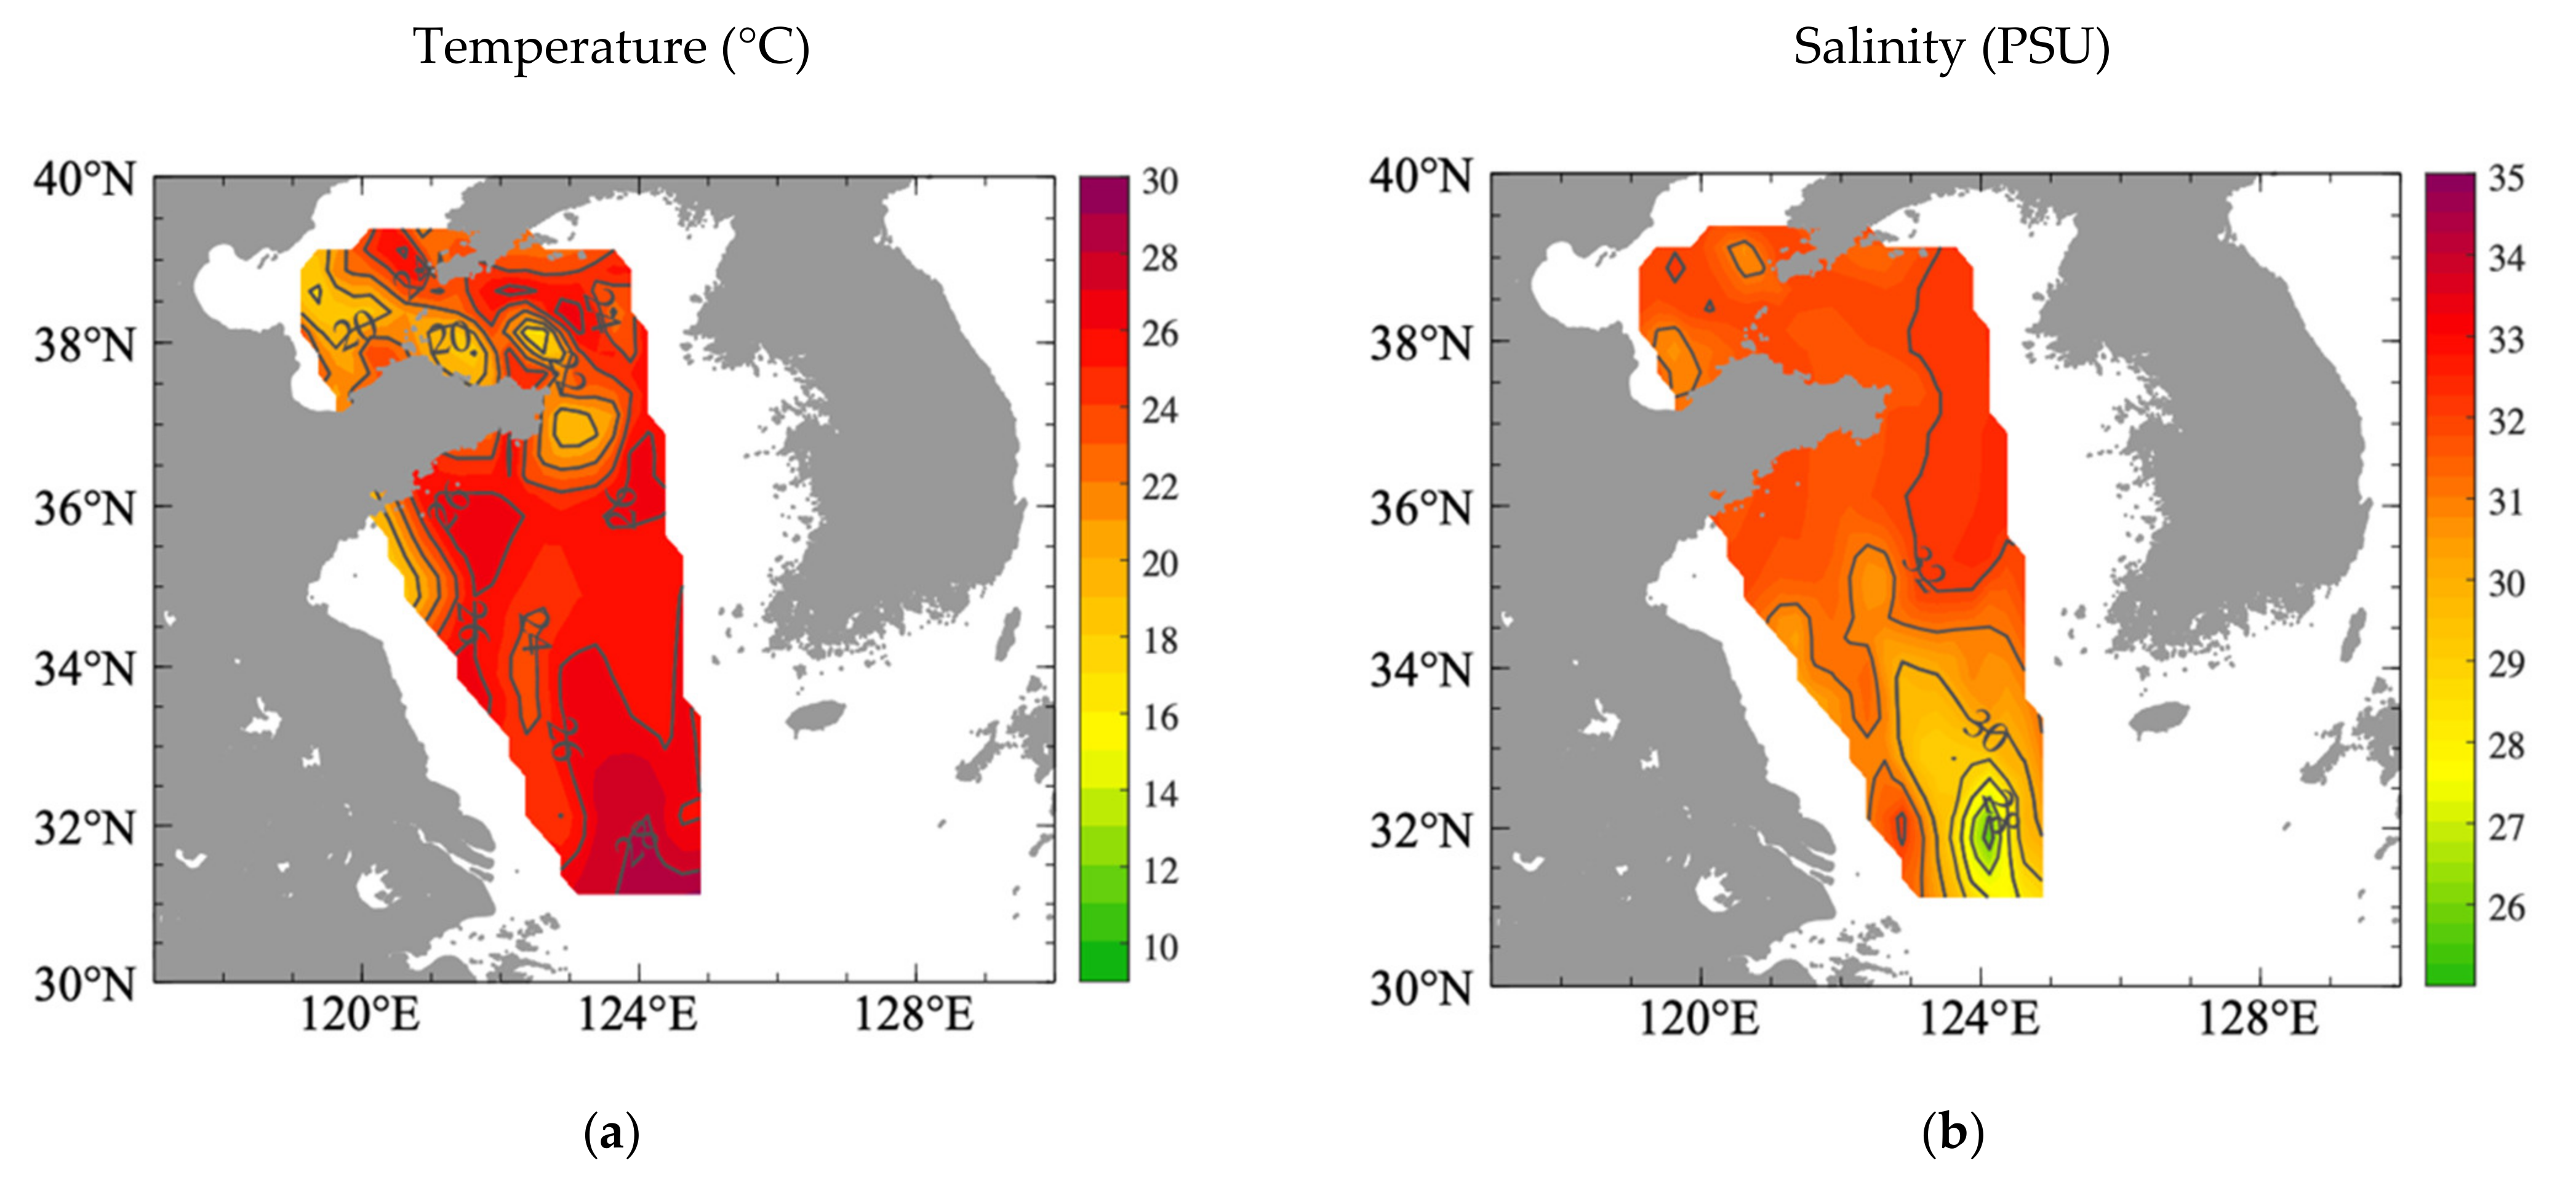
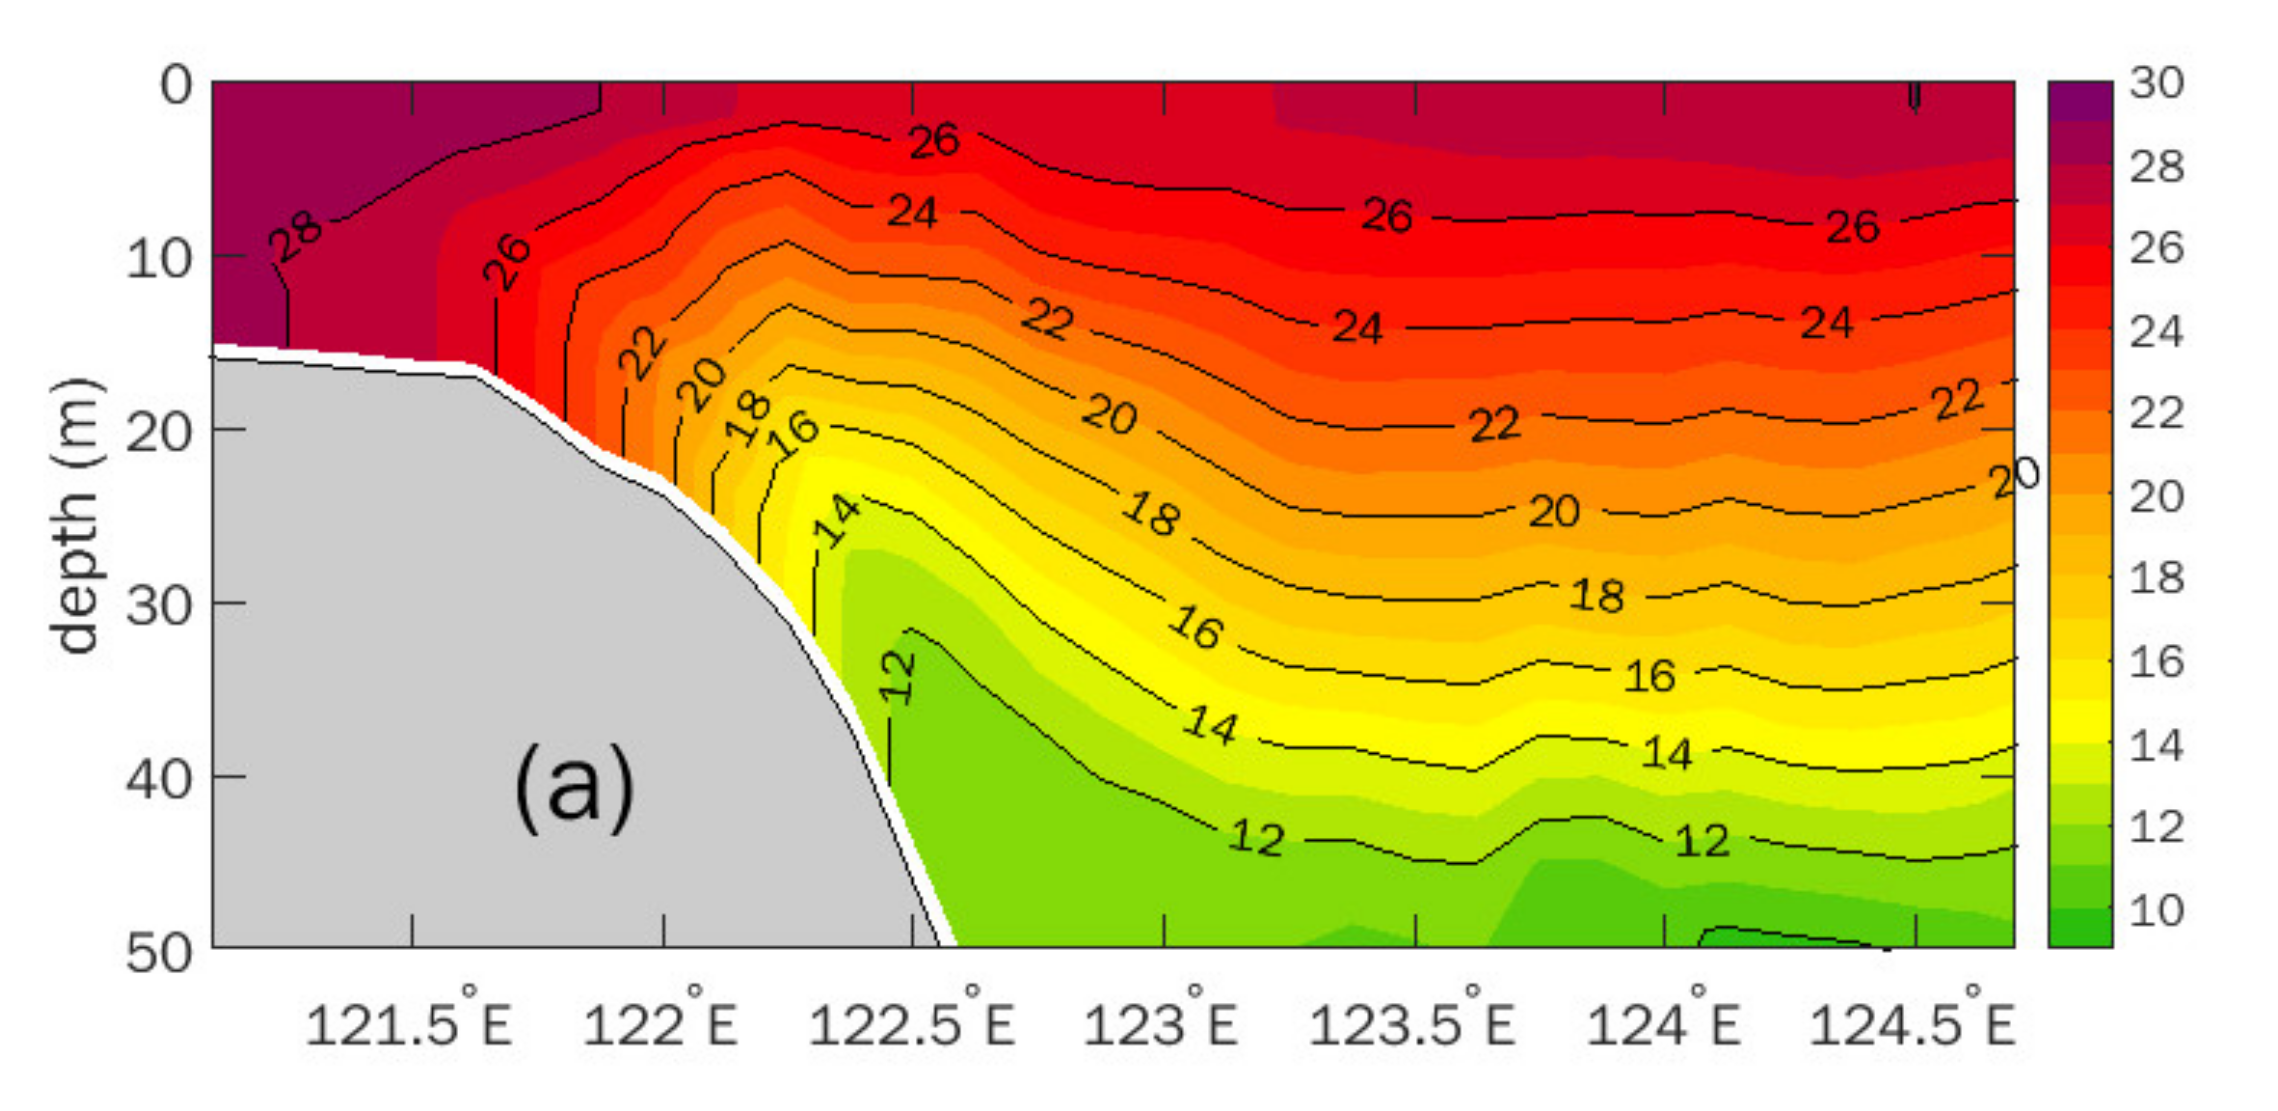
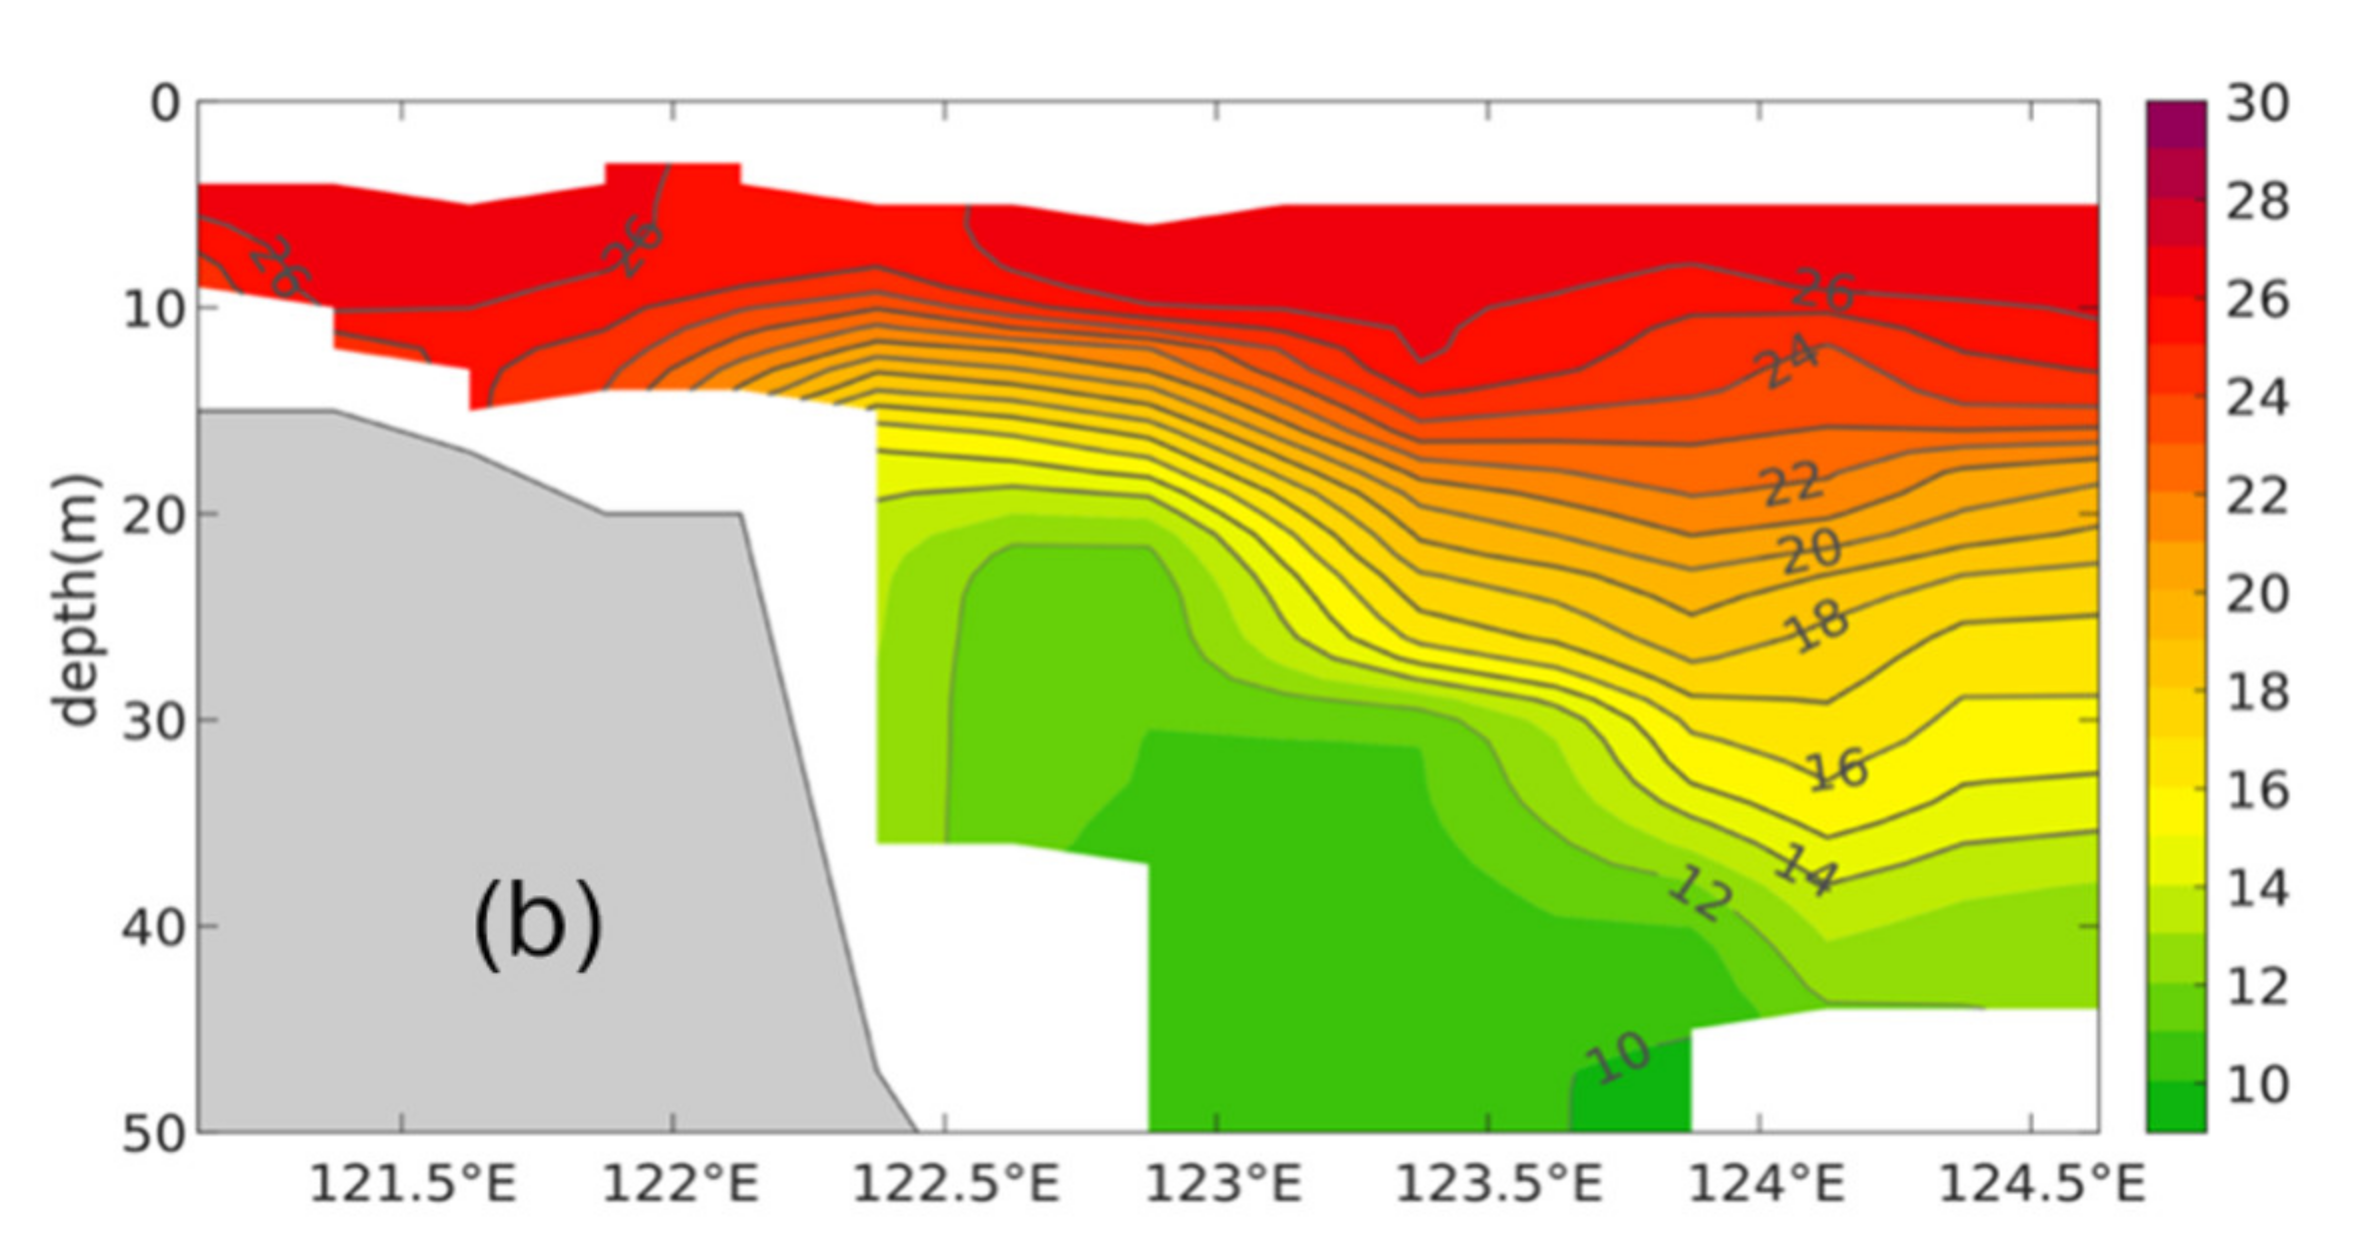
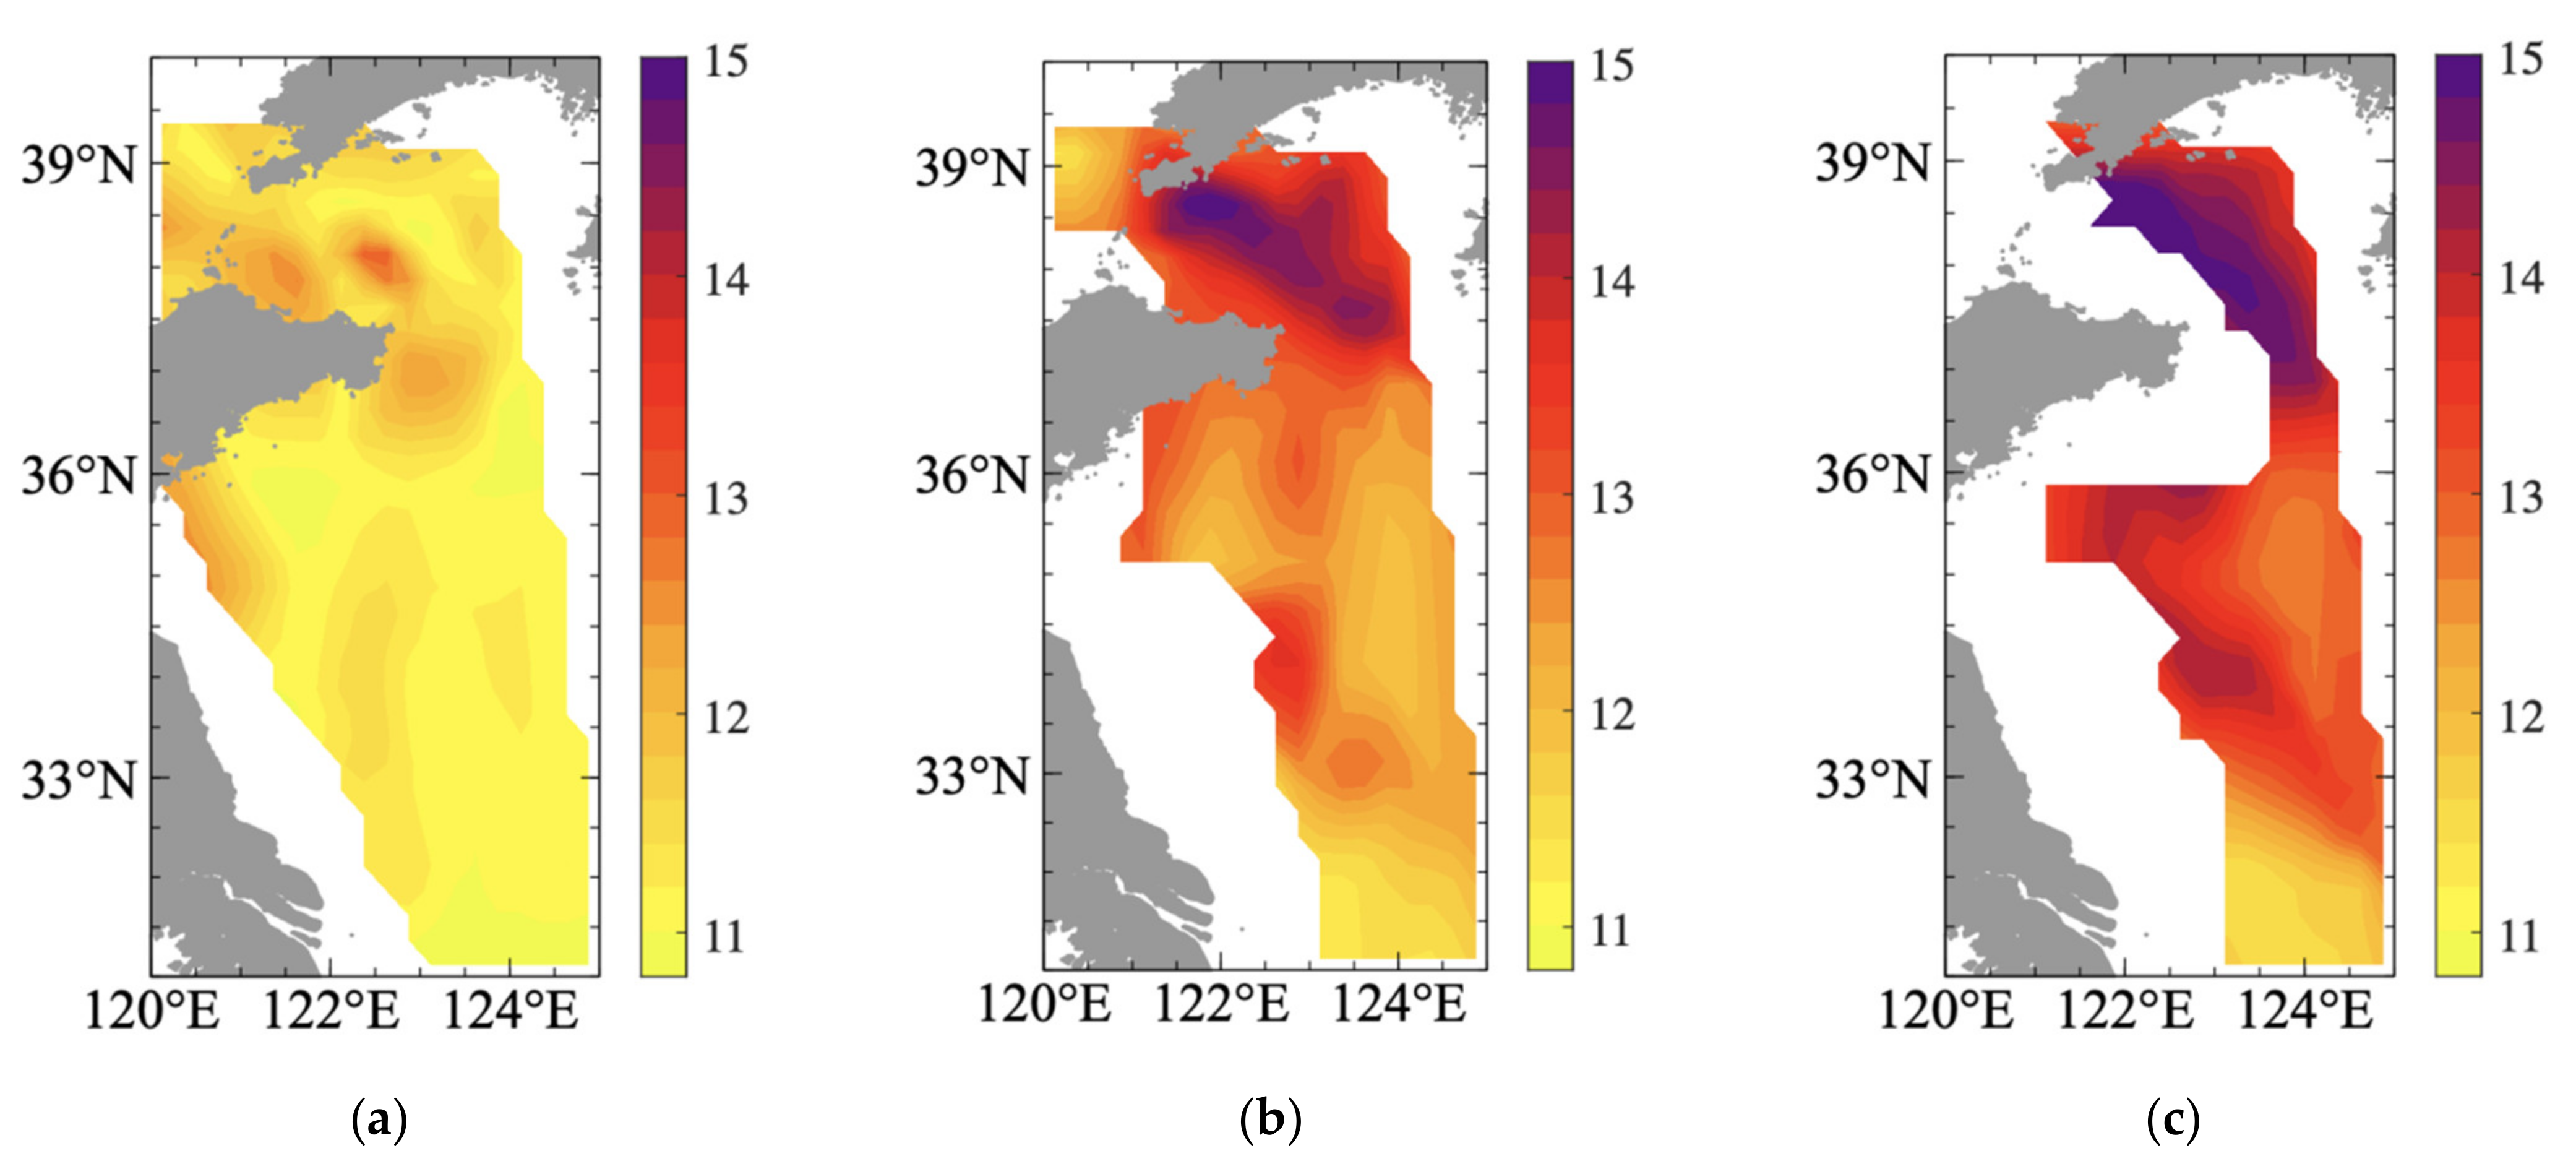
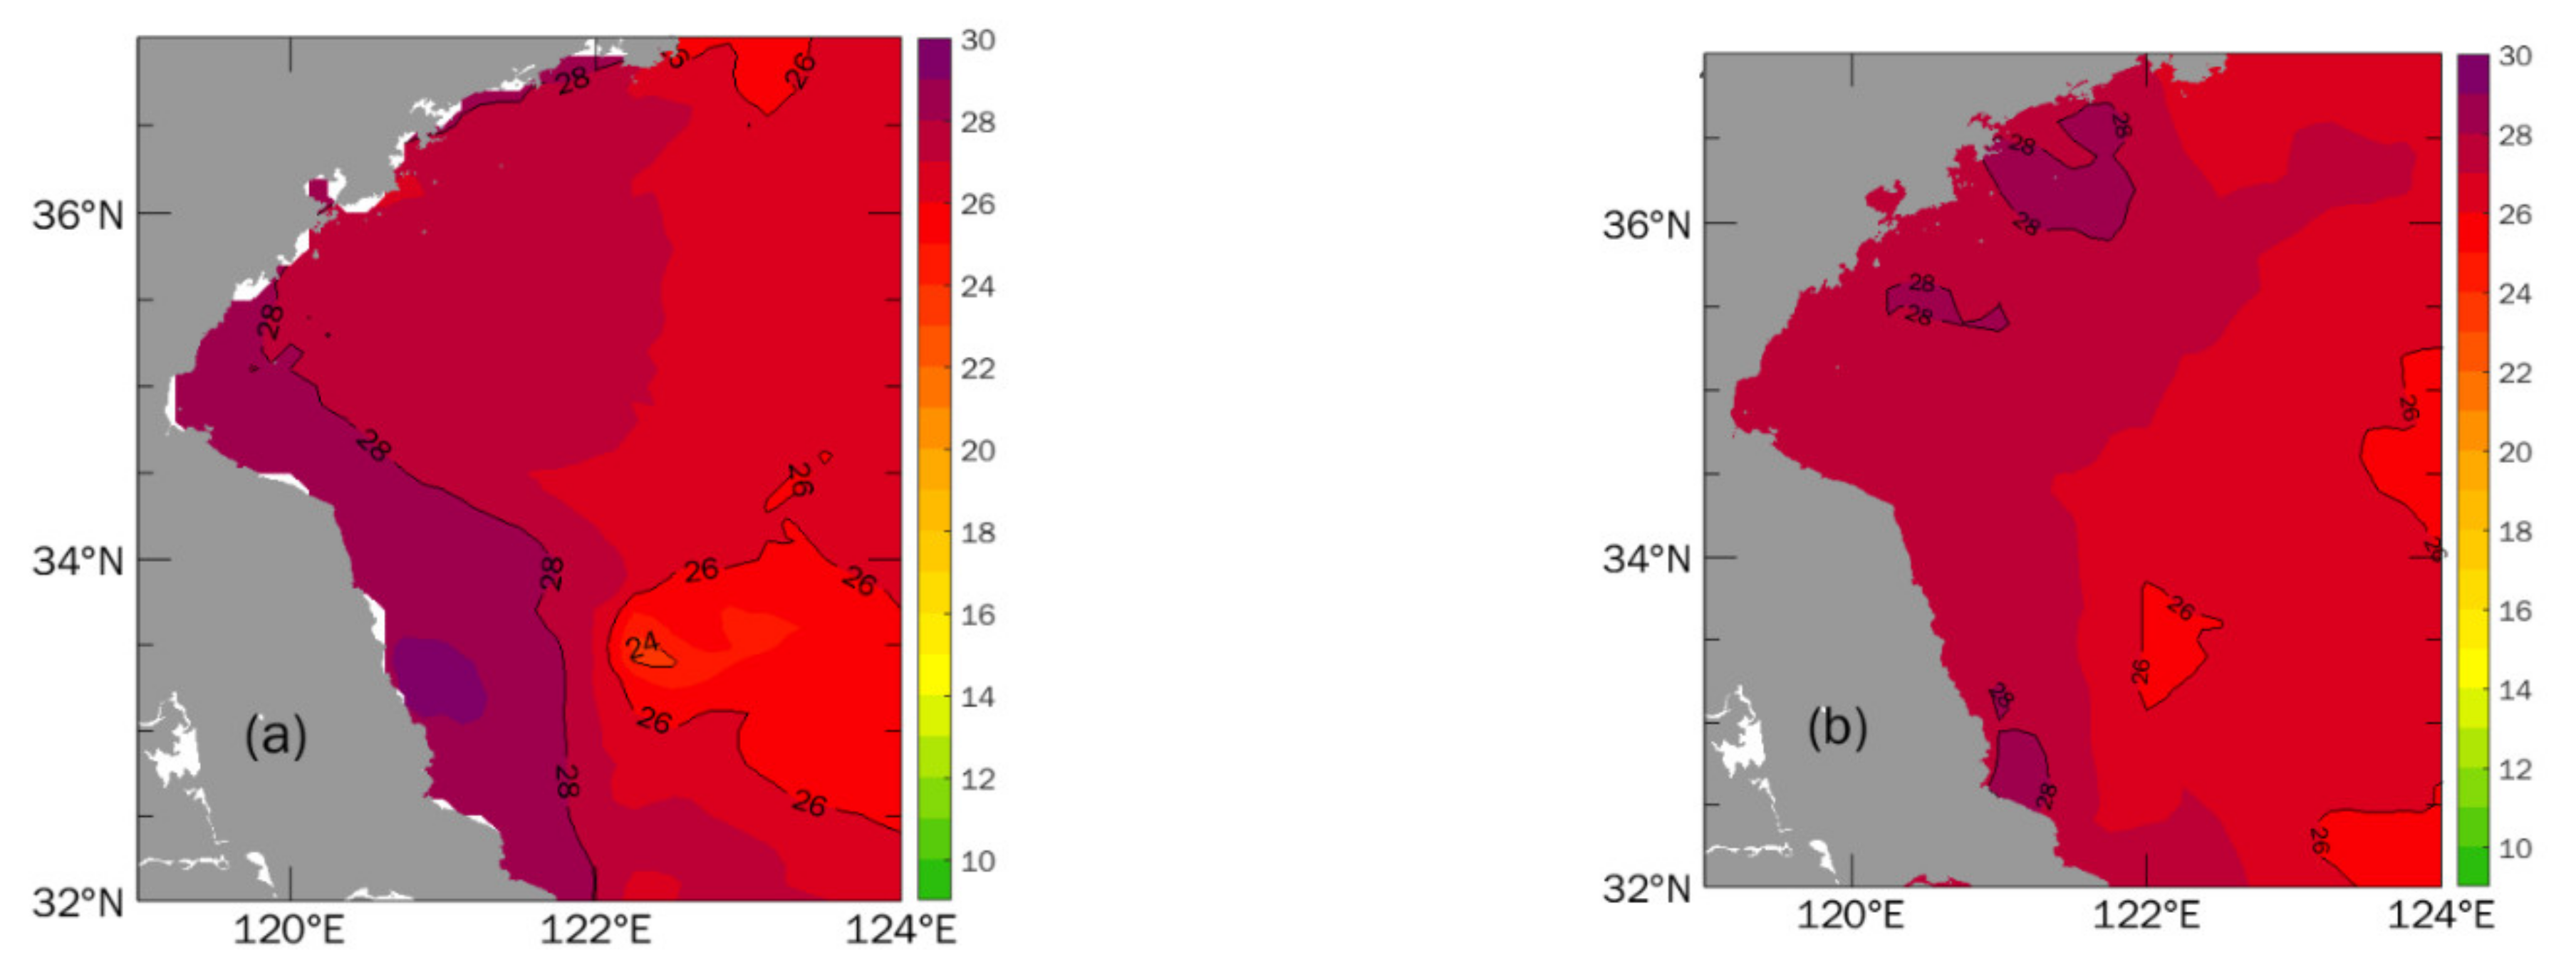
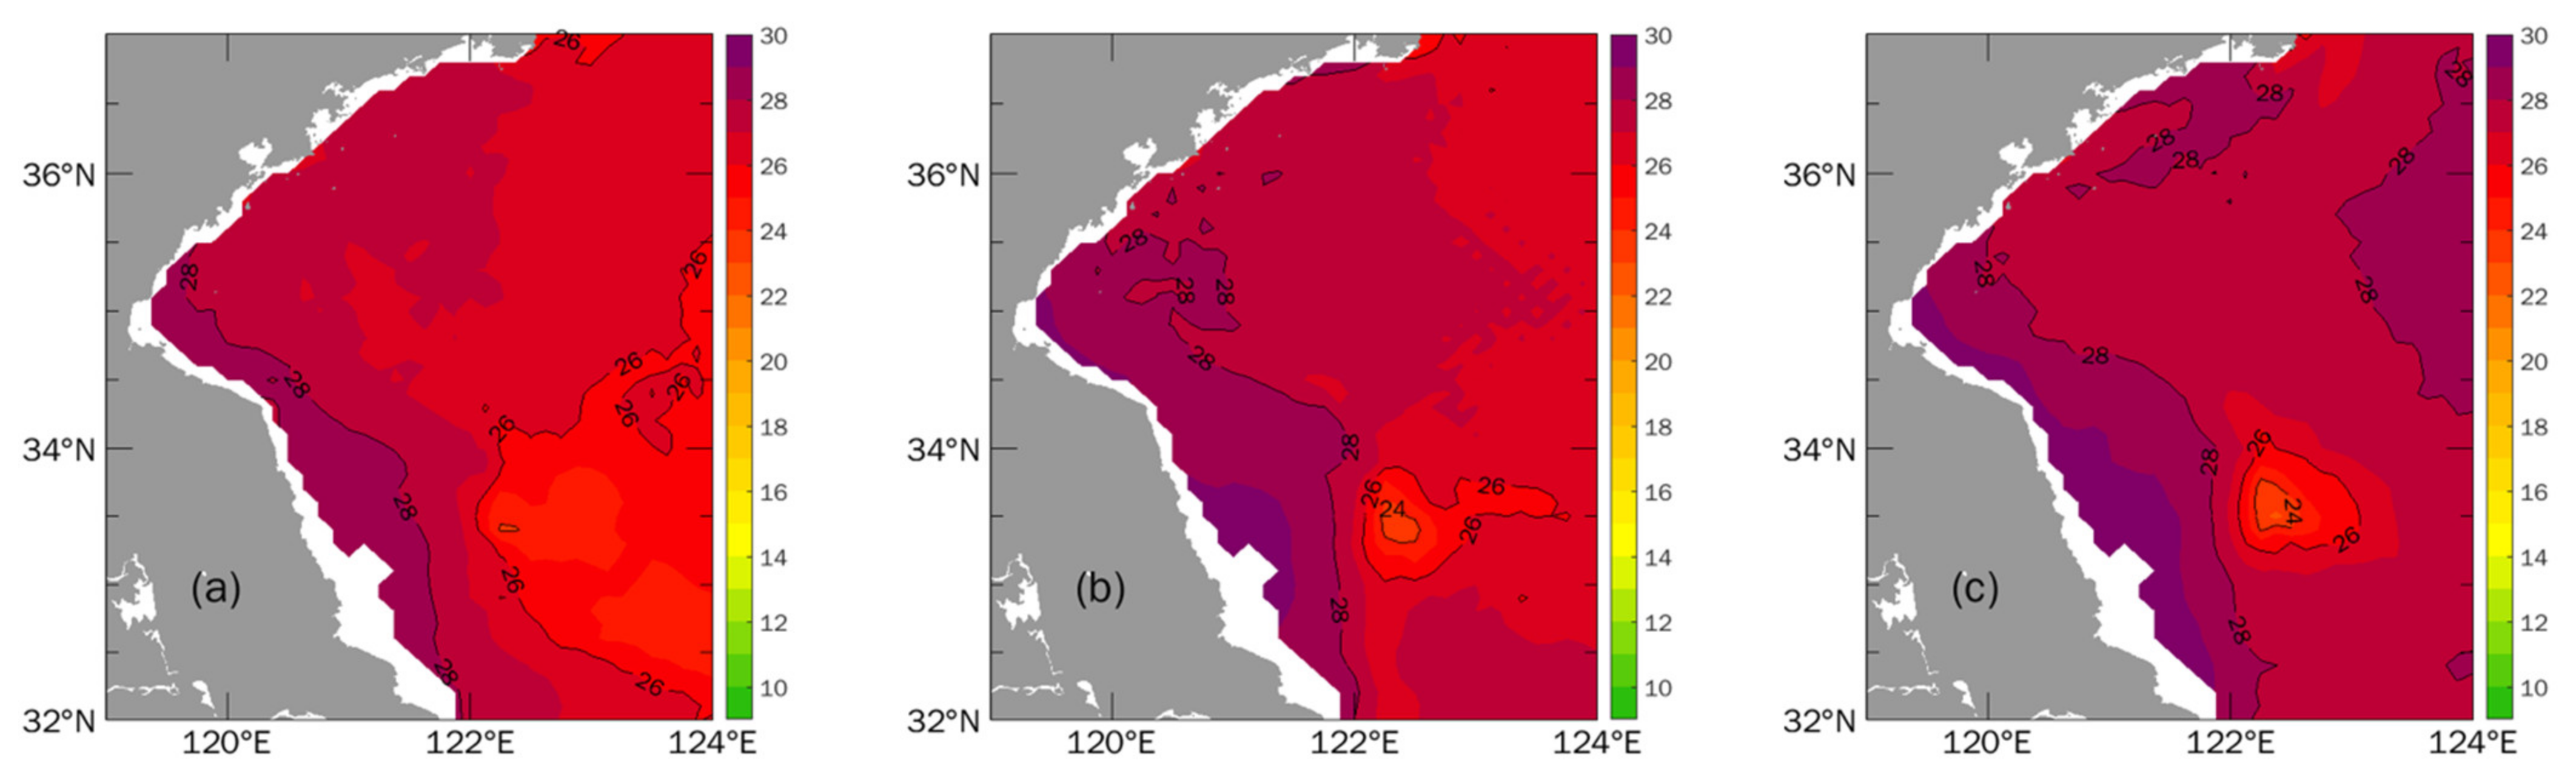
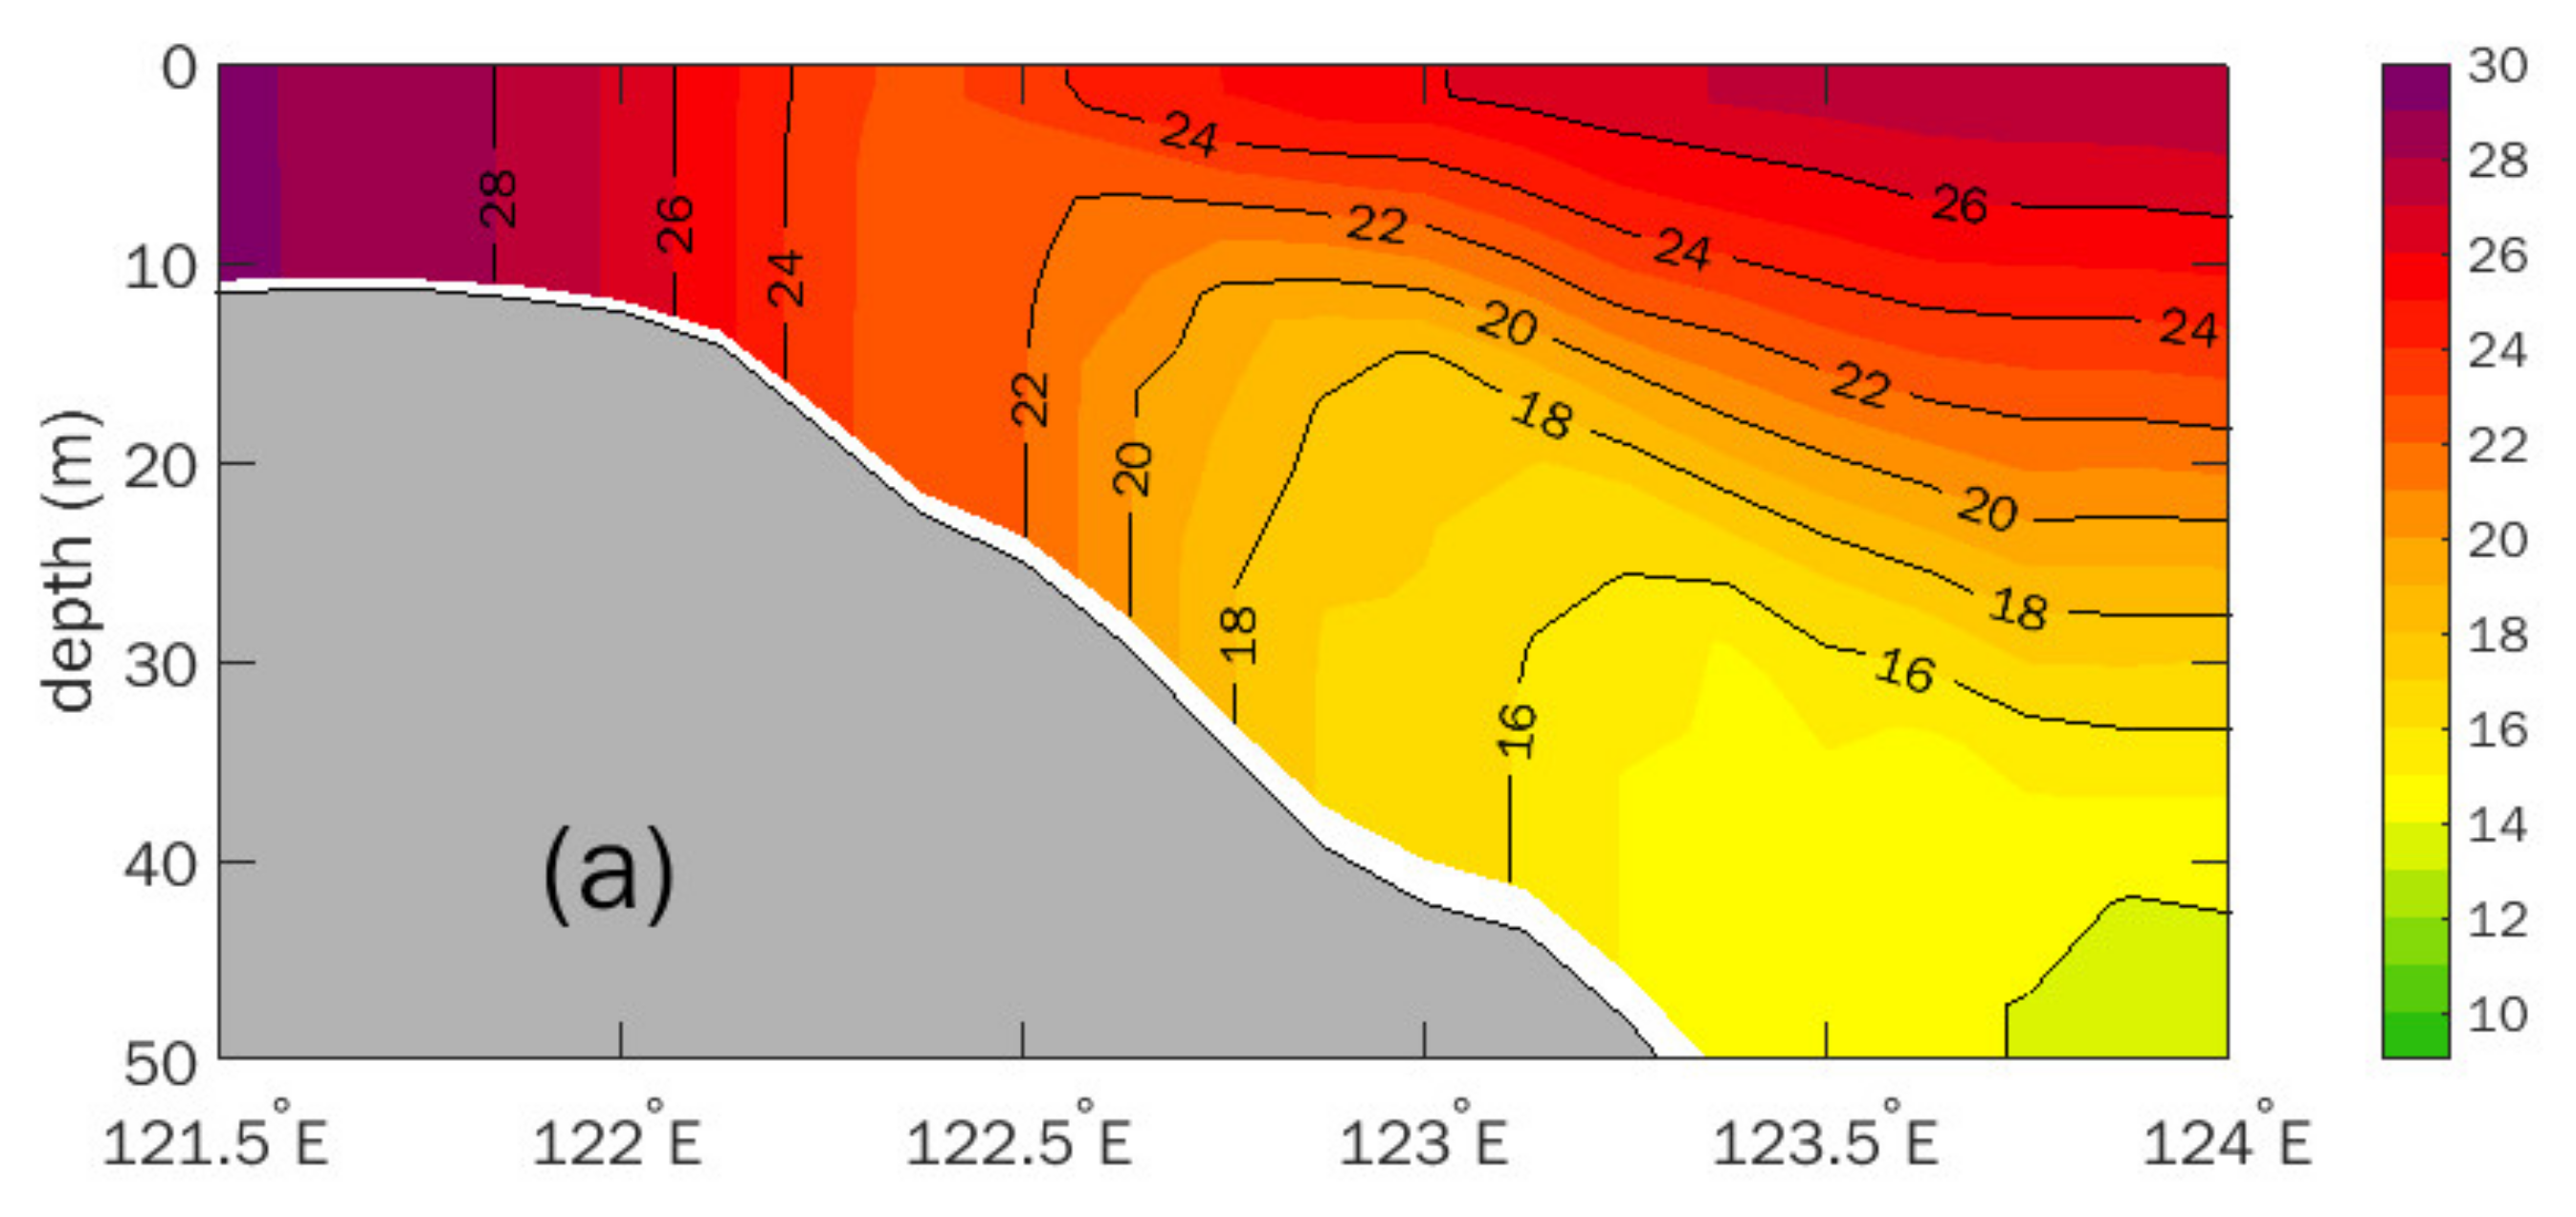
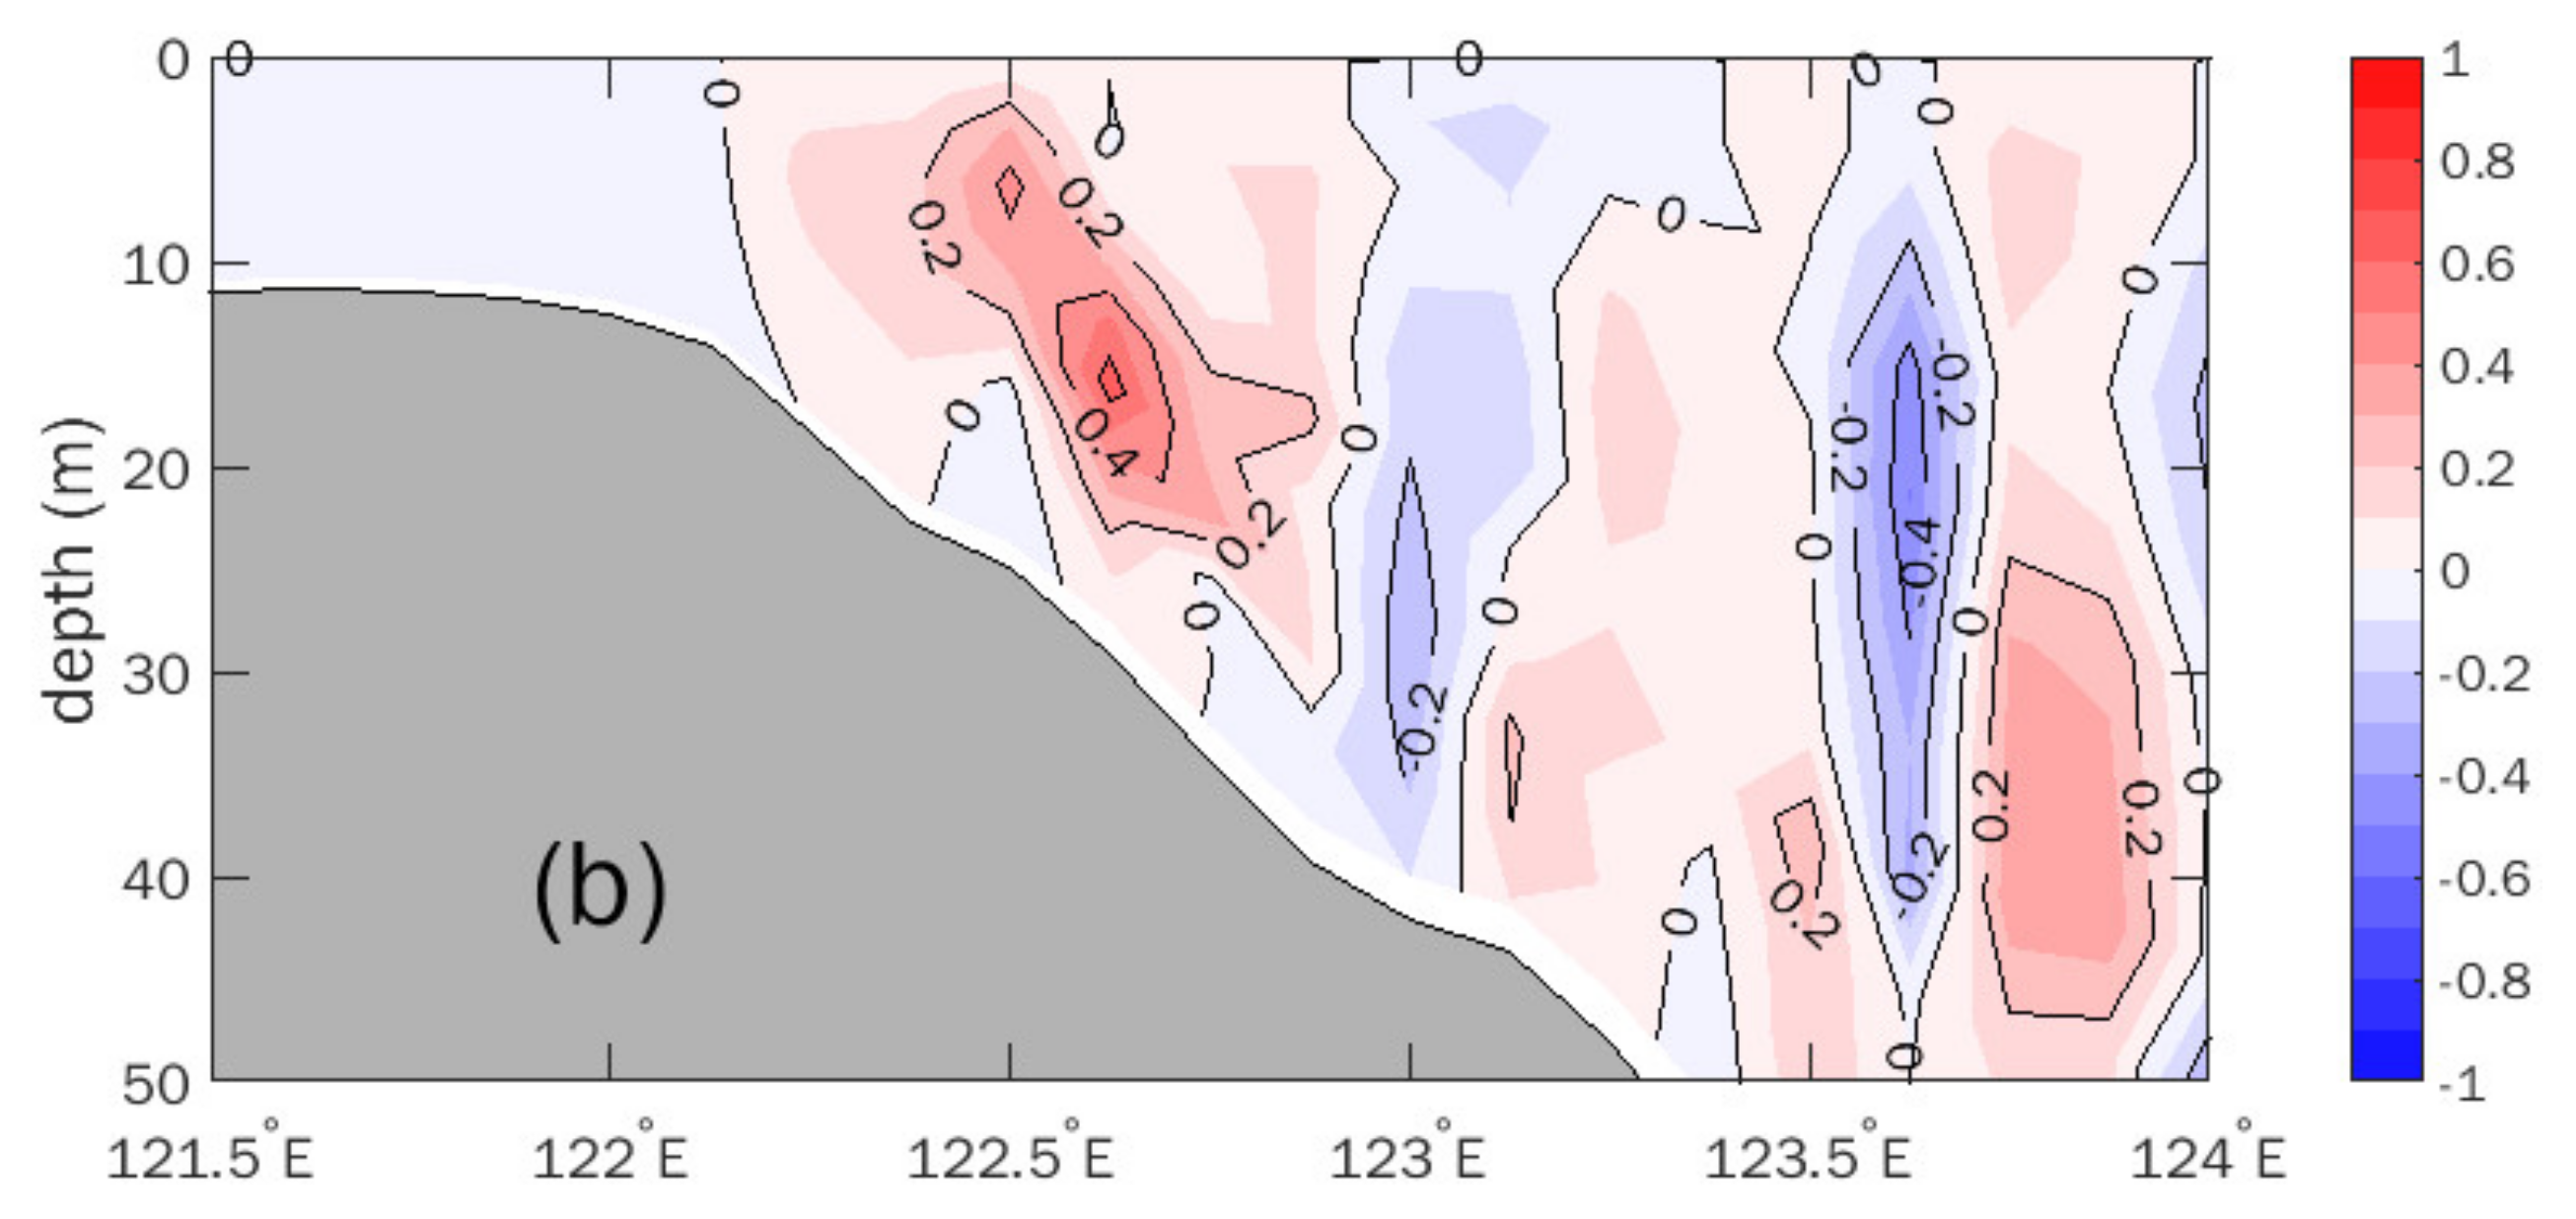
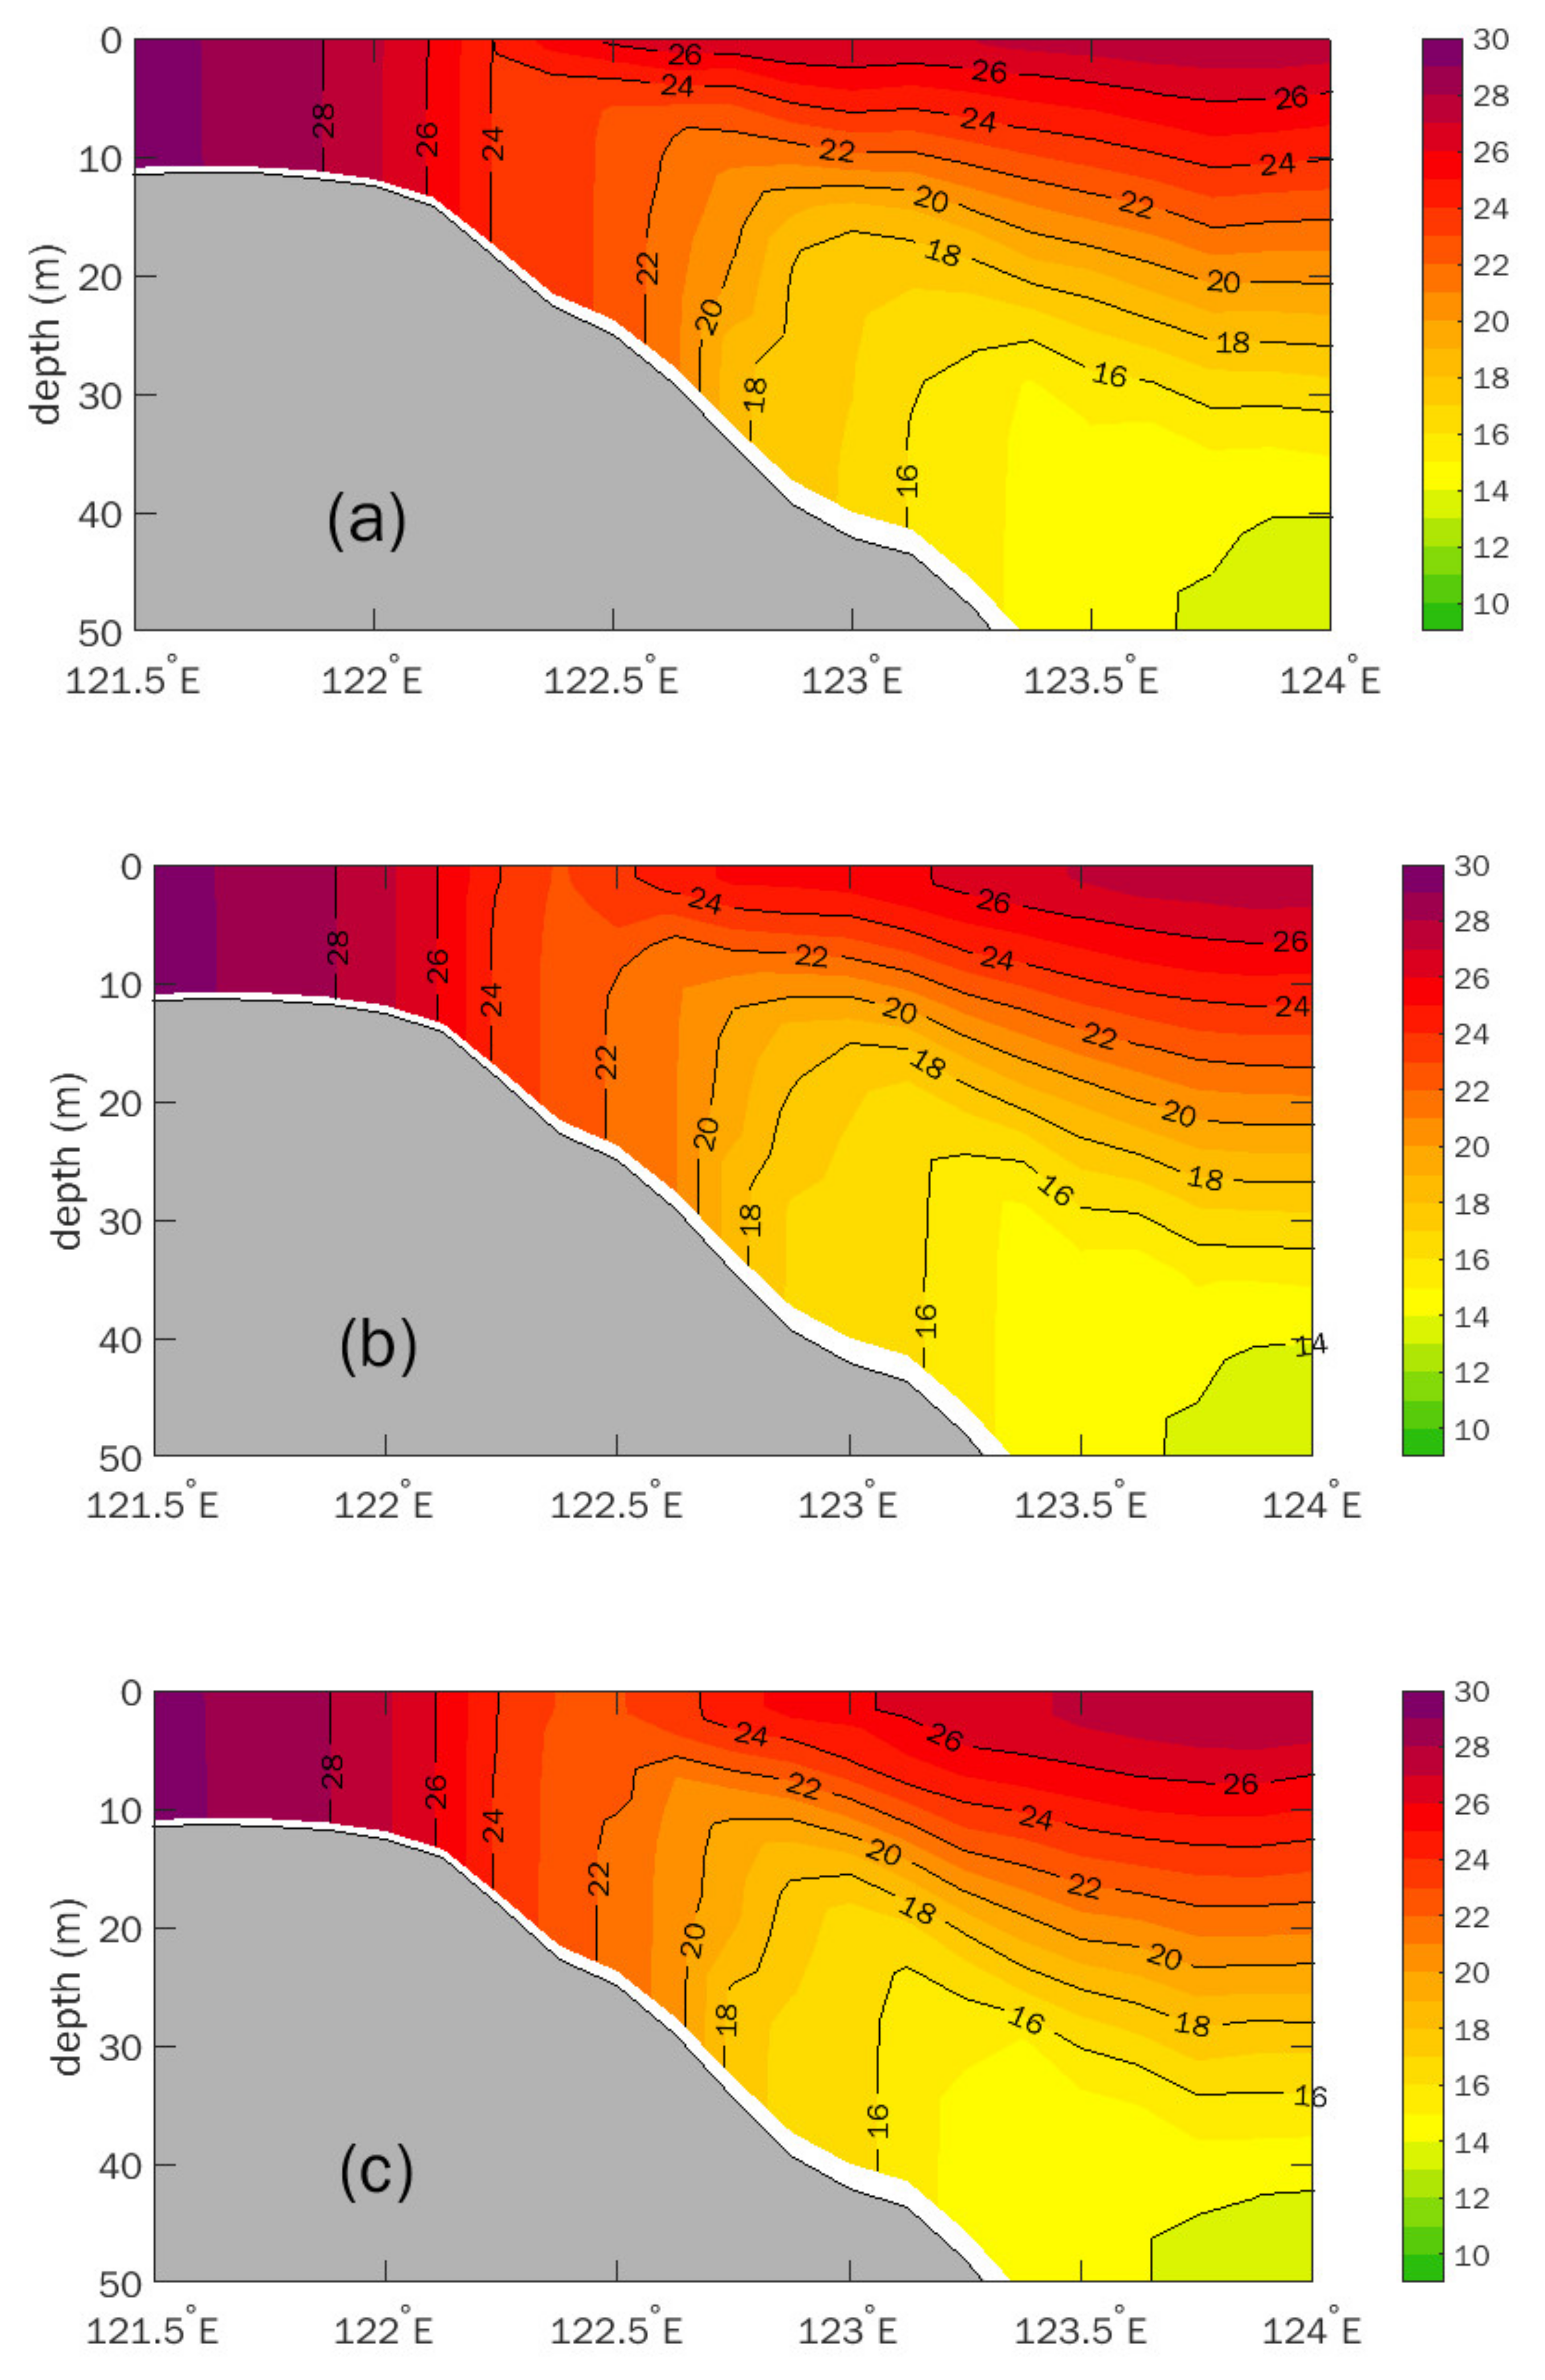
3.1. Temperature and Salinity Distributions

The temperature and salinity at 10 m depth collected during the same research cruise are illustrated in Figure 2. Due to abundant freshwater input from the Changjiang River during the rainy season [28,29,30], low-salinity water occupies the upper layer of the Subei coast. Combined with the distribution of temperature (Figure 2a), it clearly shows a higher salinity, but lower temperature belt off the Subei coast, which separates the Changjiang dilute water (Figure 2b).
The vertical distribution of temperature along the 34.12° N section is shown in Figure 3b. The thermocline reveals that the isotherms are clearly uplifted from east to west and arched shoreward in the southwestern Yellow Sea. The colder water (<20 °C) could be lifted up to nearly 10 m depth, and part of the deeper water (<24 °C) reaches to the surface between 30 and 40 m isobaths. This also can be found from the horizontal distribution in Figure 2a. These oceanology features imply the existence of coastal upwelling in this region.

3.2. DIN Distributions

The content of DIN in the near surface layer (<5 m) is small, with an area average concentration of less than 11 mg/L (not shown here). The concentration presents a near uniform spatial distribution, only it is little higher along the western coast of the Yellow Sea and decreases at higher latitudes. The ample summer sunshine and optimal temperature maximize the ocean’s primary productivity in the upper layer. The low concentration of DIN, which plays a crucial role in the occurrence of macro-algal blooms [31,32], could be attributed to the high absorption of phytoplankton [33,34]. The survey observations suggest that its horizontal distributions are basically consistent with the previous research results.
The distributions of DIN concentration at different depths are shown in Figure 2. The concentration of DIN in the coastal region is significantly higher than that in the offshore region. There is an obvious gradient descent from the coast of China to the central part of the Yellow Sea. The input of terrestrial nutrients from runoff of the Changjiang River was once considered to be the main cause of eutrophication in this sea area [35,36,37]. In deeper layers, the concentration of DIN is higher (Figure 4b,c) due to the conservation and lower productivity. It is noteworthy that there is also a clear higher nutrient belt off the Subei coast (Figure 4a). Patches with relatively higher concentrations off Subei can be found in the deeper layer as well. Likewise, the location of the offshore higher nutrient belt (Figure 4a) is not consistent with the area of lower salinity (Figure 3b). Therefore, there may be another source for the higher concentration of DIN off the Subei coast rather than directly from the Changjiang River. In keeping with the distribution patterns of temperature and salinity, we can further propose that the offshore enriched nutrient belt could be attributed to vertical transport. The characteristics of coastal upwelling and its controlling factors in the southwestern Yellow Sea are investigated based on the numerical results in Section 4.

4. Effects of Wind on Coastal Upwelling

The cruise observations showed upwelling off the Subei coast. The dynamics of upwelling are investigated in this section based on numerical modeling.

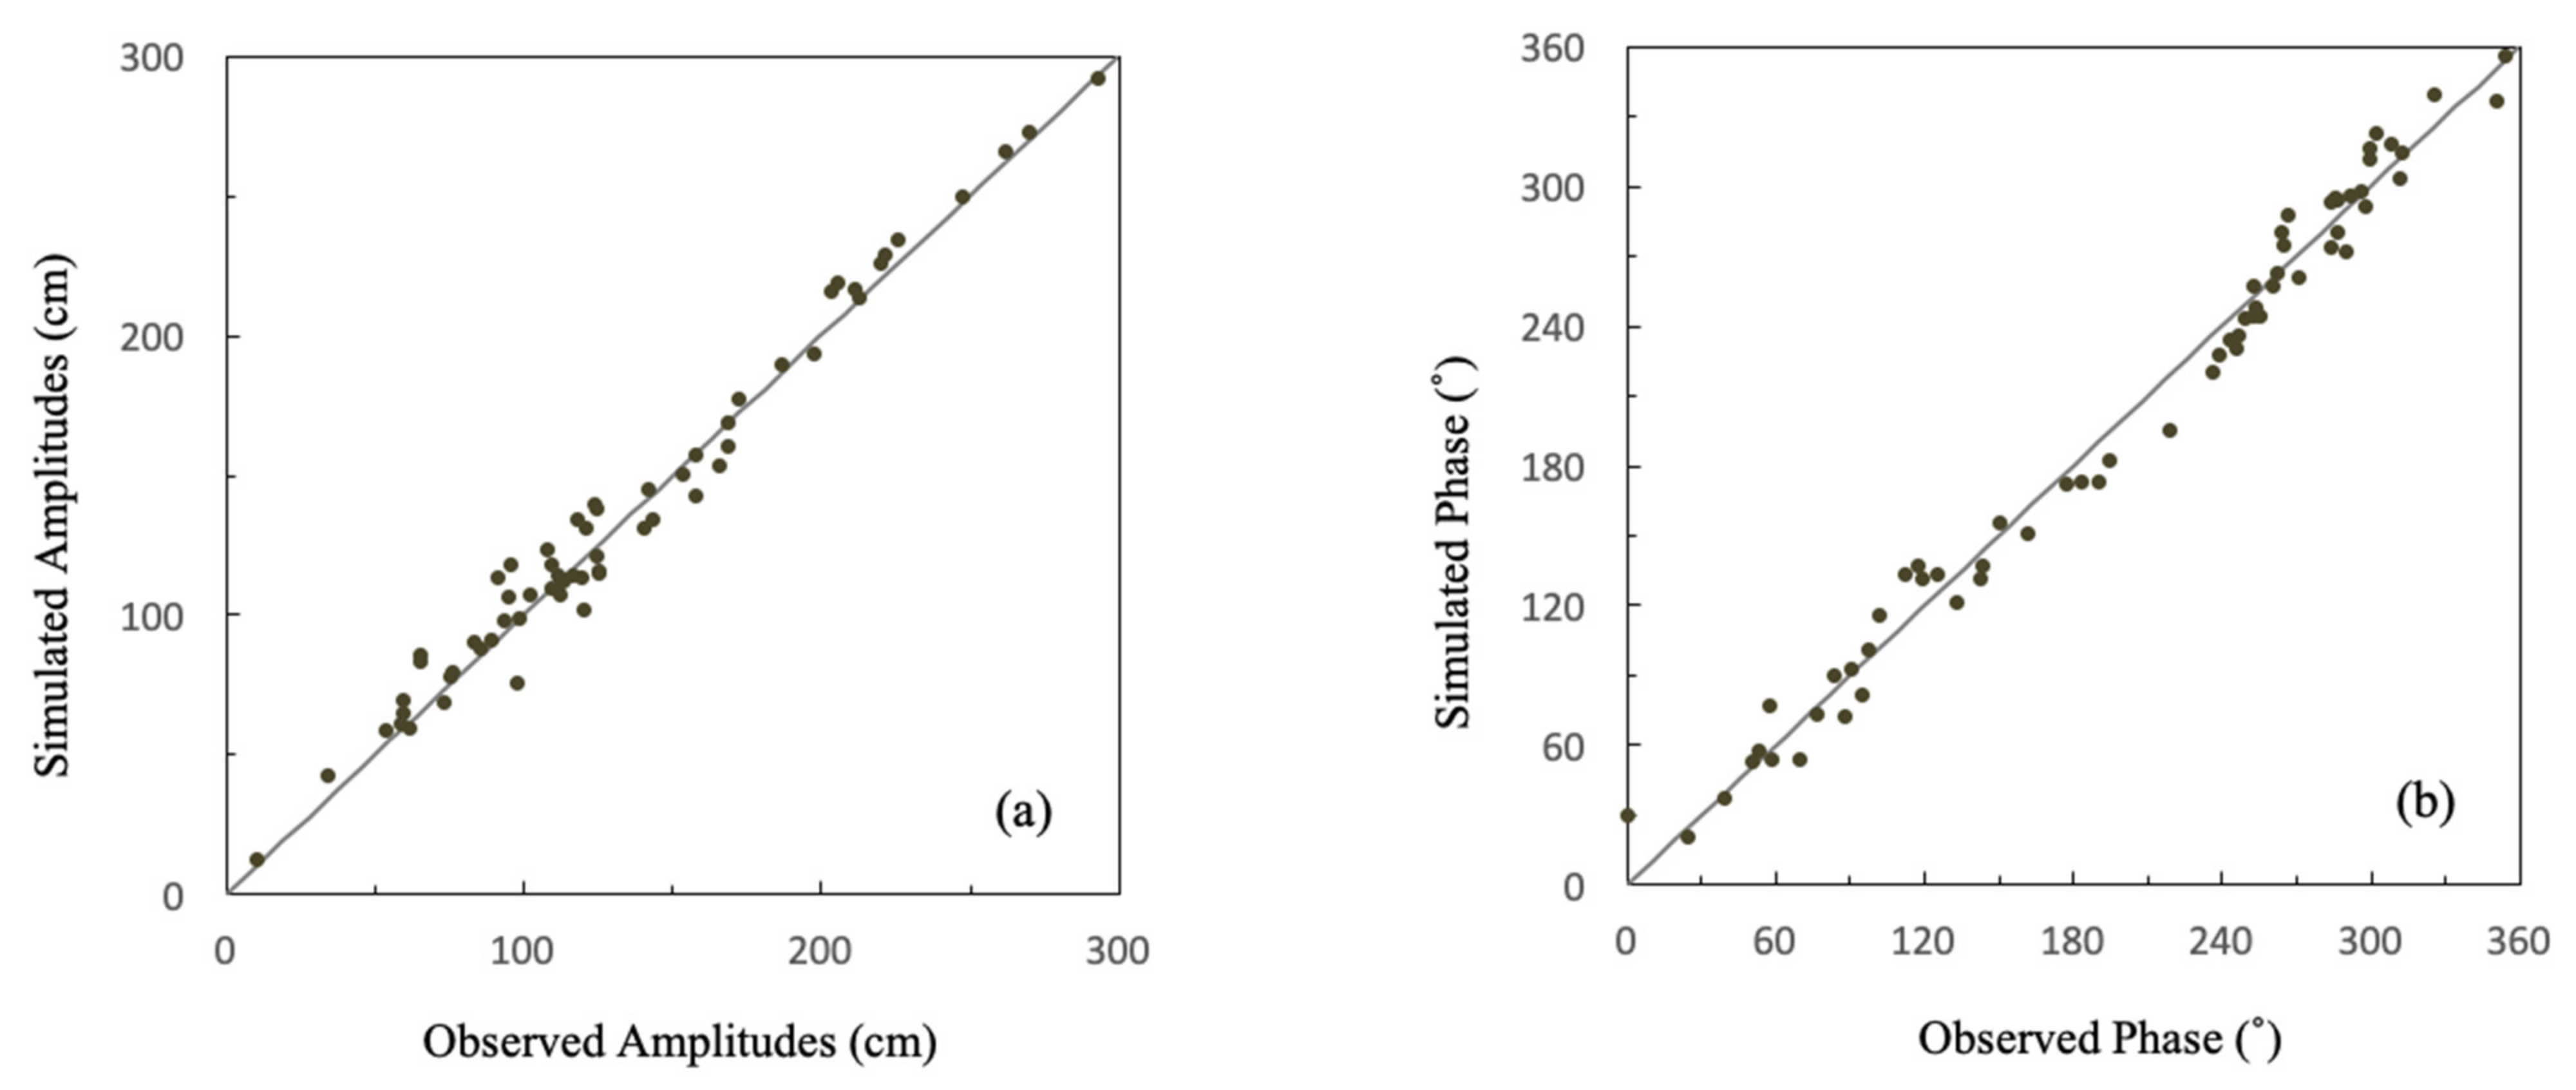
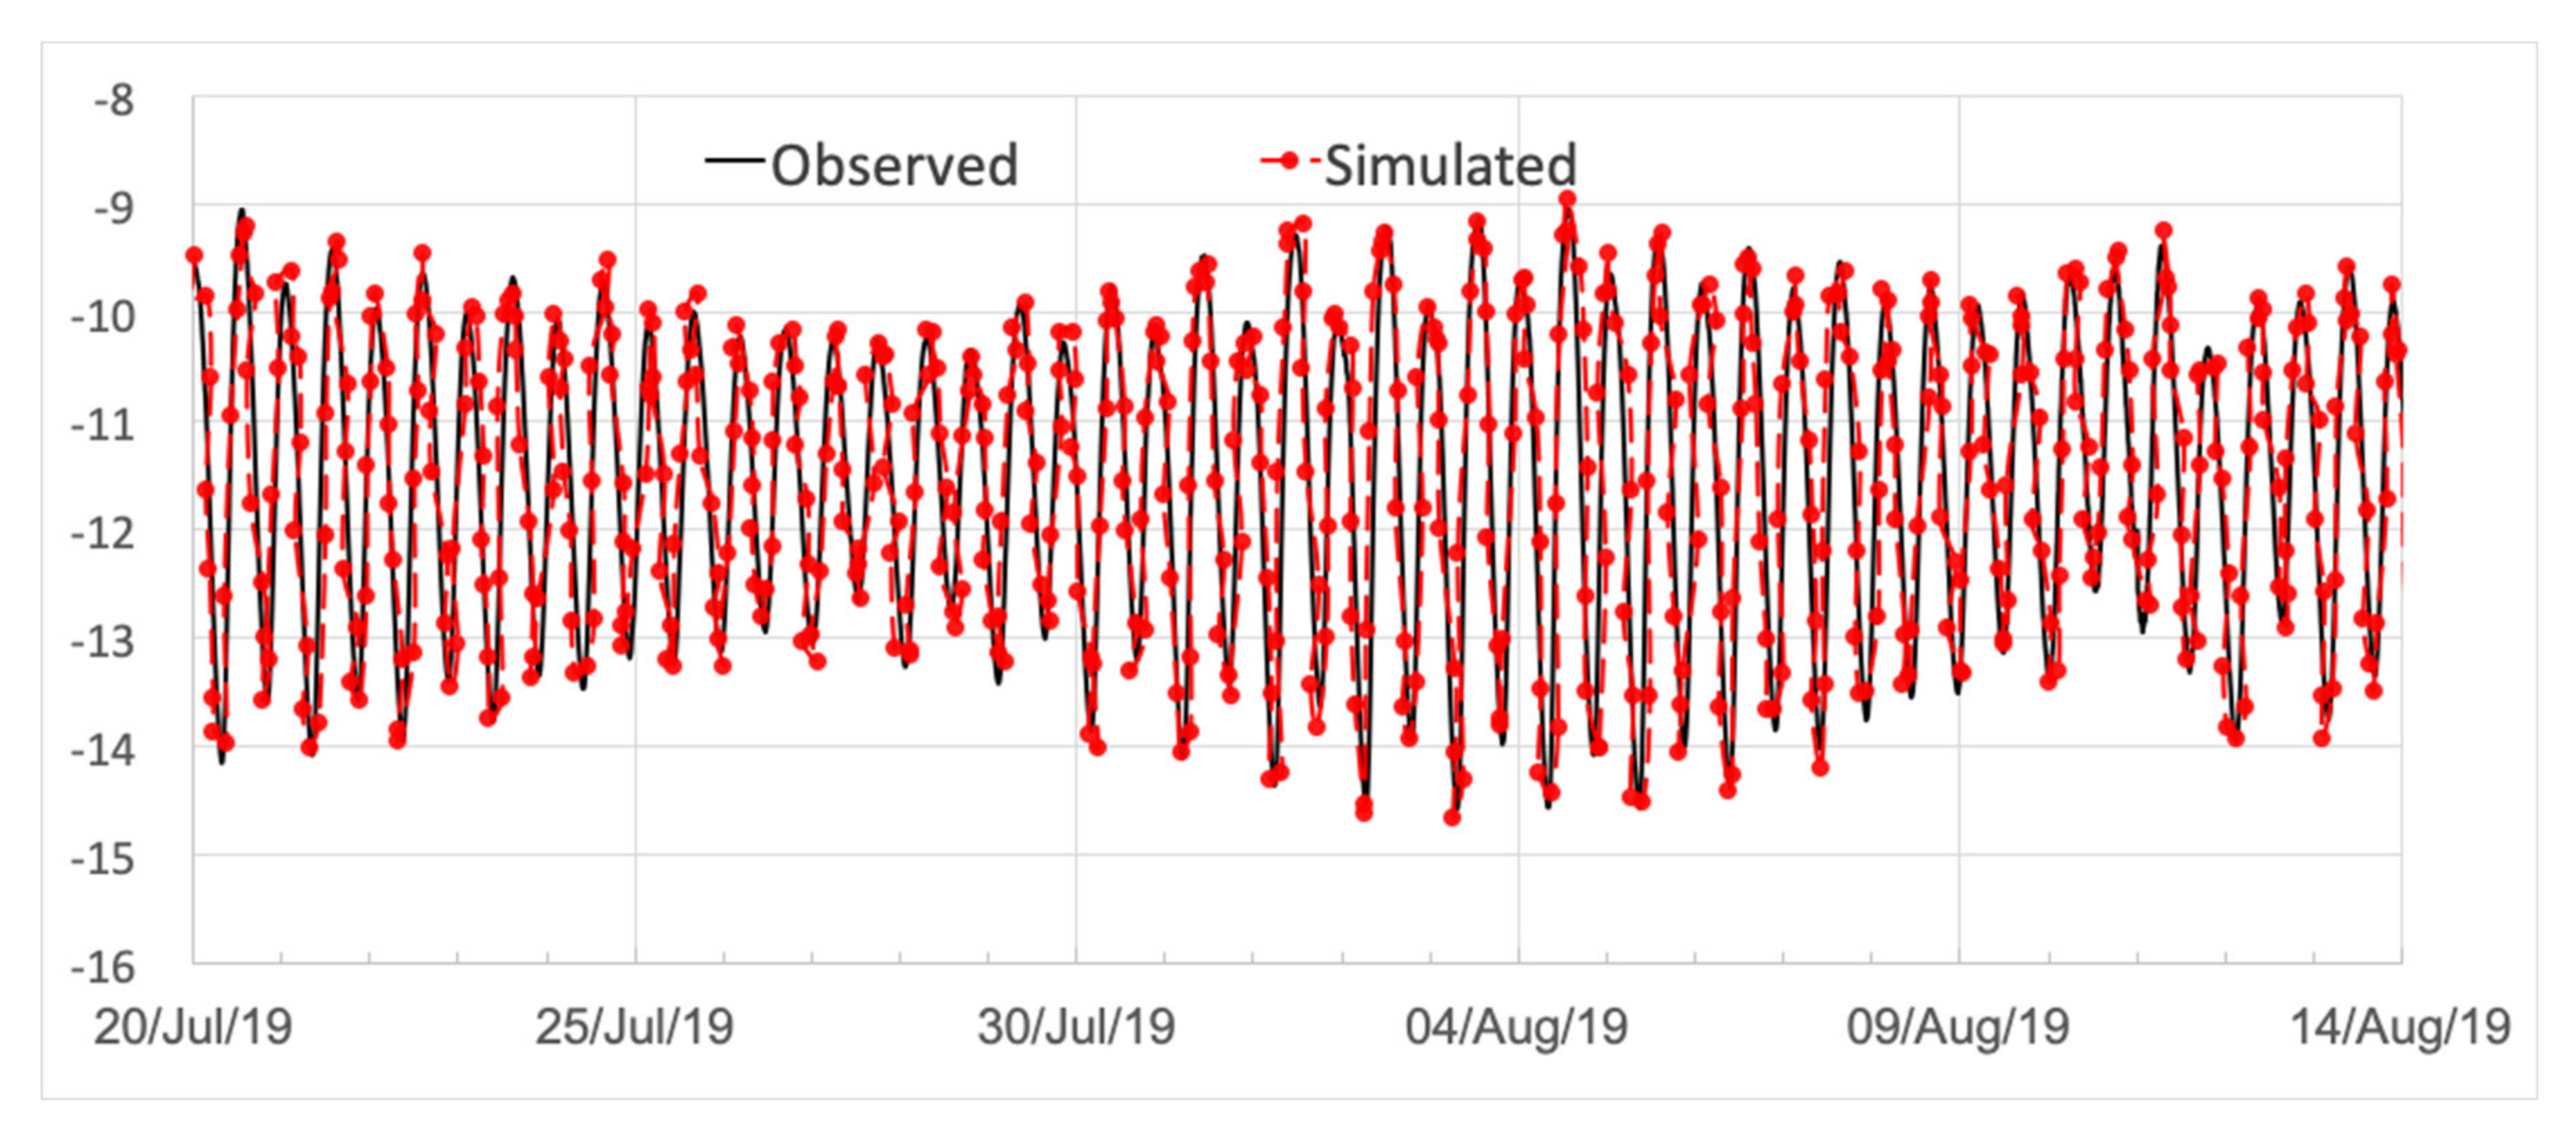
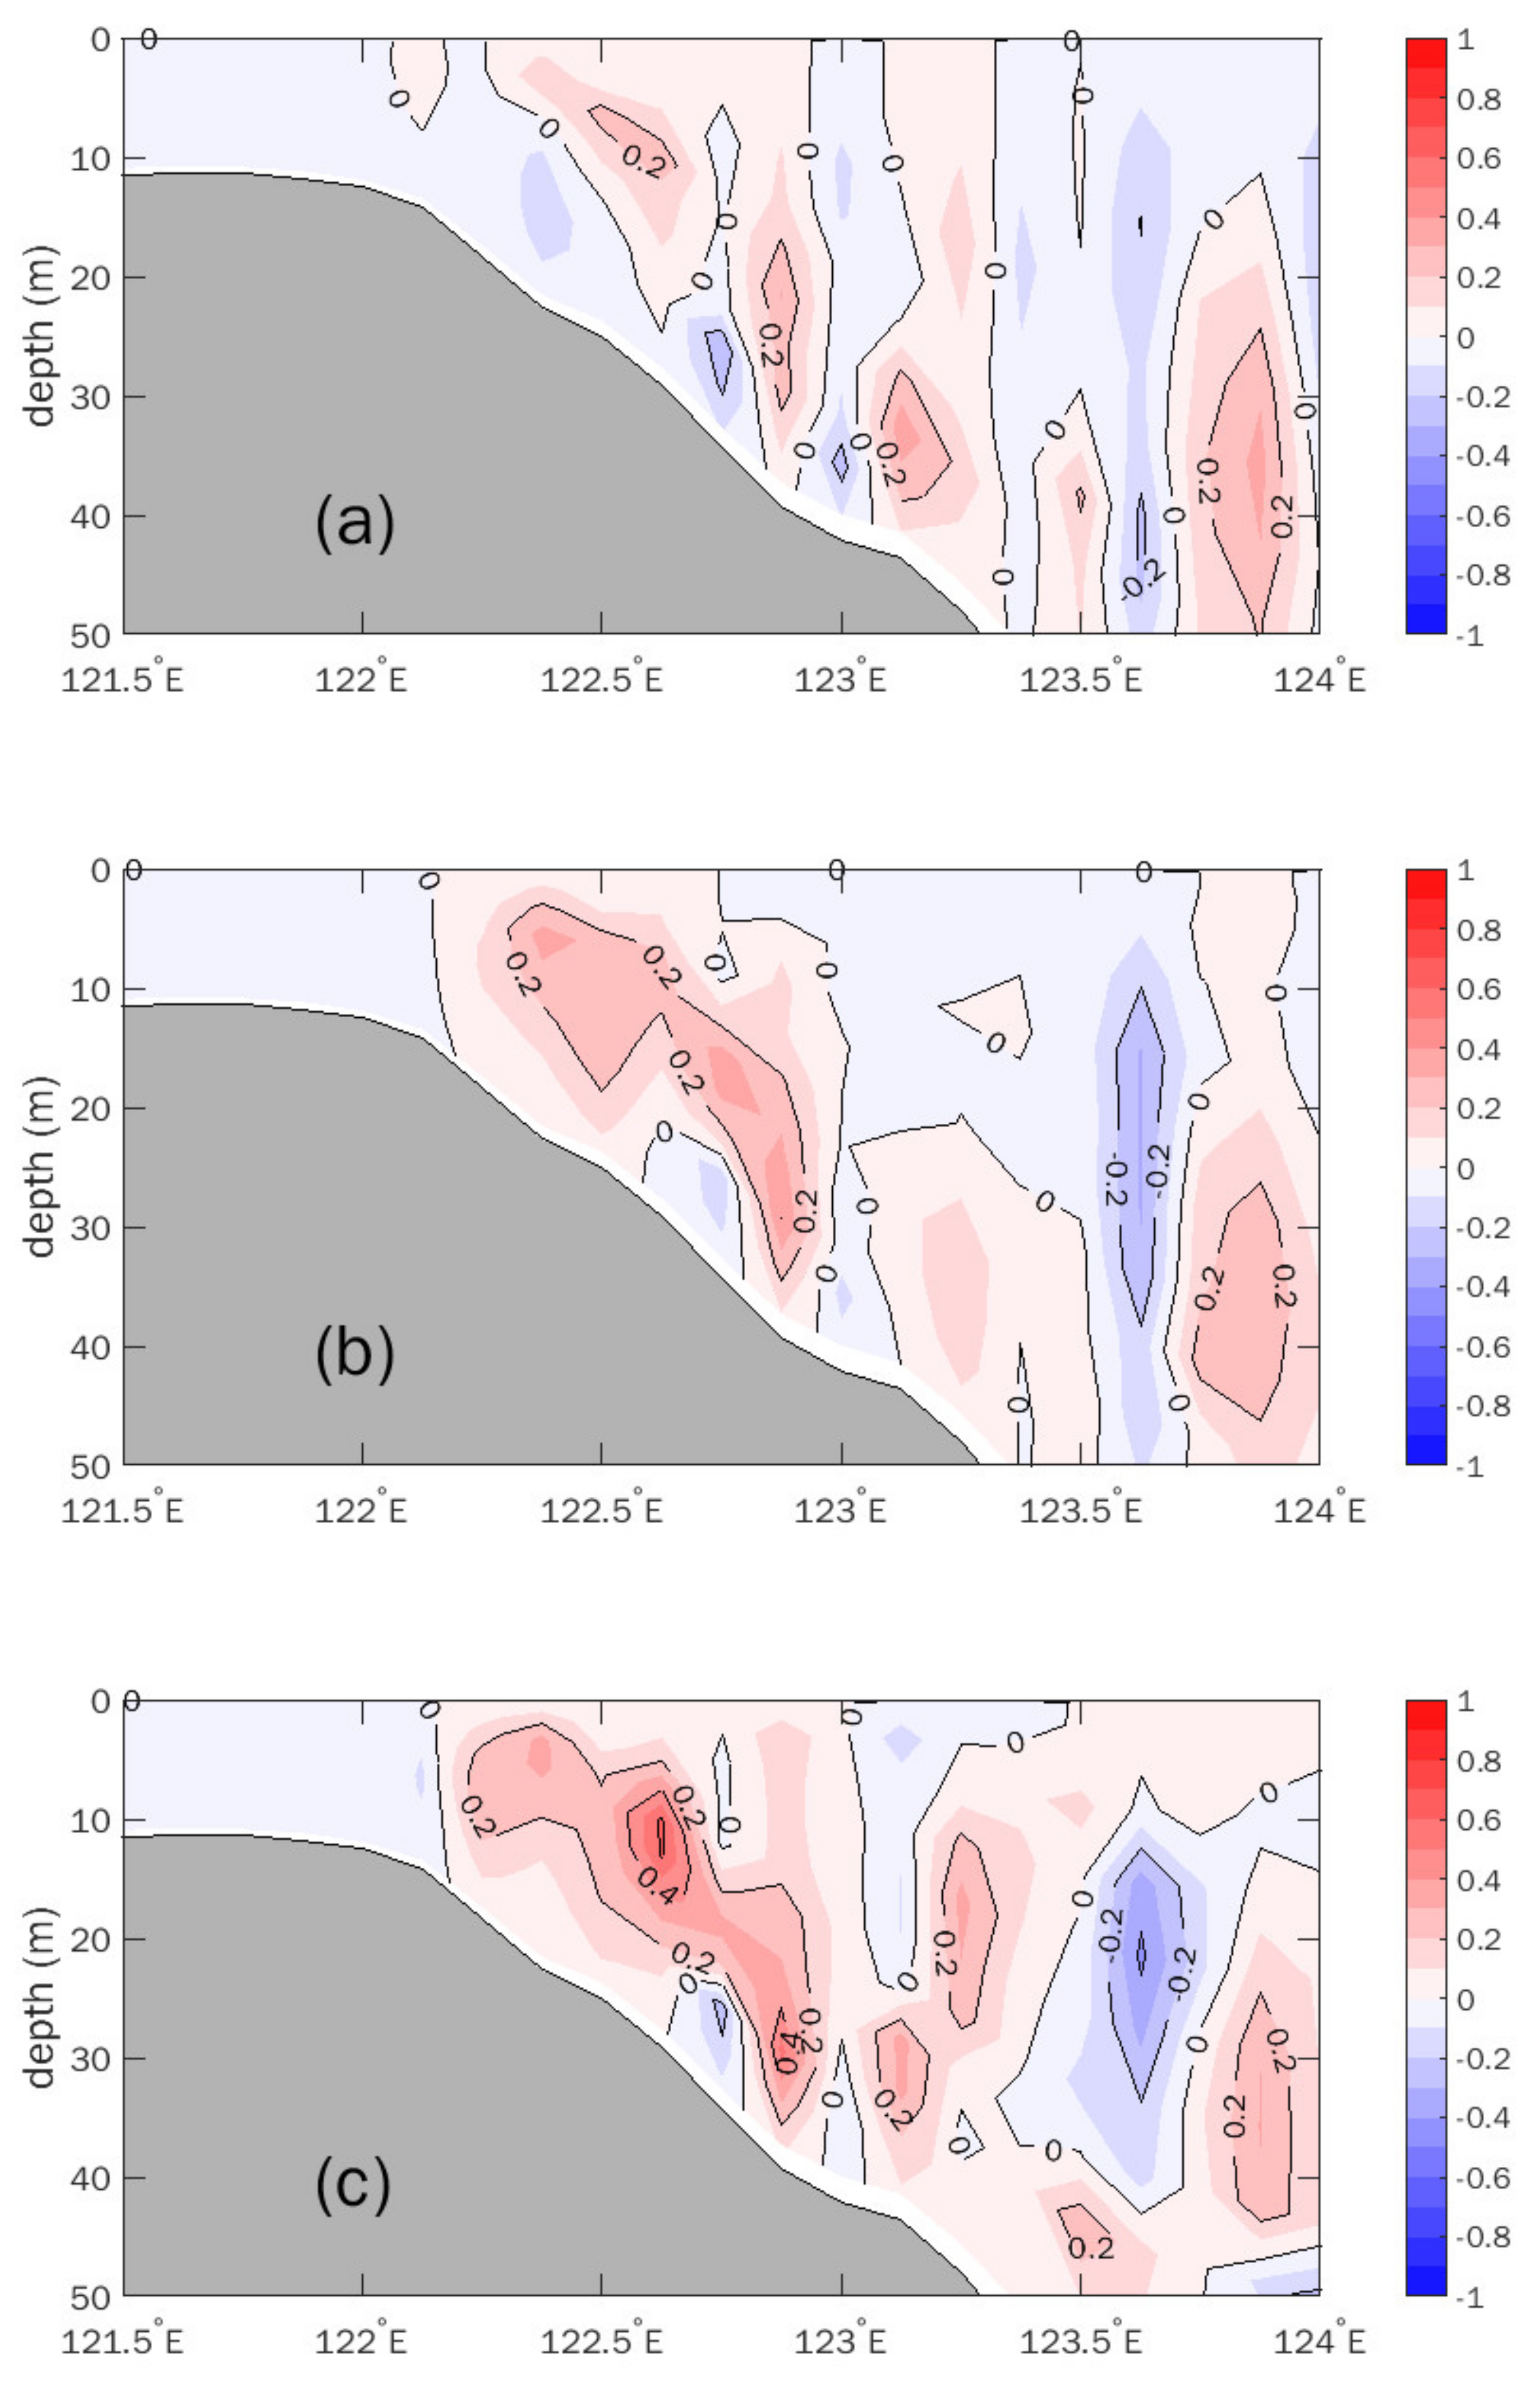
4.1. Model Validation
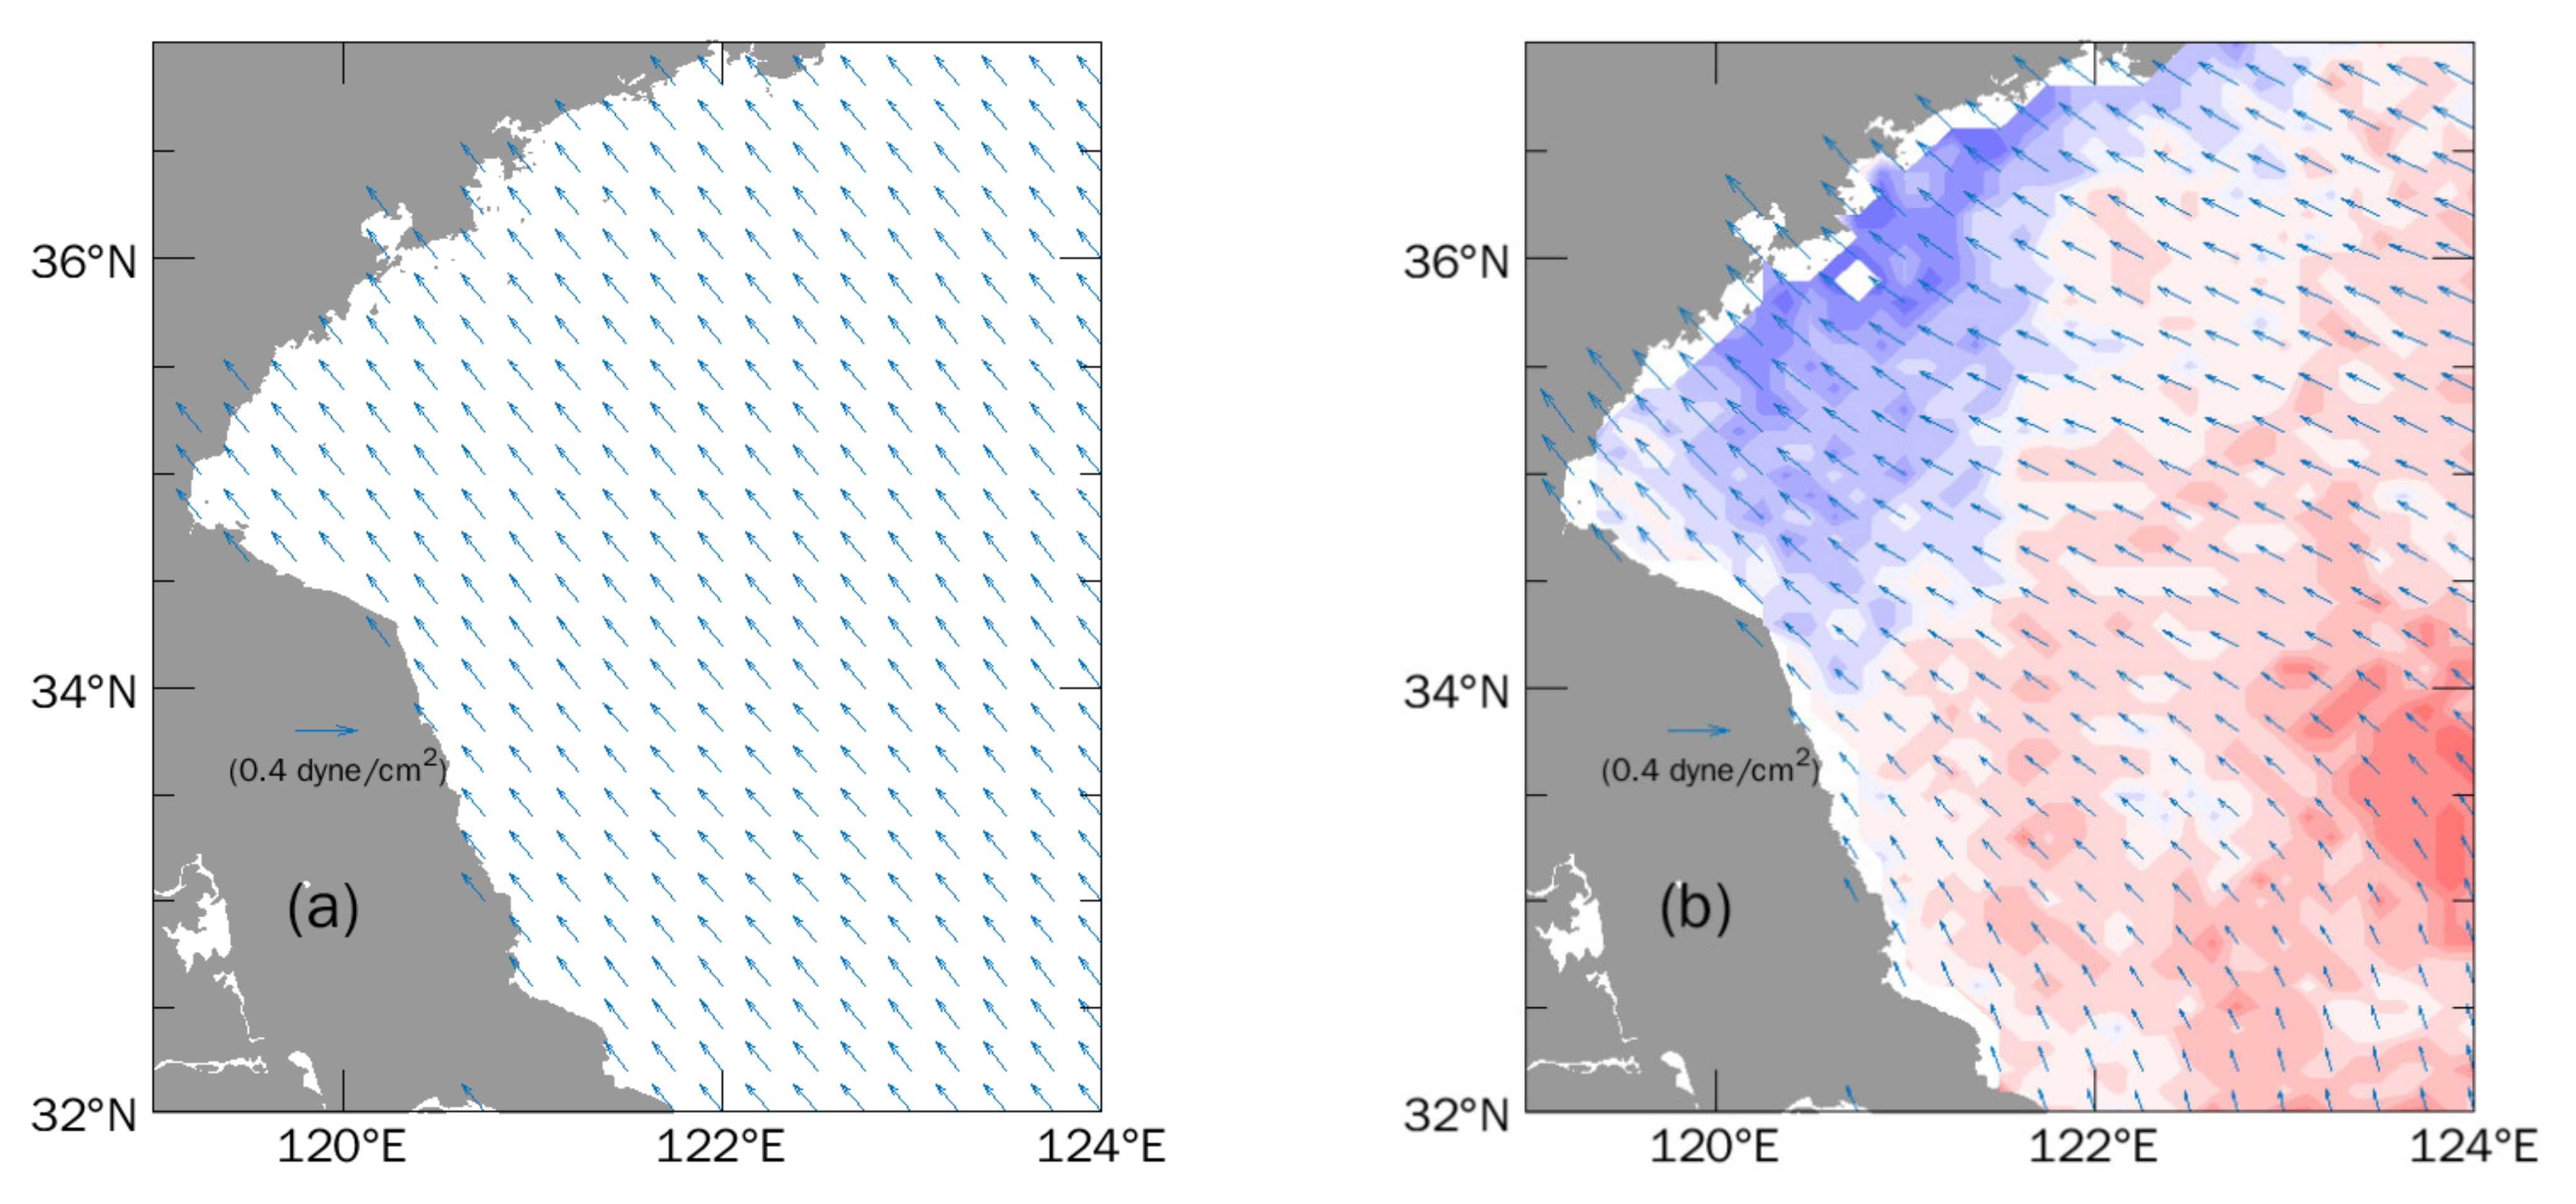
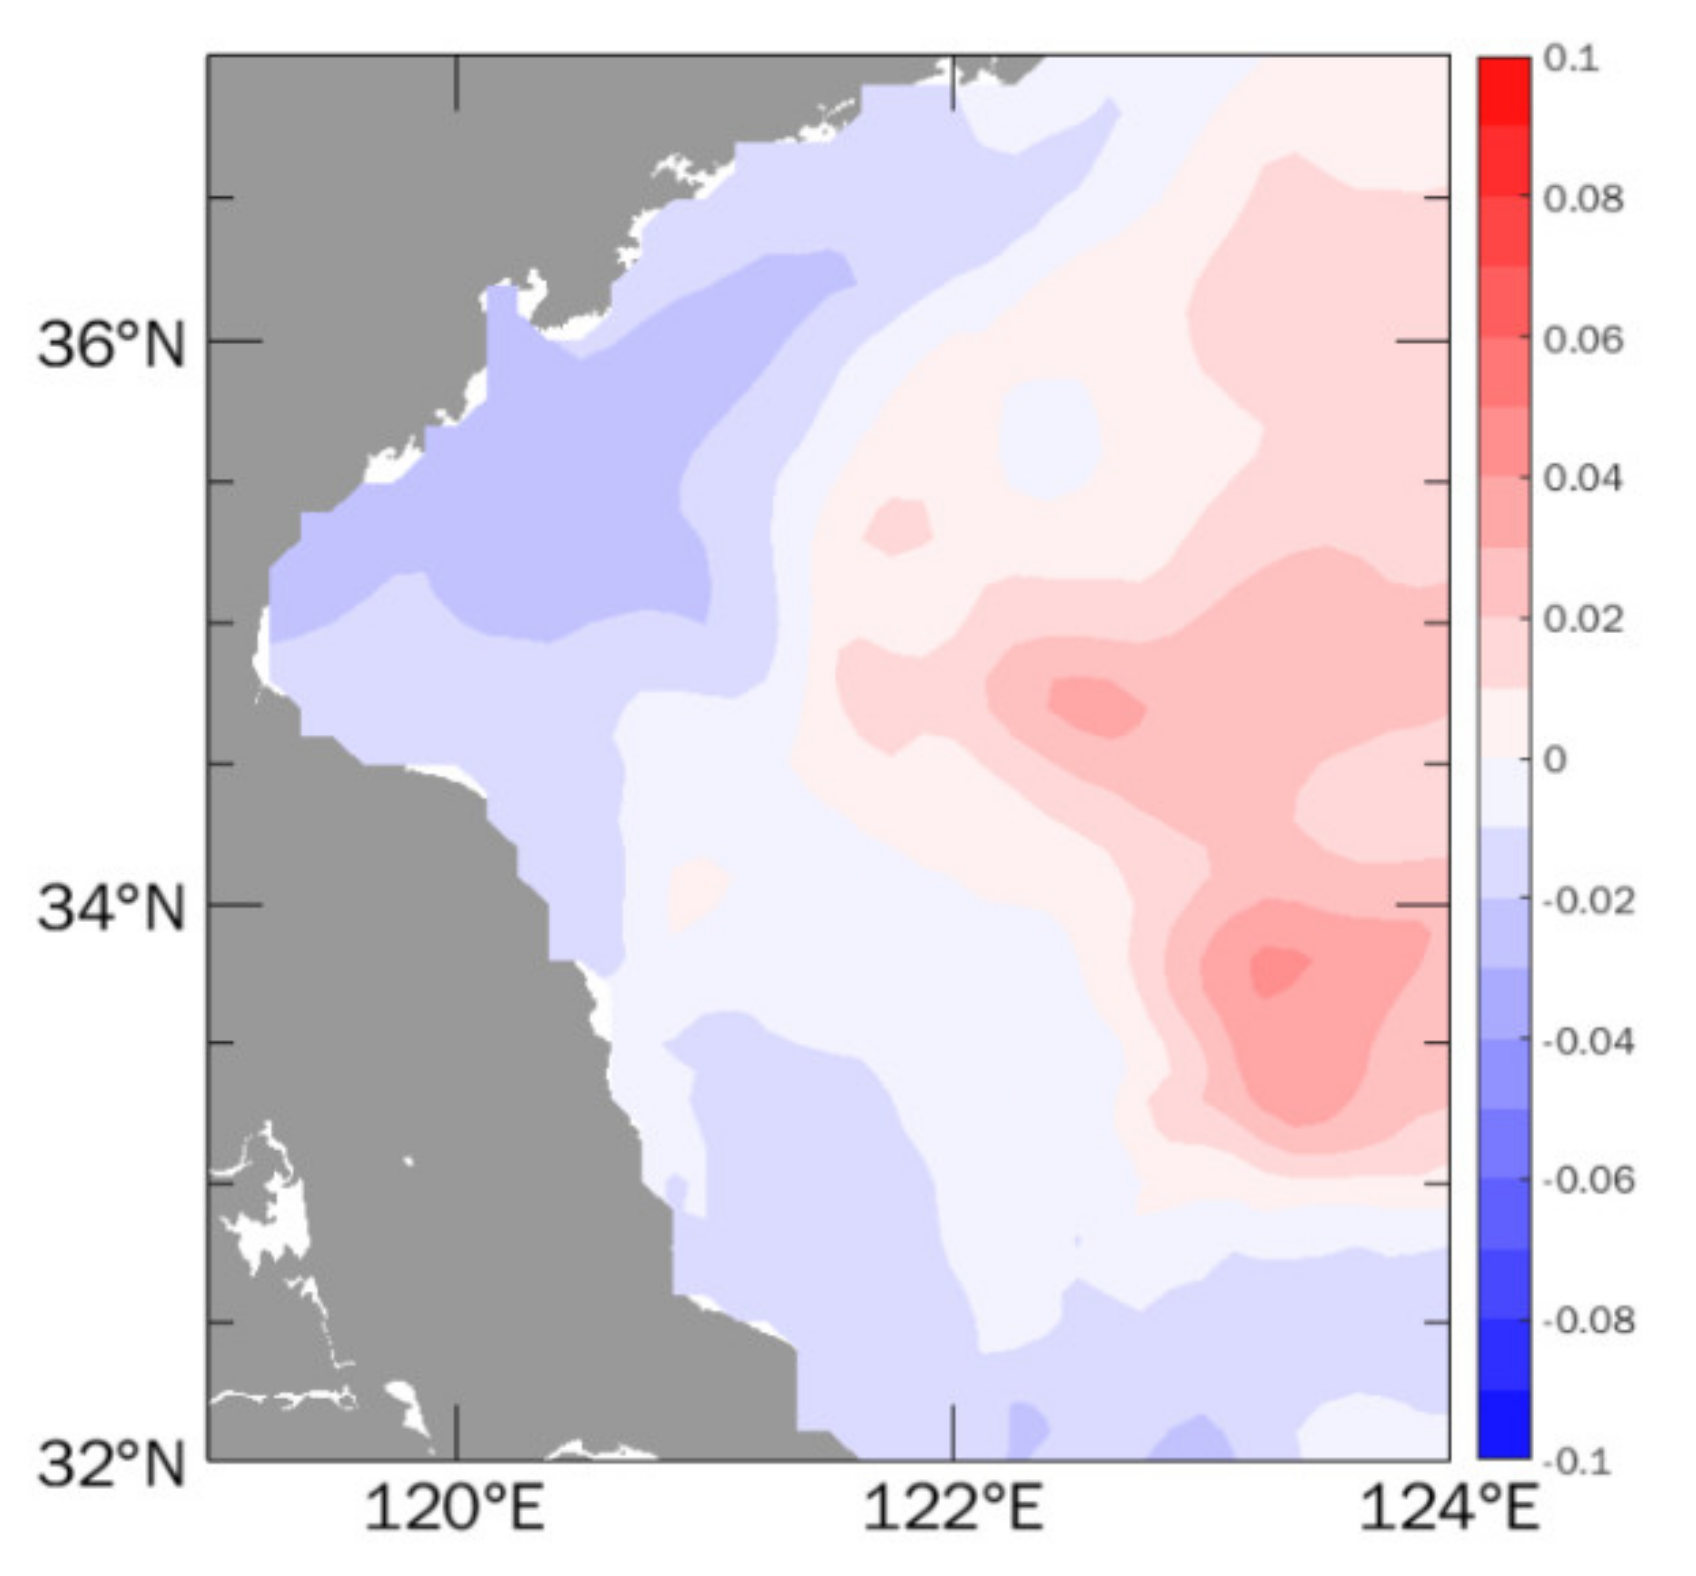
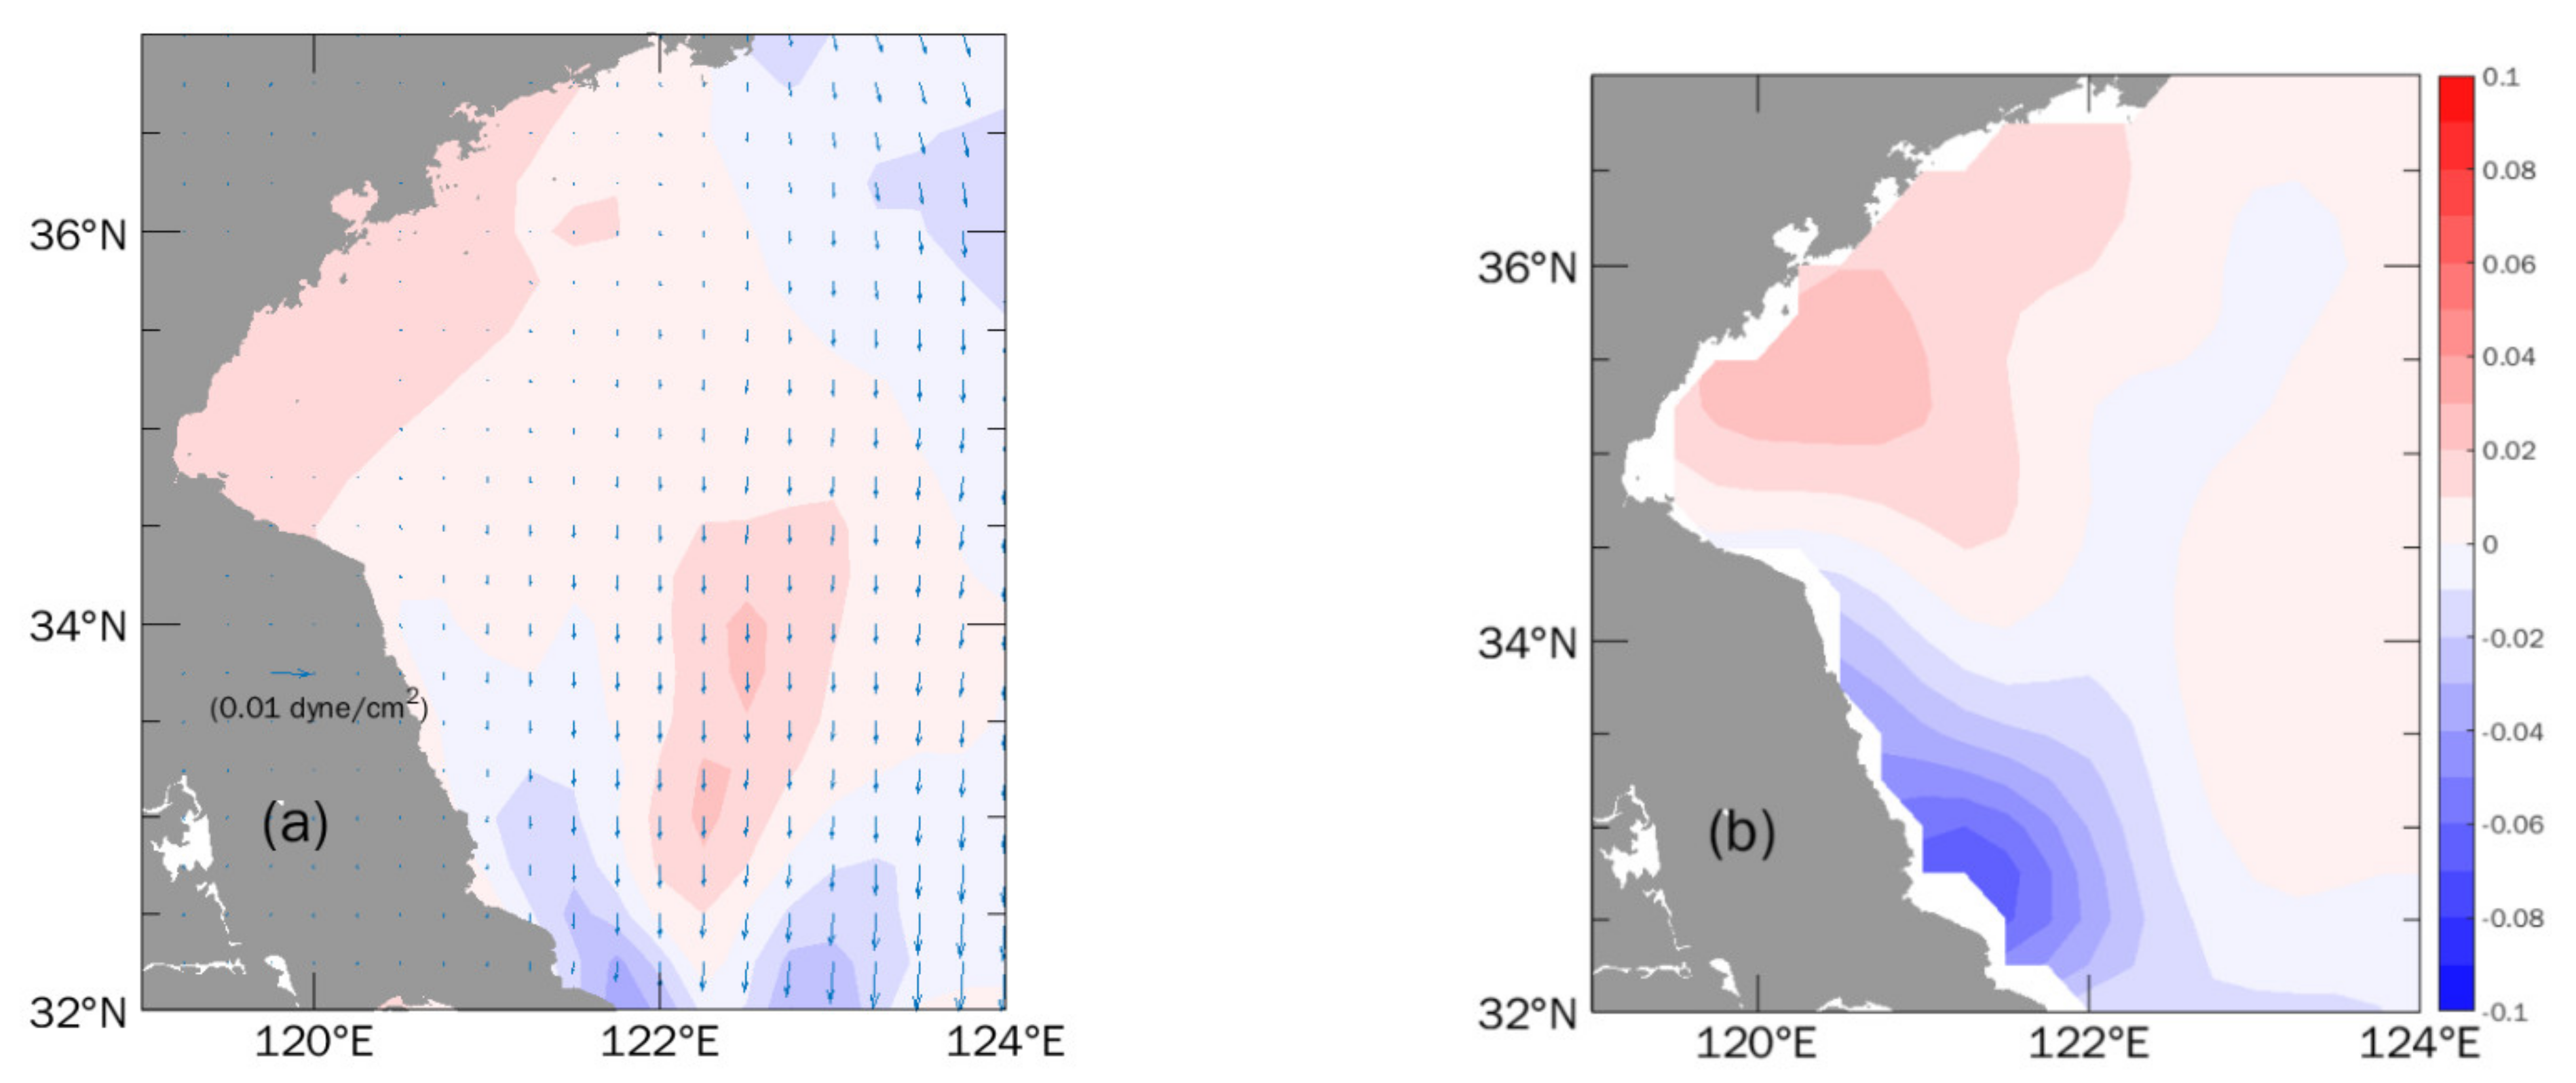
The simulated temperature (Figure 4a) in the vertical section of 34.12° N is distributed in a quite similar pattern to the cruise observation (Figure 4b), including the position and intensity of the thermocline. The isothermals are uplifted from east to west along the 34.12° N section, and the relatively colder water gushes from the sea surface between 122° E and 122.5° E in both the observation and simulation. This implies that the present model captured the essential dynamics of the circulation systems in the study area.
The simulated SST in the first 10 days of August 2019 was compared with the MGDSSTs dataset (Figure 5). The root-mean-square error (RMSE) between simulated SST and MGDSSTs is 1.32 °C, after interpolating the MGDSSTS to the model grid. In the nearshore region (within 10 m depth), the simulated SST was higher than the satellite data. This may be due to the effect of land and clouds on the satellite data in the coastal region. Furthermore, the horizontal resolution of MGDSST was lower. The basic temperature features and the location of the cold patch off the Subei coast are represented well by the present model.
To verify the simulated tides, only tidal forcing was tested in the homogeneous water, in which the temperature and salinity were set to 21 °C and 33 PSU, respectively. The harmonic constants generated from the model basically agree with the previous numerical studies. The comparison between the simulated M2 tidal harmonic constants and the observed values at 51 sites is shown in Figure 6. The standard deviations of the M2 tidal amplitude and phase for all sites are 8.7 cm and 11.0°. The results with stratification are essentially the same as those with homogeneous water. Additionally, the sea level time series during August 2019 was also verified with the tidal gauge data (Figure 7) at the Dafeng station. The root mean square (RMS) difference is 0.11 cm.
Altogether, the data suggest that the present regional circulation model can be used to study the mechanisms of the vertical current. As mentioned above, the scientific cruise of the southwestern Yellow Sea was mainly implemented during 1 and 2 August 2019. It can be seen in Figure 7 that the spring tide occurred two days later (4 August). Taking account of the spring neap tide effects, in this study, we analyzed the simulated results during the spring tide (4 August) and the neap tides before and after it (26 July and 11 August, respectively).

4.2. Realistic Wind

The simulated temperatures for Exp.C (forced by realistic wind) at 5 m depth during the complete spring neap tidal period are displayed in Figure 8. First, Figure 8b focuses on the status during the spring tide (4 August), which was close to the cruise time. Compared with the observations (Figure 3a and Figure 5b), the simulated temperature pattern in the upper layers and the distribution of coastal fronts are represented successfully in Exp.C. The core of the surface cold patch approaches 33.5° N, 122.5° E, with the lowest temperature of 23.2 °C. Second, as also shown in Figure 8, during the spring neap tide period, the intensity of the cold water patch off the Subei coast exhibited clear variation. In the first neap tidal period (26 July), the cold patch was relatively insignificant compared with the following spring tide. The cold core temperature was around 24 °C and the size was also small. This variation in the intensity of the cold water patch could be explained by previous observations and studies that the spring tide can result in a stronger tidal-induced upwelling and vertical tidal mixing offshore from Subei [2,15]. However, most notably, the surface cold core temperature during the last neap tidal period (11 August) was the lowest (Figure 8c), and even the regional SST in the southwestern Yellow Sea warmed up remarkably. Cold water with temperatures lower than 23 °C gushed to the sea surface. In other words, the vertical transport of cold water can be stronger during neap tide periods. These results imply that there may be other factors besides tidal-induced upwelling and mixing. Further analyses will be discussed later.
The simulated temperature across the cold core section (33.5° N) is shown in Figure 9a. In the shallow region, strong vertical mixing generates a nearly uniform water column. In the central part of the Yellow Sea, strong seasonal stratification is formed. The temperature in this section also distributes as a shoreward uplifting thermocline, which is similar to that at 34.15° N (Figure 4a). As mentioned above, the shoreward arching of the thermocline usually leads to the existence of upwelling in the coastal region. Thus, the simulated magnitude of vertical velocity in the 33.5° N section (Figure 9b), which is magnified 1000 times, was compared with the temperature distribution. Obviously, the axis of the upwelling is consistent with the location of the surface cold water, and the maximum upward velocity could exceeded 4 × 10⁻⁵ m/s.
As previously mentioned, besides tidal effects, other dynamic factors might contribute to coastal upwelling. Yuan et al. [3] pointed out that the along-shore component of the summer monsoon could force upwelling off the Subei and Qingdao coasts. Thus, the wind stress during this neap–spring–neap tide period was analyzed. Southwesterly wind was prevalent on 26 July and southeasterly wind on 4 and 11 August. The area average meridional wind stress is listed in Table 2. The components of wind stress in the area along the Subei shore (from southeast to northwest) on 26 July (neap tide period) were obviously weakest. Thus, this could explain why the surface cold patch off the Subei coast on 26 July was feeble. Even more dramatically, wind stress on 4 August was the strongest among these three days. The area-averaged value of meridional wind stress was 0.55 dyne/cm2. However, the strongest wind stress under strong tidal mixing and tide-induced upwelling (spring tide period) did not strengthen the coastal upwelling. The surface cold patch was weaker than on 11 August. This implies that there was still another factor that suppressed the upwelling on 4 August. According to Ekman pumping theory, the sea surface wind stress curl leads to fluctuations of the thermocline and sea surface height and affects the three-dimensional circulation structure. Checking the wind stress fields, there was a notable negative wind stress curl in the southwestern Yellow Sea on 4 August, while it was positive on 11 August (Table 2). The sensitivity of the Subei coastal upwelling to the strength of the southerly wind stress and its curl are further examined in Section 4.3.

4.3. Sensitivity to Wind

Based on Exp.C, a series of sensitivity experiments were designed (Table 1). According to the analysis above, the upwelling on 11 August was typical. For simplicity and to stabilize the simulations, the following analyses of the experiments focus on the simulation on that day.
In Exp.cw, the steady and uniform wind stress in time and space (Figure 10a) was applied, which was the average value from 1 and 11 August 2019 over the study area. Exp.curl was established using weak shear wind stress with positive curl (Figure 10b) in the study region. The weak wind stress curl is the normalized wind stress spatial anomaly averaged during the same period. Thus, the area averaged value of the shear wind is equal to the constant wind mentioned above.
In Exp.nw, in which the wind stress is removed, the simulated surface cold patch (Figure 11a) and upward velocity (Figure 12a) are obviously weaker than in Exp.C. The onshore arching of the thermoclines is not evident. The water mass with low temperature (<24 °C) remains within a quite small range at the sea surface. Correspondingly, the upward vertical velocity decreased by nearly 50% (maximum of 2 × 10⁻⁵ m/s), mainly induced by the tidal motion.
Exp.cw (Figure 11b and Figure 12b), in which the forcing of steady and uniform wind stress was averaged over the southwestern Yellow Sea (32–36° N, 120–124° E) area during 1 and 11 August 2019 (Figure 10a), captured the substantial pattern of the Subei surface cold patch in Exp.C. Compared with the results of Exp.nw, the vertical distribution of the simulated temperature (Figure 11b) and the magnitude of the upward current (Figure 12b) under steady and uniform southwesterly wind stress were closer to those of Exp.C (Figure 9). The maximum speed of the upward current reaches 3 × 10⁻⁵ m/s. Referring to Exp.nw, the result of Exp.cw showed that, associated with northward wind-driven currents, onshore Ekman transport in the deeper layer and wind-induced upwelling was generated off the Subei coast.
To check the shear effect of wind forcing, Exp.curl was designed, which adopted a time-independent weak shear wind stress (Figure 10b). The shear wind stress is the combination of constant wind and the normalized wind stress spatial anomaly. Thus, the area averaged value of the shear wind was identical with the constant wind used in Exp.cw. The comparison between Exp.cw and Exp.curl shows the effects of shear wind stress. The vertical transport was obviously enhanced (Figure 11c) and the upward current was speeded up remarkably (Figure 12c). The size of the surface cold patch and the intensity of the upwelling resemble those of Exp.C.
First, the positive wind stress curl drives the surface water divergently, which is conducive to the upwelling of deeper water. Second, based on Exp.cw, it is evident that the high sea level, which is consistent with the onshore Ekman transport of constant southwesterly wind, was established along the western coasts. After considering the weak positive wind stress curl in Exp.curl, the thermocline and sea level of the shear center are slightly uplifted. Meanwhile, due to the limitation and blocking of the coastline, the high sea level along the Subei coast was subsided (Figure 13). Thus the crippled positive horizontal pressure gradient was beneficial to the northward flow along the western coast, which could strengthen the northward wind-driven current [1,3] in summer along the Subei coast. Associated with the enhanced northward coastal current, onshore bottom transport, and coastal upwelling were promoted. This could explain the presence of the strongest surface cold patch, though the wind stress and tide motion were not prominent on 11 August. The opposite could also be true, that a negative wind stress curl could suppress the summer coast upwelling in the southwestern Yellow Sea.
Therefore, the local southerly wind stress and its curl should be considered to discuss the formation mechanism of summer coastal upwelling in the southwestern Yellow Sea. The southerly summer wind stress and tidal effects contribute almost equally to the coastal upwelling system, and their effects can be overlaid or confront each other.
Furthermore, due to global warming, regional monsoons over the Yellow and East China Seas have changed significantly [38,39]. Based on ERA5 wind stress and C3S sea-level gridded data, long-term changes of the summer monsoon and sea level anomaly were analyzed. As shown in Figure 14a, the southerly summer wind has weakened slightly but the positive shear has been enhanced over the study area over the past decade. The change of sea level anomalies (Figure 14b) based on satellite data presents a subsided high sea level along the Subei coast, which is consistent with the changes in wind stress curl. Thus, long-term changes of the summer monsoon might have two contrary effects on upwelling and the nutrient transport process. The final influence may be another reason for the eutrophication and frequent occurrence of green tides in this region, which urgently needs to be studied. Further quantitative investigations on the contribution of upwelling to the nutrient cycle remain to be established.

5. Conclusions

The features of the summer coastal upwelling in the southwestern Yellow Sea were investigated based on scientific cruise observations and numerical simulations. The observation data suggest that a relatively colder and saltier water core exists from the bottom to the surface along the northeastern flank of Subei Bank. A surface cold water patch can be observed frequently. Additionally, the concentrations of dissolved inorganic nitrogen suggest that coastal upwelling is beneficial for the enrichment of nutrients in the upper layer of the southwestern Yellow Sea, which has been an important environmental trigger for the growth of green tide (Ulva prolifera) in recent years.
Furthermore, a high-resolution circulation model was established to investigate the controlling factors of the upwelling. The model successfully reproduced the spatial structure and temporal evolution of the surface cold patch off the Subei coast. The upwelling across the center of the surface cold patch exceeded 4 × 10⁻⁵ m/s. Additionally, the simulated results suggest that the upwelling, which was previously considered be related to tidal motions, could be stronger during neap tide periods than spring tide periods. This indicates there might be other factors controlling coastal upwelling in the southwestern Yellow Sea.
Sensitivity experiments suggest that, besides strong tidal motions, southwesterly wind stress contributes significantly to the upwelling off the Subei coast. Meanwhile, the favorable (unfavorable) effects of the local positive (negative) wind stress curl on coastal upwelling should be counted as well. This study confirms that summer wind stress and tidal motions contribute almost equally to the vertical current, which is the reason for the inconsistency between the intensity of the surface cold patch and the spring neap tidal variations. Therefore, the changes in the summer monsoon and its curl over the past decade could be helpful in the formation of upwelling, which may provide a favorable marine environment for the frequent bloom of harmful algal (e.g., Ulva prolifera) in the Yellow Sea.

Author Contributions

Conceptualization, B.W.; data curation, B.W. and L.W.; investigation, B.W. and L.W.; software, N.Z., T.L. and N.H.; validation, L.W.; project administration, B.W. All authors have read and agreed to the published version of the manuscript.

Funding

This work was supported by the National Key Research and Development Project (2018YFD0900906), the Fundamental Research Funds for the Central Universities (B210203027), the National Natural Science Foundation of China (Project 41706023 and Project 41806118), and the Natural Science Foundation of Jiangsu Province (Grant No. BK20170871 and Grant No. BK20170870).

Institutional Review Board Statement

Not applicable.

Informed Consent Statement

Not applicable.

Data Availability Statement

MGDSSTs data was provided by Japan Meteorological Agency, http://ds.data.jma.go.jp/gmd/goos/data/pub/JMA-product/. ERA5 reanalysis meteorological forces and C3S Sea level gridded data were provided by the European Centre for Medium-Range Weather Forecasts, https://www.ecmwf.int/en/forecasts/datasets. The data of Changjiang River Discharge was provided by the Chinese River Sediment Bulletin.

Acknowledgments

The authors thank the research cruise of the vessel sharing plan of the NSFC and acknowledge the hard work of the crew and scientists onboard. The authors thank Li Jingjing of Hohai University for checking the biogeochemistry name. The authors also thank the editors and anonymous reviewers for their works on this paper.

Conflicts of Interest

The authors declare no conflict of interest.

References

  1. Wang, B.; Li, Y.; Yuan, D. Effects of topography on the sub-tidal circulation in the southwestern Huanghai Sea (Yellow Sea) in summer. Acta Oceanol. Sin. 2013, 32, 1–9. [Google Scholar] [CrossRef]
  2. Lü, X.; Qiao, F.; Xia, C.; Wang, G.; Yuan, Y. Upwelling and surface cold patches in the Yellow Sea in summer: Effects of tidal mixing on the vertical circulation. Cont. Shelf Res. 2010, 30, 620–632. [Google Scholar] [CrossRef]
  3. Yuan, D.; Li, Y.; Wang, B.; He, L.; Hirose, N. Coastal circulation in the Southwestern Yellow Sea in the summers of 2008 and 2009. Cont. Shelf Res. 2017, 143, 101–117. [Google Scholar] [CrossRef]
  4. Uda, M. Hydrographical researches on the normal monthly conditions in the Japan Sea, the Yellow Sea, and the Okhotsk Sea. J. Imp. Fish. Exp. Sta. 1934, 5, 191–236. (In Japanese) [Google Scholar]
  5. Yanagi, T.; Inoue, K. Tide and tidal current in the Yellow/East China Seas. La Mer 1994, 32, 153–165. [Google Scholar]
  6. Zhao, B.; Fang, G.; Cao, D. Numerical modeling on the tides and tidal currents in the Eastern China Sea. Yellow Sea Res. 1993, 5, 41–61. [Google Scholar]
  7. Ye, A.; Mei, L. Numerical modeling of tidal waves in the Bohai Sea, the Huanghai Sea and the East China Sea. Oceanol. Limnol. Sin. 1995, 26, 63–70. (In Chinese) [Google Scholar]
  8. Moon, J.-H.; Hirose, N.; Yoon, J.-H. Comparison of wind and tidal contributions to seasonal circulation of the Yellow Sea. J. Geophys. Res. 2009, 114, C08016. [Google Scholar] [CrossRef]
  9. Guan, B.X. A preliminary study of the temperature variations and the characteristics of the circulation of the Cold Water Mass in Yellow Sea. Oceanol. Limnol. Sin. 1963, 5, 255–284. (In Chinese) [Google Scholar]
  10. Yuan, Y.; Li, H.Q. Theoretical study on the structure and mechanism of the circulation of Yellow Sea Cold Water Mass. Sci. China Ser. B 1993, 23, 93–103. (In Chinese) [Google Scholar]
  11. Yuan, D.; Zhu, J.; Li, C.; Hu, D. Cross-shelf circulation in the Yellow and East China Seas indicated by MODIS satellite observations. J. Mar. Syst. 2008, 70, 134–149. [Google Scholar] [CrossRef]
  12. Hu, C.; He, M.X. Origin and offshore extent of floating algae in Olympic sailing area. Eos Trans. AGU 2008, 89, 302–303. [Google Scholar] [CrossRef]
  13. Qiao, F.; Lü, X. Coastal upwelling in the South China Sea. In Satellite Remote Sensing of South China Sea; Liu, A.K., Ho, C.R., Liu, C.T., Eds.; Tingmao Publish Company: Taipei, Taiwan, 2008; pp. 135–158. [Google Scholar]
  14. Zhao, B. A preliminary study of continental shelf fronts in the western part of southern Huanghai Sea and circulation structure in the front region of the Huanghai Cold Water Mass. Oceanol. Limnol. Sin. 1987, 18, 217–226. (In Chinese) [Google Scholar]
  15. Huang, M.; Liang, X.S.; Wu, H.; Wang, Y. Different generating mechanisms for the summer surface cold patches in the Yellow Sea. Atmos.-Ocean 2017, 56, 199–211. [Google Scholar] [CrossRef]
  16. Wan, Z.; Qiao, F.; Yuan, Y. Three-dimensional numerical modelling of tidal waves in the Bohai, Yellow and East China Seas. Oceanol. Limnol. Sin. 1998, 29, 611–616. [Google Scholar]
  17. Zhang, H.; Zhu, J.R.; Wu, H. Numerical simulation of eight main tidal constituents in the East China Sea, Yellow Sea and Bohai Sea. J. East China Norm. Univ. Nat. Sci. Ed. 2005, 3, 71–77. (In Chinese) [Google Scholar]
  18. Kang, Y.Y.; Ding, X.; Xu, F.; Zhang, C.K.; Ge, X.P. Topographic mapping on large-scale tidal flats with an iterative approach on the waterline method. Estuar. Coast. Shelf Sci. 2017, 190, 11–22. [Google Scholar] [CrossRef]
  19. Anand, P.; Albert, P.I.; Rao, A.R. Observed inter-annual variability of upwelling characteristics during 2016–2017: A study using Princeton Ocean Model. Def. Sci. J. 2019, 69, 142–148. [Google Scholar] [CrossRef] [Green Version]
  20. Hao, J.J. Numerical study of the influence of river and warm advection on the temperature inversion in the eastern China seas. Mar. Sci. 2020, 44, 3. [Google Scholar]
  21. Li, X.; Zhao, D.; Zou, Z. A numerical study of Stokes drift and thermal effects on the oceanic mixed layer. Acta Oceanol. Sin. 2020, 39, 39–49. [Google Scholar] [CrossRef]
  22. Hirose, N. Inverse estimation of empirical parameters used in a regional ocean circulation model. J. Oceanogr. 2011, 67, 323–336. [Google Scholar] [CrossRef]
  23. Hirose, N.; Takayama, K.; Moon, J.H.; Watanabe, T.; Nishida, Y. Regional data assimilation system extended to the East Asian marginal seas. Umi Sora Sea Sky 2013, 89, 43–51. [Google Scholar]
  24. Matsumoto, K.; Takanezawa, T.; Ooe, M. Ocean tide models developed by assimilating TOPEX/POSEIDON altimeter data into hydrodynamical model: A global model and a regional model around Japan. J. Oceanogr. 2000, 56, 567–581. [Google Scholar] [CrossRef]
  25. Wang, Y.H.; Fang, G.H.; Wei, Z.X.; Wang, Y.G.; Wang, X.Y. Accuracy assessment of global ocean tide models base on satellite altimetry. Adv. Earth Sci. 2010, 25, 353–359. [Google Scholar]
  26. Kondo, J. Air-sea bulk transfer coefficients in diabetic conditions. Bound. Layer Meteorol. 1975, 9, 91–112. [Google Scholar] [CrossRef]
  27. Paulson, C.A.; Simpson, J.J. Irradiance measurements in the Upper Ocean. J. Phys. Oceanogr. 1977, 7, 952–956. [Google Scholar] [CrossRef]
  28. Ren, J.L.; Zhang, J.; Li, J.B.; Yu, X.Y.; Liu, S.M.; Zhang, E.R. Dissolved aluminum in the Yellow Sea and East China Sea, AI as a tracer of Changjiang (Yangtze river) discharge and Kuroshio incursion. Estuar. Coast. Shelf Sci. 2006, 68, 165–174. [Google Scholar] [CrossRef]
  29. Fang, R.J. Yancheng coastal and estuarine areas countermeasures water survey in Jiangsu Province. Beijing Agric. 2011, 12, 213–214. (In Chinese) [Google Scholar]
  30. Shang, Z.T. Effects of rainfall on water quality of aquaculture along the coastal areas of Jiangsu Province and countermeasures. Meteorol. Environ. Res. 2011, 10, 68–73. [Google Scholar]
  31. Wu, T.; Zhao, L.; Liu, H.; Wang, T.; Han, X.R.; Shi, X.Y. Preliminary study on the influence of Enteromorpha prolifera on nutrients. Mar. Environ. Sci. 2013, 32, 347–352. [Google Scholar]
  32. Li, H.-M.; Tang, H.-J.; Shi, X.-Y.; Zhang, C.-S.; Wang, X.-L. Increased nutrient loads from the Changjiang (Yangtze) River have led to increased harmful algal blooms. Harmful Algae 2014, 39, 92–101. [Google Scholar] [CrossRef]
  33. Wang, J.-J.; Yu, Z.-G.; Wei, Q.-S.; Dong, M.-F.; Yao, Q.-Z. Distributions of nutrients in the southwestern yellow sea in spring and summer of 2017 and their relationship with Ulva prolifera outbreaks. Oceanol. Limnol. Sin. 2018, 49, 1045–1053. (In Chinese) [Google Scholar]
  34. Wei, Q.; Wang, B.; Yao, Q.; Fu, M.; Sun, J.; Xu, B.; Yu, Z. Hydro-biogeochemical processes and their implications for Ulva prolifera blooms and expansion in the world’s largest green tide occurrence region (Yellow Sea, China). Sci. Total Environ. 2018, 645, 257–266. [Google Scholar] [CrossRef] [PubMed]
  35. Liu, X.C.; Shen, H.T.; Huang, Q.H. Concentration variation and flux estimation of dissolved inorganic nutrient from the Changjiang River into its estuary. Oceanol. Limnol. Sin. 2002, 33, 332–340. (In Chinese) [Google Scholar]
  36. Shen, Z.L. Nitrogen transport fluxes in the Yangtze River. Adv. Water Sci. 2004, 15, 752–759. [Google Scholar]
  37. Li, H.M.; Zhang, C.S.; Han, X.R.; Shi, X.Y. Changes in concentrations of oxygen, dissolved nitrogen, phosphate, and silicate in the southern yellow sea, 1980–2012: Sources and seaward gradients. Estuar. Coast. Shelf Sci. 2015, 163, 44–55. [Google Scholar] [CrossRef]
  38. Cai, R.S.; Chen, J.L.; Huang, R.H. The Response of Marine Environment in the Offshore Area of China and Its Adjacent Ocean to Recent Global Climate Change. Chin. J. Atmos. Sci. 2006, 30, 1019–1033. (In Chinese) [Google Scholar]
  39. Wu, L.; Wang, B. A Case Study on the Variability of Summer Water Properties in the Southeastern Yellow Sea Based on the Hydrological Data from 1995 to 2019. Water 2021, 13, 79. [Google Scholar] [CrossRef]
Figure 1. Bathymetry in Bohai and Yellow Seas (unit: m). Black and red dots represent cruise observation stations and tidal gauge stations, respectively.
Jmse 09 01021 g001
Figure 2. Observed horizontal patterns of (a) temperature (unit: °C) and (b) salinity (unit: PSU) in August 2019 at 10 m depth in investigated region.
Jmse 09 01021 g002
Figure 3. Vertical distributions of temperature along 34.12° N section in early August 2019 for (a) Exp.C and (b) observations (unit: °C).
Jmse 09 01021 g003aJmse 09 01021 g003b
Figure 4. Observed DIN distribution in August 2019 at (a) 10 m, (b) 20 m, and (c) 30 m in investigated region (unit: mg/L).
Jmse 09 01021 g004
Figure 5. SST distribution in the first 10 days of August 2019 for (a) Exp.C and (b) MGDSSTs data.
Jmse 09 01021 g005
Figure 6. Comparison of observed and simulated M2 tide harmonic constants: (a) amplitude and (b) phase. Tidal gauge stations are shown as red dots in Figure 1.
Jmse 09 01021 g006
Figure 7. Simulated tidal propagation (dashed red line with dots) and observed tide level data (black line) of Dafeng automatic telemetry station (unit: cm).
Jmse 09 01021 g007
Figure 8. Horizontal distributions of simulated temperature at 5 m depth in Exp.C on (a) 26 July, (b) 4 August, and (c) 11 August 2019 (unit: °C).
Jmse 09 01021 g008
Figure 9. (a) Simulated temperature (unit: °C) and (b) magnitude of vertical velocity along 33.5° N section in Exp.C on 11 August 2019 (unit: m/s). Positive and negative values refer to upward and downward current, respectively. Vertical velocity is magnified 1000 times.
Jmse 09 01021 g009aJmse 09 01021 g009b
Figure 10. (a) Constant wind stress field in Exp.cw and (b) shear wind stress field in Exp.curl with color-filled wind stress curl. Red and blue shades represent positive and negative values, respectively.
Jmse 09 01021 g010
Figure 11. Simulated vertical temperature along 33.5° N section in (a) Exp.nw, (b) Exp.cw, and (c) Exp.curl.
Jmse 09 01021 g011
Figure 12. The simulated magnitude of vertical velocity along 33.5° N section in (a) Exp.nw, (b) Exp.cw, and (c) Exp.curl. Positive and negative values refer to upward and downward current, respectively. Vertical velocity is magnified 1000 times.
Jmse 09 01021 g012
Figure 13. Sea level anomaly difference between Exp.curl and Exp.cw (unit: m).
Jmse 09 01021 g013
Figure 14. (a) Changes of the summer monsoon, with color indicating its curl, and (b) changes of summer sea level anomaly. Changes are 2011–2020 averages minus 2001–2010 averages. Red and blue shades represent positive and negative values, respectively.
Jmse 09 01021 g014
Table 1. List of experiments and forcings.
ExperimentsForcing
Exp.CDaily wind stress and tidal forcing
Exp.nwOnly tidal forcing
Exp.cwSteady and uniform wind stress and tidal forcing
Exp.curlSteady but weak shear wind stress and tidal forcing
Table 2. Area-averaged wind stress in the region of 32° N–36° N, 120° E–124° E.
TimeArea Averaged Meridional Wind Stress and Its Curl (dyne/cm2)
26 July (neap tide)0.14/negative
4 August (spring tide)0.55/negative
11 August (neap tide)0.19/positive
Publisher’s Note: MDPI stays neutral with regard to jurisdictional claims in published maps and institutional affiliations.

