Article

The Underwater Soundscape at Gulf of Riga Marine-Protected Areas

by
Muhammad Saladin Prawirasasra
*,
Mirko Mustonen
and
Aleksander Klauson
Department of Civil Engineering and Architecture, Tallinn University of Technology (TalTech), 19086 Tallinn, Estonia
*
Author to whom correspondence should be addressed.
J. Mar. Sci. Eng. 2021, 9(8), 915; https://doi.org/10.3390/jmse9080915
Submission received: 26 July 2021 / Accepted: 11 August 2021 / Published: 23 August 2021
(This article belongs to the Special Issue Ocean Noise: From Science to Management)

Abstract

:
Passive acoustic monitoring (PAM) is widely used as an initial step towards an assessment of environmental status. In the present study, underwater ambient sound recordings from two monitoring locations in marine-protected areas (MPAs) of the Gulf of Riga were analysed. Both locations belong to the natural habitat of pinnipeds whose vocalisations were detected and analysed. An increase of vocal activity during the mating period in the late winter was revealed, including percussive signallings of grey seals. The ambient sound spectra showed that in the current shallow sea conditions ship traffic noise contributed more in the higher frequency bands. Thus, a 500 Hz one-third octave band was chosen as an indicator frequency band for anthropogenic noise in the monitoring area. It was shown that changes in the soundscape occurring during the freezing period create favourable conditions for ship noise propagation at larger distances. Based on the monitoring data, the environmental risks related to the anthropogenic sound around the monitoring sites were considered as low. However, further analysis showed that for a small percentage of time the ship traffic can cause auditory masking for the ringed seals.

1. Introduction

The pressure on marine ecosystems from anthropogenic underwater noise has been recognised as a challenging problem during the last decades. This cross-border issue can be solved only with an international joint effort. The EU Marine Strategy Framework Directive (MSFD) adopted in June 2008 is aiming to achieve the Good Environmental Status (GES) of the European seas [1]. The directive sets qualitative descriptors for GES that list Descriptor 11 as relevant to the energy introduced to the marine environment, including underwater sound. The initial step towards assessing the environmental pressure posed by anthropogenic sound is passive acoustic monitoring (PAM). One-third of octave bands (TOBs) with nominal frequencies of 63 Hz and 125 Hz have been suggested as most relevant to monitor the anthropogenic continuous low-frequency sound in water [2].
Underwater soundscapes are known to manifest spatial and temporal variability [3,4]. According to the types of contributing sources, underwater soundscapes can consist of geophony, biophony, and anthropophony [5]. Geophony includes naturally occurring non-biological sounds such as wind-generated breaking waves [6] and precipitation [7]. Anthropophony includes underwater noise induced by human activities, such as commercial ship traffic [8]. Anthropogenic underwater noise is considered a pollutant that can have long-term adverse effects on marine ecosystems. Potential impacts of continuous underwater noise are the reduction of communication space and auditory masking [9,10,11] as well as increased stress levels [12]. In the passive acoustic monitoring data, geophony and anthropophony are mixed, but by estimating the wind-dependent natural sound levels, these two components can be separated [13].
Biophony in the Gulf of Riga is typically dominated by pinniped calls [14] but can potentially also include fish vocalisations [15,16]. Underwater vocalisations of pinnipeds are known to play a significant social role in their intraspecies communication [17,18]. Vocalisations can express, for example, aggressive or submissive behaviour. Vocal interaction during the breeding period is very intensive with a high variation of call types and an increased number of calls [17,19]. It has been reported that both grey (Halichoerus grypus) and ringed seals (Phoca hispida) can use vocalisations as an aid for under-ice orientation during the winter [18,19].
The objective of this study is to provide baseline information on underwater soundscapes at two monitoring locations within the marine-protected areas (MPAs) of the Gulf of Riga. Special focus is made on the detection and identification of pinniped sounds, bearing in mind that elevated detection rates show both the abundance of animals and the importance of the respective marine areas for the pinnipeds. The environmental pressure from anthropogenic underwater noise and its potential risks are also addressed. Quantification of the proportion of the anthropogenic sound makes it possible to draw some conclusions about the current environmental status of the monitoring sites.

2. Materials and Methods

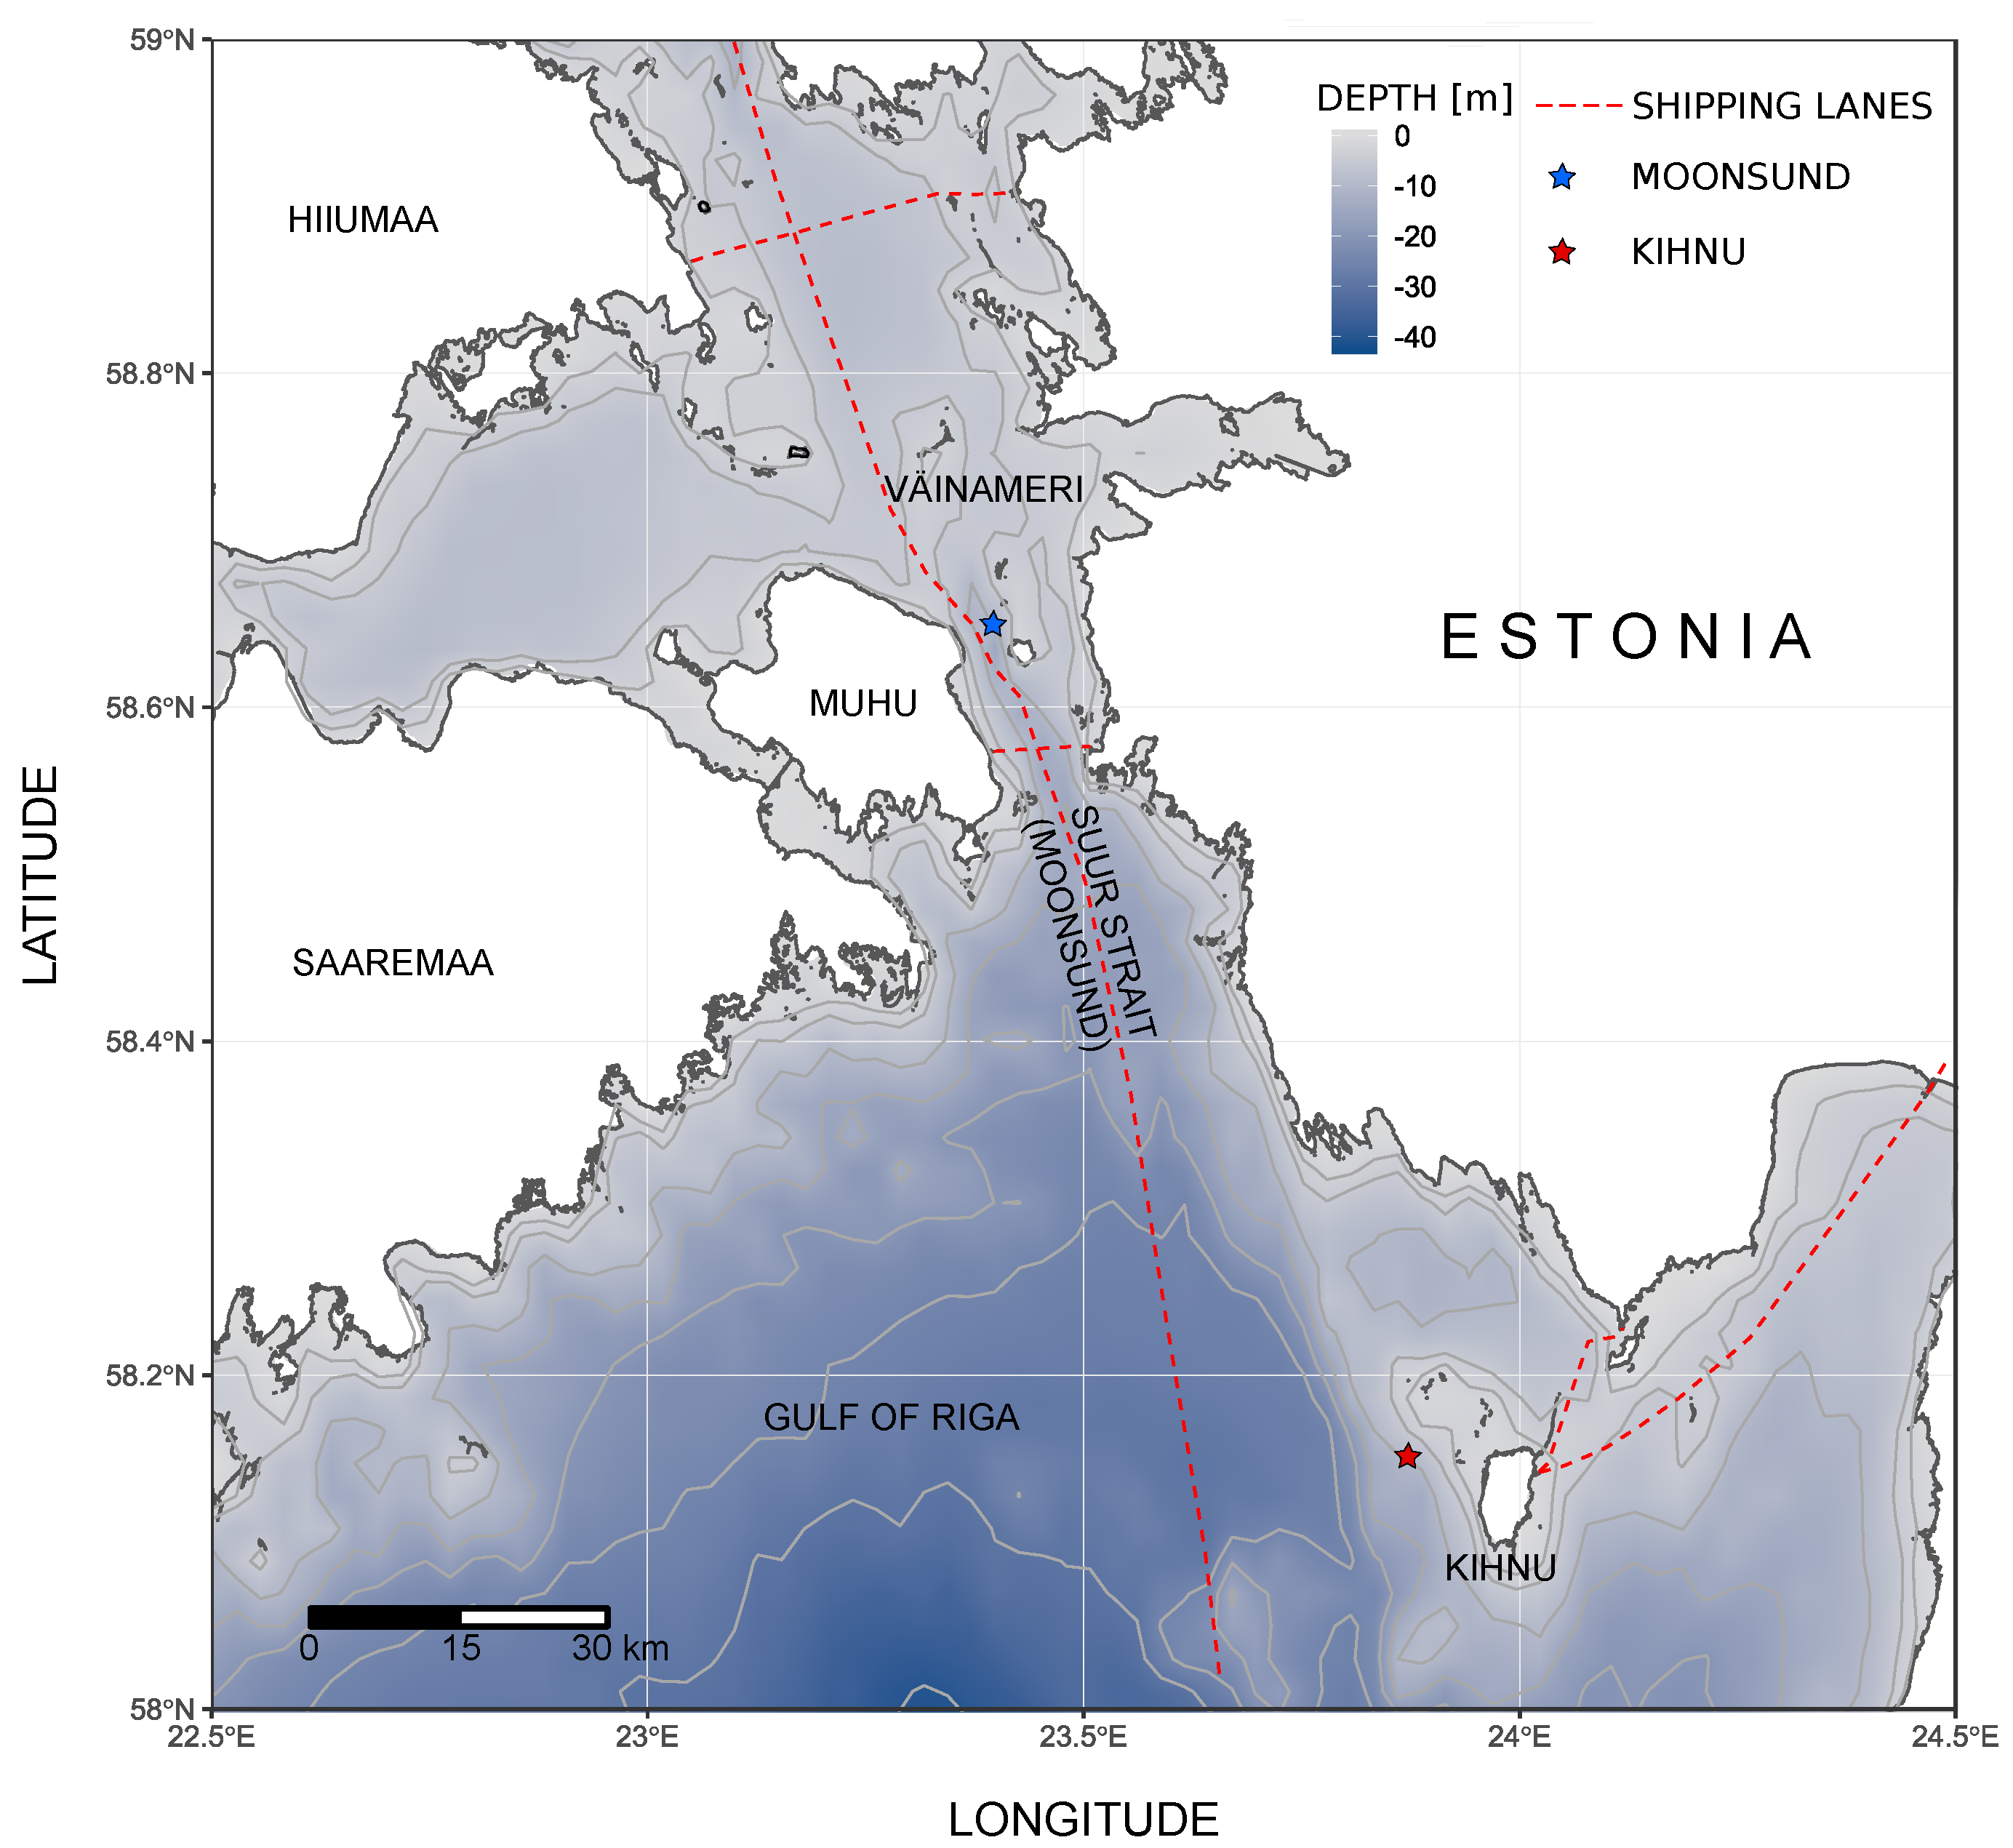
2.1. Underwater Sound Monitoring Locations

Underwater sound monitoring was conducted in two monitoring locations situated in the Natura 2000 MPAs of the Gulf of Riga. These locations are further referenced as Kihnu and Moonsund and their respective positions are shown in Figure 1. The monitoring took place from 2018 to 2019, lasting 9 months in Kihnu and 6 months in Moonsund.
The Kihnu monitoring location is relatively far from shipping lanes, while the Moonsund monitoring location is close to the local shipping lane which is known to be moderately active in summer and closed for navigation during the winter period. About 8 km to the south, a busy regular ferry line is operating year round between the mainland and Muhu Island.
Moonsund is also known as an important migration route for ringed seals from their haul-outs at the islets in the Väinameri to the feeding grounds in the south of the Gulf of Riga [20,21]. During the winter, the monitored areas are often covered by ice, making it an attractive breeding ground for seals.

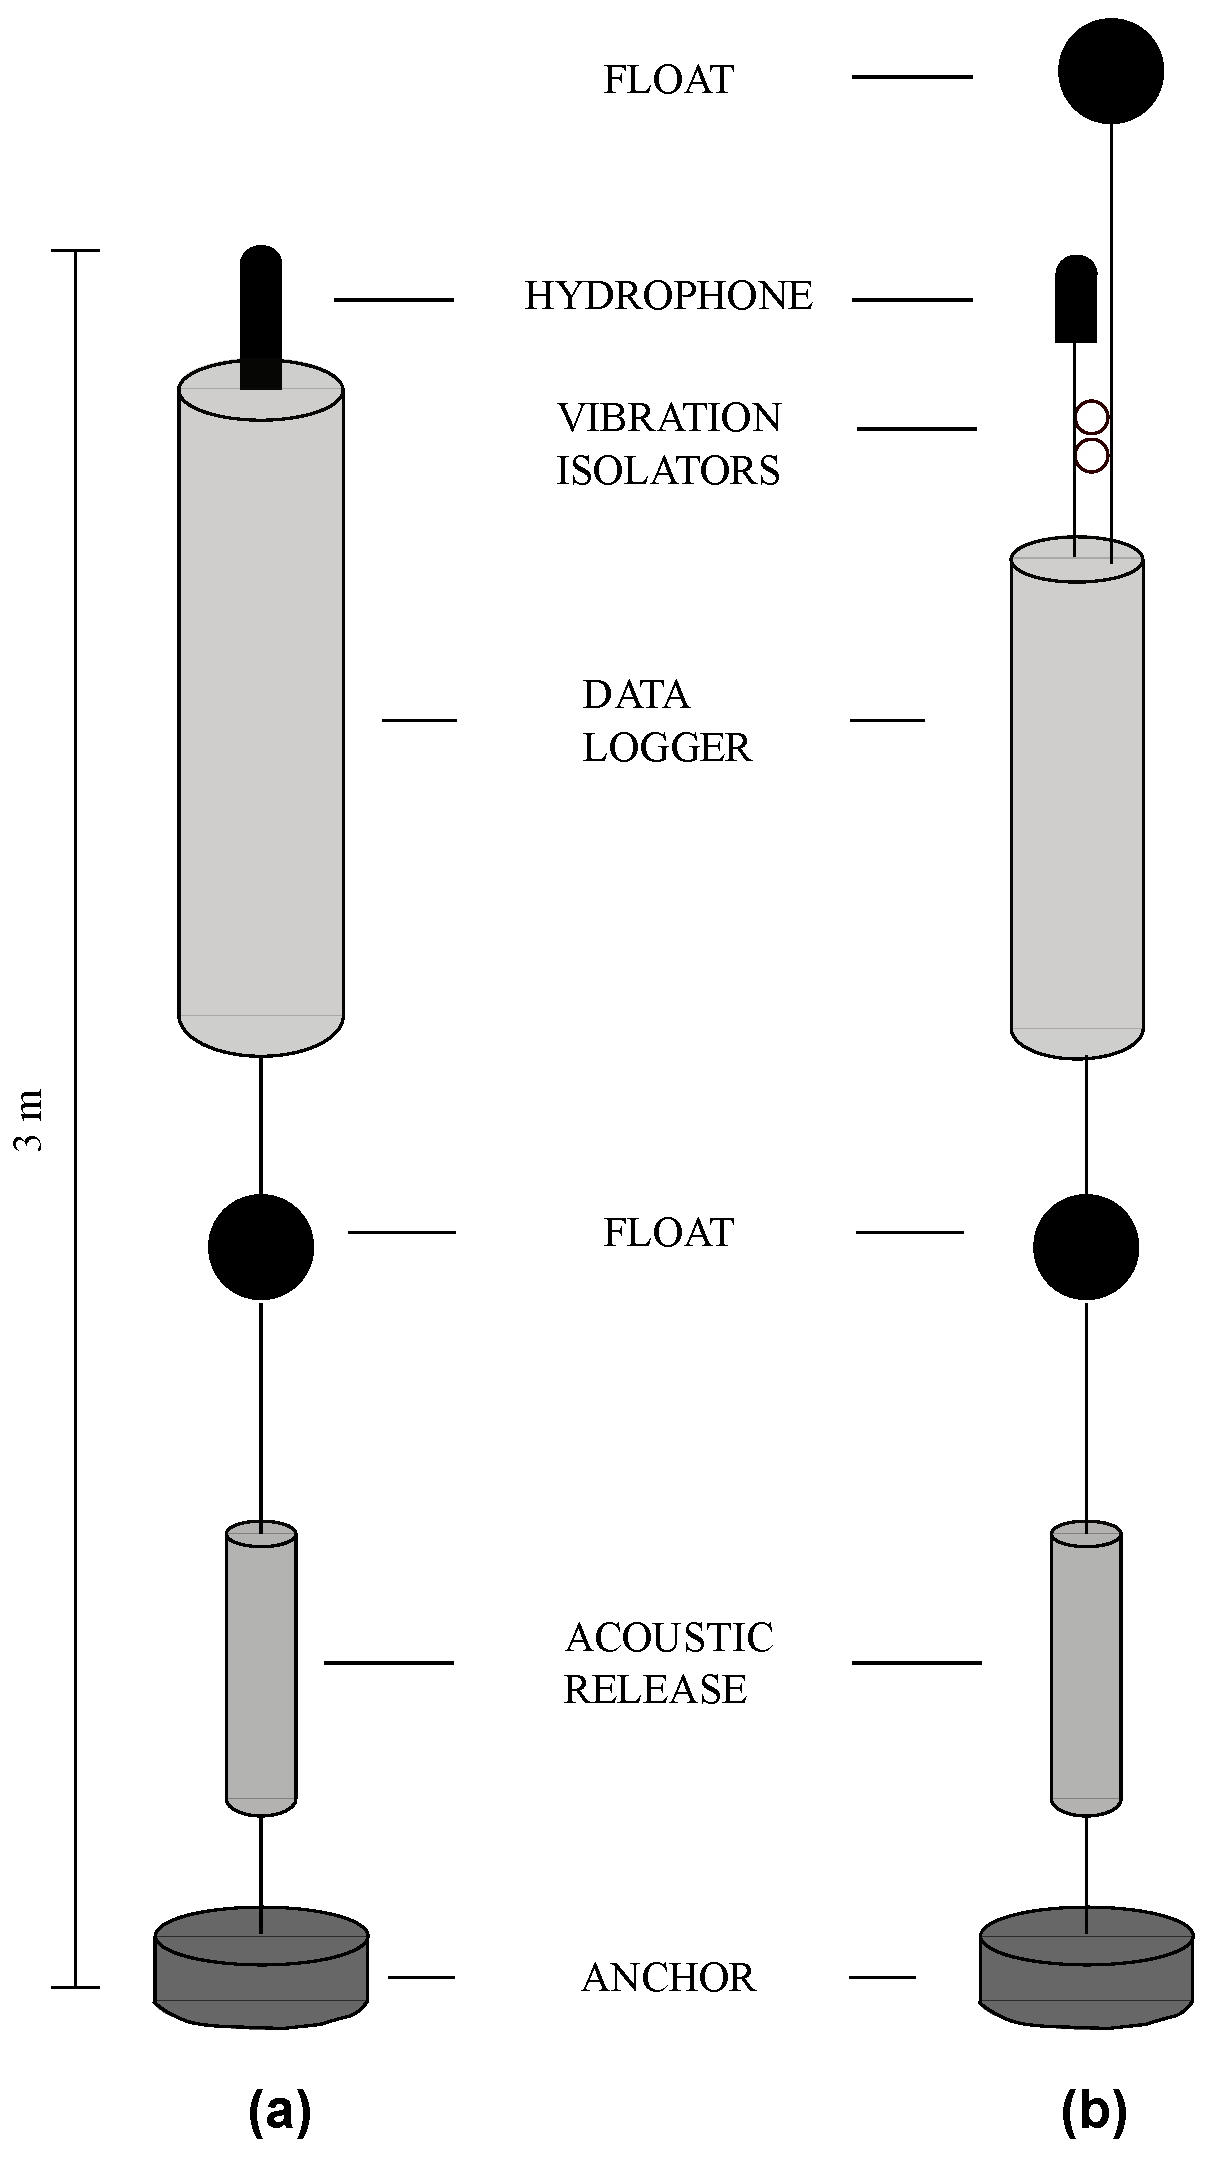
2.2. Underwater Acoustic Monitoring Equipment

Autonomous recorders by two different manufacturers were used for the ambient sound measurements. One was the SM2M [22] by Wildlife Acoustics, Inc. with a sampling frequency of 32 kHz and standard HTI hydrophone. The other recorder was the SoundTrap ST500 [23] by Ocean Instruments with a sampling frequency of 36 kHz and equipped with a standard hydrophone.
SM2M recorders were used in the Moonsund location during the whole monitoring period. In Kihnu, the sound was recorded with SM2M in summer and with ST500 during the second monitoring period, extending from autumn to early spring.
Figure 2 shows the rig designs for the two autonomous recorders. The output of both recorders was 16 bit WAV format sound files that were processed using 20 s time-averaging and a rectangular window function without overlap in order to follow the Life+ BIAS project signal processing standard [24]. The sound processing in the study was performed using PAMGuide software [25].

2.3. Detection of Pinniped Calls

At the monitoring sites, the bulk of the biological sounds were produced by grey and ringed seals, whose vocalisations were detected and identified in the wake of the results of numerous bioacoustics studies [17,18,26,27,28,29,30]. The identified calls were analysed and their patterns, including frequency ranges and call durations, were entered into the band limited energy detector (BLED) [31] for a subsequent search for similar patterns in the recorded data. Instead of detecting patterns, BLED detects events based on energy exceeding a threshold value in a selected frequency band for a specified time.

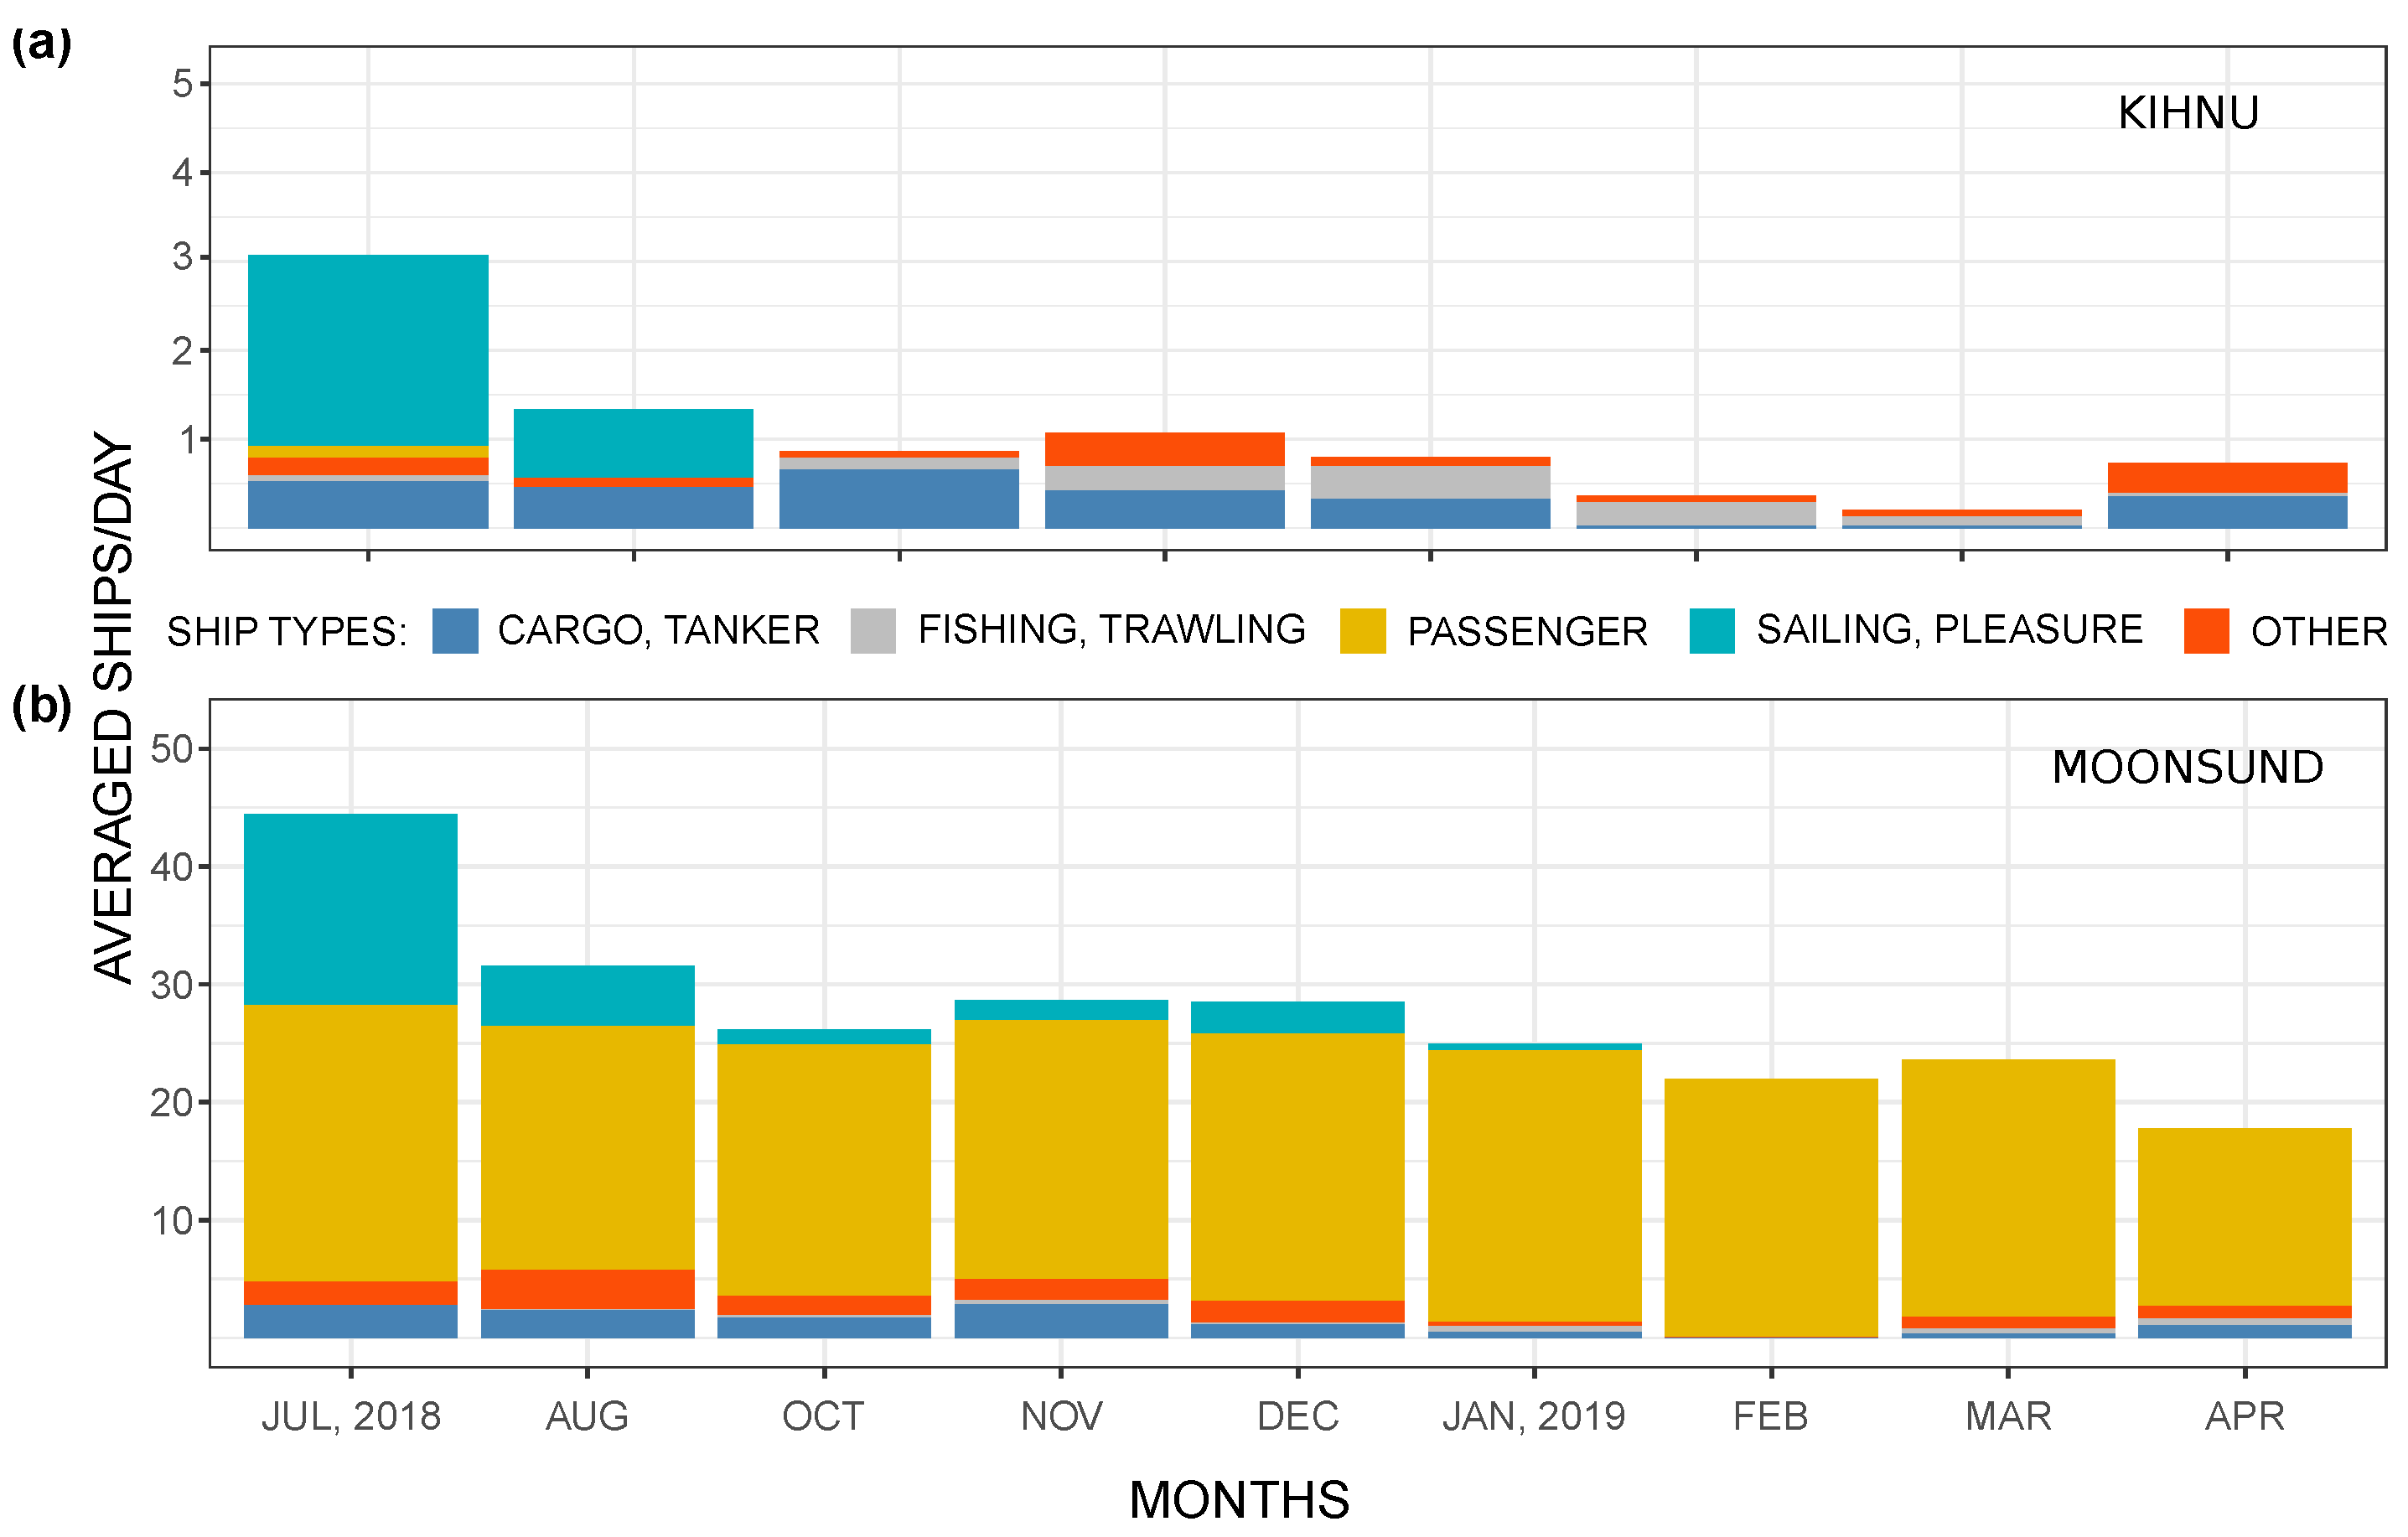
2.4. Ship Traffic Data

For characterisation of the ship traffic, the automatic identification system (AIS) data around the monitoring locations were analysed. Figure 3 depicts the AIS-based average daily number of ships by their types, passing within a 10 km radius from the sound monitoring locations. It can be seen that the overall ship traffic density in Kihnu is very low. In Moonsund, most of the distant ship traffic is caused by the ferry line. Pleasure boats appear mostly in the summer season, and their number is likely to be underestimated since not all of them are equipped with AIS transceivers. In some cases, the noise emissions from pleasure boats can dominate the soundscape in the coastal waters [32], and therefore, their contribution should be properly addressed.
To assess the factual contribution of shipborne noise, acoustic detection was used. As the ship approaches, the ambient sound level increases, and its excess over the background noise level can be calculated by assuming that the running minimum of broadband (10 Hz–1 kHz) received level (RL) is a reasonably good proxy for the background noise [33]. In this study, the window for the running minimum was set to 3 h. The detection threshold was 3 dB for low sea states (under the ice in the wintertime) and 6 dB for other seasons.

3. Results

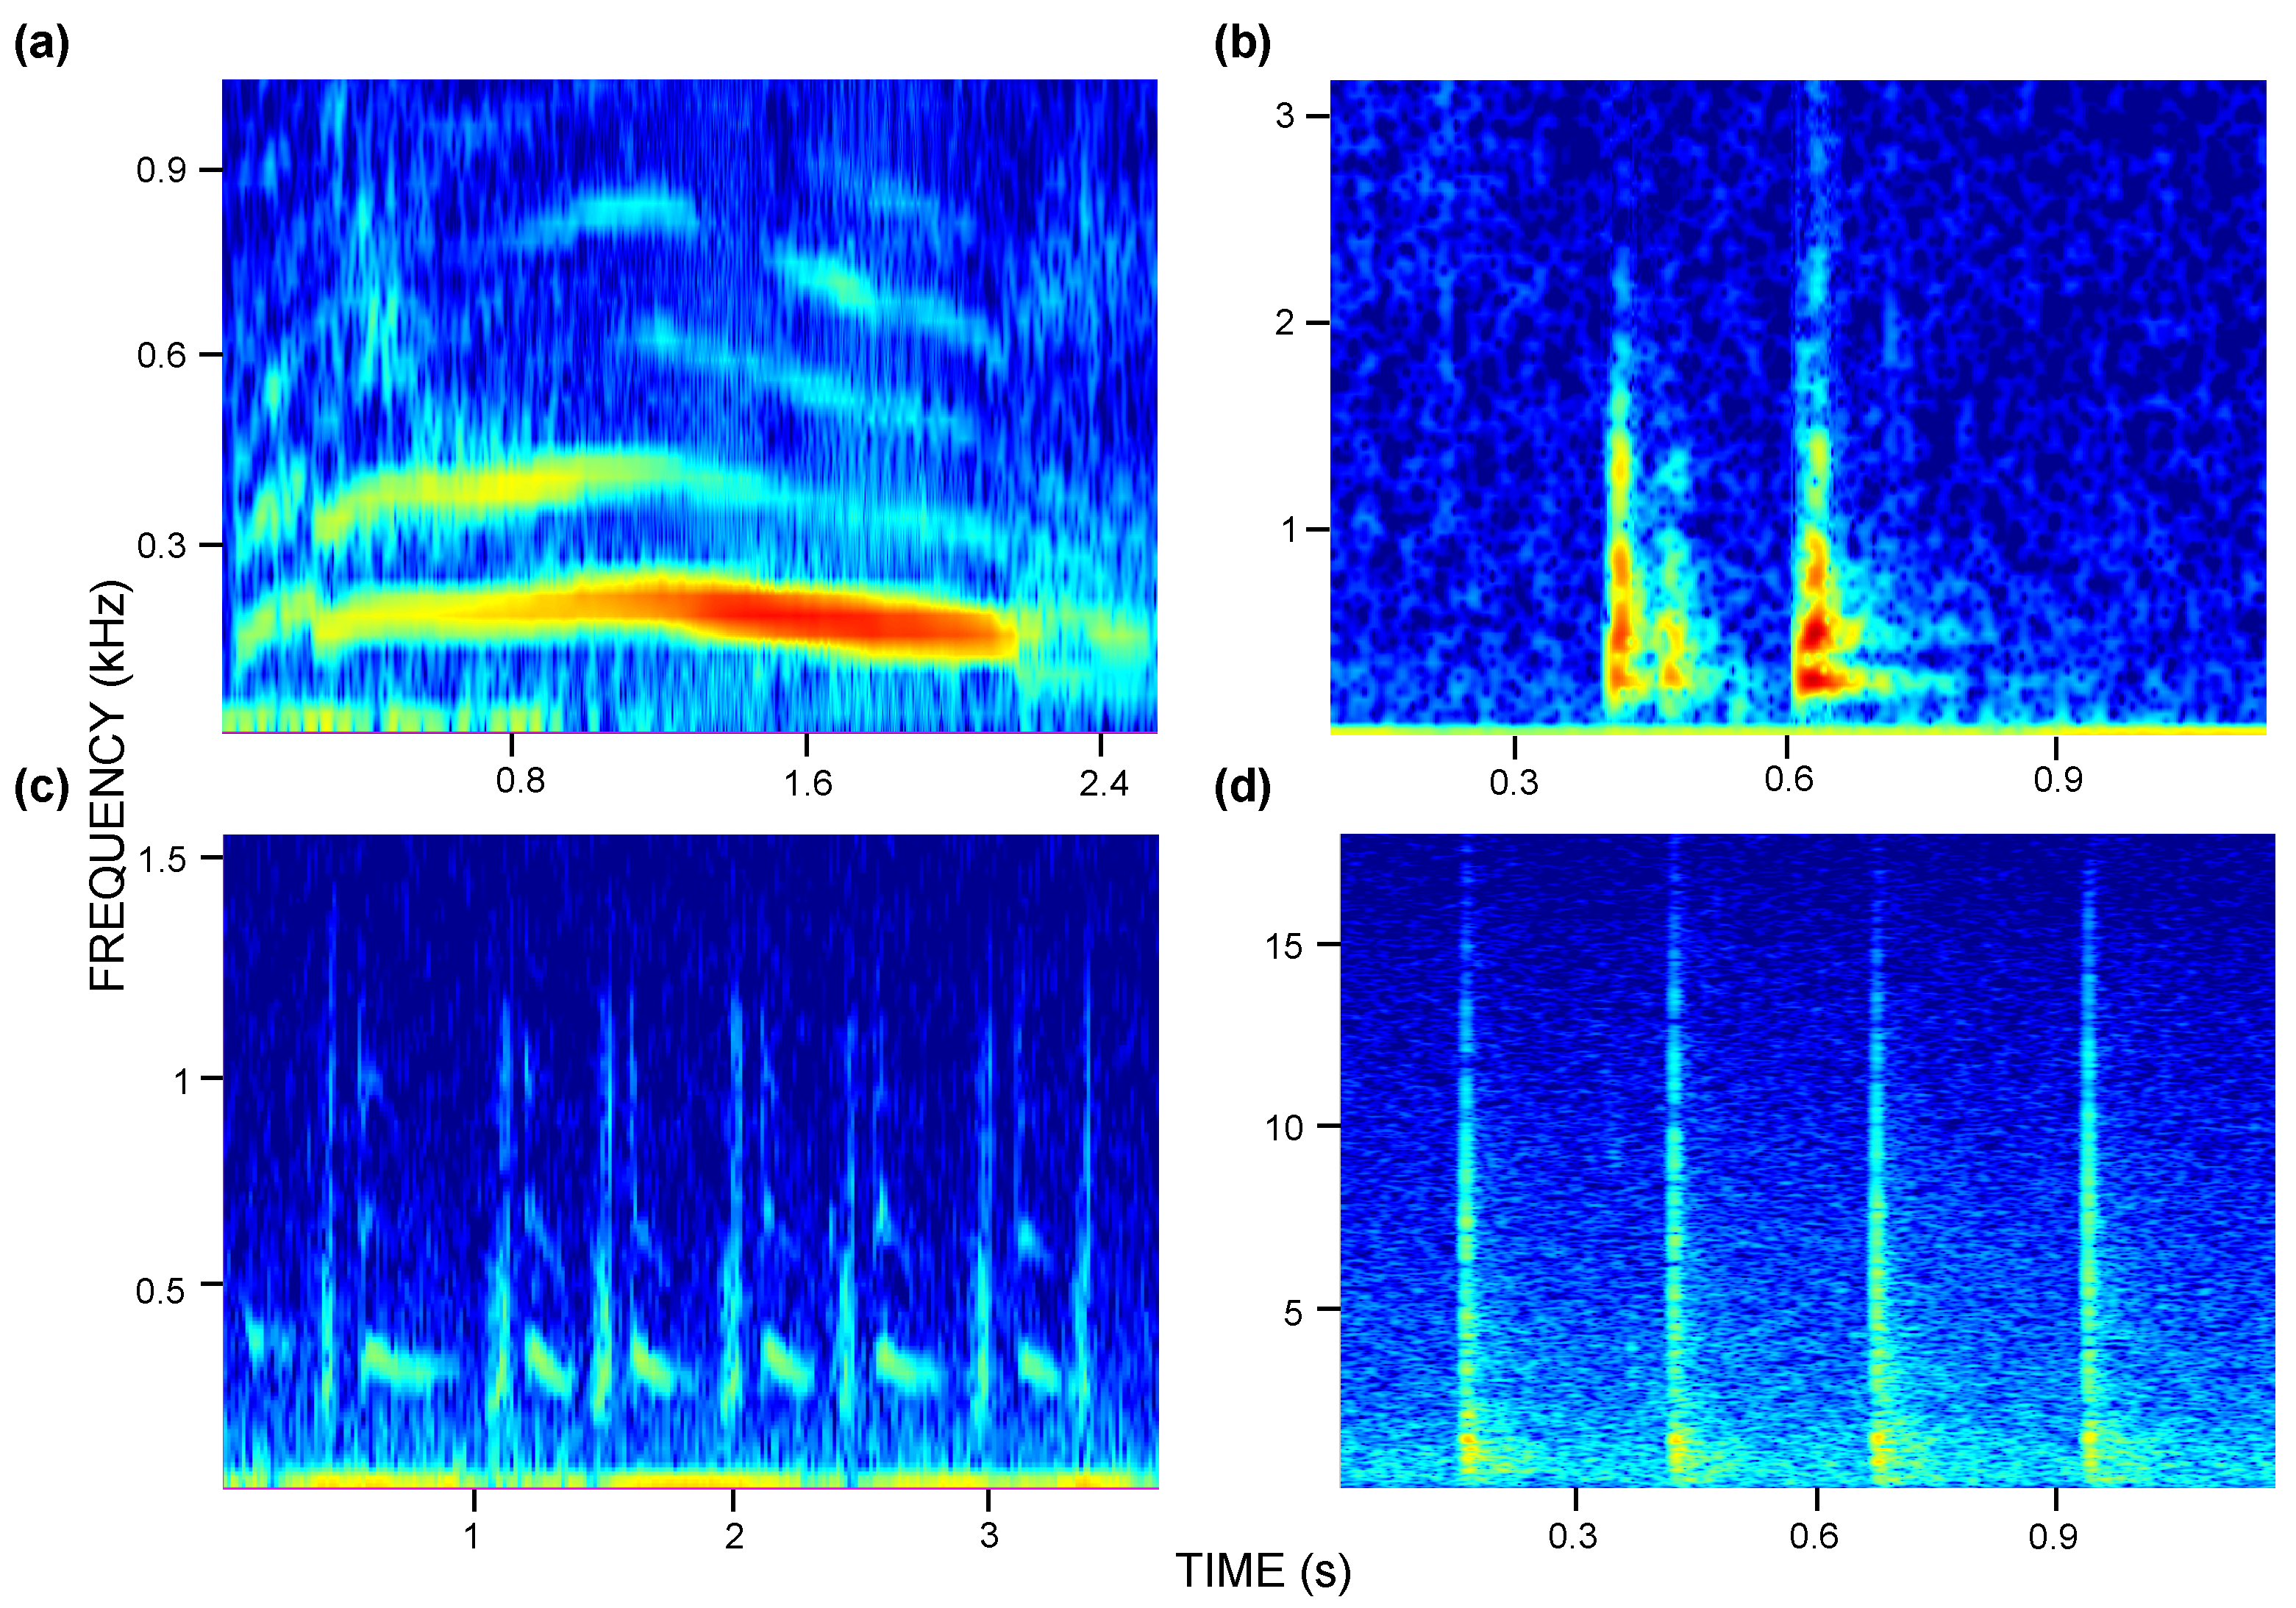
3.1. Biological Sound Detection

Out of the two monitoring locations, recordings from Kihnu were very rich in biological sounds. During the monitoring period, around 37,000 seal calls were detected in Kihnu. In contrast, Moonsund recordings contained fewer biological sounds, having only around 1400 detected seal calls. Although the seal’s vocal repertoire is quite rich, we have focused only on the most frequent call types. Thus, the moan, guttural rup (rup) and guttural rupe (rupe) were taken into account for the grey seal and bark and yelp for the ringed seal.

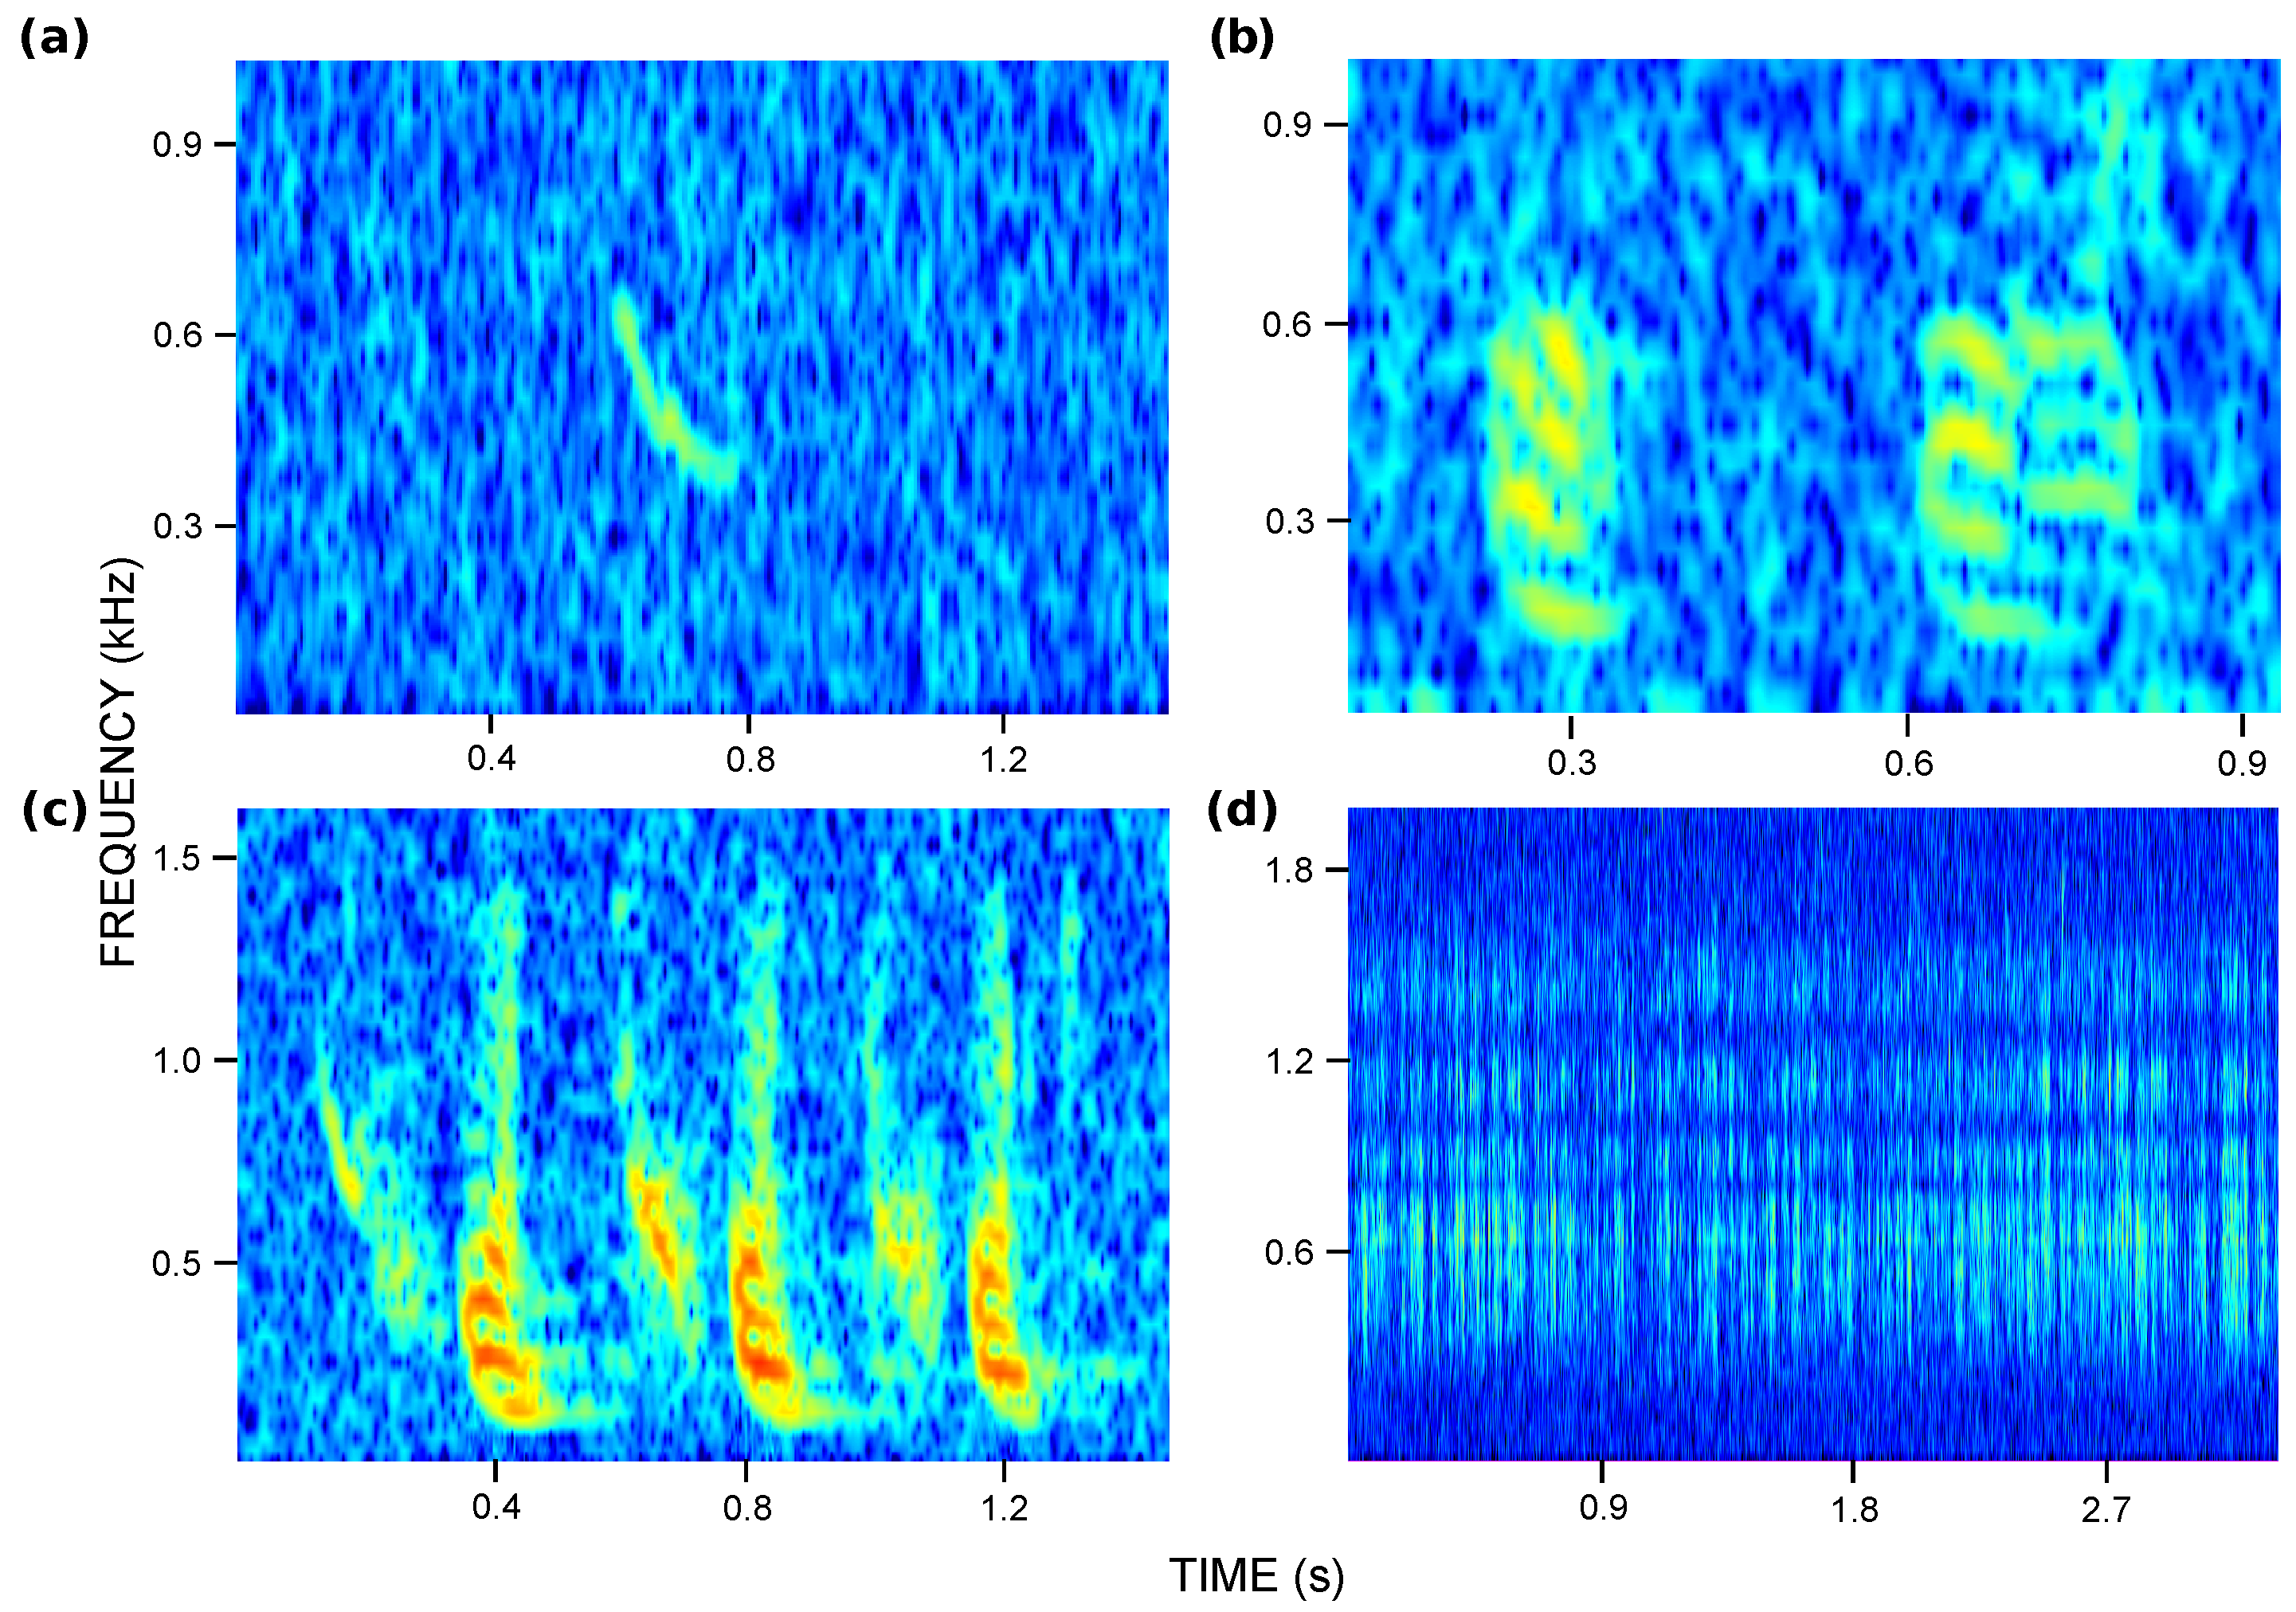
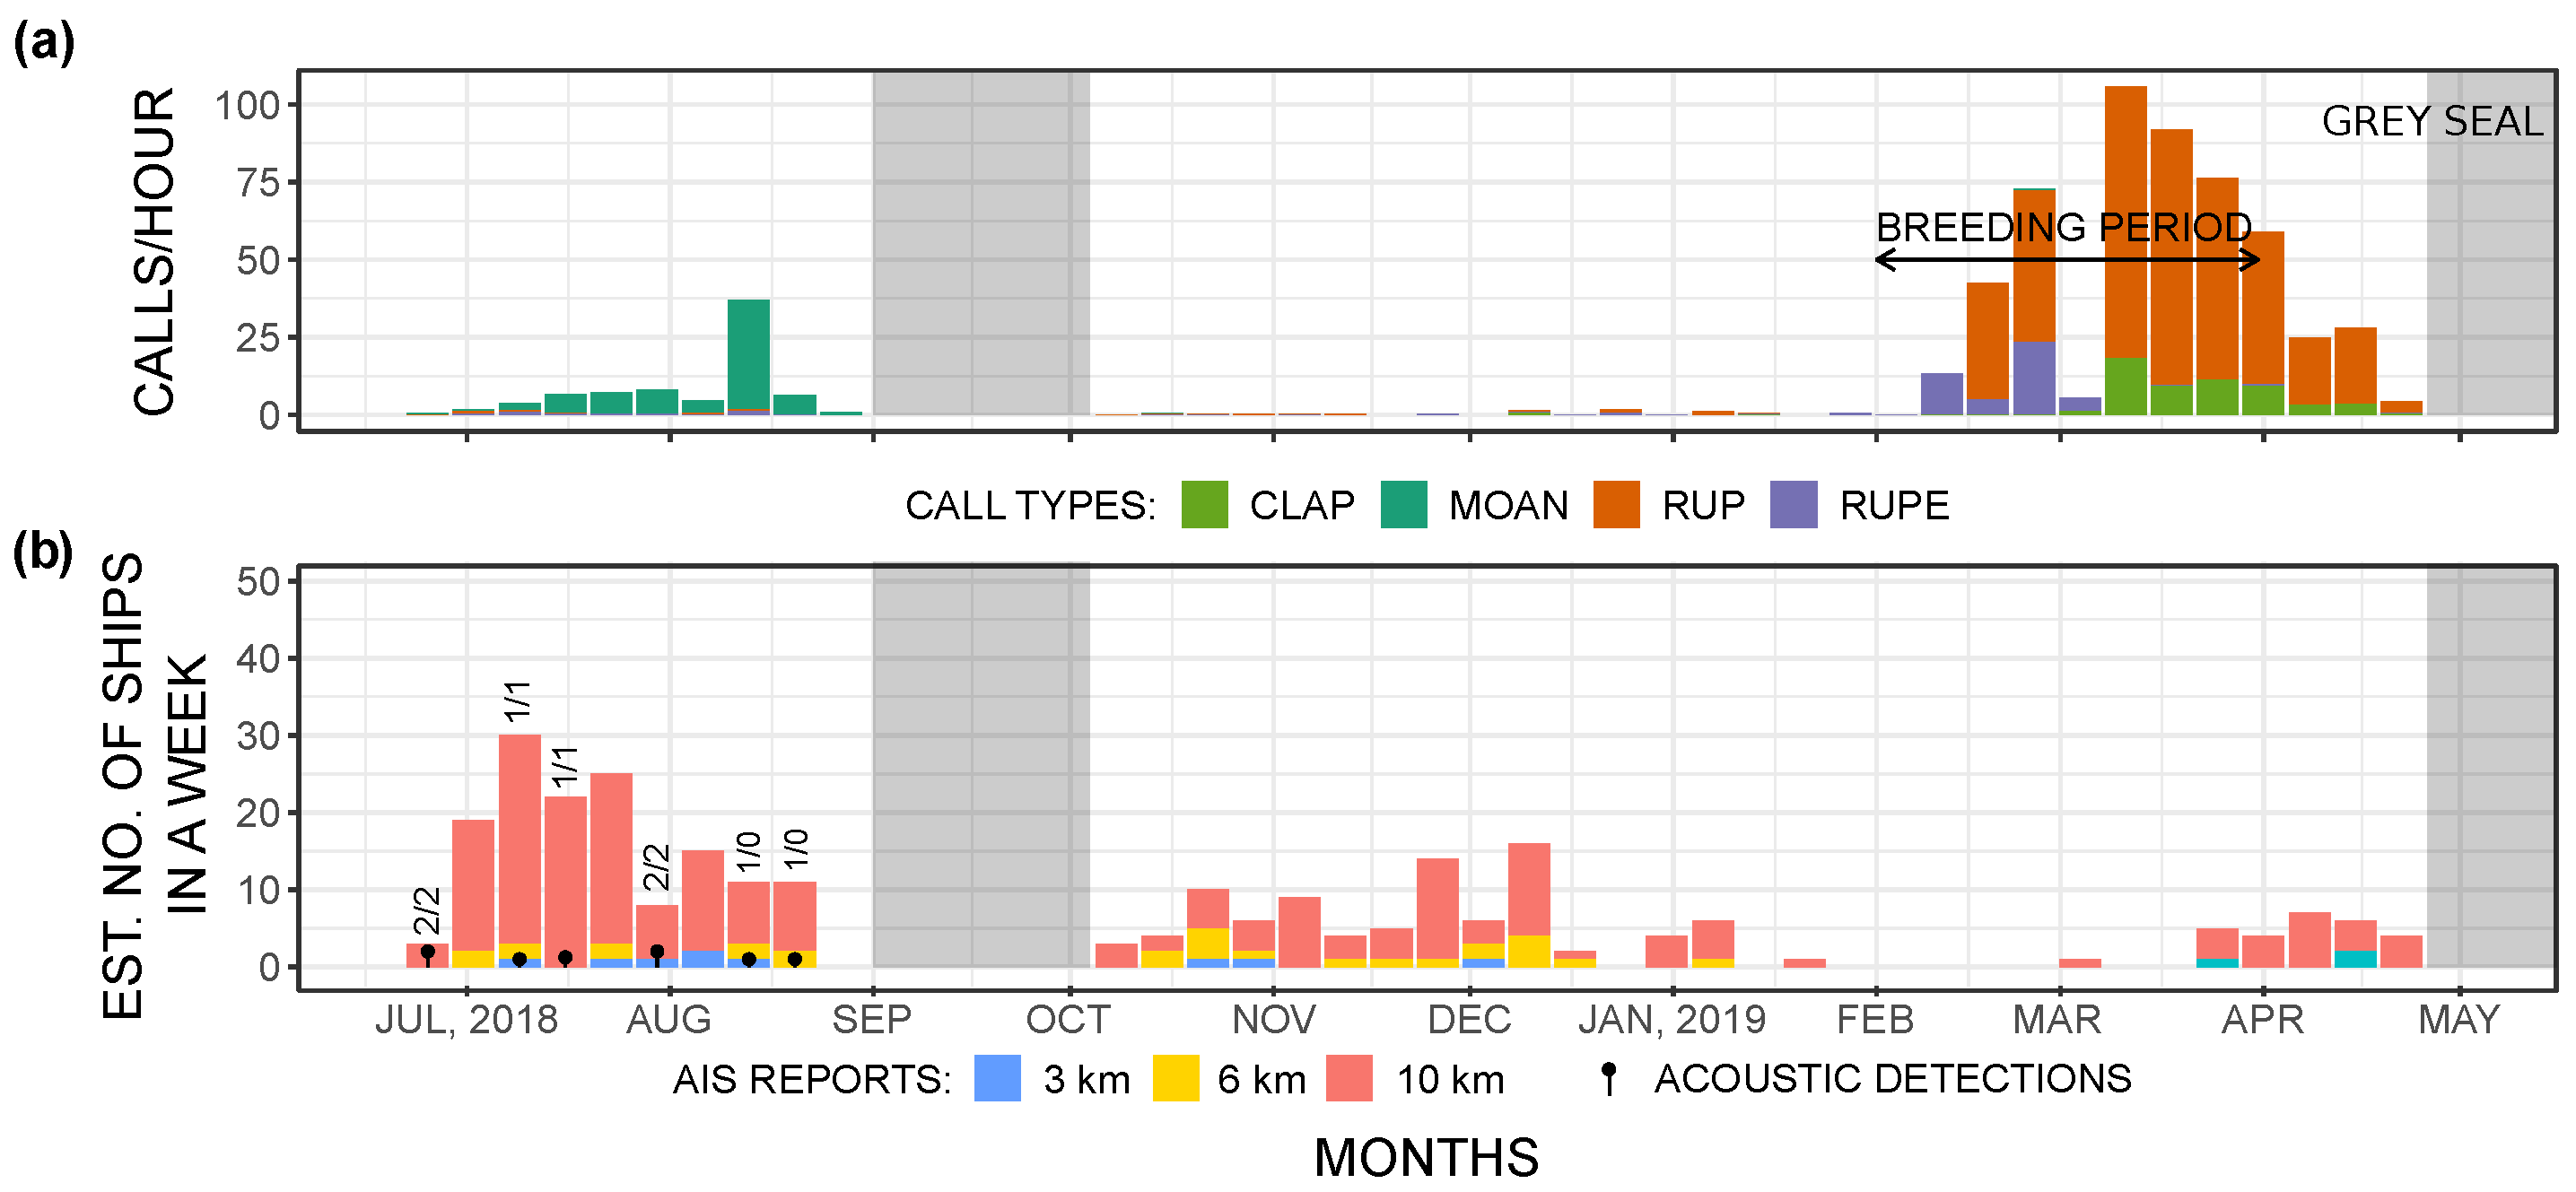
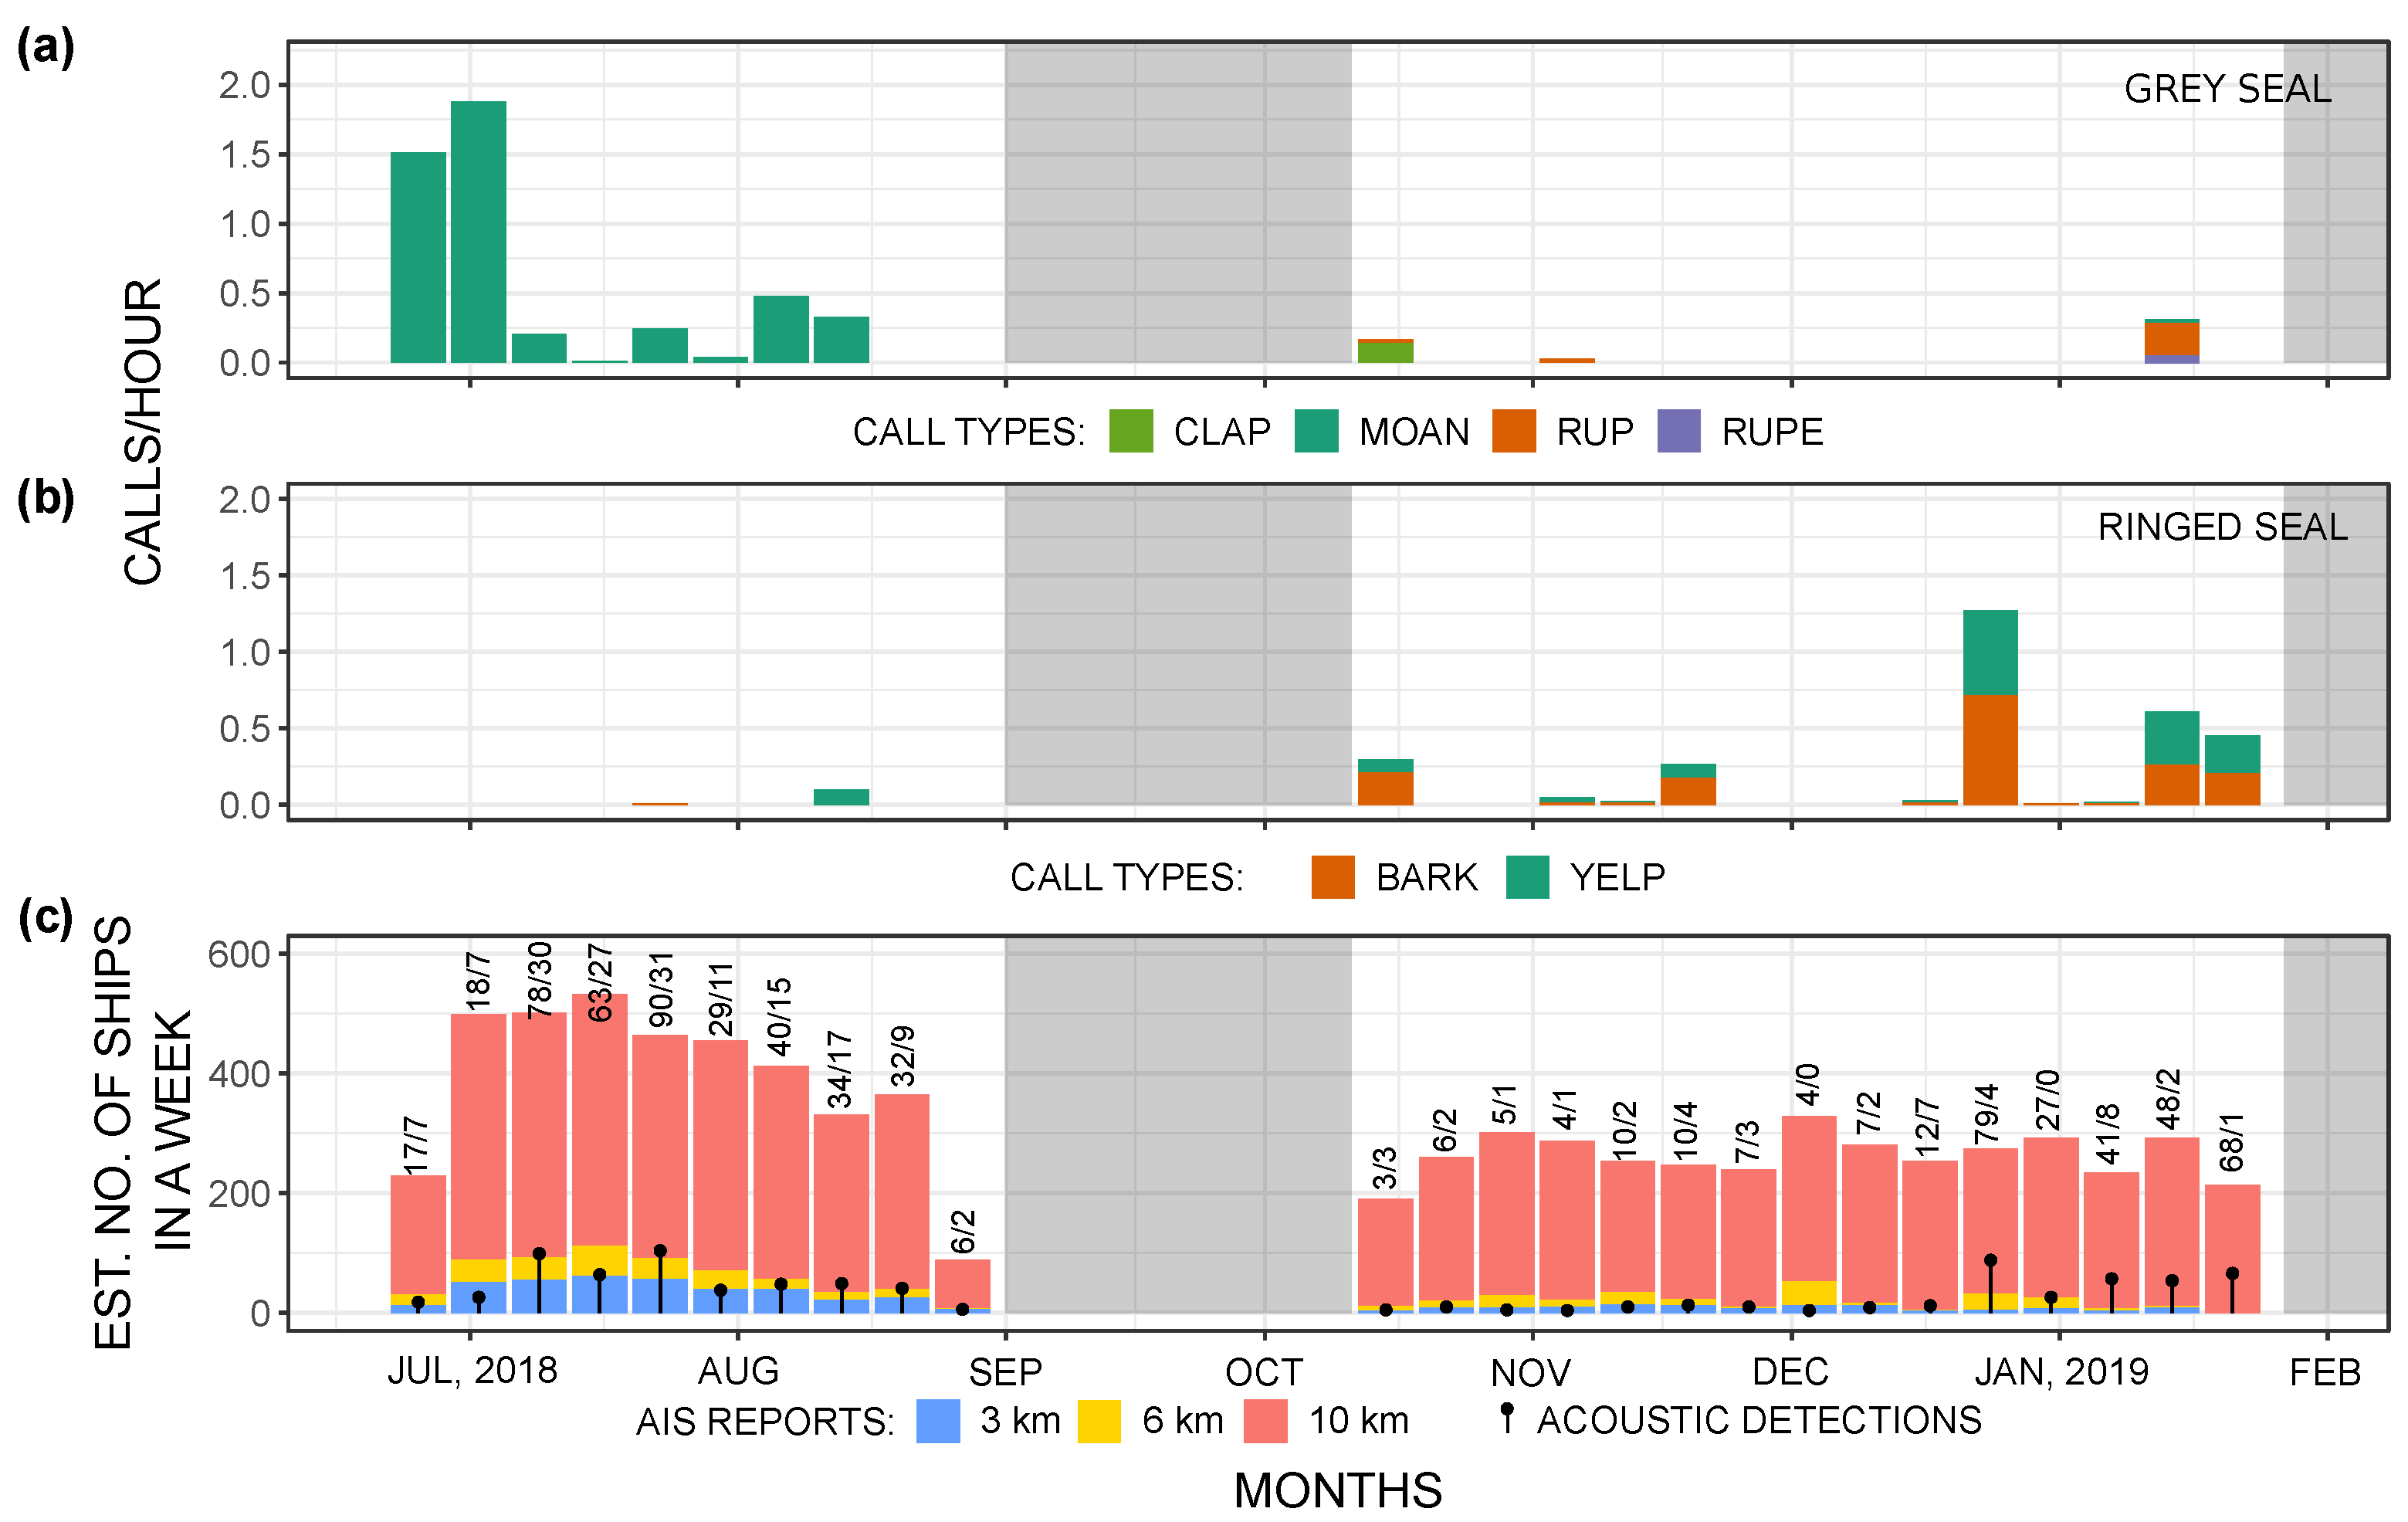
3.1.1. Grey Seal Vocalisations

The most frequently detected grey seal call was the rup, making up 41% of all the grey seal call detections. This was followed by the moan at 32%, the rupe at 25%, and the percussive signalling (clap) at 2%. Almost all of the grey seal calls (98%) were detected in the recordings from Kihnu.
Figure 4 shows the spectrograms of the recorded grey seal calls. The moan (Figure 4a) is a low-frequency call that can last up to a few seconds. The rup (Figure 4b) is characterised by a sharp upsweep that lasts for less than 0.5 s. Most of the detected rups appeared in pairs. The rupe (Figure 4c) has a sharp upsweep similar to the rup that is followed by a longer-lasting downsweep. The rupe call sounded similar to the bark and yelp type calls of the ringed seal. Additionally, a recent article [34] described the behaviour of the grey seals where they used percussive signalling by repeatedly clapping their forelimbs. These clap sounds were also detected in our recordings and are shown in Figure 4d.

3.1.2. Ringed Seal Vocalisations

Ringed seals are known to vocalise less frequently than their grey counterparts [18,19]. Around 600 ringed seal calls were detected, mostly in the Moonsund site. Ringed seal yelps and barks were detected in almost equal proportions.
Spectrograms of the yelps and barks are shown in Figure 5. The yelp (Figure 5a) is a sweeping tonal sound at 500–600 Hz that lacks harmonics. By contrast, the bark sound (Figure 5b,c) has a lower frequency range and contains several harmonics. In addition, scratching sounds that were attributed to the digging of breathing holes into the ice are presented in Figure 5d.
The BLED code used in this study has shown a good detection efficiency in the case of the grey seals calls but had less success with the ringed seal calls, probably because of their lower signal-to-noise ratio. The performance evaluation of the automatic detections was made by collecting 100 sample recordings of each call type. The performance characteristics of the detector by call type are shown in Table 1. It can be seen that the sensitivity of the detector is higher for calls with a shorter duration such as the rupe and rup. On the other hand, longer-lasting calls such as moans are often undetected presumably because of their highly variable durations and frequency content. As a result [35], the total number of moans is likely to be underestimated in the case of automatic detection. In contrast, the detected number of rup calls is better predicted as their sensitivity for detections reached 70%.

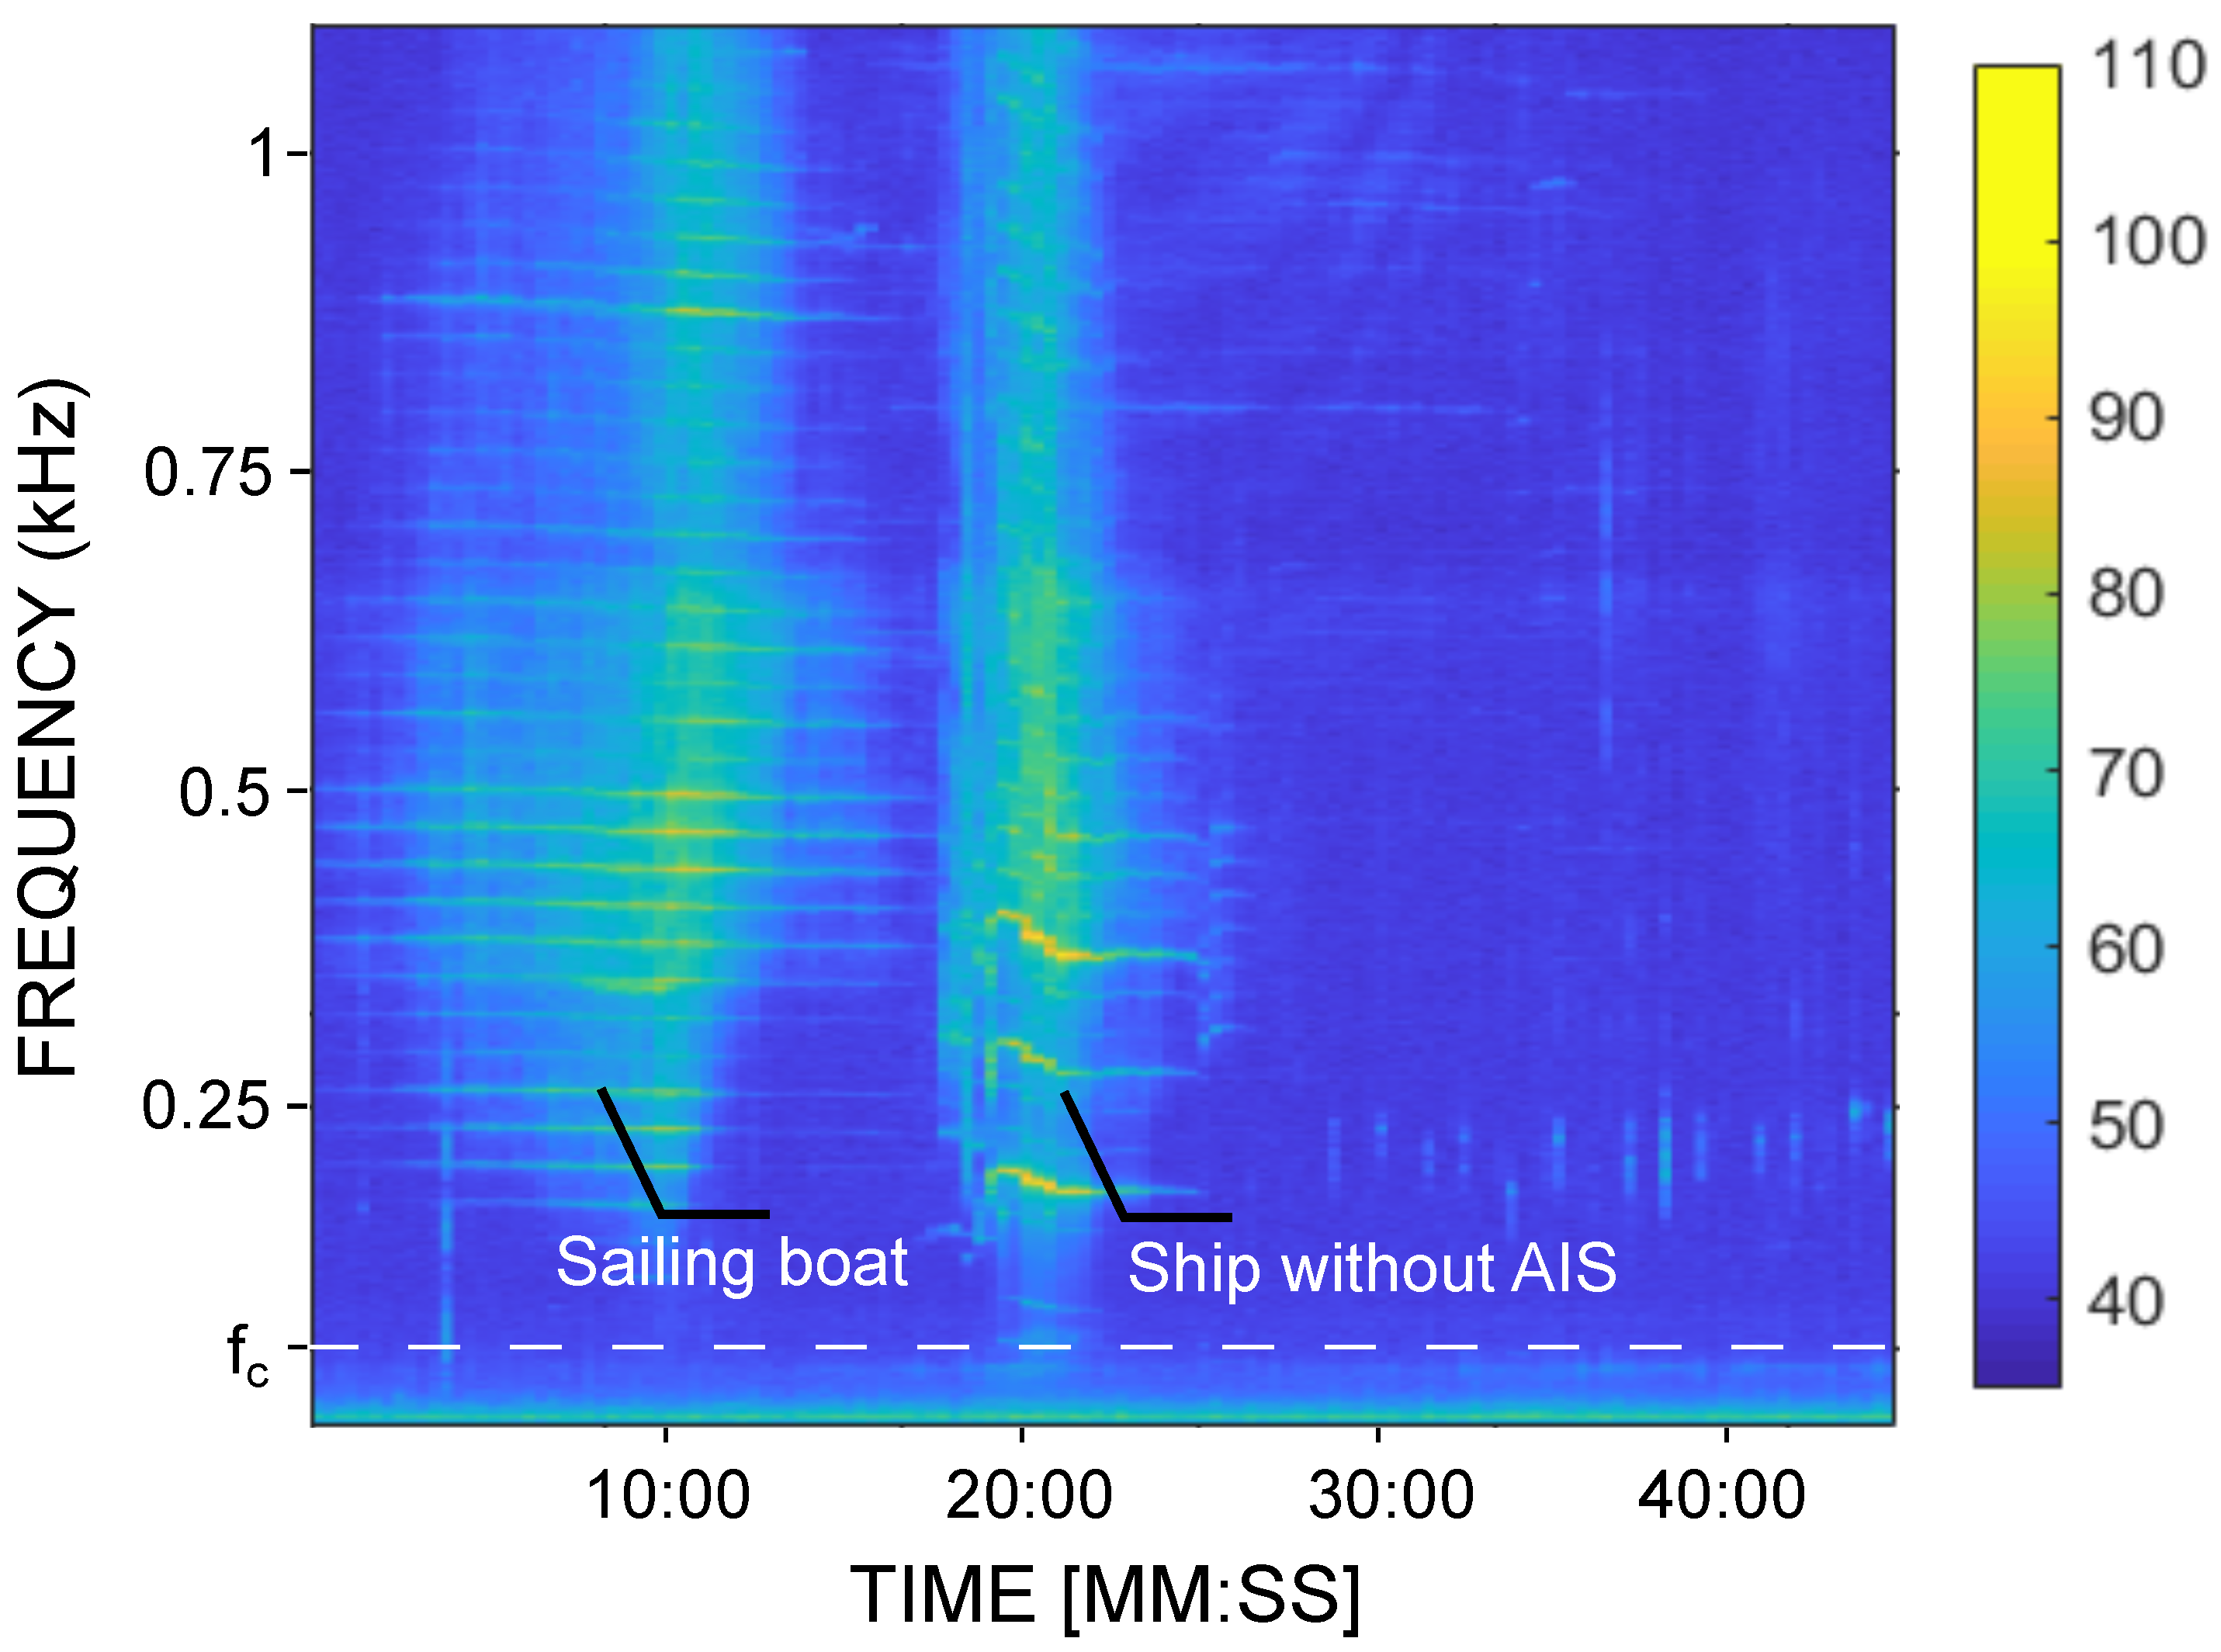
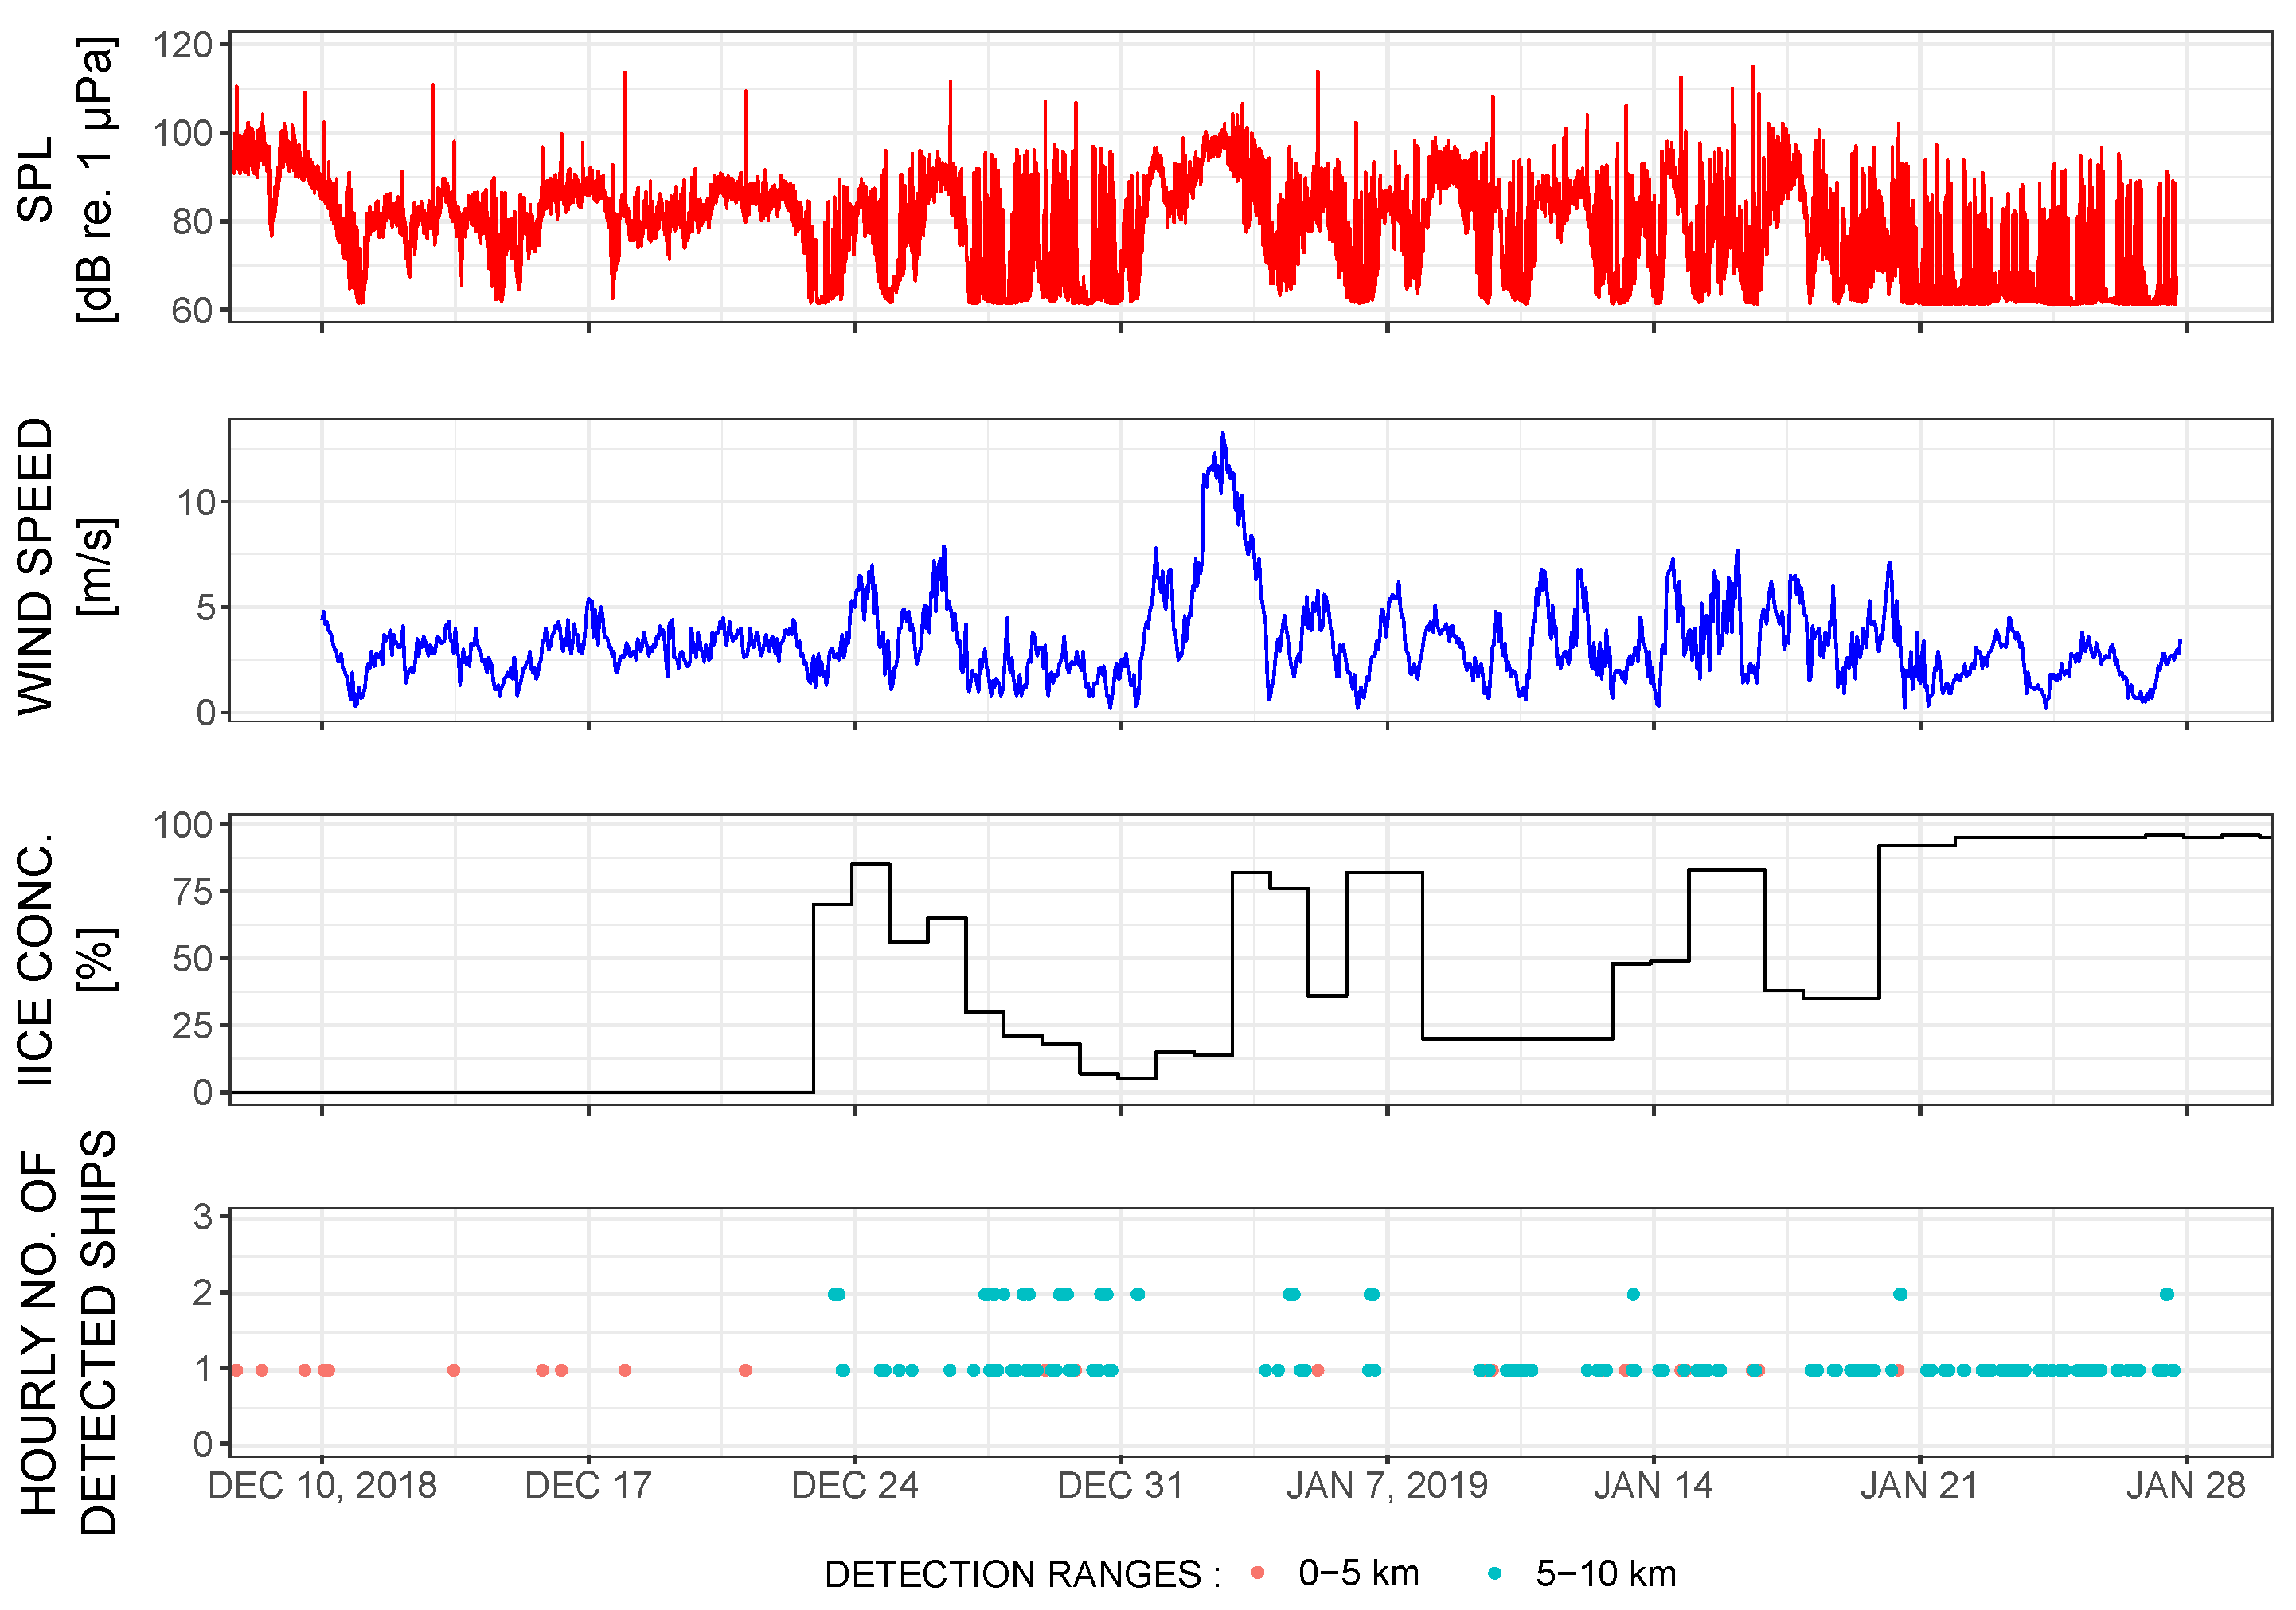
3.2. Ship Traffic Noise

Both monitoring sites are located in a very shallow sea area with a maximum depth of 16 m. The low-frequency cutoff [36], corresponding to the average depth (11 m) in the region, is around 60 Hz. Nevertheless, pleasure boats usually radiate underwater noise at higher frequencies. Therefore, the MSFD indicator frequency bands are not well suited for the assessment of the environmental pressure by anthropogenic sound in these shallow watered monitoring sites. A typical spectrogram of recorded sound from two detected vessels is shown in Figure 6.
To select an indicator frequency for the ship traffic noise in the region, the TOB ambient noise spectra for all time intervals containing ship noise were computed and analysed (Figure 7). It can be seen that the MSFD indicator frequency bands are demonstrating quite low levels. Based on the average spectrum, 500 Hz TOB was selected as a more relevant indicator for the environmental pressure posed by shipborne underwater noise. Although the higher TOBs also show higher levels, they were not chosen as they potentially contain an increasingly significant portion of natural ambient noise.

3.3. Underwater Sound Propagation under the Ice

The alteration from an agitated sea surface to a frozen one changes considerably the underwater soundscape. Under ice cover, the natural ambient sound level lowers considerably. The water temperature and salinity near the sea surface change also, thus creating a positive gradient in the sound speed profile, which in turn causes upward refraction of the sound [37]. As a result, the sound rays from distant shipping interact less with the sea bottom and propagate further due to the smaller propagation loss.
Such favourable sound propagation conditions were observed in the winter period when the detection range of ship noise increased considerably. Obviously, the lower ambient sound levels also improved the signal-to-noise ratio, yet distant shipping was never detected outside the freezing period, even at low sea states.
Figure 8 shows the time series of the ambient sound level (500 Hz TOB), the wind speed, the ice concentration, and the number of acoustic ship detections. The sound pressure level (SPL) shows a clear correlation with wind speed. It can be seen that a longer range for detection appeared with the formation of the ice cover. The longest detection range attained was 10 km when the ice concentration was 82%, and wind speed was 2.7 m/s. Furthermore, a gap in long-range detections can be seen during periods of strong winds.

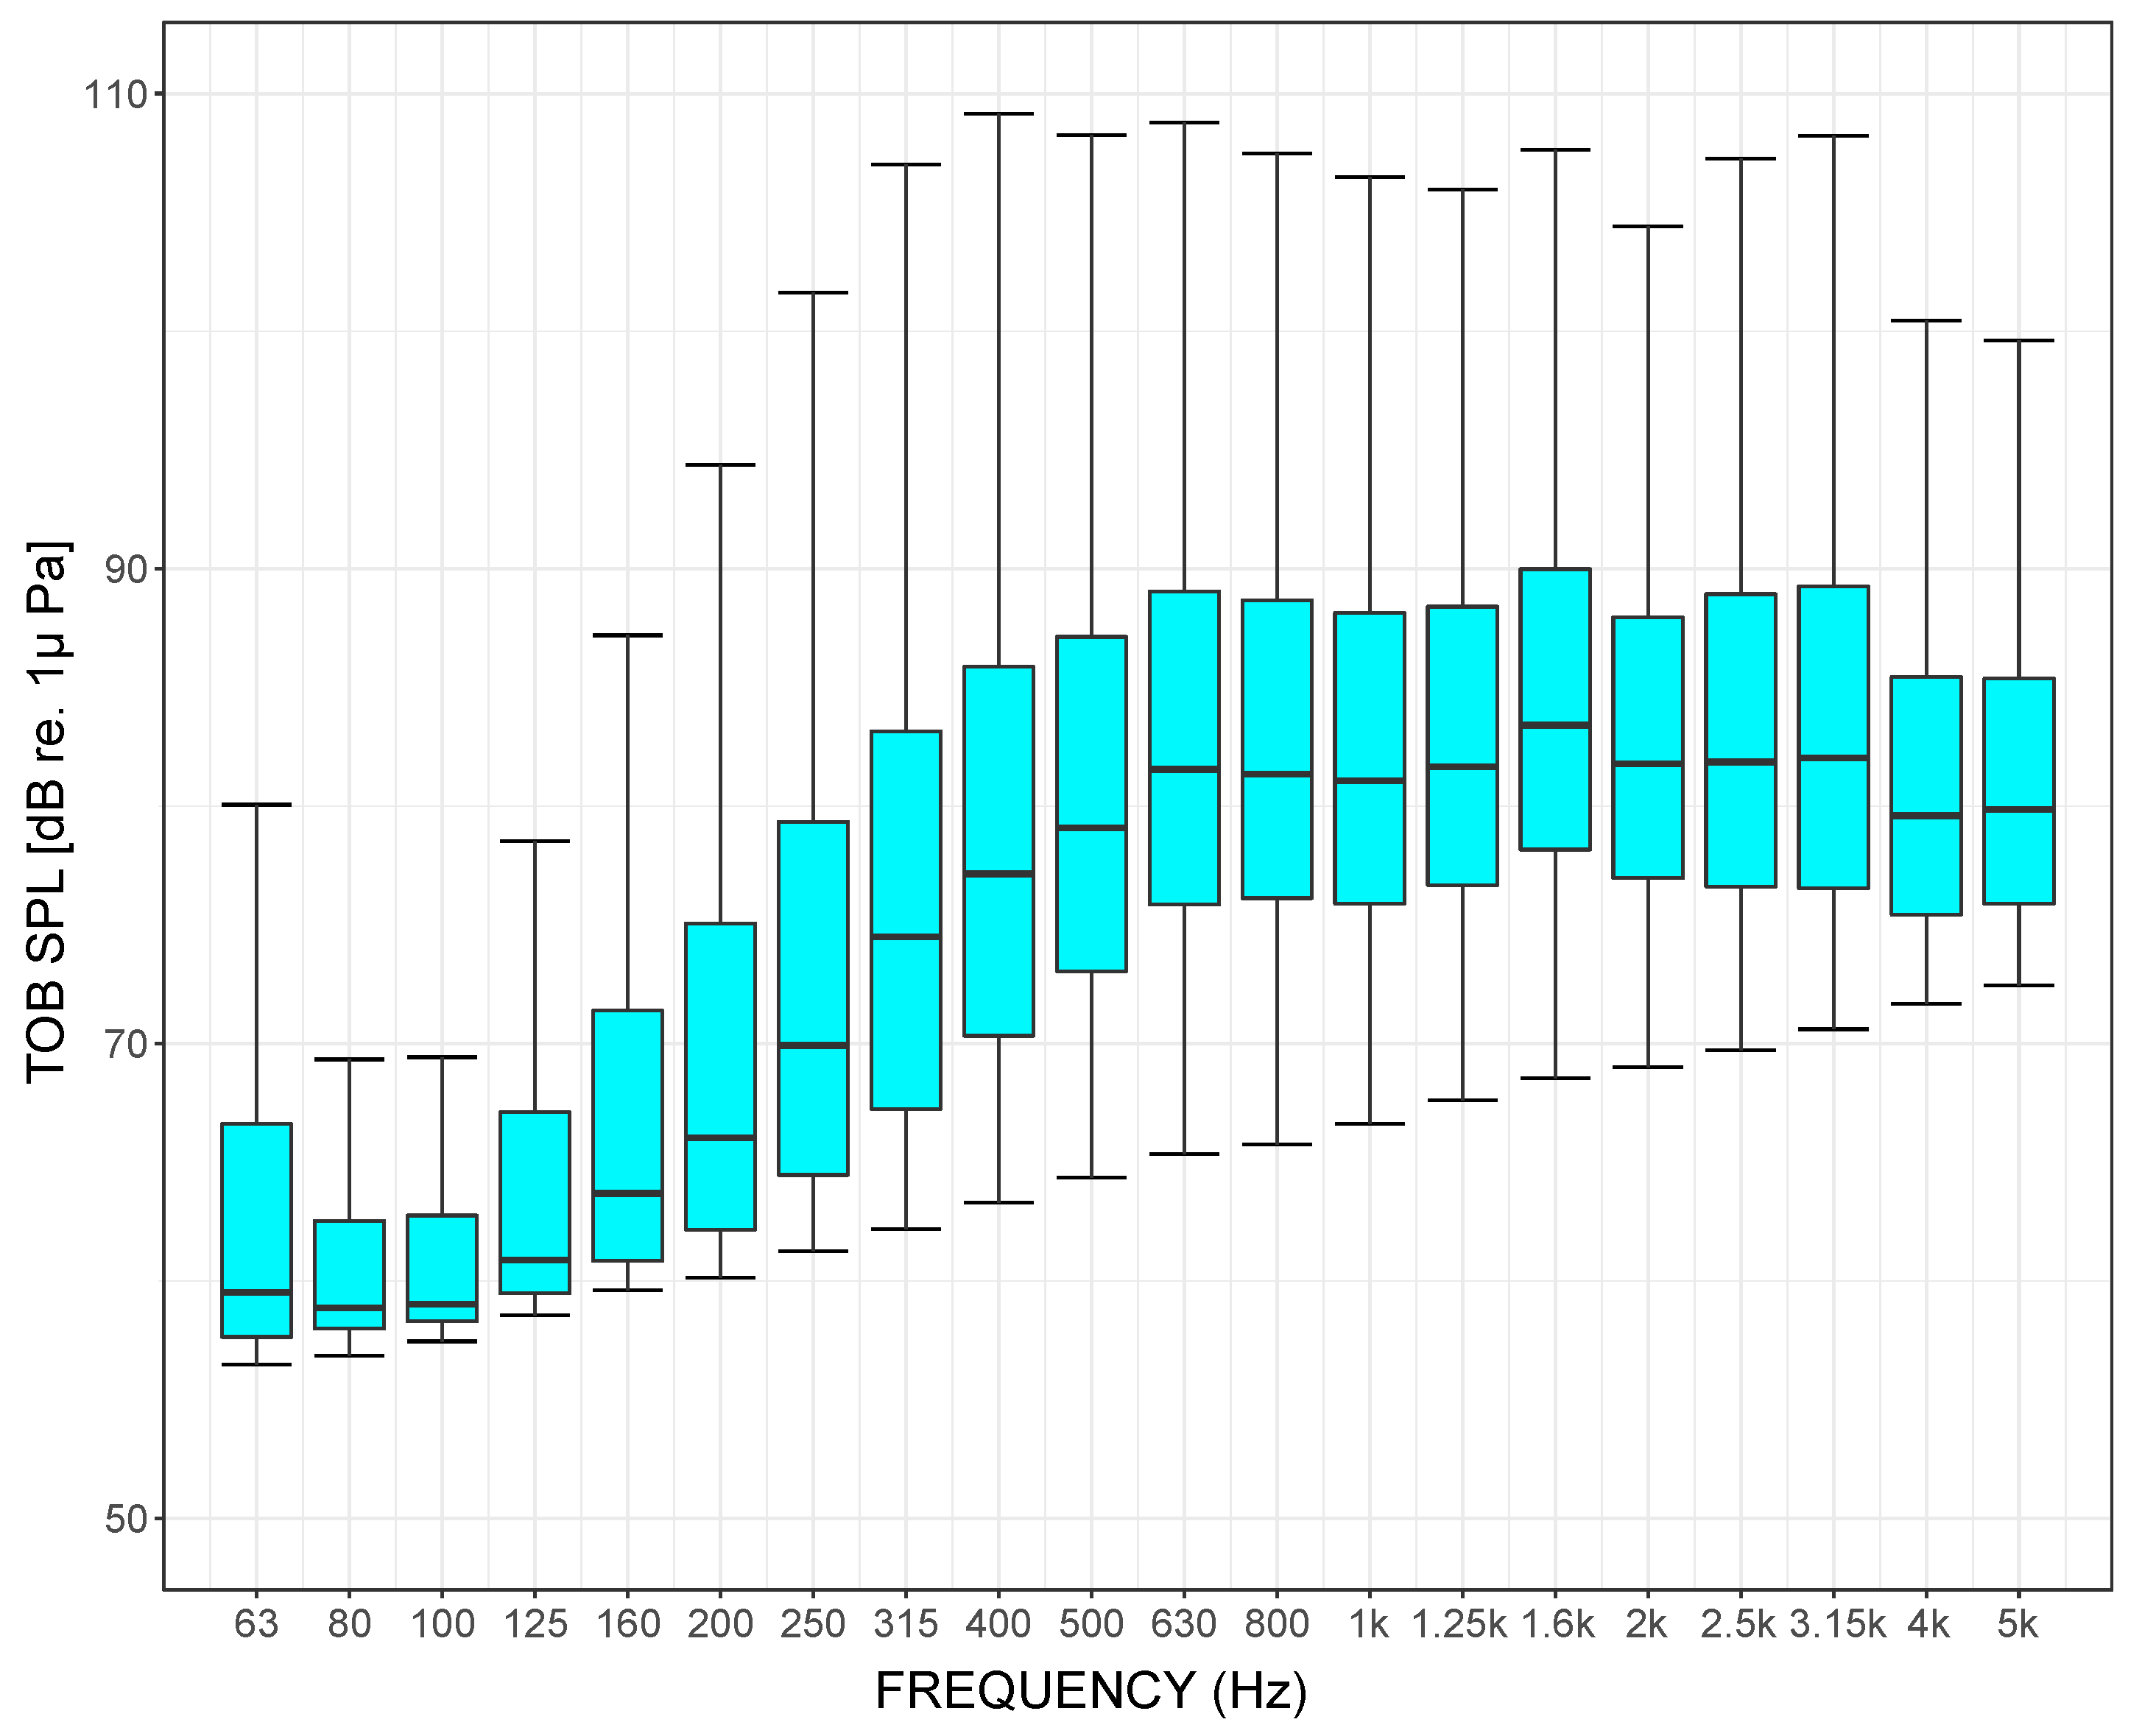
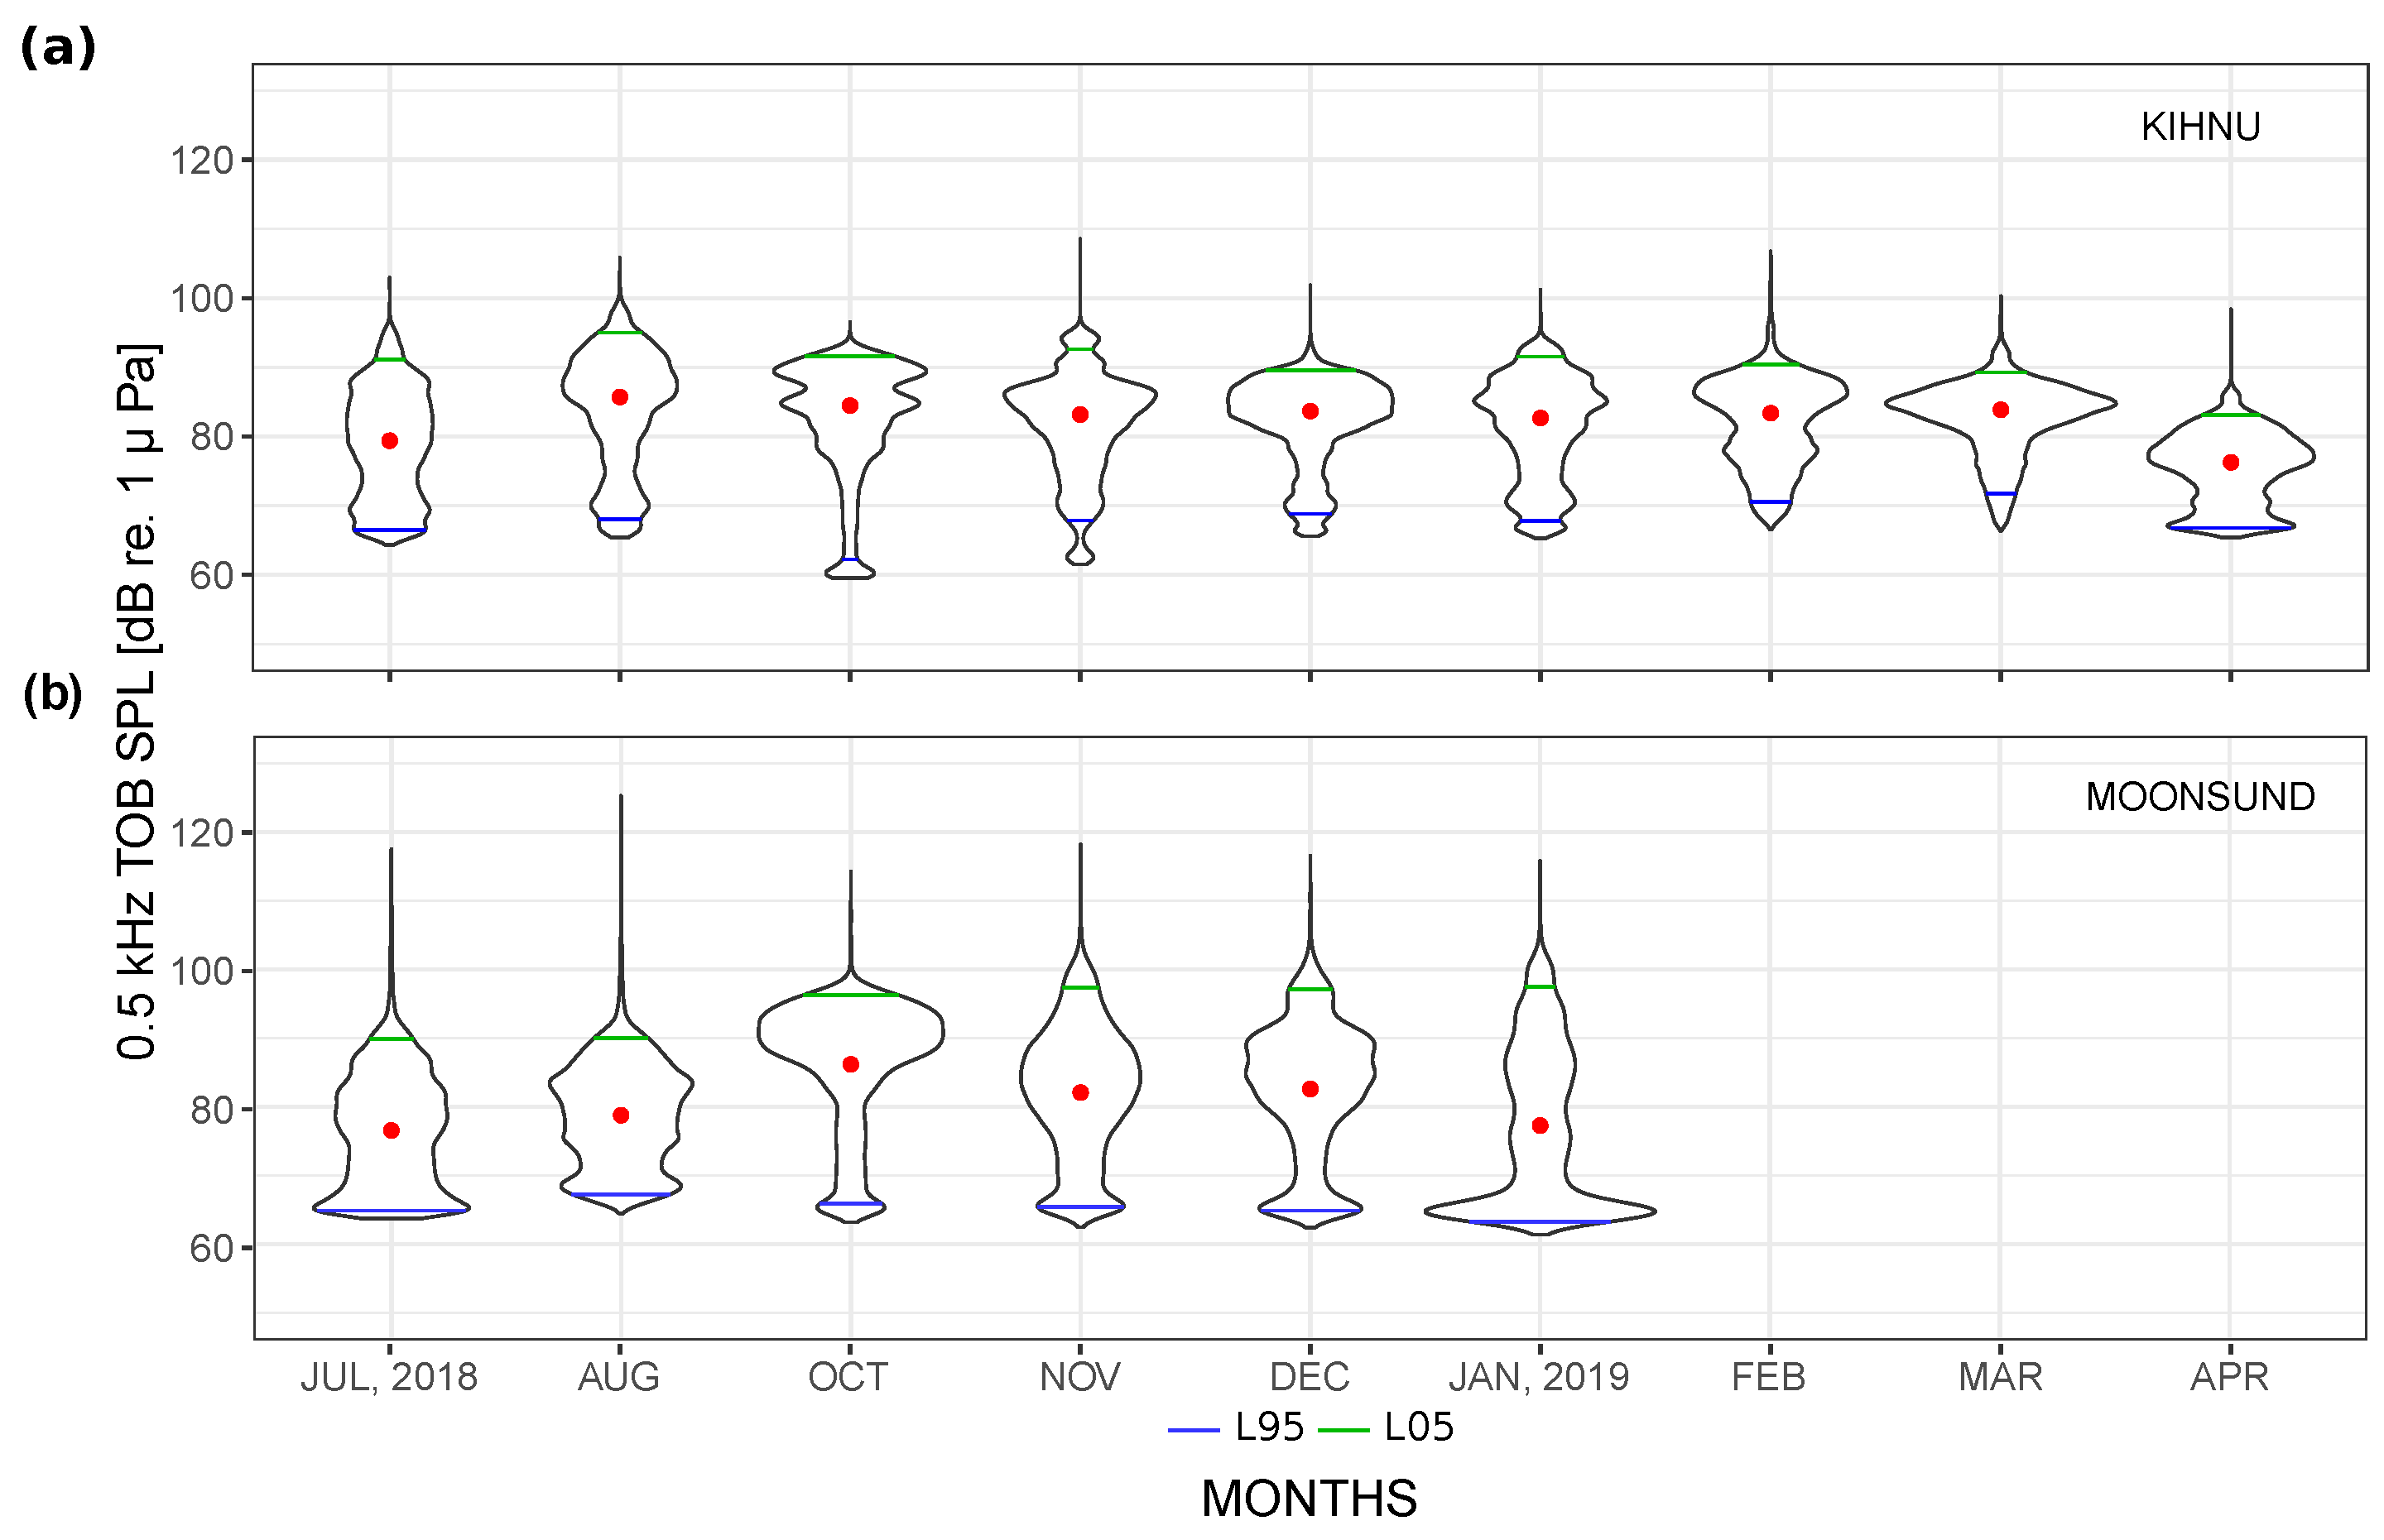
3.4. Ambient Sound Analysis

An overview of the ambient sound levels in both monitoring locations is presented in Figure 9 as monthly estimated probability density functions (PDF) in the 500 Hz TOB. For each violin plot, the surface area equals unity, and the abscissa of the plot shows the relative likelihood of the occurrence of every SPL value displayed on the vertical axis. The key statistical measures of the arithmetic mean and the exceedance levels L95 and L05 are also shown in the violin plots.
Figure 9a presents the monthly estimated PDF of the SPLs recorded in the Kihnu location. The monthly arithmetic means vary from 75 dB in April to 84 dB in August. Most of the monthly PDFs were negatively skewed, which was an indication of natural sound domination [4].
The monthly PDFs of the SPLs from the Moonsund location (Figure 9b) have lower mean values but higher exceedance levels of L05 corresponding to louder and less frequently occurring events that can be caused, for example, by close passing ships. According to the PDFs, the anthropogenic sound was not dominant in the Moonsund location. However, it was more prevalent than in Kihnu (Figure 9a). In January, PDF was particularly skewed so that the mode of the levels was only slightly above the self-noise level of the recorder. Such low levels were due to the presence of ice, which is known to drastically decrease the agitation of the sea surface.

3.5. Analysis of Co-Occurrence of Ship Traffic Noise and Pinniped Calls

Next, the focus was on the time intervals with overlapping anthropogenic noise and pinniped calls, in order to evaluate the risk of masking the pinnipeds’ communication. For the ship traffic, the AIS data, along with the acoustic detection, were used. Comparisons of the hourly detection rates of pinniped calls and the estimated number of ships in a week are depicted in Figure 10 and Figure 11.

3.5.1. Kihnu Monitoring Location

As shown in Figure 10a, in the Kihnu monitoring location, two periods of major biological activity can be observed. During the summer months, the most frequent call type was the moan of the grey seal (Section 3.1). Starting from February, there were numerous detections of the rupe, rup, and forelimb claps. The peak grey seal call detection rate reached 106 calls per hour in March. This drastic increase of detection rates happened during their main mating period, which starts in February and lasts until March [38]. Based on the rates, it can be concluded that the Kihnu monitoring location is an important site for both non-breeding and breeding periods of grey seals. In contrast, almost none of the ringed seal calls were detected in this location.
The Kihnu location has very sparse ship traffic, with only some pleasure and fishing boats each day that appear mainly during the summer months (Figure 10b). Thus, the co-occurrence of biological and anthropogenic sound in this location was extremely rare and, with regard to continuous anthropogenic sound, it can be stated that the Kihnu MPA has a good environmental status.

3.5.2. Moonsund Monitoring Location

In Moonsund, both ringed and grey seal calls were detected but at much lower rates. Similar to the Kihnu location, the moan of grey seals was the most frequent of the call types in the summer period (Figure 11a). The detection of ringed seals’ vocalisation was rare and was mainly found in recordings from the winter period (Figure 11b). It should be noted that the monitoring did not cover the mating periods of the ringed (February or March) [39] and grey seals.
The bar chart in Figure 11c presents the AIS-based number of ships, and the lollipop chart shows the number of acoustic detections. Over 700 ship passages were revealed by the acoustic detection during the whole monitoring period. As expected, the summer months were the busiest, with more than 400 detections. Around one-third of them were ships without AIS. The number of ships drastically decreased during the autumn, resulting in 44 recorded events only. The number of detections started to increase in the winter and specifically during the freezing periods, with weekly detections being constantly above 40 ships in the last three weeks of monitoring. According to the high rates of ringed seal calls and ship traffic (Figure 11b,c), co-occurrences between them were likely to happen.

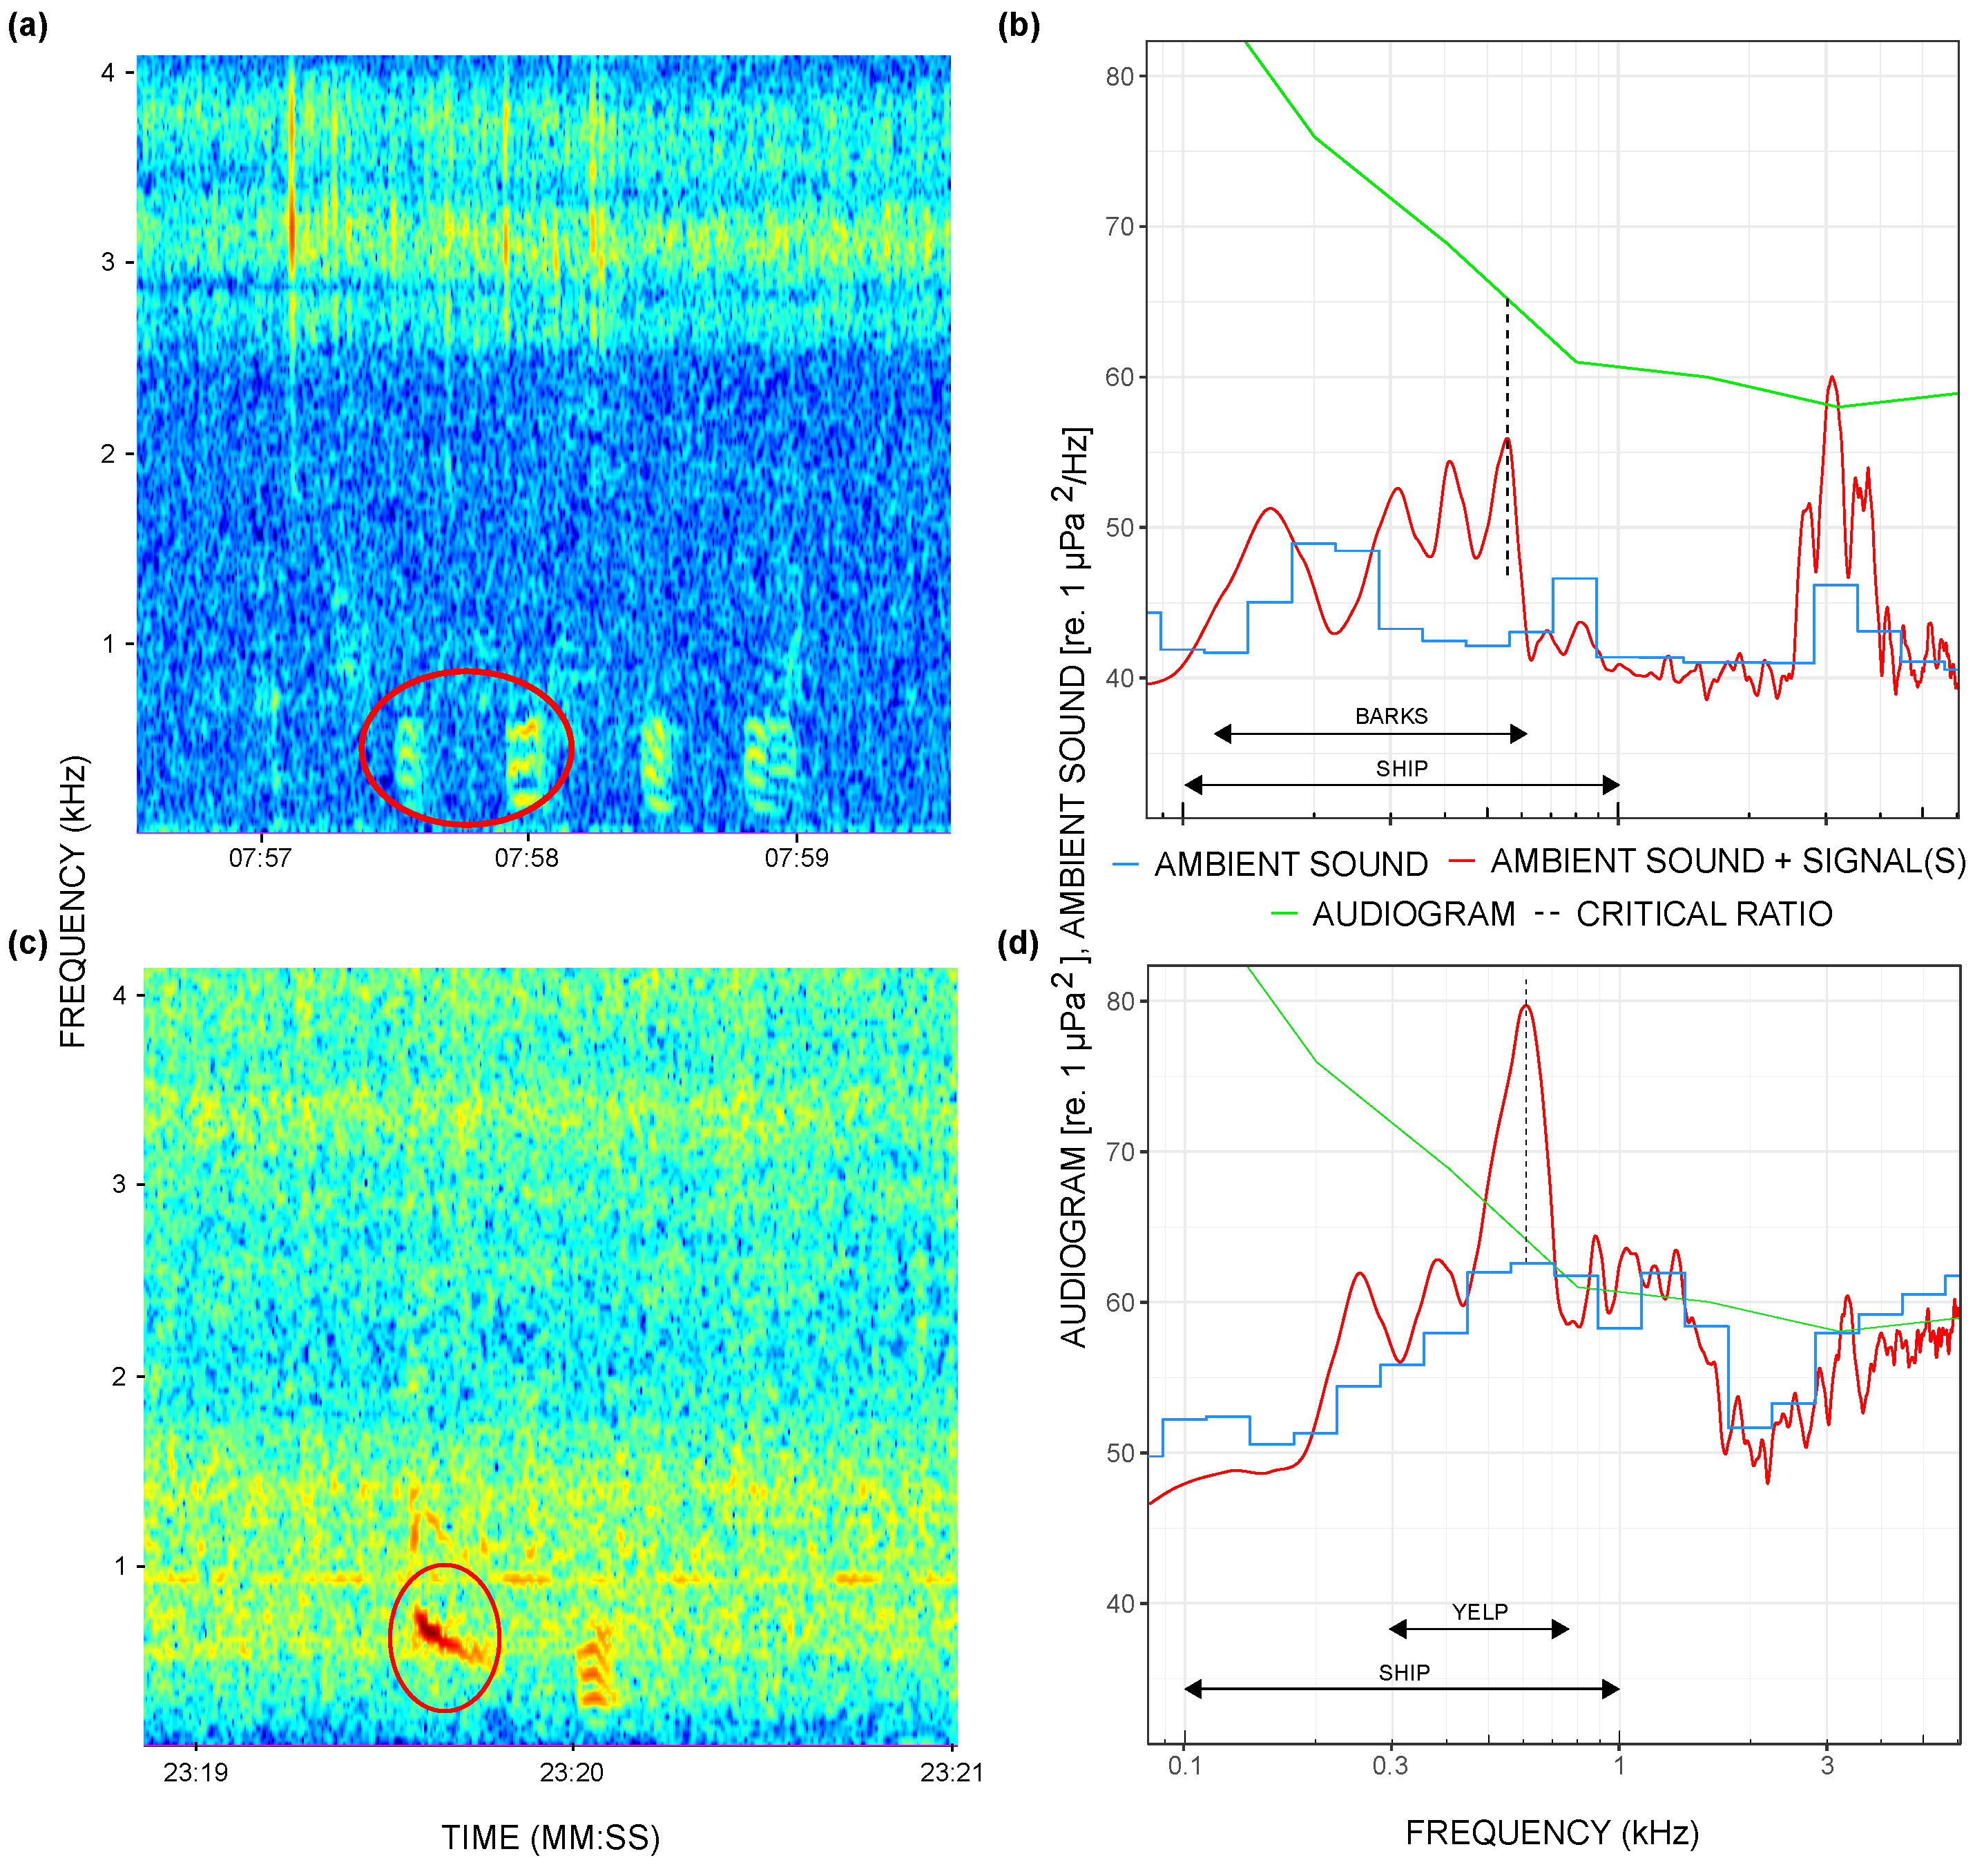
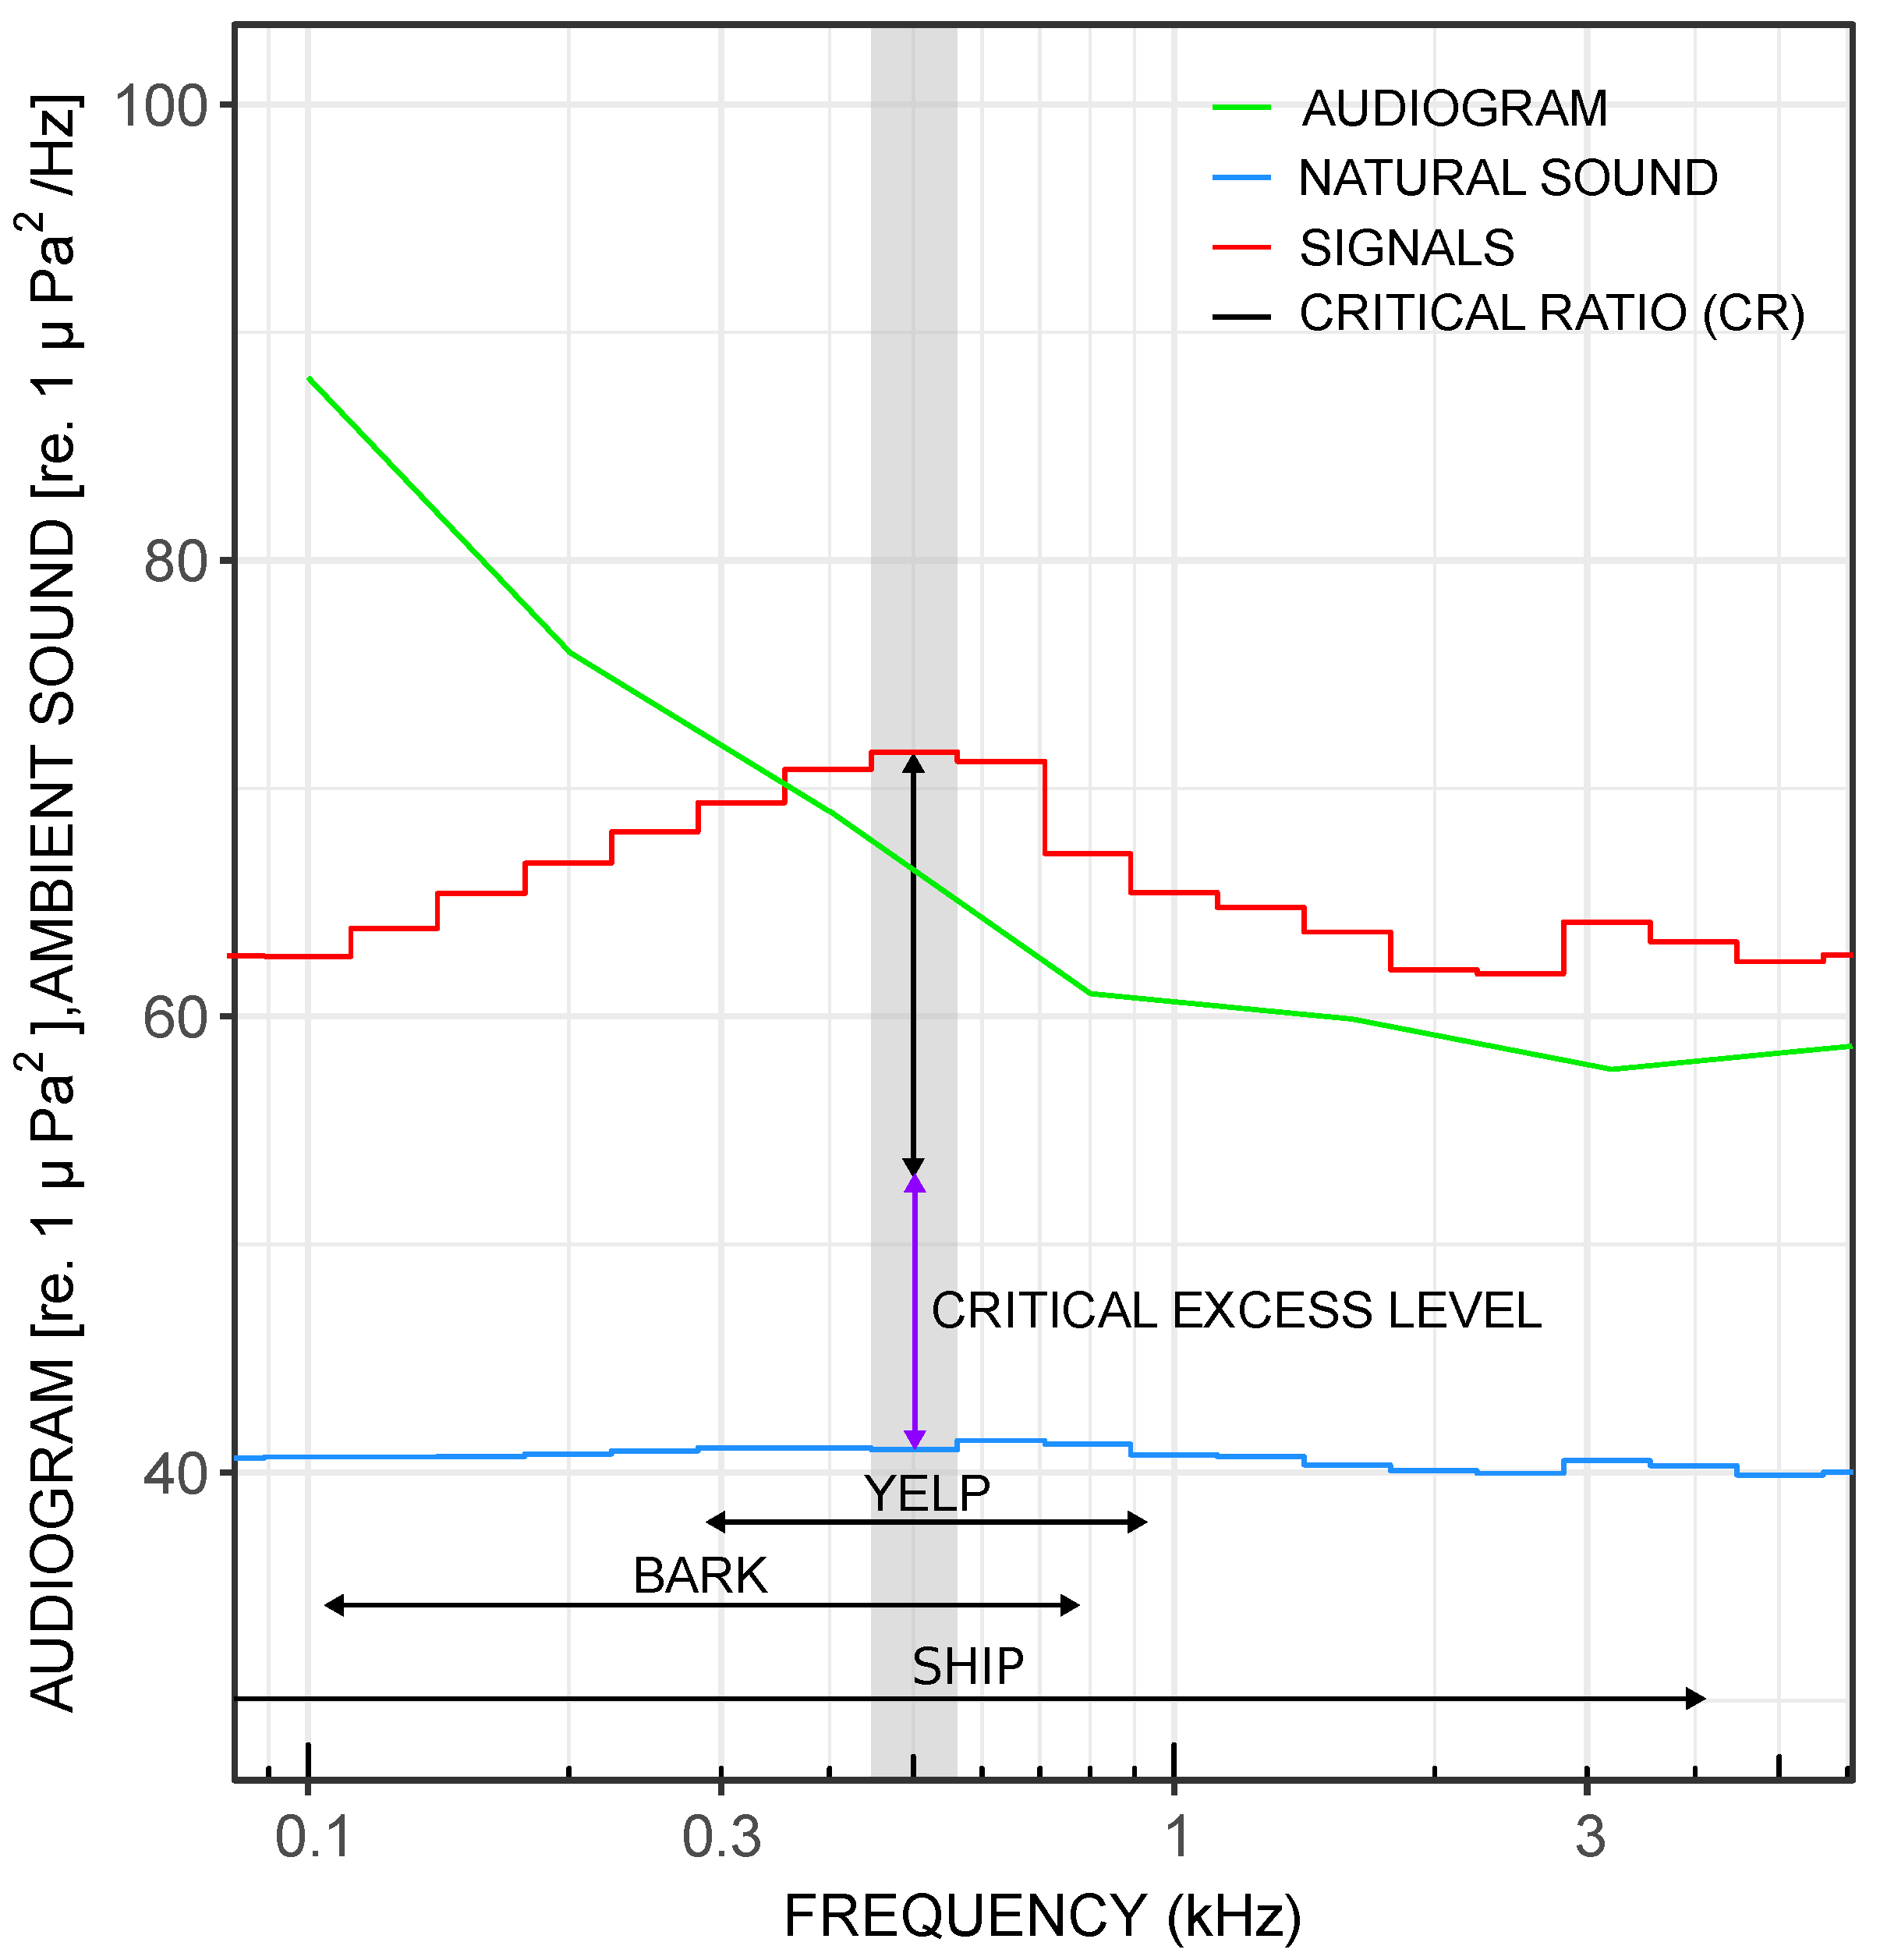
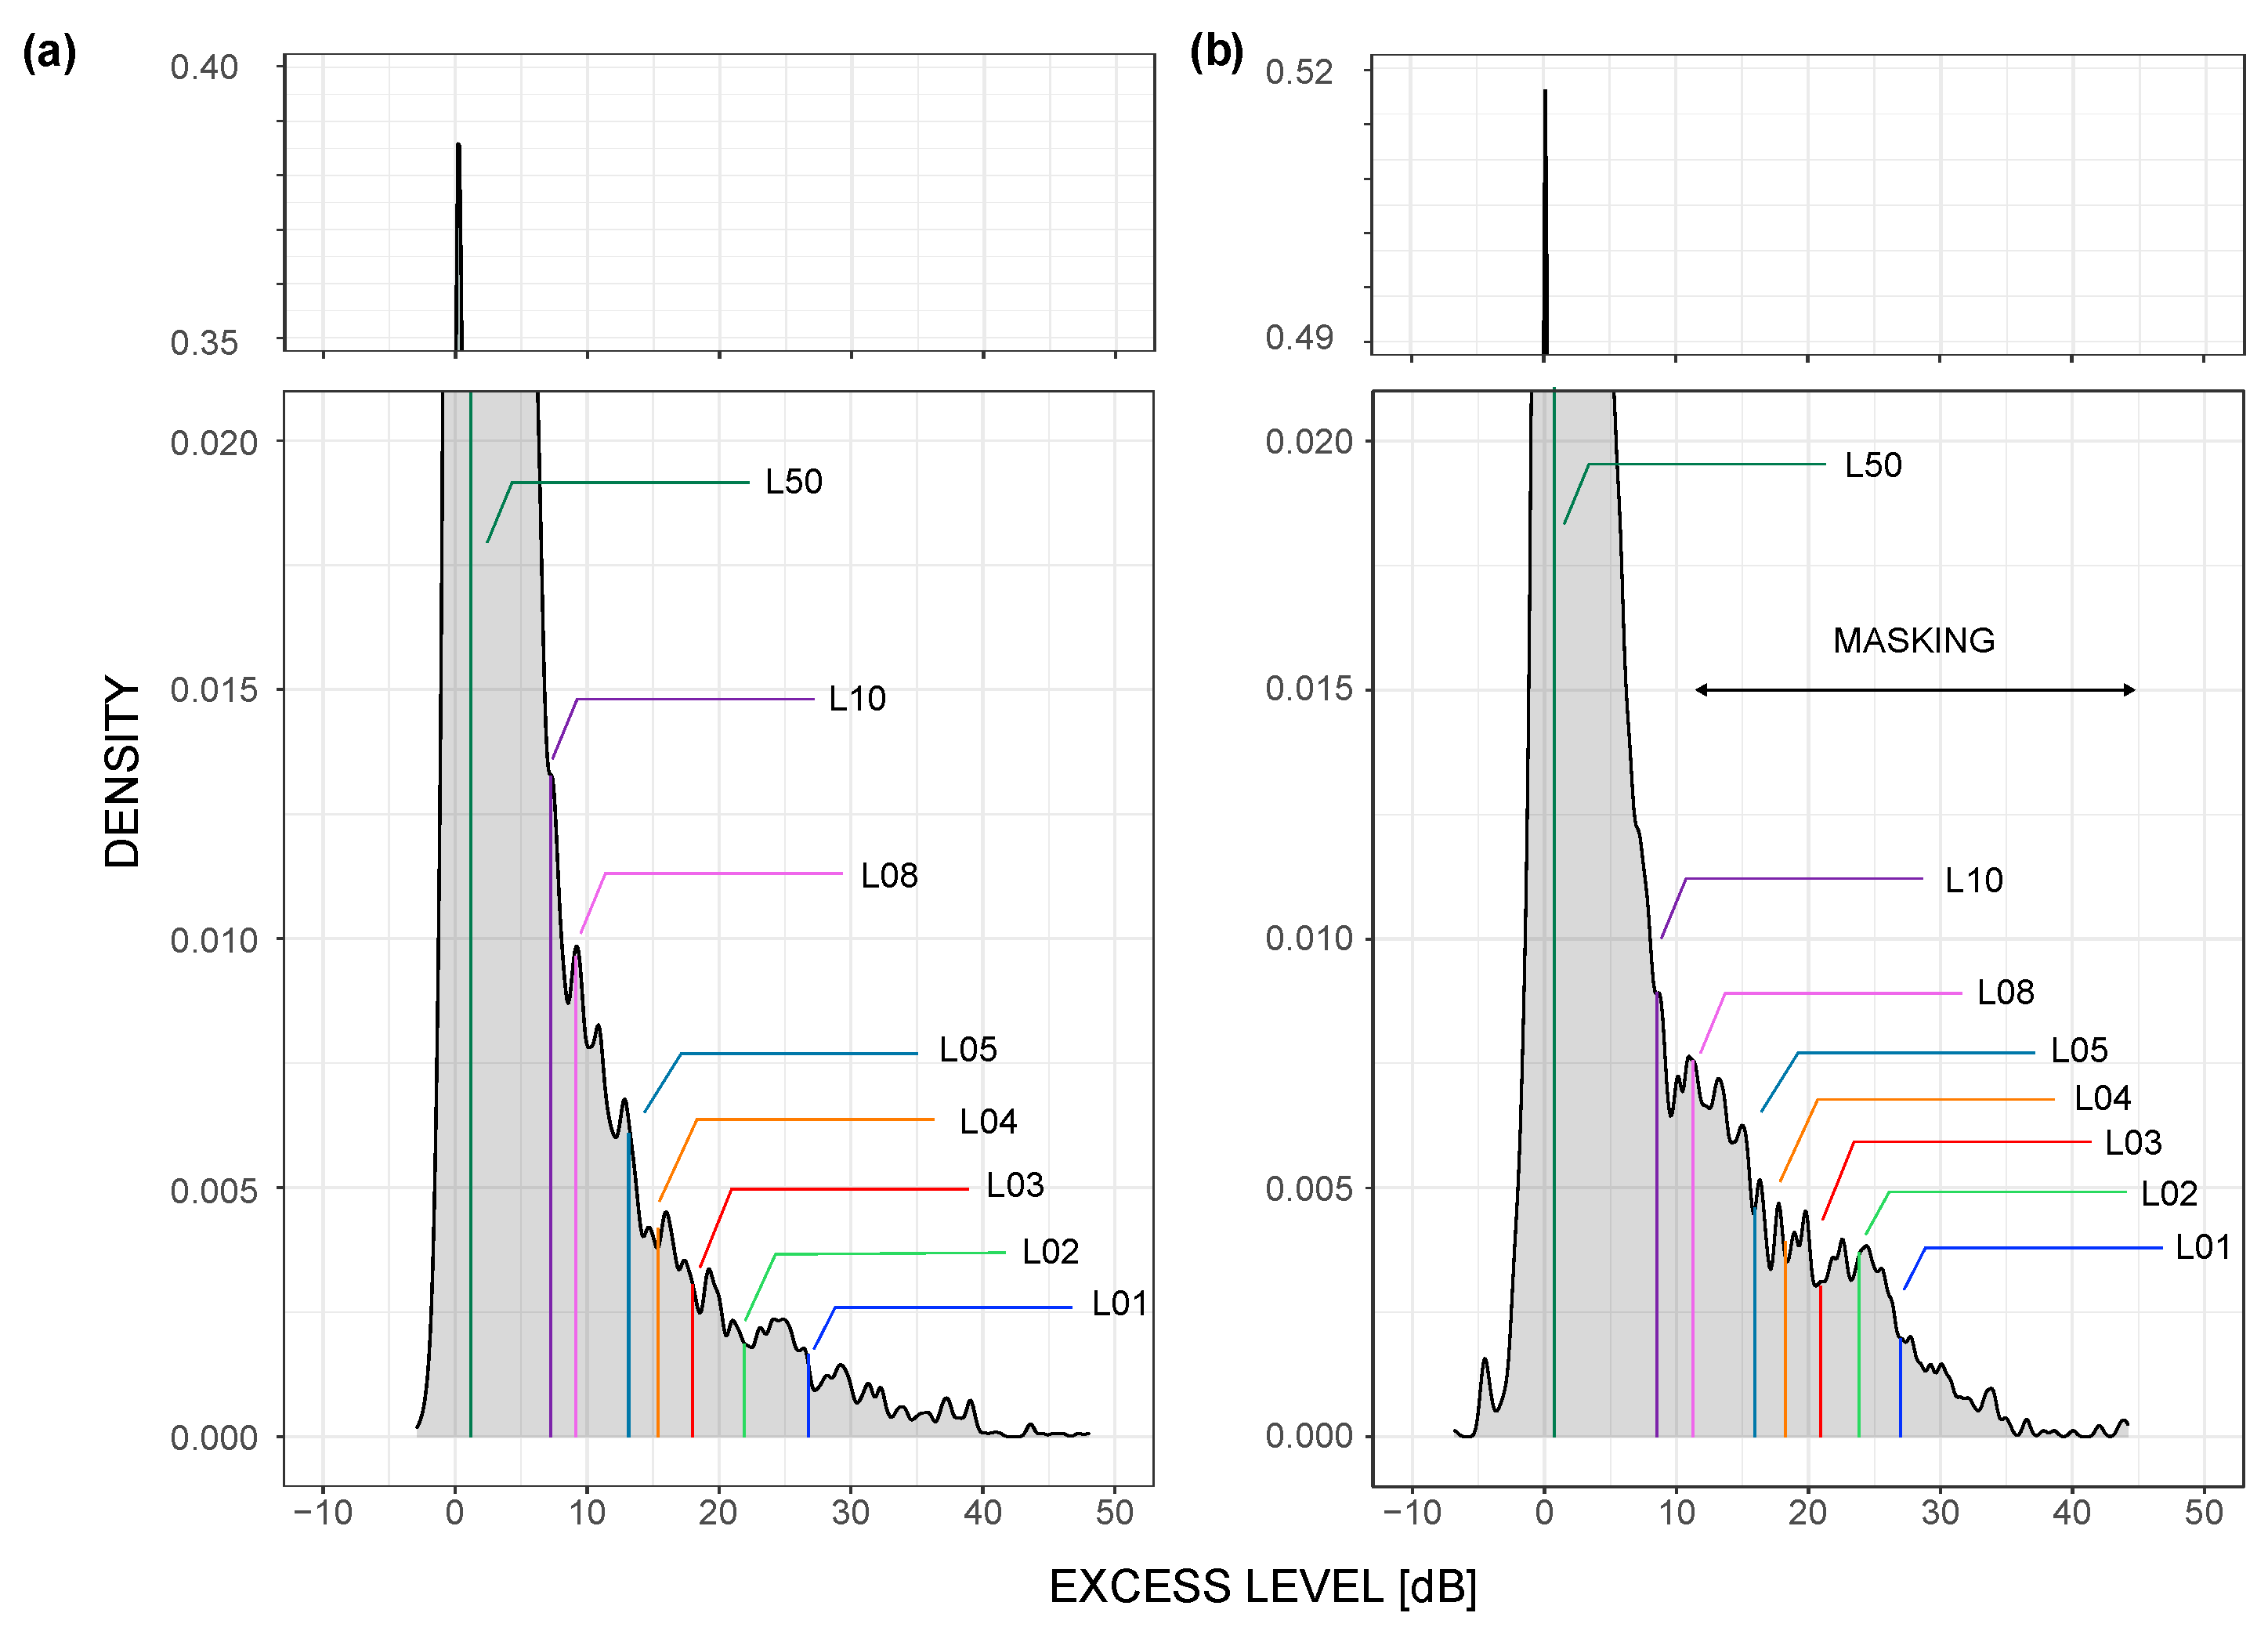
3.6. Assessment of the Auditory Masking Potential of the Ringed Seal Calls

According to the monthly PDFs of the SPLs recorded in Moonsund (Figure 9b), the ranges of RLs were within the suggested criteria for not causing the pinnipeds strong disturbance [40]. As a result, injuries to pinniped hearing from continuous anthropogenic noise were very improbable. Thus, as a sudden impact of continuous noise in the monitoring areas, auditory masking was considered.
Auditory masking is defined as “the process by which the threshold of hearing for one sound is raised by the presence of another (masking) sound; and the amount by which the threshold of hearing for one sound is raised by the presence of another (masking) sound, expressed in decibel” [41]. The masking potential is estimated following the steps of the power spectrum model with a critical ratio (CR), as proposed in [11]. The CR is defined as the minimum span of the SPL of an audible tone against a white noise background. Both the hearing capacity (audiogram) and the CR were taken from documented ringed seals hearing tests [42]. In this study, the CR for single intermediate tones was approximated by linear regression.
As it was shown in Section 3.5.2, biological and anthropogenic sounds can occur simultaneously in the Moonsund monitoring location. During the freezing period, the noise from the ferry line propagates over larger distances and can mask the communication signals of the ringed seals. To estimate the masking potential, two case studies were performed, with results shown in Figure 12. It can be seen that the frequency ranges of the ringed seal calls (yelp and bark) and ship noise overlap. For simplicity, only the frequencies with the highest RL were chosen. Figure 12a,b depict the spectrogram and spectrum level plots in the case of the ambient sound level being less than one CR below the audiogram. In this case, the detection of a signal is audiogram limited, and bark with 14 dB excess over the ambient sound was likely to be detected by other seals in the vicinity of the hydrophone.
Figure 12c,d shows the second case study where the yelp signal has 17 dB excess over the ambient sound. By contrast with the previous example, the gap between the ambient sound and audiogram level is less than one CR. Thus, the detection of a signal is limited by ambient sound (ship noise) level. As the yelp is less than one CR above the ambient sound level, it would probably be undetected by the seals close to the hydrophone position.
The estimated potential masking occurrences due to ship noise are summarised in Table 2. Although the number of co-occurrences of ringed seal vocalisations was quite small, compared to the total numbers of seal detections, a considerable number of them (13 out of 17) have the potential of being masked by the ship traffic noise.
From the above examples, one can deduce that a suitable measure for assessing masking potential is the excess of anthropogenic sound over the natural ambient sound. Even though the source levels and distances to the receivers are unknown, the averaged values of the detected biological signals and natural ambient sound can be compared to evaluate an average excess leading to a potential for auditory masking. To assess the masking potential, we focused on the frequency band that is important for anthropogenic sound (500 Hz TOB) in the area and the CR interpolated value for the pure tone of 500 Hz. The exceedance level L90 was used for representing the natural sound level.
The result of this analysis is shown in Figure 13. The TOB averaged mean-square sound pressure spectral density level of around 400 RLs of ringed seal calls was compared with the natural ambient sound spectrum for the time period when the calls occurred, as well as with the audiogram. It can be seen that, in the case of an average situation, the signal reception was audiogram limited in the absence of anthropogenic sound. However, 12 dB of an excess over the ambient sound level at 500 Hz would lead to a situation where masking could happen. At such a critical excess level, the anthropogenic sound would raise the ambient sound to the level where it would be just one CR below the RL of the signal, by which its reception could start to be hindered.

3.7. Proportion Estimates for the Anthropogenic Sound

Previous studies [10,43] have proposed key metrics for assessing the proportion of anthropogenic underwater sound using their relative sound levels. For instance, the signal excess is defined as the difference between the RL and the detection threshold. In this study, the signal excess was specified as the difference between the RL and the estimated natural ambient sound level. The natural ambient sound was estimated by calculating the exceedance level L90 [44] for time periods without anthropogenic sound.
Figure 14 shows sound excess level PDFs for 500 Hz TOB recorded in Moonsund for two selected weeks in summer (23–29 July 2018) and winter (24–30 December 2018). In summer (Figure 14a), the range of sound excess varied between −3 and 48 dB, with the major portion of sound excess being slightly above 0 dB for 50% of the time. A higher excess level of 7 dB over the natural sound level occurred for only 10% of the time.
In winter (Figure 14b), the sound excess distribution was practically the same as in summer but with slightly higher levels. Considering the proposed critical excess level of 12 dB, it can be stated that ringed seals were at risk of communication masking by the elevated ambient sound for 8% of the time or approximately for 13 h in a week.

4. Conclusions

The underwater ambient sounds from two sound monitoring locations in the MPAs of the Gulf of Riga were analysed. The analysis of the PAM data revealed the presence of both anthropophony and biophony in the soundscape. That offered a possibility to assess the temporal and spectral overlaps of these components and, in particular, to assess the potential for auditory masking of the pinniped calls by anthropogenic noise.
The detection and identification of biological sounds in the PAM data revealed the presence of grey and ringed seals in the vicinity of the monitoring sites. Various types of seal vocalisations were detected. For the grey seals, mainly the guttural rupe, rup, together with forelimb claps in the breeding period and moan in other time periods, were recorded. Even though ringed seals vocalise less than grey seals, their acoustical presence was revealed in Moonsund. The bark and yelp of ringed seals were recorded throughout the monitoring periods. The highest detection rates were found with the formation of the ice cover.
Acoustic detection of shipping noise confirmed the very low shipping activity in the Kihnu location, where the soundscape is largely dominated by natural sounds. Slightly higher shipping activity in Moonsund contributed also to the anthropophony of the soundscape. In summer, the main sources of the anthropogenic noise were pleasure boats, and in winter, distant ferry boats. Long-range detection of the ferries was made possible by the presence of ice cover. The under-ice upward sound refraction and low ambient noise level significantly reduced the propagation loss, thus making the detection of ship noise possible at distances of up to 10 km. Therefore, the effects of ice cover should be considered when assessing the impact of anthropogenic sound on the shallow sea marine environment.
Analysis of the recorded ship spectra in Moonsund showed that they contribute more noise in frequencies higher than 63 Hz or 125 Hz TOBs. Consequently, the 500 Hz TOB was chosen as an indicator frequency band for the anthropogenic noise in the monitoring area. The excess level higher than 12 dB within this frequency band can lead to communication masking for the ringed seal. However, even during the “noisiest” weeks, this risk of masking occurred for a quite small fraction of the time (8%). Based on this assessment, the environmental risks related to the anthropogenic sound around the monitoring sites can be considered as low.

Author Contributions

Conceptualisation, M.S.P. and A.K.; methodology, M.S.P. and A.K.; investigation, M.S.P. and A.K.; data curation, M.M. and A.K.; writing—original draft preparation, M.S.P.; writing—review and editing, M.S.P., M.M., and A.K.; supervision, A.K.; funding acquisition, A.K. All authors have read and agreed to the published version of the manuscript.

Funding

Support from the Estonian Environmental Investment Centre (KIK) is gratefully acknowledged.

Institutional Review Board Statement

Not applicable.

Informed Consent Statement

Not applicable.

Data Availability Statement

Not applicable.

Acknowledgments

Alar Siht from the Transport Administration kindly provided the AIS data. We express our thanks to marine biologists Mart Jüssi and Ivar Jüssi from NGO Pro Mare for sharing their vast knowledge about seal habitats.

Conflicts of Interest

The authors declare no conflict of interest.

References

  1. Directive, M.S.F. Directive 2008/56/EC of the European Parliament and of the Council of 17 June 2008 establishing a framework for community action in the field of marine environmental policy. Off. J. Eur. Union L 2008, 164, 19–40. [Google Scholar]
  2. Decision, E.C. Decision 2017/848/EC of the European Commission of 17 May 2017 laying down criteria and methodological standards on good environmental status of marine waters and specifications and standardised methods for monitoring and assessment, and repealing. Off. J. Eur. Union L 2017, 125, 43–74. [Google Scholar]
  3. Haver, S.M.; Fournet, M.E.H.; Dziak, R.P.; Gabriele, C.; Gedamke, J.; Hatch, L.T.; Haxel, J.; Heppell, S.A.; McKenna, M.F.; Mellinger, D.K.; et al. Comparing the Underwater Soundscapes of Four U.S. National Parks and Marine Sanctuaries. Front. Mar. Sci. 2019, 6, 500. [Google Scholar] [CrossRef] [Green Version]
  4. Mustonen, M.; Klauson, A.; Andersson, M.; Clorennec, D.; Folegot, T.; Koza, R.; Pajala, J.; Persson, L.; Tegowski, J.; Tougaard, J.; et al. Spatial and Temporal Variability of Ambient Underwater Sound in the Baltic Sea. Sci. Rep. 2019, 9. [Google Scholar] [CrossRef] [PubMed] [Green Version]
  5. Pijanowski, B.C.; Villanueva-Rivera, L.J.; Dumyahn, S.L.; Farina, A.; Krause, B.L.; Napoletano, B.M.; Gage, S.H.; Pieretti, N. Soundscape Ecology: The Science of Sound in the Landscape. BioScience 2011, 61, 203–216. [Google Scholar] [CrossRef] [Green Version]
  6. Haxel, J.H.; Dziak, R.P.; Matsumoto, H. Observations of shallow water marine ambient sound: The low frequency underwater soundscape of the central Oregon coast. J. Acoust. Soc. Am. 2013, 133, 2586–2596. [Google Scholar] [CrossRef] [PubMed]
  7. Ma, B.B.; Nystuen, J.A.; Lien, R.C. Prediction of underwater sound levels from rain and wind. J. Acoust. Soc. Am. 2005, 117, 3555–3565. [Google Scholar] [CrossRef] [PubMed]
  8. Bittencourt, L.; Barbosa, M.; Bisi, T.L.; Lailson-Brito, J.; Azevedo, A.F. Anthropogenic noise influences on marine soundscape variability across coastal areas. Mar. Pollut. Bull. 2020, 160, 111648. [Google Scholar] [CrossRef]
  9. Payne, R.; Webb, D. Orientation by means of long range acoustic signaling in baleen whales. Ann. N. Y. Acad. Sci. 1971, 188, 110–141. [Google Scholar] [CrossRef] [PubMed]
  10. Clark, C.W.; Ellison, W.T.; Southall, B.L.; Hatch, L.; Van Parijs, S.M.; Frankel, A.; Ponirakis, D. Acoustic masking in marine ecosystems: Intuitions, analysis, and implication. Mar. Ecol. Prog. Ser. 2009, 395, 201–222. [Google Scholar] [CrossRef]
  11. Erbe, C.; Reichmuth, C.; Cunningham, K.; Lucke, K.; Dooling, R. Communication masking in marine mammals: A review and research strategy. Mar. Pollut. Bull. 2016, 103, 15–38. [Google Scholar] [CrossRef]
  12. Williams, R.; Wright, A.; Ashe, E.; Blight, L.; Canessa, R.; Clark, C.; Cullis-Suzuki, S.; Dakin, D.; Erbe, C.; Hammond, P.; et al. Impacts of anthropogenic noise on marine life: Publication patterns, new discoveries, and future directions in research and management. Ocean Coast Manag. 2015, 115, 17–24. [Google Scholar] [CrossRef] [Green Version]
  13. Mustonen, M.; Klauson, A.; Folégot, T.; Clorennec, D. Natural sound estimation in shallow water near shipping lanes. J. Acoust. Soc. Am. 2020, 147, EL177–EL183. [Google Scholar] [CrossRef] [PubMed] [Green Version]
  14. Prawirasasra, M.S.; Mustonen, M.; Klauson, A. Underwater monitoring of pinniped vocalizations in the Gulf of Riga. Proc. Meet. Acoust. 2019, 37, 070015. [Google Scholar] [CrossRef]
  15. Wahlberg, M.; Westerberg, H. Sounds produced by herring (Clupea harengus) bubble release. Aquat. Living Resour. 2003, 16, 271–275. [Google Scholar] [CrossRef]
  16. Vester, H.I.; Folkow, L.P.; Blix, A.S. Click sounds produced by cod (Gadus morhua). J. Acoust. Soc. Am. 2004, 115, 914–919. [Google Scholar] [CrossRef]
  17. Mizuguchi, D.; Tsunokawa, M.; Kawamoto, M.; Kohshima, S. Underwater vocalizations and associated behavior in captive ringed seals (Pusa hispida). Polar Biol. 2016, 39, 659–669. [Google Scholar] [CrossRef]
  18. Asselin, S.; Hammill, M.O.; Barrette, C. Underwater vocalizations of ice breeding grey seals. Can. J. Zool. 1993, 71, 2211–2219. [Google Scholar] [CrossRef]
  19. Jones, J.M.; Thayre, B.J.; Roth, E.H.; Sia, M.M.I.; Merculief, K.; Jackson, C.; Zeller, C.; Clare, M.; Bacon, A.; Weaver, S.; et al. Ringed, Bearded, and Ribbon Seal Vocalizations North of Barrow, Alaska: Seasonal Presence and Relationship with Sea Ice. Arctic 2014, 67, 203–222. [Google Scholar] [CrossRef] [Green Version]
  20. Oksanen, S.M.; Niemi, M.; Ahola, M.P.; Kunnasranta, M. Identifying foraging habitats of Baltic ringed seals using movement data. Mov. Ecol. 2015, 3, 33. [Google Scholar] [CrossRef] [Green Version]
  21. Härkönen, T.; Stenman, O.; Jüssi, M.; Jüssi, I.; Sagitov, R.; Verevkin, M. Population size and distribution of the Baltic ringed seal (Phoca hispida botnica). NAMMCO Annu. Rep. 1998, 1, 167. [Google Scholar] [CrossRef]
  22. Wildlife Acoustics. User Manual Supplement. Available online: https://www.wildlifeacoustics.com/uploads/user-guides/SM2M-User-Manual.pdf (accessed on 1 August 2019).
  23. Ocean Instruments. SoundTrap ST500 User Guide. Available online: http://www.oceaninstruments.co.nz/wp-content/uploads/2018/03/ST500-User-Guide.pdf (accessed on 1 August 2019).
  24. Betke, K.; Folegot, T.; Matuschek, R.; Pajala, J.; Persson, L.; Tegowski, J.; Tougaard, J.; Wahlberg, M. BIAS Standards for Signal Processing. Aims, Processes and Recommendations, Amended Version. Available online: https://biasproject.files.wordpress.com/2016/01/bias_sigproc_standards_v5_final.pdf (accessed on 15 September 2019).
  25. Merchant, N.D.; Fristrup, K.M.; Johnson, M.P.; Tyack, P.L.; Witt, M.J.; Blondel, P.; Parks, S.E. Measuring acoustic habitats. Methods Ecol. Evol. 2015, 6, 257–265. [Google Scholar] [CrossRef] [Green Version]
  26. Stirling, I. Vocalization in the Ringed Seal (Phoca hispida). Can. J. Fish. Aquat. 1973, 30, 1592–1594. [Google Scholar] [CrossRef]
  27. Rautio, A.; Niemi, M.; Kunnasranta, M.; Holopainen, I.J.; Hyvärinen, H. Vocal repertoire of the Saimaa ringed seal (Phoca hispida saimensis) during the breeding season. Mar. Mamm. Sci. 2009, 25, 920–930. [Google Scholar] [CrossRef]
  28. Schusterman, R.J.; Balliet, R.F.; St. John, S. Vocal displays under water by the gray seal, the harbor seal, and the stellar sea lion. Psychon. Sci. 1970, 18, 303–305. [Google Scholar] [CrossRef] [Green Version]
  29. McCulloch, S. The Vocal Behaviour of the Grey Seal (Halichoerus grypus). Ph.D. Thesis, University of St. Andrews, St. Andrews, Scotland, UK, 2000. [Google Scholar]
  30. Gallus, A.; Dähne, M.; Verfuß, U.K.; Bräger, S.; Adler, S.; Siebert, U.; Benke, H. Use of static passive acoustic monitoring to assess the status of the ‘Critically Endangered’ Baltic harbour porpoise in German waters. Endanger. Species Res. 2012, 18, 265–278. [Google Scholar] [CrossRef] [Green Version]
  31. K. Lisa Yang Center for Conservation Bioacoustics. Raven Pro: Interactive Sound Analysis Software (Version 1.5) [Computer software]; The Cornell Lab. of Ornithology: Ithaca, NY, USA, 2014. [Google Scholar]
  32. Hermannsen, L.; Mikkelsen, L.; Tougaard, J.; Beedholm, K.; Johnson, M.; Madsen, P.T. Recreational vessels without Automatic Identification System (AIS) dominate anthropogenic noise contributions to a shallow water soundscape. Sci. Rep. 2019, 9, 15477. [Google Scholar] [CrossRef] [Green Version]
  33. Merchant, N.D.; Witt, M.J.; Blondel, P.; Godley, B.J.; Smith, G.H. Assessing sound exposure from shipping in coastal waters using a single hydrophone and Automatic Identification System (AIS) data. Mar. Pollut. Bull. 2012, 64, 1320–1329. [Google Scholar] [CrossRef] [PubMed]
  34. Hocking, D.P.; Burville, B.; Parker, W.M.G.; Evans, A.R.; Park, T.; Marx, F.G. Percussive underwater signaling in wild gray seals. Mar. Mamm. Sci. 2020, 36, 728–732. [Google Scholar] [CrossRef]
  35. Aide, T.M.; Corrada-Bravo, C.; Campos-Cerqueira, M.; Milan, C.; Vega, G.; Alvarez, R. Real-time bioacoustics monitoring and automated species identification. PeerJ 2013, 1, e103. [Google Scholar] [CrossRef] [Green Version]
  36. Urick, R.J. Principles of Underwater Sound, 3rd ed.; McGraw-Hill Publishing Company: Westport, CT, USA, 1983. [Google Scholar]
  37. Jensen, F.B.; Kuperman, W.A.; Porter, M.B.; Schmidt, H. Computational Ocean Acoustics; Springer: New York, NY, USA, 2011. [Google Scholar] [CrossRef] [Green Version]
  38. Hook, O.; Johnels, A.G.; Matthews, L.H. The breeding and distribution of the grey seal (Halichoerus grypus) in the Baltic Sea, with observations on other seals of the area. Proc. R. Soc. Lond. 1972, 182, 37–58. [Google Scholar] [CrossRef]
  39. Helle, E. Hylkeiden Elämää. [Seal Life]; Kirjayhtymä: Helsinki, Finland, 1983. (In Finnish) [Google Scholar]
  40. Southall, B.L.; Bowles, A.E.; Ellison, W.T.; Finneran, J.J.; Gentry, R.L.; Greene, C.R., Jr.; Kastak, D.; Ketten, D.R.; Miller, J.H.; Nachtigall, P.E.; et al. Marine mammal noise exposure criteria: Initial scientific recommendations. Aquat. Mamm. 2007, 33, 411. [Google Scholar] [CrossRef]
  41. American National Standards Institute. Bioacoustical Terminology (ANSI S3.20—1995, R 2008); Acoustical Society of America: New York, NY, USA, 2008. [Google Scholar]
  42. Sills, J.M.; Southall, L.B.; Reichmuth, C. Amphibious hearing in ringed seals (Pusa hispida): Underwater audiograms, aerial audiograms and critical ratio measurements. J. Exp. Biol 2015, 218, 2250–2259. [Google Scholar] [CrossRef] [PubMed] [Green Version]
  43. Ellison, W.; Southall, B.; Clark, C.; Frankel, A. A new context-based approach to assess marine mammal behavioral responses to anthropogenic sounds. Conserv Biol. 2012, 26, 21–28. [Google Scholar] [CrossRef]
  44. Gervaise, C.; Simard, Y.; Roy, N.; Kinda, B.; Ménard, N. Shipping noise in whale habitat: Characteristics, sources, budget, and impact on belugas in Saguenay–St. Lawrence Marine Park hub. J. Acoust. Soc. Am. 2012, 132, 76–89. [Google Scholar] [CrossRef] [Green Version]
Figure 1. Sound monitoring locations in Kihnu (58.149° N, 23.873° E) and Moonsund (58.651° N, 23.393° E), marked by asterisks.
Jmse 09 00915 g001
Figure 2. Mooring setups for (a) SM2M and (b) ST500 data loggers.
Jmse 09 00915 g002
Figure 3. Monthly averaged numbers of ships per day based on automatic identification system (AIS) position reports within 10 km radius from the sound monitoring locations: (a) Kihnu and (b) Moonsund.
Jmse 09 00915 g003
Figure 4. Underwater sounds produced by grey seals: (a) moan, (b) rups, (c) series of rupes, and (d) forelimb clapping.
Jmse 09 00915 g004
Figure 5. Underwater sounds produced by ringed seals: (a) yelp, (b) bark, (c) alternating series of yelps and barks, and (d) digging of a hole in the ice.
Jmse 09 00915 g005
Figure 6. Spectrograms of two vessels recorded in Moonsund during the summer period. The dashed line shows the estimated cutoff frequency f c = 60 Hz below which ship-radiated sound does not propagate. The first vessel is an AIS-equipped sailing boat and the second is an unknown boat without AIS transmissions.
Jmse 09 00915 g006
Figure 7. Boxplot of one-third of octave band (TOB) received level (RL) ship noise for the period July 2018 with outliers removed. The lower and upper hinges show the exceedance levels L75 and L25, while medians are shown by the middle lines. The upper and lower whiskers indicate the 1.5 times difference of exceedance levels L25 and L75.
Jmse 09 00915 g007
Figure 8. Time series of 500 Hz TOB sound pressure level (SPL), wind speed, ice concentration, and detections of AIS-equipped ships grouped in two categories according to their detection ranges. SPL correlates with the wind speed, and long-range detections start with the appearance of ice cover.
Jmse 09 00915 g008
Figure 9. The monthly estimated probability density functions (PDFs) in 500 Hz TOB SPLs: at (a) Kihnu and (b) Moonsund monitoring location. Red points mark the arithmetic mean values. Blue and green horizontal lines inside the violin plots mark the exceedance levels L95 and L05, respectively.
Jmse 09 00915 g009
Figure 10. Biophony of (a) detected grey seal calls throughout the year. The number of detections increases significantly during the breeding period. The coloured bar charts in (b) show the number of ships and their respective ranges based on AIS position reports. The total numbers of the acoustically detected ships are shown by the lollipop chart. Numerical values of the detections written over the number of detected ships without AIS can be seen above the bars. All data are presented on a weekly basis.
Jmse 09 00915 g010
Figure 11. Biophony of (a) grey seals and (b) ringed seals calls that are detected in the Moonsund monitoring location. The high detection rates of the two pinniped species occurred during two separate seasons. Shown in (c) are the coloured bar charts of the number of ships along with their respective distances based on AIS data. The total numbers of detections are shown with a lollipop chart along with the labels. The lollipop chart reveals that the ship noise was detected throughout the year and most frequently during the summer. The rates also start to increase in winter due to the extension of sound propagation ranges. Furthermore, the number of detection relates to no-AIS ships present in the labels. All data is presented on a weekly basis.
Jmse 09 00915 g011
Figure 12. Masking potential estimation of the co-occurrence cases of ringed seal calls with anthropogenic sound from distant shipping. Vocalisations are marked on the spectrograms by red ovals (a) bark and (c) yelp. On the right side, the spectral overlaps of two masking events are shown. In (b), hearing is audiogram limited, and masking does not occur. In (d), hearing is shipping-noise limited, and masking is likely. Blue lines show the mean-square sound pressure spectral density level of the ambient sound averaged in TOBs.
Jmse 09 00915 g012
Figure 13. A 12 dB elevation of the ambient sound, called the critical excess level (purple line), can initiate ringed seal call masking. Averaged TOB mean-square sound pressure spectral density level of natural ambient sound and seal calls are shown in blue and red lines. The audiogram of the ringed seals is shown with a green line. The grey area shows the 500 Hz TOB.
Jmse 09 00915 g013
Figure 14. Weekly PDFs of 500 Hz TOB sound excess levels recorded in Moonsund for two periods in (a) summer and (b) winter. The risk of masking occurs less than 8% of the time when it exceeds the estimated natural ambient sound by 12 dB. The excess level of 0 dB means that the RL coincided with the estimated natural ambient sound level.
Jmse 09 00915 g014
Table 1. Band limited energy detector (BLED) performance for finding specific types of grey seals’ calls.
Types of CallsTPFPFNTNAccuracySensitivity
Moan1108930077.75%11%
Rupe2657429580.20%26%
Clap1948129678.77%19%
Rup70673023375.75%70%
TP = true positive, FP = false positive, FN = false negative and TN = true negative.
Table 2. Summary of the auditory masking analysis.
Dates/Sea-Ice Concentrations (%)Call TypesNumber of SignalsShips/CPA (km)
Co-Occurrences with Ship NoiseMasked (Incl. Ambient Sound Limited)Not Masked (Incl. Ambient Sound Limited)
2018-12-29/18Yelp(s)11(1)0Ferry/8.5
2018-12-30/7Bark(s)404(0)Ferry/8.9
2019-01-10/20Yelp(s)11(1)0Ferry/8.3
Bark(s)11(1)0
2019-01-19/35Yelp(s)1010(10)0Ferry/8.5
Publisher’s Note: MDPI stays neutral with regard to jurisdictional claims in published maps and institutional affiliations.

