1. Introduction
In recent years, various factors have made the environment more challenging for maritime trade, for instance, increased trading volume, vessel upsizing, and imprudent investments in port infrastructure [
1]. With increasing vessel sizes, high volatility of cargo volumes, and stronger competition, seaports are required to adapt to the new challenges.
On the one hand, seaports are required to deal with higher demand and requirement. On the other, overcapacity becomes common in some places in the world due to imprudent investments of new ports when the existing ports are underutilized. For port authorities and operators, cautious investment decisions shall be made on the basis of capacity evaluation and improvement of existing ports [
2].
In developing countries where the port infrastructure is still developing, many existing ports are multipurpose, in that different cargoes (such as containers and break bulk) are handled in the same quay length. Evaluation of existing multipurpose seaports and terminals are particularly challenged by the need to optimize their activities and efficiently serve different categories of vessels carrying various types of cargo, being often confronted with limited space. Multipurpose seaports are complex handling systems with interrelated handling methods and processes. Among them, the system performing the transfer of cargo between the quay and the storage areas is of critical importance, as any inefficiency in feeding a crane with cargo has negative effects on the performance of the whole sea-side operation [
3].
In this paper, we studied a single-berth multipurpose terminal in Indonesia, which is quite commonly seen in developing countries. The port is located on an island and designed as a supporting seaport to mainly serve the mining activities in the area.
Figure 1 shows the port, where the Cargo Jetty is a multipurpose terminal for handling both containerized cargo and break bulk cargo.
The studied port is facing increasing cargo throughput demand in the recent years and the port operator is keen to evaluate the maximum capacity of the port. The port operator wants to maximize the use of existing port facilities before any expansion is conducted.
However, the operational evaluation of such a small-sized multipurpose seaport is not easy due to the complexity of the process system where different handling methods are used for different cargo types, with varying process time in each linkage of the process flow. In this studied seaport, a vessel crane is used for loading and unloading because a shore crane is not allowed due to restricted wharf space. Besides the vessel crane, the whole handling process involves a reach stacker at the wharf, trailers between the wharf and the laydown area, and reach stackers working in the laydown area. The cargo mix, various handling methods, variation of process time, and interrupts between process linkages make the process system of the terminal highly dynamic.
In this paper, we show how a simulation model for such a single berth multipurpose seaport with limited wharf space can be established and used for the evaluation of port capacity. Furthermore, new handling methods can be proposed and evaluated by using the simulation model. The results are most helpful for the port authority and operator in deciding the time for a port expansion. The existing usage of port infrastructure can be maximized before significant investment in new port infrastructure and capacity is committed.
The rest of this paper is organized as follows: A brief literature review is given in
Section 2.
Section 3 describes the operational system of the studied port in detail.
Section 4 establishes a comprehensive simulation model. The following
Section 5 evaluates the bottleneck, productivity and capacity of the port based on the analysis of the simulation model. An improvement method using a different handling method is proposed and evaluated. Finally, the main conclusion is presented in
Section 6.
2. Literature Review
Simulation is a commonly used tool to analyze uncertain systems and offers a great potential for modeling and analyzing port processes and, therefore, reduce the risk associated with process change. It was found that over the past 50 years the use of simulation models has been increasingly favored and instrumental in the development of ports and more specifically of container terminals [
4].
Lin et al. [
5] addressed an investment planning problem for a container terminal with the Arena software, the simulation experiments were carried out to set ideal parameters so that the port can reach the required service level meanwhile the total investment keeps minimized. Scott et al. [
6] used a discrete event simulation model of port operations to assess the cost and benefits of various long wave mitigation approaches. Zhang et al. [
7] analyzed multi-stage gate operation in container terminals with Plant Simulation, the simulation models of the traditional single-stage gate and multi-stage gate were established respectively, through comparative analysis and it was concluded that the multi-stage gate can reduce the waiting time of vehicles lining at the gate and improve the efficiency of the gate. Sislioglu et al. [
8] integrated simulation and data envelopment analysis to create a decision support tool to find the optimum investment package for the enlargement of a container terminal. Uribe-Martes et al. [
9] presented a simulation model of internal transportation at a container terminal, combined with scenario analysis to help determine the adequate number of vehicles. To design a new automated container transport system in the Netherlands, Hur et al. [
10] used GPSS/H and PROOF5 to develop a simulation program which integrates prediction and visualization. Tama et al. [
11] established a loading and unloading service system model of a port in Sarabaya, Indonisia, aiming to determine the number of docking gates accommodating the current container terminal. Stojaković and Twrdy [
12] used discrete-event simulations to determine the optimal allocation of yard trucks to quay cranes in a hypothetical small container terminal.
The above research typically uses simulation models to help decision making. Many researchers also have conducted performance analysis using simulation models. Zhang et al. [
13] used simulation models to evaluate the performance of a multi-commodity port system located in Valparaiso, Chile. Using the simulation software Arena, Agostino et al. [
14] developed a simulation model of operations in the train arrival process at Port Terminal of Ponta da Madeira, aiming to support current and future decision making. Preston et al. [
15] conducted a series of analyses using simulation models in order to minimize the impact of port road traffic on the local community in Dover. Sriphrabu and Chamnanlor [
16] developed a simulation model of the operations within the yard, and used the model to analyze the service processes, as well as to determine different scenarios for improving services, such as adjusting service methods, increasing/decreasing the number of employees, and adding resources. Ansorena et al. [
17] shed light on the arrival and service process of vessels at container terminals, a simulation model was presented to analyze waiting times, queue lengths, berth utilization, and efficiency ratio. Kusuma and Arvitrida [
18] proposed an integrated analysis, in which the simulation approach was used to model the uncertainty and complexity. To properly evaluate a dry port’s performance, Pimpanit and Jarumaneeroj [
19] proposed a simulation model and implemented it in the SIMIO modeling platform based on the data of Ladkrabang Inland Container Depot, Thailand.
All the mentioned research is based on discrete-event simulation, and some scholars select other relevant simulation methods. Based on agent-based modeling in the simulation, Muravev et al. [
20] investigated a two-stage optimization of intermodal terminals’ main parameters by using the AnyLogic simulation platform. Based on micro-simulations, Hervás-Peralta et al. [
21] compared two new terminal operating systems with the currently used terminal operating system at the Intersagunto terminal in Spain using FlexTerm. The ability of the agent-based approach is to focus directly on individual objects and the environment. Similarly, micro-simulation is suitable for applications in modeling the interacting behavior of involved objects, especially when applied to a larger system. However, both methods require a large amount of real and detailed data, which also makes the simulation results vulnerable to the data quality. Relatively speaking, though discrete event simulation deals with a large complex system less effectively, it is still an effective tool to model concepts with a high level of abstraction in a system, and its event-driven characteristic enables the state transitions to be explicated more intuitively. Therefore, in this paper, we use discrete-event simulation to study the operation of a single-berth multipurpose terminal.
The above literature review shows that the majority of relevant research focuses on using simulation models on relatively large scale specialized terminals such as large container terminals. Small to median-sized multipurpose seaports are common in many developing countries. The process flow and system in such small scale multipurpose seaports may be more complicated due to the cargo mix, various handling methods, variation of process time, and interrupts between process linkages. The simulation approach may be significant and much helpful for the operational evaluation of these ports. The objective of this paper is to show the application of the simulation approach in an existing small-scale multipurpose seaport and the usefulness of such an approach in the port industry.
3. The Studied Multi-Purpose Seaport
The studied B Port is located in West Sumbawa of Indonesia, mainly serving the mining business in the region. The port is now handling 17,600 TEUs of container cargo and 13,000 tonnes of break bulk cargo in a year. Most of the cargo are imports of materials for the mining industry in the hinterland. Empty containers need to be shipped out of the port and become the main outbound cargo for the port. Container cargo and break bulk cargo are usually carried in the general cargo vessels.
The port throughput has shown a significantly increasing trend in recent years. The port operator is concerned with the maximum capacity of the port and whether port expansion is needed in the near future.
The port consists of a single-berth multipurpose terminal (as shown in
Figure 2). The terminal features a 94.1 m × 20 m platform and a causeway connecting to the laydown area. A vessel crane is used for loading and unloading cargo since a shore crane is not allowed due to limited wharf space.
Different handling methods are used for container cargo and break bulk cargo. For break bulk cargo, the vessel crane directly unloads the cargo from the vessel and places it on the trailer on the wharf. Then, the trailer transfers the break bulk cargo to the laydown area, where a reach stacker at the laydown area is used for the stacking of the cargo. For container cargo, the vessel crane unloads the cargo from the vessel and places it on the ground of the wharf. Then, a reach stacker picks up the container cargo and places it on the trailer which transfers the cargo to the laydown area. The quayside operation is complicated due to the restriction of the operation space. For import containers, there are a total of four operations from vessel unloading to laydown area stacking as shown in
Figure 3.
Due to wharf space restriction, only 1 vessel crane is employed, although each cargo ship is equipped with 2 vessel cranes. Currently, there is a quay reach stacker and a yard reach stacker available serving arriving cargo. Depending on the availability of trailers (sometimes the trailers may be used in the warehouse outside the terminal), 2 or 3 trailers may be used in the port.
The cycle time of each process may vary due to different cargo types and operational difficulty (e.g., maneuvering of reach stacker on the wharf). The variation of the cycle times makes the port operational system complicated for analysis. To evaluate the productivity and identify the bottleneck of the terminal operations, we rely on simulation models for the analysis.
4. The Port Simulation Model
In this section, simulation models are constructed based on real circumstances. First, the problem description is presented including equipment and facilities in use and process time. Next, a brief introduction of the adopted simulation software is given. Last, the simulation scenario is given as a flow chart and, then, the model settings are discussed in detail.
4.1. Concept Model
The simulation scenario is based on the current situation in the terminal, which is depicted in
Figure 4. In this flowchart, RS, QRS and YRS stand for reach stacker, quay reach stacker and yard reach stacker, respectively. According to the position where the certain process performs, the scenario can be divided into 3 parts, ship arrival and departure process, quay operation and yard operation.
In the beginning, a ship is generated and enters the system. Next, the ship occupies the berth only when the berth is empty. After berthing, it takes some time for paper work and preparation before loading and unloading.
According to different types of cargo in process, different handling methods and equipment are employed. For containerized cargo, a container is loaded by a vessel crane and placed in the limited buffer area at the quay. If this area is already at its full capacity (one slot), the container is held by the crane until a space becomes available. In the simulation, the crane is blocked by the next process. The container on the quay is picked up by a reach stacker then transferred to a trailer waiting at one end of the quay. For break bulk cargo, the cargo is picked up by a vessel crane then directly placed at a trailer and the time per lift is generally longer than that for container cargo. At the yard, a reach stacker picks up the cargo and places it in the laydown area. If more than one unit of cargo (e.g., two 20-feet containers) are carried by the trailer, the trailer needs to wait for these cargoes to be unloaded and placed in the laydown area.
After all the cargo is loaded to and unloaded from the vessel, it takes some time for the vessel to unberth before another vessel can use the berth.
4.2. Simulation Software
The studied port in this paper is a small sized multipurpose seaport where the operating system consists of multiple flow objects, such as vessels, reach stackers and trailers. There are various events in the system, which occur and stop in discrete moments with a certain randomness, so this is a dynamic discrete-event system typically and we select a corresponding simulation method to conduct experiments.
To simulate the operating system of this cargo jetty, we use the software Plant Simulation, Version 15.2.1, to construct models. Plant Simulation is a discrete-event process simulation software and part of the Tecnomatix digital manufacturing solutions by the Siemens PLM Software. Students at schools, colleges or universities can download Tecnomatix Plant Simulation for free.
The studied cargo jetty is poorly automated and standardized, compared to large scale seaports, which makes the processes cumbersome. The events do not only happen according to the probability distribution (e.g., different kinds of ships arrive and arrival interval), but also can be triggered by other events and the current system states (e.g., transfer of goods and restrictions on the one-way causeway), both of these kinds of processes have great effects on the system performance. In this case, Plant Simulation enables us to create an object-oriented simulation model of this operating system, including the control strategies and data collecting. Various events can be parameterized through object settings and customized methods. Based on these simulation models, we perform an analysis of the system characteristics, detect potential bottlenecks, and optimize performance including capacity, productivity, and material handling operations. The specified results can be both summarized by embedded statistics report and recorded into a table object through customized methods, there is also an experiment design tool to help handle results.
4.3. Simulation Model
A simulation model for the terminal is established using the simulation software, Plant Simulation. The model presented in this paper is based on the real data provided by the port operator. The whole simulation model is composed of four types of processes: ship arrival & departure, quay operation, yard operation, and control & information process. The ship arrival & departure process is shown in
Figure 5.
There are 7 material flow objects and a mobile unit in this process of ship arrival & departure process: Source, Waiting Line, Preparation, Berth, Departure, Leaving, and Vessel. Source produces different types of ships with mixed cargo. Waiting Line is a buffer for ships waiting for berth. Preparation and Departure accept exactly one mobile unit from their predecessor. After an interval, the mobile unit will be transferred to successors. These objects simulate berthing and unberthing procedures. Object Berth works as a real berth and, when entering, these object ships will trigger loading and unloading operations. Finally, the object Leaving recycles mobile units.
The quay operation process is shown in
Figure 6.
Trailer Pool and QRS Pool create a specific number of trailers and quay reach stackers depending on the setting. Object Crane simulates the vessel crane working. There is a buffer because the quay is able to hold one container at a particular time. The quay reach stacker carries one container at a time, then, it moves toward the trailer and passes the container to it. Note that when a piece of break bulk cargo arrives, the ship crane transfers it directly onto a trailer without the quay reach stacker involved. A trailer carries 2 pieces of cargo at maximum.
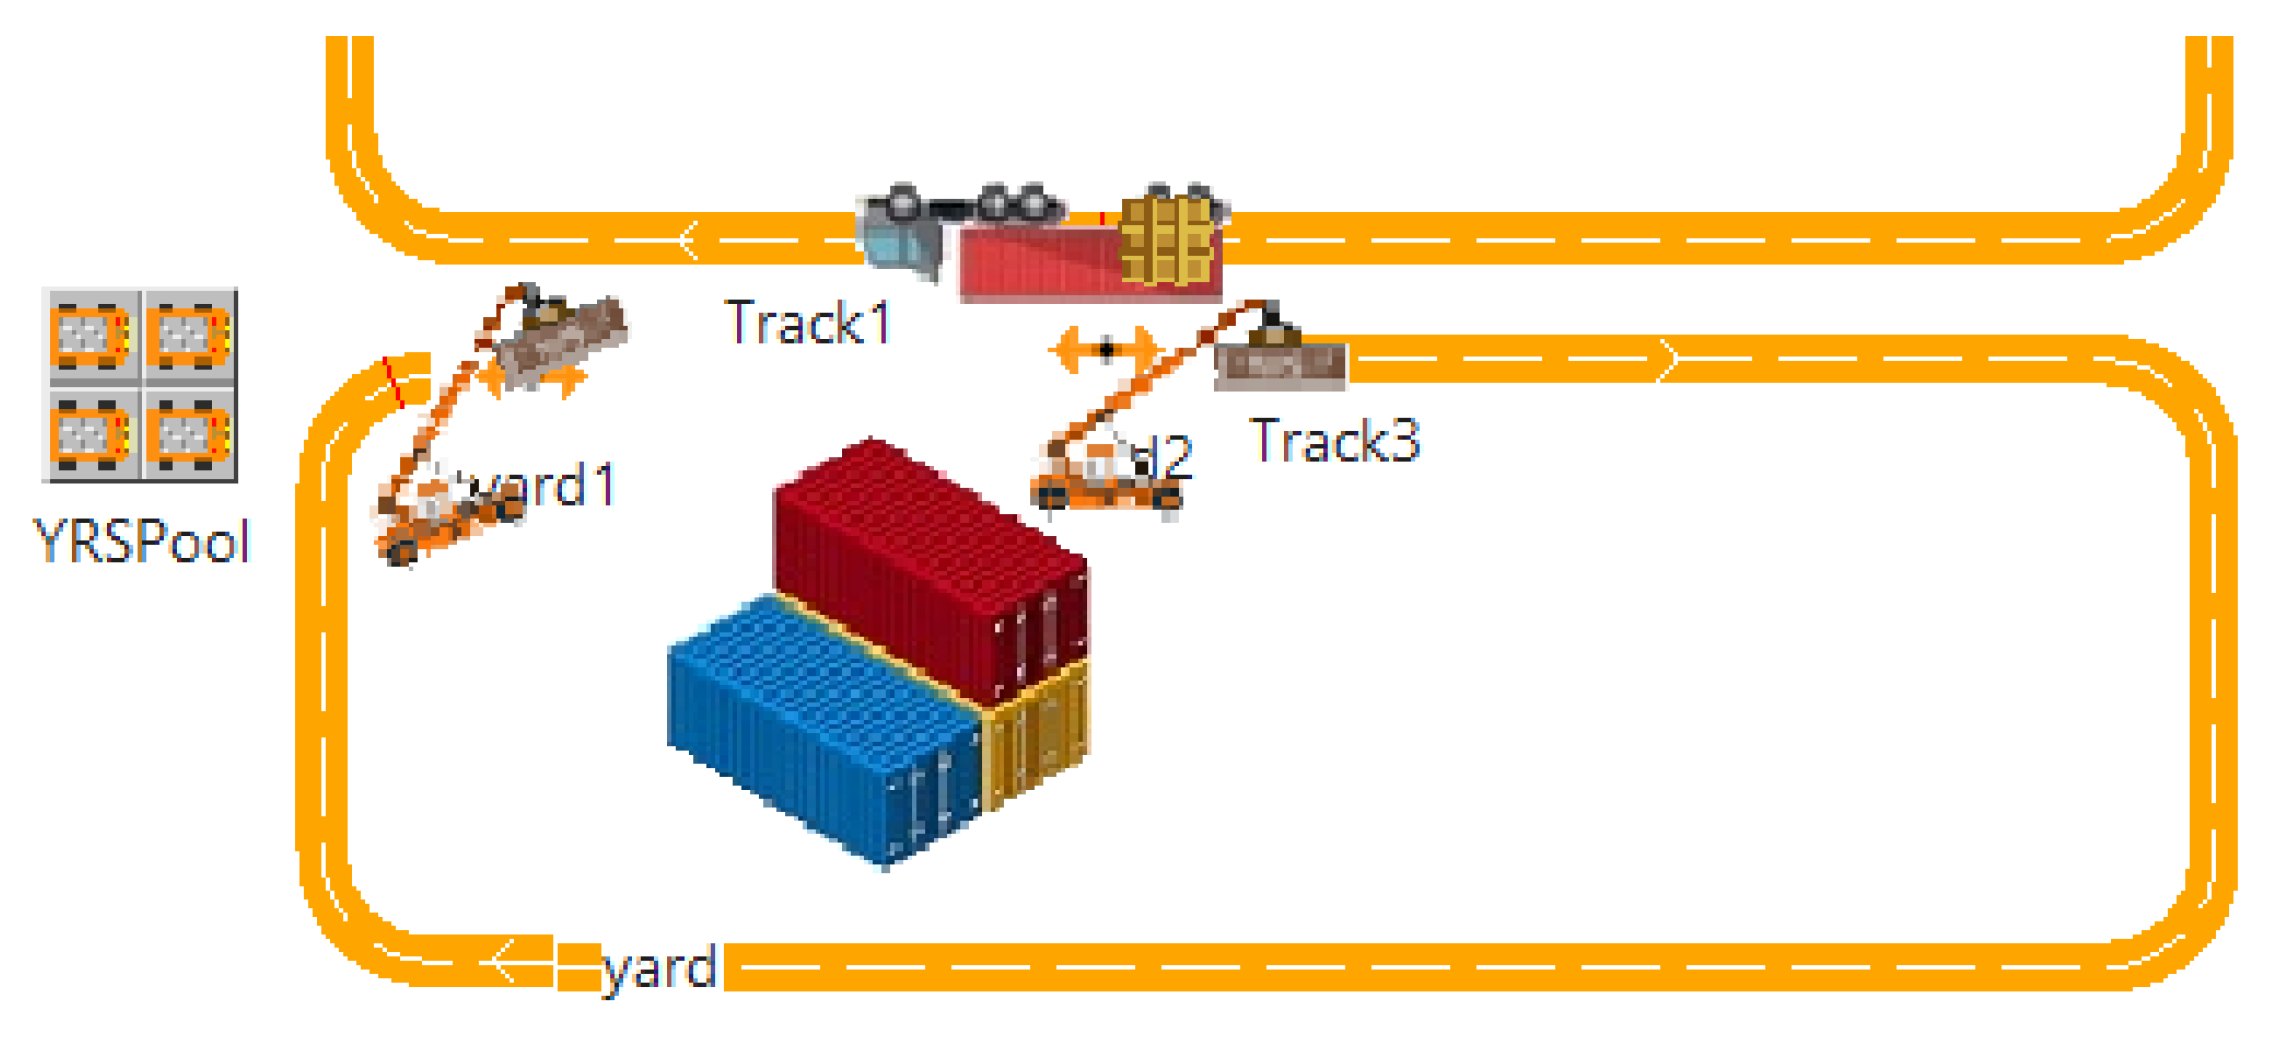
Next, the loaded trailer sets up to the yard. The yard operation process is shown in
Figure 7.
The object YRS Pool creates a certain number of yard reach stackers. When trailers arrive, yard reach stackers start to work and they carry one piece of cargo at a time. Goods are taken to the yard and then recycled.
Currently, the material flow can only move on according to a simple and monotonous setting. However, what we need is to realize the relatively complicated transportation. Therefore, besides material flow objects and mobile units, the model needs control methods for running. The control & information component is set as shown in
Figure 8.
The event controller realizes run settings. The shift calendar simulates random downtime and crew break. The 7 method objects, “init” “endsim” “reset” “Arriving” “unload_shipcrane” “unload_trailer” and “unload_YRS”, are set to realize specific functions through programming. Tables record and transfer user parameters, and global variables are set to call methods and record key indicators.
The simulation model is based on the following parameter setting which reflect the reality:
The vessel arrivals are simulated following the patterns of 2020 vessel data. The variation of the vessel arrival intervals is the main reason for vessel waiting time in the ports as queuing systems.
The process time for each process linkage in the terminal, e.g., the time for unloading a container by the vessel crane, is observed in the field. The average and variation of the process time is analyzed and input in the simulation model.
The terminal is in operation for 22.5 h per day. The operation will stop for a one-hour break (12:00–13:00) a day and a 30 min break (18:00–18:30) for crew change.
When cargo ships arrive, container cargo is handled first, followed by break bulk cargo.
4.4. Key Performance Indicators
We intend to acquire performance indicators via simulation models. The key indicators we focus on are as follows: equipment utilization, equipment productivity, and terminal capacity.
Utilization. This indicator is recorded by global variables to reflect the average percentage of time utilized. We run the simulation model for 10 replications with each replication lasting for 30 days.
Productivity, the unit is lift. In the models, cargo ships are set to load a single type of cargo (containers and break bulk cargo) to record the throughput for different cargo. We run the simulation model for 10 replications with each replication lasting for 30 days. This indicator is recorded by statistics report embedded in the software, equal to the total production of uninterrupted operation in 30 days divided by 720 (30 × 24) hours.
Capacity, the unit is TEU for containers and ton for break bulk cargo. The capacity of the port is evaluated considering reasonably short waiting time of vessels (assumed average waiting time to be less than 2 h). We run the simulation model for 10 replications with each replication lasting for 365 days. This indicator is obtained through the statistics report embedded in the software. We run repeated experiments only with the arrival rate of ships changing until the result of average waiting time of ships (recorded by global variables) is around 2 h, then, the total production is taken as the capacity of this certain experiment setting.
Note that the productivity does not correlate with the capacity directly. For instance, in one experiment the simulation results show that the capacity of containers is 40,446 TEUs and the productivity is 14.83 lift (a lift corresponds to a unit TEU). It can be seen that when an indicator value of productivity times 8760 (365 × 24) hours, the result is much more than the corresponding capacity because we restrict the arrival rate of ships when obtaining the indicator value of capacity.
The productivity indicates the handling rate of the system, through which the designed capacity can be obtained. However, we do not take the designed capacity as a KPI because this large value is unrealistic. On the one hand, the real capacity is affected by the combination of different categories of goods. On the other hand, the port service needs to meet their customers’ satisfaction, one important thing is to lower the waiting time in queue. Based on the consultations with the port authority via videoconferencing in November 2020, the maximum acceptable waiting time is 2 h, which supports our method to obtain capacity.
5. Results and Discussion
Since the model has been established, we can use it to design experiments and analyze the system conveniently. We conduct sets of experiments to observe each indicator. Results are presented in
Appendix A. First, bottlenecks are identified by setting relevant parameters to the current value of the terminal. Next, the port capacity is evaluated with our models, then, the sensitivity analysis is conducted to eliminate bottlenecks. Finally, we run models where a new handling method is adopted to help further increase the capacity.
5.1. Bottleneck Identification
The current operational flow is analyzed based on the simulation. As shown in
Figure 9, the yard reach stacker’s utilization is 94.04%, followed by vessel crane (86.20%), trailers (60.50%), and quay reach stacker (55.15%). This confirms the fact that the yard reach stacker is the bottleneck in the handling process.
Nonetheless, this analysis assumes that there are 3 trailers. When there are only 2 trailers, which occasionally occurs when a trailer may be used in the warehouse, the port performs relatively poorer. The utilization of YRS, vessel crane, trailer and QRS drop from 94.05% to 68.61%, 86.20% to 63.35%, 60.50% to 57.59% and 55.15% to 41.15%, respectively.
5.2. Evaluation of Practical Capacity
We are also interested in the realistic capacity of the port when 3 trailers, 2 yard and a quay reach stackers are available. In spite that the terminal can operate uninterruptedly, the interval of arriving ships has to be limited to avoid long vessel waiting time. As shown in
Table 1, when ships arrive at different intervals, vessel waiting time and port capacity are affected. The throughput is evaluated as the sum of containers and break bulk cargo (with existing mix of cargo).
Interval is the independent variable, it stands for the time interval between 2 consecutive ships arrivals. Average waiting time is the dependent variable, waiting time stands for the time a ship waiting in line for receiving service. The relationship between average waiting time and throughput is depicted in
Figure 10, the average waiting time increases significantly when the port has higher throughput.
To ensure adequate service level, the average waiting time is limited to be under 2 h, which is based on the consultations with the port authority via videoconferencing in November 2020. To maintain the average waiting time at 2 h, the port affordable throughput is around 47,023 crane lifts per year. In addition, based on the simulation results (see
Appendix A), port capacity is evaluated as:
Note that the average weight of each unit of break bulk cargo weighs 4.02 tons, which is calculated based on the annual report of the cargo jetty in 2019, altogether there are 3233 pieces of break bulk cargo weighing 13,007.32 tons.
According to the annual report in 2019, the capacity of the cargo jetty is:
Obviously, the real capacity, or say throughput, lags distinctively behind the simulation capacity. Actually, only 139 ships arrived at the cargo jetty and received service in 2019 according to the annual report, the cargo jetty has the ability to serve more demand.
5.3. De-Bottlenecking via Sensitivity Analysis
The productivity for both container and break bulk cargo are obtained through our simulation models and how the productivity varies when a different amount of facilities is adopted is analyzed.
As shown in
Figure 11, increasing the number of trailers from 2 to 3 significantly increases productivity. For container cargo, the productivity rate increases from 10.6 to 14.5 lift per hour when the number of trailers increases from 2 to 3, with 1 yard reach stacker. The productivity for container cargo increases from 10.6 to 10.98 lift per hour under the circumstance that 2 trailers are employed. It shows that there is merely a slight increase by adding one more yard RS.
Figure 11 also shows that increasing the number of trailers from 3 to 4 raises slightly the productivity rate from 14.5 to 14.69 under the circumstance that 1 yard RS is employed. It is thus recommended that the availability of 3 trailers and 2 yard RSs should be ensured.
Figure 11 also indicates that there is a bottleneck restricting the current productivity since the increasing rate of capacity drops obviously when the number of trailers reaches 3. To identify the bottlenecks, we move on to analyze the utilization rate, the simulation results are shown in
Figure 12.
Each experiment number corresponds to a certain combination of facilities. Four main facilities are observed, but only the number of trailers and yard reach stackers are adjusted to conduct different sets of experiments. The experiment specifications of combinations of equipment are shown in
Table 2, and detailed results are presented in
Appendix A.
With 1 yard reach stacker employed, the vessel crane has the highest utilization rate. When 2 yard reach stackers are employed, yard reach stackers have the highest utilization rate, meaning that they are the bottlenecks in the handling process in these cases.
Meanwhile, although equipped with 2 yard RSs and 4 trailers, the highest utilization rate of the vessel crane is 88.29%, showing that it fails to take full advantage of the vessel crane. To make good use of 2 vessel cranes, we propose a new handling method using straddle carriers.
5.4. New Handling Equipment and Evaluation
Based on the simulation analysis above, we understand that the vessel crane is not fully utilized. The overall capacity of the port should be obtained if the vessel crane can be fully utilized.
Self-lifting vehicles, such as straddle carriers are able to lift containers from the ground autonomously. Non-lifting vehicles, such as trailers, require external material handling equipment to load/unload a container. Due to the operational flexibility, straddle carriers are commonly used in small- to medium-sized ports. The width of a straddle carrier is about 4.65 m, which enables it to pick up cargo conveniently on the space-restricted wharf.
We recommend this new method because in that way two vessel cranes are able to operate simultaneously due to a simpler handling process and smaller maneuvering requirement. Other advantages include stability, less fuel cost, lower maintenance cost, less damage on the pavement, etc. When straddle carriers are adopted, the new operational flow is shown in
Figure 13.
Straddle carriers can handle both containers and break bulk cargo, but it takes more time to pick up a piece of break bulk cargo. A straddle carrier can pick up one piece of cargo at a time. As straddle carriers are also used for transportation, there is no need for the quay reach stacker and trailers between wharf and yard. Straddle carriers go straight to the yard and release cargo without waiting for a yard reach stacker. Note that 2 straddle carriers heading on opposite sides of the road cannot cross the existing causeway. The corresponding settings are made in the simulation model. We evaluate the performance with varying number of straddle carriers.
Table 3 shows the result of the productivity of different combinations of facilities when employing straddle carriers.
The utilization rate of the vessel cranes when dealing with different kinds of cargo is taken into consideration. The productivity is compatible with the utilization of vessel cranes when dealing with containers. However, for break bulk cargo, the productivity is limited by the number of vessel cranes. In reality, the amount of break bulk cargo is less than half of the containers, so the suggested co-working of 2 vessel cranes is acceptable. For containers, when the number of straddle carriers is increased, the productivity keeps rising as long as the system is not restricted by other facilities. This trend is shown clearly in
Figure 14.
The simulation results show that using straddle carriers significantly improves the terminal productivity. It shows that with 6 straddle carriers, the productivity of the existing port can be as high as 20.8 lifts per hour. Comparing to the existing handling methods, 3 Trailers and 1 YRS which can perform 14.5 lifts per hour, the productivity is increased by about 43.45%. Accordingly, the new handling method is expected to increase the overall port capacity to 182,208 pieces of goods per year, including containers and break bulk cargo.
6. Conclusions
This paper investigates the application of a simulation method in the operational analysis of a single-berth multipurpose terminal. The handling system of the multipurpose terminal is complicated by the cargo mix, various handling methods, variation of process time, and interrupts between process linkages.
Based on the analysis using the established simulation models, the bottlenecks of the current system are identified. The optimal number of equipment (the trailers) employed is suggested to ensure the maximum productivity of the system.
Furthermore, the realistic capacity of the port, which ensures adequate service level, is obtained. Following that, a new handling method using straddle carriers is proposed to enhance the capacity of the existing port infrastructure. The impacts of the new handling methods are evaluated by the simulation models.
To summarize these three handling methods, we label them as A, B and C.
A: Real situation. The data originated from the annual report of the cargo jetty in 2019 and productivity and utilization are unknown.
B: Improved situation with the same handling method. The data originated from the simulation results, 4 trailers, 2 YRSs, 1 QRSs and a vessel crane are involved.
C: Ideal situation with new handling method. The data originated from the simulation results, wherein 6 straddle carriers, 5 YRSs and 2 vessel cranes are involved. Note that the utilization of vessel cranes includes two values calculated when dealing with containers and break bulk cargo, respectively.
It can be seen that our simulation models help evaluate the port performance effectively
Table 4, and normally, it is hard for small to median-sized port to assess each process in the operating system. What is more, based on the analysis and results in the study, further decision making can be done such as investment plan and port design. The simulation model can provide useful data and visual feedback to the port authority. The existing models are able to take into account a wide array of new factors, which help in meeting specific requirements and avoiding unintended consequences.
In conclusion, the study in this paper illustrates the importance of the simulation method in the operational analysis of small multipurpose seaports, which are common in developing countries. It shows how the process performance and constraints can be evaluated by the simulation model, so that the realistic capacity of the port and potential improvement methods can be evaluated.
Author Contributions
Conceptualization, Y.W.; data curation, D.X.; formal analysis, W.X.; funding acquisition, W.X.; investigation, D.X.; methodology, W.X.; project administration, Y.W.; software, S.Z.; supervision, W.X.; validation, S.Z.; visualization, S.Z.; writing—original draft, S.Z.; writing—review & editing, W.X., S.Z., Y.W. All authors have read and agreed to the published version of the manuscript.
Funding
This research was funded by National Natural Science Foundation of China [Grant No. 71971085, 71601079, 71802064] and the Guangdong Natural Science Foundation (Grant No. 2018A030313760).
Institutional Review Board Statement
Not applicable.
Informed Consent Statement
Not applicable.
Acknowledgments
The authors would like to thank the Editors and the anonymous reviewers for their valuable comments and suggestions that helped considerably improve the quality of the manuscript. This work was partly supported by the National Natural Science Foundation of China [Grant No. 71971085, 71601079, 71802064] and the Guangdong Natural Science Foundation (Grant No. 2018A030313760).
Conflicts of Interest
The authors declare no conflict of interest.
Appendix A
Table A1.
Results of all indicators when trailers and quay reach stacker are employed.
Table A1.
Results of all indicators when trailers and quay reach stacker are employed.
| Experiment No. | # Facilities | Capacity/Year | Productivity/Hour | Utilization/% |
|---|
| Trailer | Yard RS | Container/
TEU | Break Bulk/
Ton | Fuel/
Ton | Container/
Lift | Break Bulk/
Lift | Vessel Crane | Quay RS | Trailer | Yard RS |
|---|
| 1 | 2 | 1 | 34,049 | 26,403.36 | 378,914.09 | 10.6 | 8.02 | 63.35 | 41.15 | 57.59 | 68.61 |
| 2 | 2 | 2 | 33,600 | 26,355.12 | 365,815.59 | 10.98 | 8.3 | 65.58 | 42.34 | 56.27 | 40.97 |
| 3 | 3 | 1 | 39,598 | 30,716.82 | 431,984.91 | 14.5 | 10.35 | 86.2 | 55.15 | 60.5 | 94.04 |
| 4 | 3 | 2 | 40,260 | 31,223.34 | 443,982.5 | 14.66 | 10.35 | 87.42 | 61.97 | 58.23 | 51 |
| 5 | 4 | 1 | 40,274 | 31,223.34 | 443,982.5 | 14.69 | 10.35 | 87.27 | 60.46 | 67.18 | 95.11 |
| 6 | 4 | 2 | 40,446 | 31,259.52 | 443,982.5 | 14.83 | 10.35 | 88.29 | 66.8 | 61.96 | 51.45 |
References
- Trepte, K.; Rice, J.B., Jr. An initial exploration of port capacity bottlenecks in the USA port system and the implications on resilience. Int. J. Ship. Trans. Log. 2014, 6, 339–355. [Google Scholar] [CrossRef] [Green Version]
- Munim, Z.H.; Schramm, H.-J. The impacts of port infrastructure and logistics performance on economic growth: The mediating role of seaborne trade. J. Shipp. Trade 2018, 3, 1–19. [Google Scholar] [CrossRef] [Green Version]
- Thanou, E.; Ballis, A. A simulation approach to quay-to-shore storage area container transfer problem. Int. J. Decis. Support Syst. 2018, 2, 221–235. [Google Scholar] [CrossRef]
- Dragović, B.; Tzannatos, E.; Park, N.K. Simulation modelling in ports and container terminals: Literature overview and analysis by research field, application area and tool. Flex. Serv. Manuf. J. 2016, 29, 4–34. [Google Scholar] [CrossRef]
- Lin, J.; Gao, B.; Zhang, C. Simulation-based investment planning for Humen Port. Simul. Model. Pract. Theory 2014, 40, 161–175. [Google Scholar] [CrossRef]
- Scott, D.; Taylor, D.; EI-Solh, S.; Elliott, T. Port Simulation Modelling and Economic Assessment. J. Mar. Sci. Eng. 2016, 1, 16. [Google Scholar] [CrossRef] [Green Version]
- Zhang, C.; Liu, Z.; Chen, Y. Simulation analysis of multi-stage gate operation in container terminals. In Proceedings of the Chinese Control and Decision Conference, Shenyang, China, 9–11 June 2018. [Google Scholar]
- Sislioglu, M.; Celik, M.; Ozkaynak, S. A simulation model proposal to improve the productivity of container terminal operations through investment alternatives. Mar. Policy Manag. 2018, 46, 156–177. [Google Scholar] [CrossRef]
- Uribe-Martes, C.J.; Rivera-Restrepo, D.X.; Filippo, A.B.-D.; Silva, J. Simulation Model of Internal Transportation at a Container Terminal to Determine the Number of Vehicles Required. In Inventive Computation Technologies Lecture Notes in Networks and Systems; Springer: Cham, Switzerland, 2019. [Google Scholar]
- Hur, S.-H.; Lee, C.; Roh, H.-S.; Park, S.; Choi, Y. Design and Simulation of a New Intermodal Automated Container Transport System (ACTS) Considering Different Operation Scenarios of Container Terminals. J. Mar. Sci. Eng. 2020, 8, 233. [Google Scholar] [CrossRef] [Green Version]
- Tama, M.I.; Siswanto, N.; Suparno; Aqsha, B. Discrete event simulation modelling for classifying the container yard availability considering dock unloading activity. In Proceedings of the IOP Conference Series. Materials Science and Engineering, Chennai, India, 16–17 September 2020. [Google Scholar]
- Stojaković, M.; Twrdy, E. Determining the optimal number of yard trucks in smaller container terminals. Eur. Transp. Res. Rev. 2021, 13, 1–12. [Google Scholar] [CrossRef]
- Zhang, Y.; Aguilar, R.; Lazcano, G. Using Simulation to Evaluate and Optimize a Port System—A Case Study. In Proceedings of the 15th Triennial International Conference on Ports–Connect Innovate Transform, Pittsburgh, PA, USA, 15–18 September 2019. [Google Scholar]
- Agostino, I.; Sousa, S.; Frota, P.; Daher, R.; Souza, A.M. Modeling and Simulation of Operations: A Case Study in a Port Terminal of Vale S/A. In New Global Perspectives on Industrial Engineering and Management; Lecture Notes in Management and Industrial Engineering; Springer: Berlin/Heidelberg, Germany, 2019. [Google Scholar]
- Preston, G.C.; Horne, P.; Scaparra, M.P.; O’Hanley, J.R. Masterplanning at the Port of Dover: The Use of Discrete-Event Simulation in Managing Road Traffic. Sustainability 2020, 12, 1067. [Google Scholar] [CrossRef] [Green Version]
- Sriphrabu, P.; Chamnanlor, C. Improving Service Efficiency of a Container yard through Simulation Modeling. In Proceedings of the 2020 IEEE 7th International Conference on Industrial Engineering and Applications, Bangkok, Thailand, 16–21 April 2020. [Google Scholar]
- Ansorena, I.L. A simulation model of container terminals. The port of Valencia case study. Int. J. Ind. Syst. Eng. 2020, 37, 15–26. [Google Scholar] [CrossRef] [Green Version]
- Kusuma, E.; Arvitrida, N.I. An integrated analysis of port and coal storage development plan in a mining company with a simulation approach. IOP Conf. Ser.: Mater. Sci. Eng. 2021, 1072, 012042. [Google Scholar] [CrossRef]
- Pimpanit, P.; Jarumaneeroj, P. 2021 IEEE 8th International Conference on Industrial Engineering and Applications. Available online: https://www.industryevents.com/events/2021-ieee-8th-international-conference-on-industrial-engineering-and-applications-ieee-iciea-2021 (accessed on 11 August 2021).
- Muravev, D.; Hu, H.; Rakhmangulov, A.; Mishkurov, P. Multi-agent optimization of the intermodal terminal main parameters by using AnyLogic simulation platform: Case study on the Ningbo-Zhoushan Port. Int. J. Inf. Manag. 2021, 57, 102133. [Google Scholar] [CrossRef]
- Hervás-Peralta, M.; Rožić, T.; Poveda-Reyes, S.; Santarremigia, F.E.; Pastor-Ferr, J.-P.; Molero, G.D. Modelling the performance of port terminals using microsimulation. Eur. Transp. Trasp. Eur. 2020, 76, 1–11. [Google Scholar]
| Publisher’s Note: MDPI stays neutral with regard to jurisdictional claims in published maps and institutional affiliations. |
© 2021 by the authors. Licensee MDPI, Basel, Switzerland. This article is an open access article distributed under the terms and conditions of the Creative Commons Attribution (CC BY) license (https://creativecommons.org/licenses/by/4.0/).


