1. Introduction
As the need for a more competitive and sustainable maritime industry arises, companies search for new systems capable of optimizing their routes as well as Reducing their costs. Academic research has reviewed the usefulness of Ship Routing Systems as tools providing the shortest and safest route with the lowest fuel consumption [
1]; its core purpose is to develop the optimum sailing course considering the nautical charts, the forecasted sea conditions and the particulars of the ship for a specific voyage. However, at short distances, these systems remain unexplored [
2]. That is of special relevance for the Mediterranean Sea.
There are many publications that establish which are the factors that condition the Short Sea Shipping in the Mediterranean and which impact have for the function of costs of this mode of transport [
3,
4]; generally, these articles analyze its efficiency and sustainability [
5,
6]. However, some knowledge on climatology and meteorology is key to understand the case that occupies us; the climatology of the Mediterranean has been amply studied by numerous authors [
7,
8,
9] and continues to be a very present element in the recent academic production [
10,
11,
12].
The objective of this contribution is to analyze the wave trends of the western Mediterranean affecting the main Short Sea Shipping routes of the region. The area surveyed, the basin of the western Mediterranean, has also been studied in the last years, especially its characteristics [
13,
14,
15]. The western Mediterranean provides a fount of indispensable resources for Europe’s southern countries and the north of Africa.
In order to determine the best course at any season, it is necessary to consider the main variables that affect the Short Sea Shipping in the Western Mediterranean to pinpoint which is the variable that has the strongest impact on the behavior of the ship and the functions of costs. Wind-generated surface waves are an important factor defining marine storminess and the marine environment [
16,
17,
18]; waves are also especially important when considering the consumption of fuel, the main factor that will affect the variable cost of the Short Sea Shipping [
19].
The objective of this contribution is to provide a tool for forecasting the waves in the Western Mediterranean basin, using historical data and computation models.
In order to assess the impact of the meteorological conditions in the Western Mediterranean, a practical example considers the maritime route between Barcelona and Genoa. This route is assessed by the means of an optimization routing system coupled with the statistical data collected through the web of Puertos del Estado, based on a 59-year long simulation (1958–2017) of the wave field in the western Mediterranean Sea. Despite the results provided being approximations of the truth, a detailed discussion of its accuracy and geographical distribution is given in the text; the results show the different characteristics of the different parts of the western basin for each season of the year.
2. Materials
Buoy data have become, since a while ago, the standard method for the collection of real wave data in the open sea [
17]. However, the buoys are very sparse, and only a limited number of them are available. In the case of the buoys of
Puertos del Estado, its proximity to the coast and the disparity among the periods studied make it difficult to establish the pool of data to study.
Puertos del Estado is the government agency responsible for the coordination and efficiency control of the Port Authorities of the Spanish Port System. On its official website (
http://www.puertos.es/en-us (accessed on 17 November 2020)) can be found, among others, oceanographical information and the reports used in this analysis.
For this reason, the present study has been based on model data simulated by Puertos del Estado (SIMAR-44 and WANA points), which offers an extensive temporal series updated and generated with a time cadence for the period 1958–2017; the synthetic data offer a wider period with results more suitable for a statistical survey of the climatological variables.
The pool of data, called SIMAR, is made of a time series of parameters for numerically modelled waves. The reports studied presented the statistical characterization of the waves, in the medium term; the reports were completed with a statistical description of the series of heights, periods and directions of the waves. Three types of statistics were included for the waves: height and period distributions, wave roses, and height and wave direction distributions. This survey has centered, especially at the distributions of height and period to find a relation between the seasonal climate and the behavior of the waves. However, the direction of the waves has been observed in order to determine which is the most repetitive.
Furthermore, in order to better analyze the climatic conditions in the Western Mediterranean, the optimization routing system software SIMROUTE (UPC-BarcelonaTech, Barcelona Spain) is used to compare the results obtained with the meteorological conditions observed for the route of Short Sea Shipping linking Barcelona with Genoa for each month of the year 2017. The SIMROUTE is a software designed for maritime route optimizations that performs simulations of short and long distances. This software has been developed by a team of researchers at the Technical University of Catalonia (UPC-BarcelonaTech) in MATLAB language. The spatial scope of SIMROUTE is the Mediterranean Sea, fully or partially selected, depending on the longitudes and latitudes introduced by the user. In order to run the program, there are several parameters to introduce: port of departure, port of arrival, vessel speed and the wave field for the days of the voyage to simulate.
3. Methodology
The combined use of these sources has been the principle followed in this study. Such a procedure is not straightforward and requires several steps.
First, the points SIMAR, distributed at the basin of the Western Mediterranean, need to be collected, checked and combined, providing the final dataset. Some of those points, after being considered, were disregarded for being too close to the coast. Secondly, a selection of the meteorological variables was made using the WAM numerical model. This survey considered the significant height (Hs) at % and the direction of the swell since they are the parameters with the most influence when navigating. After that, the data were sorted according to seasons and zones established, which was tabulated and seasonal graphs for each zone were created. Then, the average distribution, based on Weibull distribution, is considered adequate for wave forecasting and for the design of ships and port infrastructures because the sharing of the wave fields coincides with this function [
20], for season and zone was calculated in order to determine the behavior of the variables selected for the period studied. The data were assessed by seasons and zones to establish which challenges they pose for the SSS lines. In parallel, the differences of time and fuel for the route studied for the cases of the optimal route and the minimal distance route were obtained. Finally, the results obtained through the statistical analysis of the conditions were compared with the interpolated wave fields generated with the SIMROUTE software for the days chosen.
SIMROUTE algorithm, is an A * based model that, taking data from significant wave height and their direction in a marine area, can draw a map of difficulty for a vehicle (a ship) that tries to go from one point to another. Then the output is a suggested path whose main goal is to reduce the navigation time.
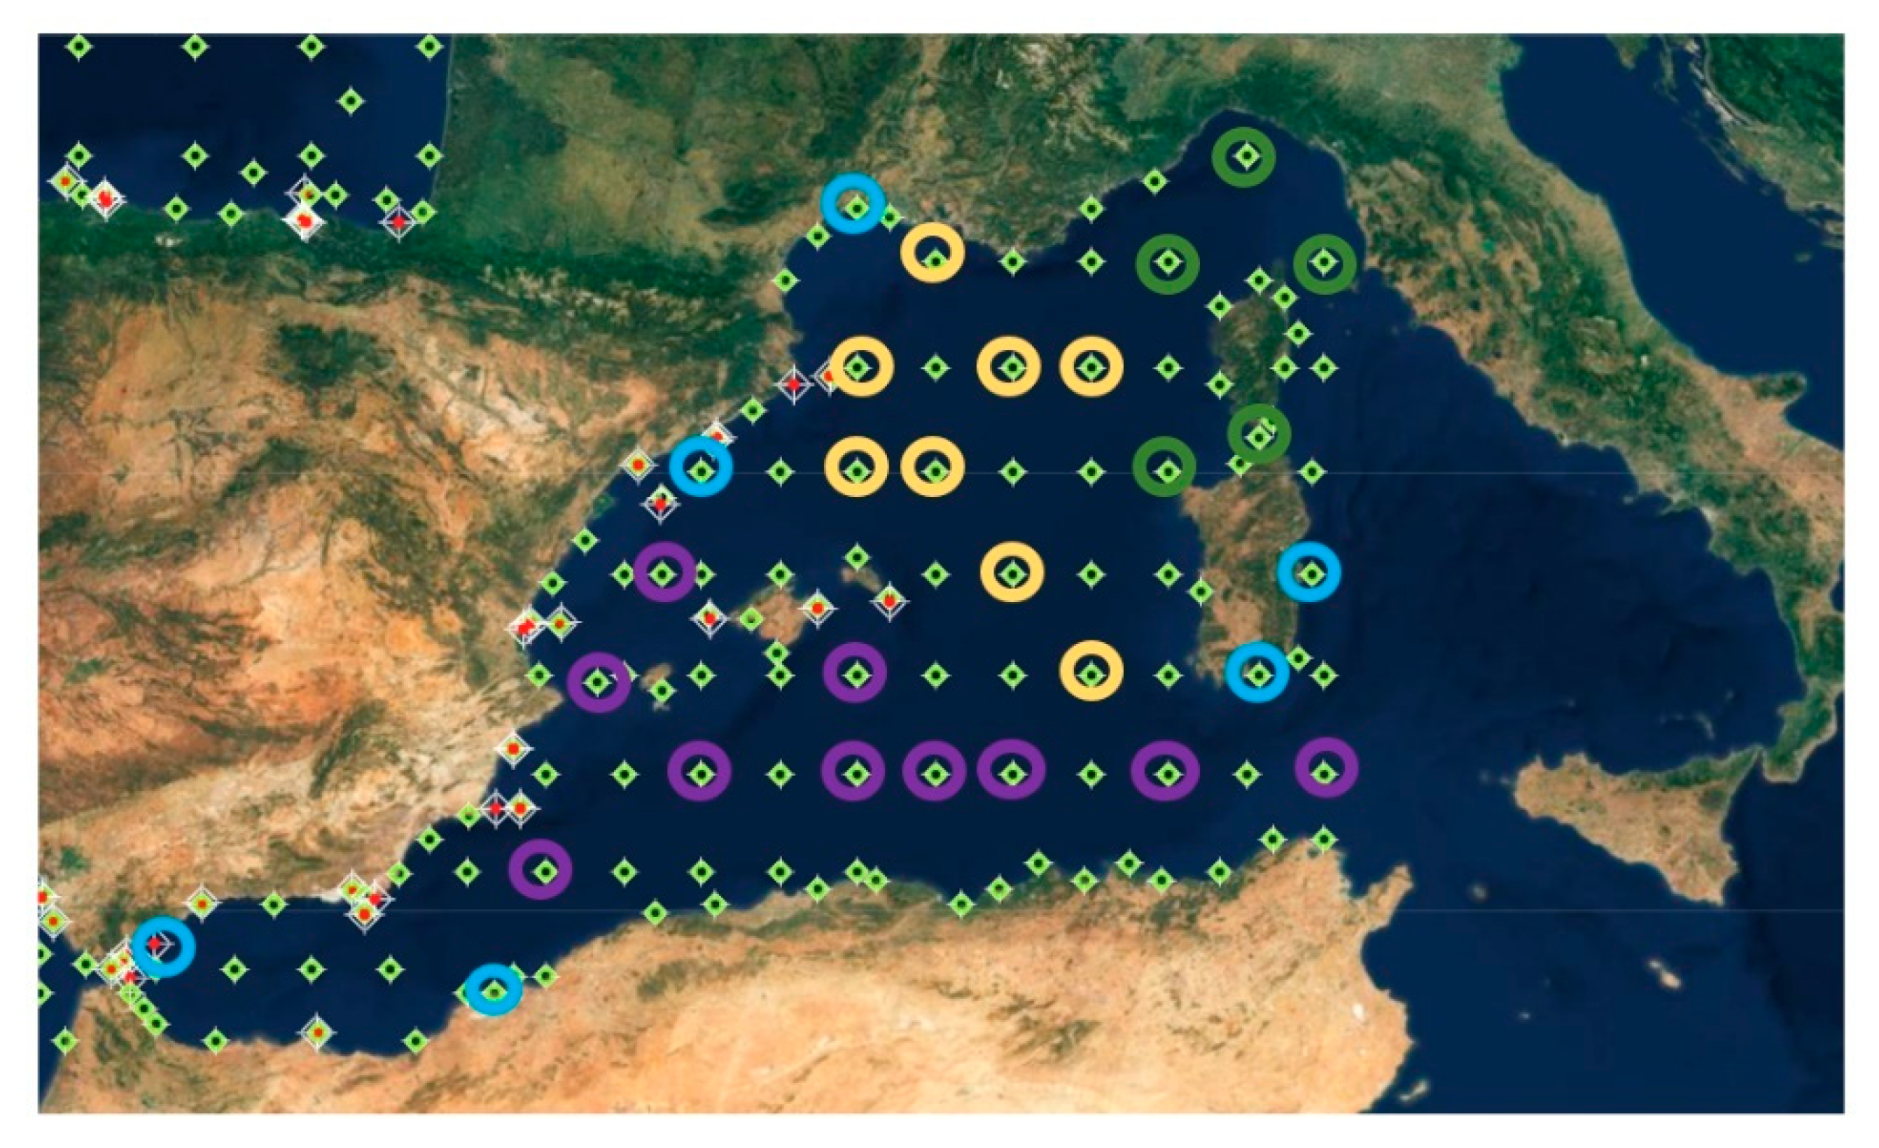
The available data for each point studied, regarding its annual distribution along the period 1958–2017, was considered in order to establish distinct zones that presented a similar behavior, which resulted in four zones: area 1 (in green), area 2 (in lilac), area 3 (in yellow) and the coastal area (in blue) (see
Figure 1). This last area is formed by points that, due to their proximity with the coast, showed a characteristic distribution that could induce errors if considered together with the points of the other areas. Therefore, the areas studied are limited to the first three. Although initially the identification of each one of the points resulted crucial for their classification, once the zones were established, the points have been treated as a dataset.
Finally, the program SIMROUTE was run for the Barcelona-Genoa route for days 13 and 14 of each month of the year 2017. The analysis considered the interpolated wave areas for the zone studied for each month, in order to assess if the real data resembled the statistics. The results obtained were compared with the data of swell analyzed for each season to establish similarities and/or dissidences.
4. Results and Discussion
The following tables (
Table 1,
Table 2 and
Table 3) show the average distribution for each season at the defined areas of the western Mediterranean.
Studying the seasonal behavior, it was observed that all three areas showed a similar evolution; in the period comprised between December and February, the percentage of waves with a significant height of more than three meters increases, surpassing 5 m, while, in the period comprised from March to May, the data show that, although the distribution is similar, the incidence of waves with a superior height of 3 m, diminishes roughly by a 50%, compared with the previous season [
21,
22].
In all of them, in the period comprised by the months of June, July and August, the conditions of the sea improve notoriously, with a decrease of 40% of the significant height from 2 m, in comparison with the previous season. On the other hand, in this same period, increases the incidence of a swell of less than 0.5 m. Finally, the months of September, October and November show a new increase in the incidences of the swell from 2 m by a 50%. However, although the changes of the significant height of the swell are similar across the three areas established, they do not have the same impact on them, since they present distinct characteristics [
23].
It can be appreciated that in area 1, there is a swell with a minor significant height arriving, in general, up to 1.5 m. Area 2, that has most of its points situated among the 36⁰ and the 38⁰ of latitude, presents a significant height of the swell minor than area 3, but higher than area 1. Area 3 stands up for a higher incidence of significant heights from 2.5 m to 5 m, at any epoch of the year, excluding the summer, where waves of 5 m result almost non-existent in all the areas.
Comparing these data with the interpolated waves area generated by the SIMROUTE for the days selected of each month, a similar behavior was observed. From the months of December to January, the swell represented has a height of 2–3 m and, in some points, it reaches up to 5 m (
Figure 2). Conversely, for the months from March to May, the height of the waves diminishes gradually, never surpassing 3.5 m (
Figure 3). From June to August, the season that presents the best conditions, the swell does not surpass the 2 m, with certain exceptions in some points close to Cape Corse in July. Lastly, whereas September and October present some similar conditions compared with the period of March–May, November presents an increase at the height of the swell, especially in area 2, that would correspond at a maritime storm, very common in this month of the year.
The Mediterranean has a specific climate, with small peculiarities depending on the area of study. In general, it can be expected winters mildly cold, but humid and scarce rain, soft and rainy springs, warm and dry summers, and soft autumns with a high potential of torrential rains; depending on the area and minor sea, the meteorological conditions encountered could differ.
Area 1 is situated in the Ligurian and the Tyrrhenian sea. These seas are characterized for being warm, even in the winter, but with torrential rains in the autumn. Area 2, located close to the Moroccan and Algerian coasts, presents some conditions distinct of the Mediterranean Sea, but without the peculiarities of his neighboring zones. This is the reason why its values in the table fall in the in-between range compared with the other two areas. Area 3 is situated in the Mediterranean Sea, next to the Gulf of Lion and the Balearic Sea.
The prevailing winds in this area of the golf are the North-wind, the Tramontana and the Mistral, which are the unchaining of the most important storms of the Western Mediterranean, with a swell that can exceed the 8 m of height. Similar behavior can be observed, although not as accused, in the interpolated wave field for the month of February (
Figure 2). Conversely, at the Balearic Sea, the episodes of rain are usually coupled with the arrival of the Leveche wind and the Levant wind; they also bring very intense precipitations in autumn and occasional floods (
Figure 4 and
Figure 5).
Regarding the effect that these conditions have on navigation, the most affected months are January, February and November. The poor weather conditions in January and February are associated, as it has been said before, with the Tramontana and at the Mistral, as it can also be observed in areas 2 and 3, where most of the swell came from the North and the West. On the contrary, the adverse weather conditions of November are caused by a north flux that provokes fanned strong winds from the North-West, due to the presence of an anticyclone in the Atlantic and a low site in the Gulf of Lion, that worsened the navigational conditions in the area. Of the three months, November is the most affected by meteorological conditions.
Although the Mediterranean Sea is weighted and studied as a whole, the fact is that it is formed by twelve seas, most of them known by their own name. Of all these seas, the Ligurian, the Tyrrhenian and the Balearic Sea are the main seas of interest for this survey since the points studied are mostly placed in their waters, which depicts climatological differences (
Figure 6).
5. Conclusions
The data studied in this project give a detailed picture of the climatology of the western Mediterranean and confirms the known concept of Mediterranean weather. The latter has a very similar climate in all its extensions, although with small peculiarities. In general, mildly cold winters can be expected, but humid and without rain, gentle and rainy springs, hot and dry summers, and soft autumns with a high risk of torrential rains. The climatological peculiarities of the western Mediterranean basin contribute directly to the generation of strong local winds, intense depressions, large floods and gusts.
The advantages of using the optimization of routes is an effective method to operate the ships, increasing the safety and reducing the time of navigation and the consumption of fuel and thus pollutant emissions. There have been studies to develop methods of effective calculus to draw the optimal route, most of them dedicated to ocean crossing passages, where the mentioned advantages can be easily observed. In the case of this project, the Ship Routing System SIMROUTE is used to assess the impact of the meteorological conditions in the Western Mediterranean through the analysis of the maritime route between Barcelona and Genoa, and how the knowledge of the weather conditions can improve the decided track, considering consumption but also providing the chance in a future to include other variables like stability or seasickness risk on board.
The comparison between the statistical data and the interpolated wave fields of the Barcelona-Genoa route reinforces the image of the climatology of the Western Mediterranean presented. Through the usage of the SIMROUTE software, in conjunction with the database created, it is possible to compare the real conditions of the state of the sea with the period 1958–2017 which allows detection of meteorological anomalies in the area across all seasons.


