1. Introduction
Modern turbochargers (TC) of large diesel engines enjoy a high boost pressure ratio in the compressor of up to 5 and above. They create high pressure of the charged air, thus providing high-specific power and high-efficiency operation of the large engine with low-level emission of carbon oxides and soot [
1]. High efficiency of MAN MC (this type of MAN engine uses a mechanically driven camshaft for fuel injection) and MAN ME (electronically controlled engines) diesel engines with actual specific fuel consumptions of 160–170 g/kWh is ensured by the high pressure of the charged air, among other factors [
2,
3]. If the turbocharger loses performance, the power and efficiency of the diesel engine rapidly decline and the emission level of carbon oxides and soot increases [
1,
2,
3].
The allowable hazardous emission level of marine diesel engines in operation is limited by the current requirements of the International Maritime Organization (IMO) [
4]. Since the overwhelming majority of various maritime transport vessels use diesel power units, the matter of their efficient and safe operation is undoubtedly of current interest [
5,
6,
7].
When a marine diesel engine is operating in light-load conditions, the incomplete combustion products clog up the exhaust manifolds. This results in a change in the flow capacity of the exhaust manifolds as well as the character of the gas internal flow in front of the turbocharger wheel blades. Pulsations might occur, which cause the rotor to vibrate [
8,
9,
10]. An increased level of rotor vibration creates additional loads on turbocharger bearings and reduces their operational life. In the case of microdefects in the bearings, the vibration level of the rotor increases even further, which might lead to a severe failure [
11].
Acoustic control of the turbocharger in operation makes it possible to detect the dangerous tendency for the rotor vibration level to increase and indicates the need to clean the flow channel [
8,
9,
10,
11]. In some cases, such control might prevent turbocharger failure, which typically leads to a considerable loss of power and efficiency in the entire engine [
1,
11,
12,
13,
14].
Many authors have previously pointed out the necessity of conducting periodic operational checks of the technical condition of the turbocharger in operation [
11,
12,
13,
14]. In such an event, prompt and timely diagnostics during operation can be made by analysis of the external acoustic signals. In papers [
11,
12] it was indicated that within the spectrum of acoustic oscillations of the turbocharger, regardless of its technical condition, a compressor wheel blade frequency harmonic is always present. The amplitude of the blade harmonic of the compressor considerably exceeds (two, three times or even more) the level of surrounding harmonics in the turbocharger spectrum [
8,
12]. Meanwhile, the harmonic of the main rotation frequency of the turbocharger rotor might have insignificant amplitude and might not be distinguishable against the noises of the spectrum [
8]. The turbine side blade frequency has generally significantly lower amplitude because of the much more stable and smooth confuser-type gas flow. For the large turbochargers with axial-type turbines, which have a number of blades three to five times greater than the compressor wheel, it is impossible to make a mistake between the compressor and turbine blade harmonics. Thus, the compressor blade harmonics are the primary source of the turbocharger spectrum analysis and can be identified in the spectrum using the method of limits.
This paper presents the diagnostic method based on the determination of the blade harmonics in the turbocharger spectrum, further calculation of the main rotor speed, as well as the subsequent analysis of the harmonic amplitude at its main frequency. The amplitude of the main frequency harmonic characterizes the general vibration level of the turbocharger rotor [
5,
6,
15].
The article begins with an analysis of the acoustic signals of the TCA 66 and the VTR 564 turbochargers of low-speed diesel engines during their normal operation. The limits of normal and abnormal levels of the amplitude of the main harmonic are illustrated by these two examples. These cases, however, are specific, so it is necessary to analyze the acoustic spectrums of a larger number of turbochargers to develop general recommendations. Nevertheless, we believe that the information will be useful for marine engineers since these engines are widely used in merchant marine fleets.
To make the results of our analysis more reliable, the algorithm to eliminate the leakage effect is proposed, which helps to calculate more accurately the frequency and amplitude of the given signal.
A functional diagram of the continuous turbocharger monitoring system is proposed as the general conclusion of the paper.
The method in question can be applied practically; to do so in most cases, it would suffice to have a smartphone or a personal computer with the dedicated software. The method lies in the analysis of the acoustic signal that is generated by the turbocharger compressor while the diesel engine is operating under load.
2. TCA 66 Turbocharger of Low-Speed Diesel Engine Acoustic Analysis
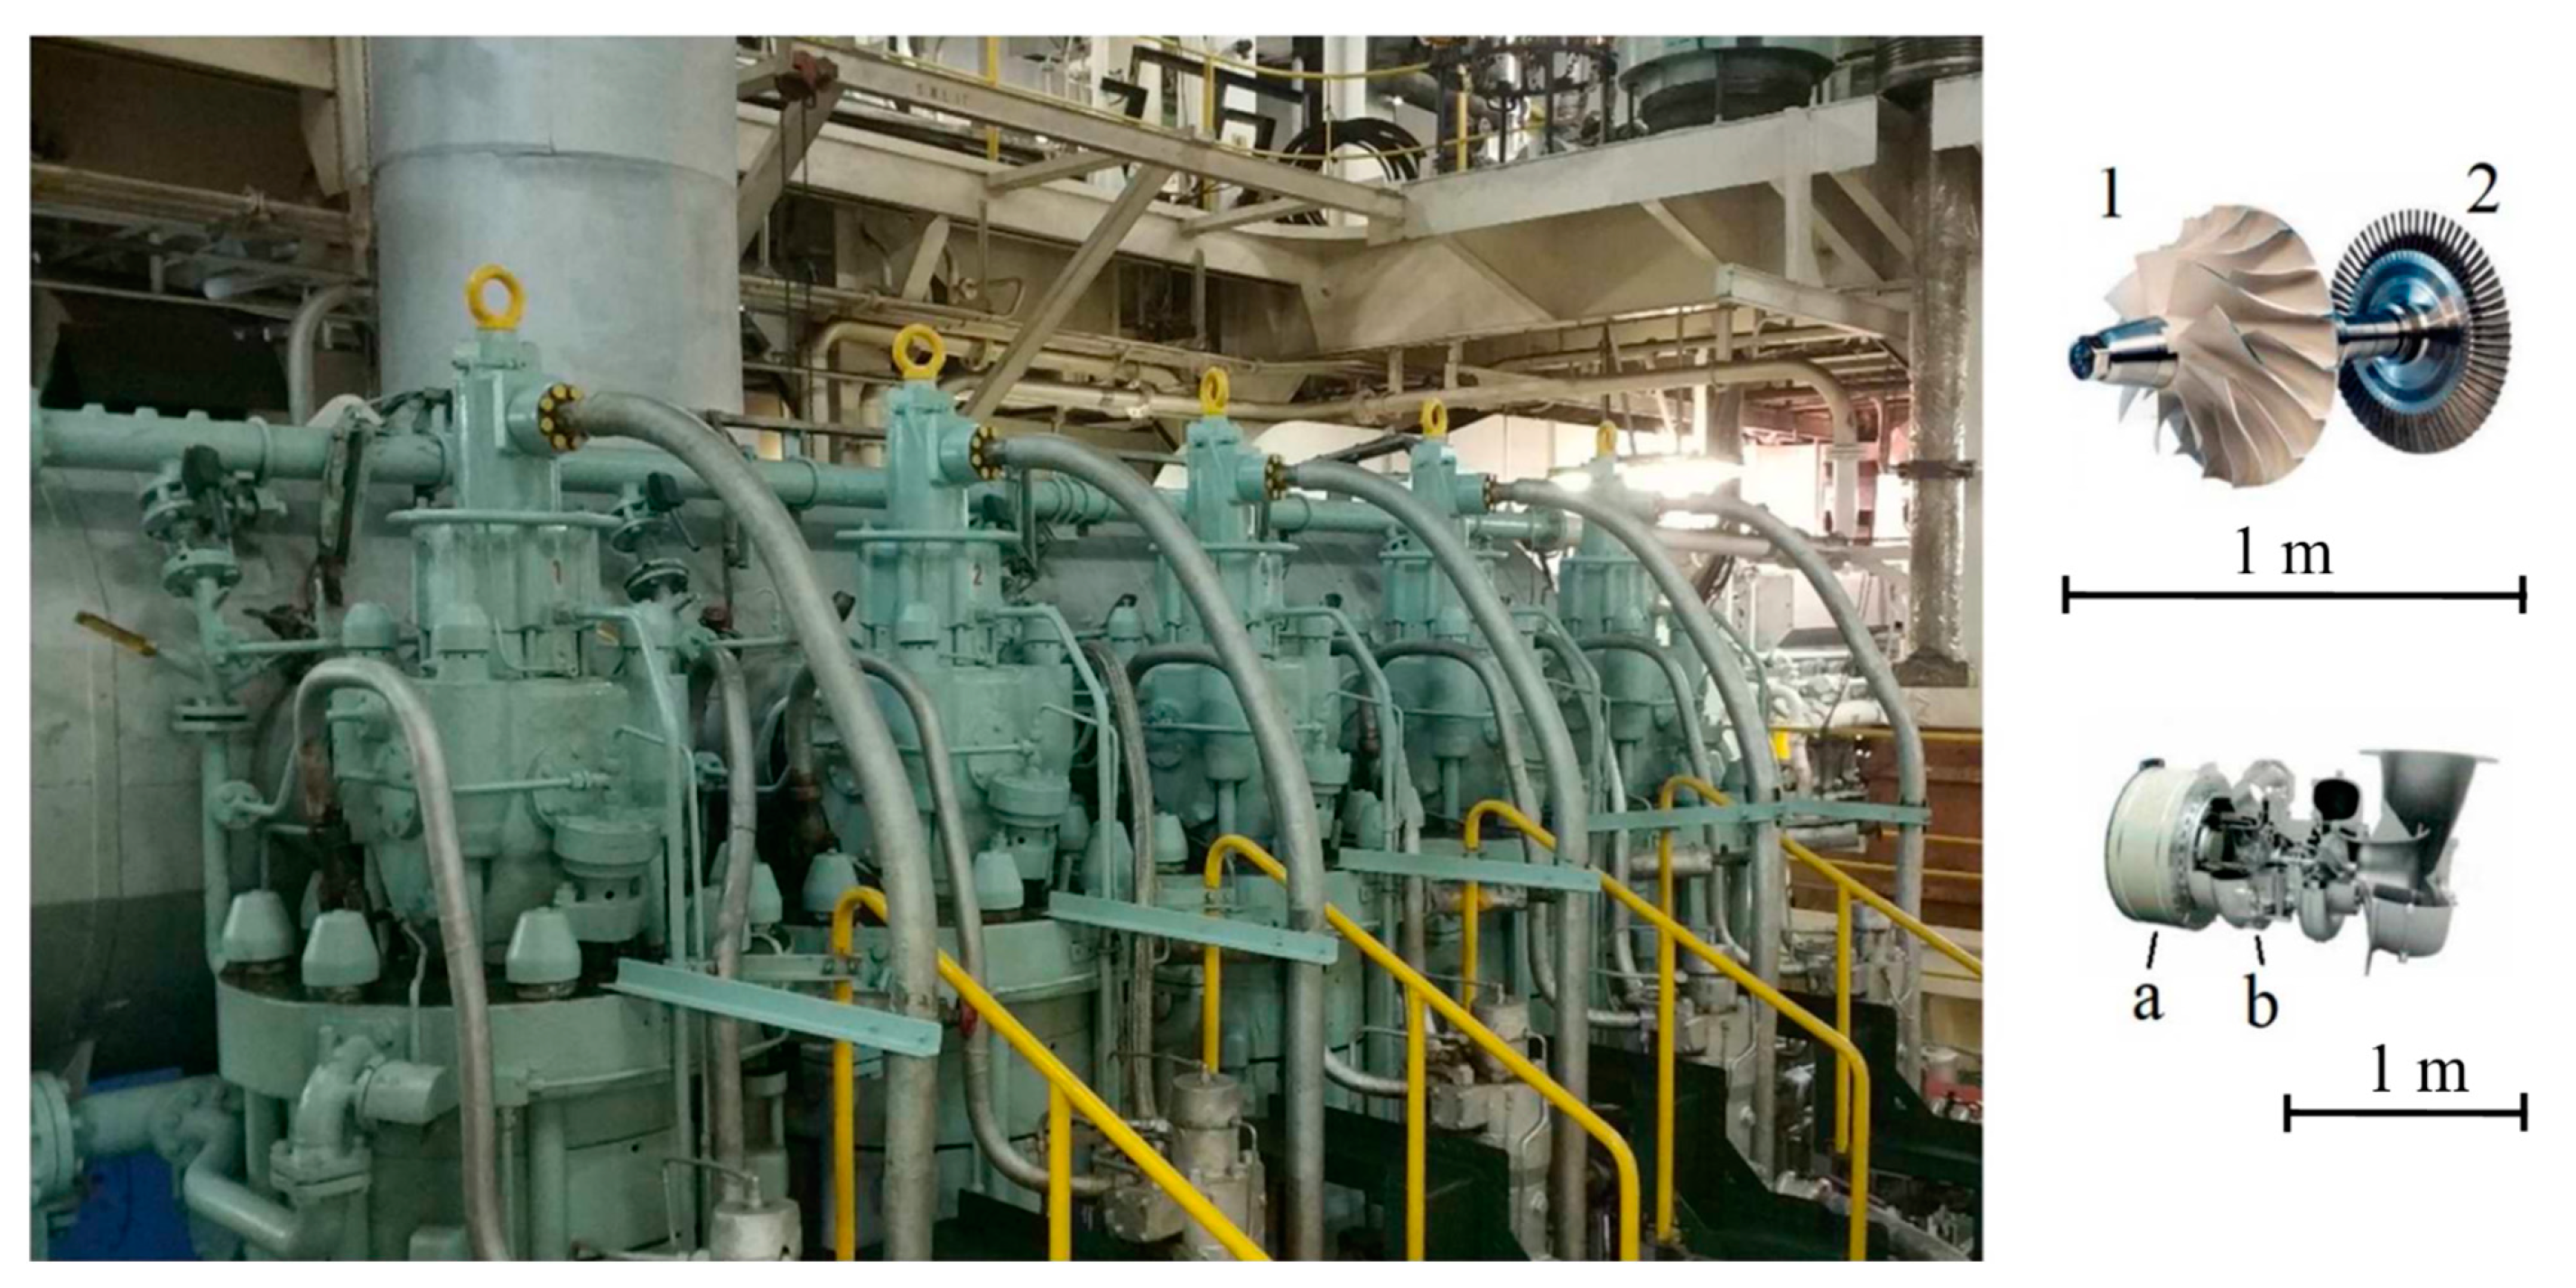
The registration and analysis of acoustic signals of the TCA 66-20072 turbocharger [
3], which is installed on the MAN 5S60MC main diesel engine [
2] (
Figure 1), was made at an engine speed of 85 rpm. The estimated engine brake power was ≈ 4500 kW or 50% of MCR (Maximum Continuous Rating), defined as the maximum output of an engine. According to the sea trial results, the corresponding turbocharger speed should be about 10,300 rpm (see
Table 1). The compressor impeller wheel of the TCA66-20072 has 22 blades (11 full blades and 11 splitter blades) [
3].
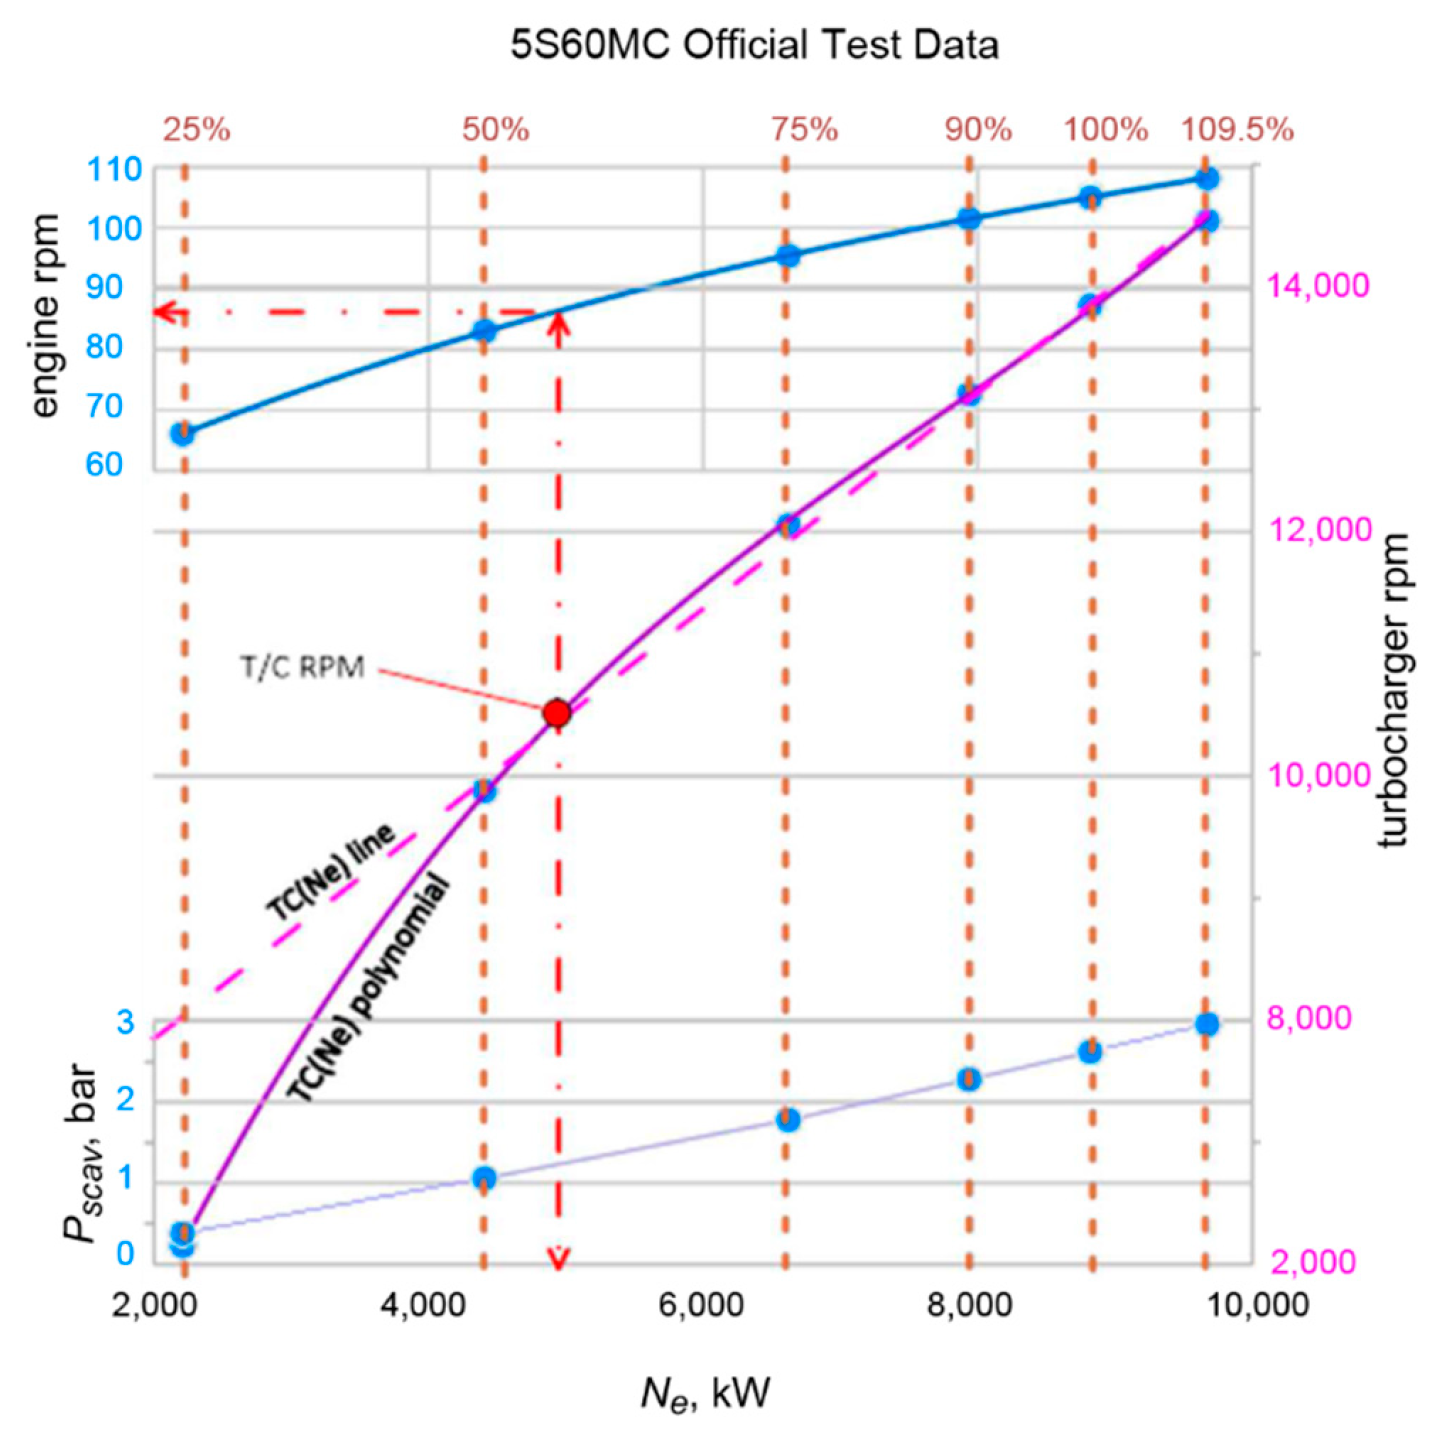
Mechanical engineers provide engine performance analysis during its operation to estimate current engine and turbocharger conditions. The results of the performance analysis should be compared with manufacturer’s official test data. Among the most important engine parameters for diagnostics are crank speed and brake power, brake specific fuel consumption, supercharged air pressure, compression pressure and maximum in-cylinder pressure, exhaust gas temperature at the turbocharger inlet and outlet, and turbocharger speed (
Table 1 and
Figure 2). According to the classifying societies requirements, the main engine should operate normally at 110% of maximum continuous rating (MCR) during 1 h.
Deviations from these parameters for a given engine operating point may be caused by some failures. Thus, for instance, a compression pressure
Pcomp drop may be caused by cylinder liner wear, piston rings breaking or sticking, exhaust valve seat leakage/wrong timing, or by smaller supercharged air pressure
Pscav. The reasons for a maximum combustion pressure
Pmax decrease are generally related to the high-pressure fuel-injection equipment. Smaller exhaust gas temperature differences at the turbine inlet and outlet ∆
TC together with turbocharger speed
TCrpm reduction indicate flow duct fouling (
Table 1).
The suggested method allows the ongoing turbocharger speed to be measured at engine operation. The acoustic compressor signal registration could be carried out either at the compressor inlet filter (
Figure 1a) or directly at the compressor volute surface (
Figure 1b), as was learned from the experiment. The second option (point b) benefits from the inlet flow aerodynamic noise absence.
The aerodynamic noise could also be removed from the recorded signal if the microphone (positioned at point a) has a perpendicular orientation to the turbocharger intake filter surface, thereby providing smooth air flow around the microphone. The influence of the noise from other engine mechanisms is relatively small, as their sources generally have a big enough distance from the microphone position, as was learned from the set of experiments carried out on the number of low-speed marine engines.
At engine operation the compressor impeller blades generate oscillations in the general spectrum of vibrations regardless of the turbocharger’s technical conditions, as was experimentally proven [
5,
8,
11]. Spectral analysis shows that the acoustic signal from the compressor blades has a frequency equal to the turbocharger rotor speed multiplied by the number of blades (see
Figure 3):
were
υb—blade frequency of the turbocharger, Hz;
nb—total number of compressor wheel blades; and
TCrpm—turbocharger speed, rpm.
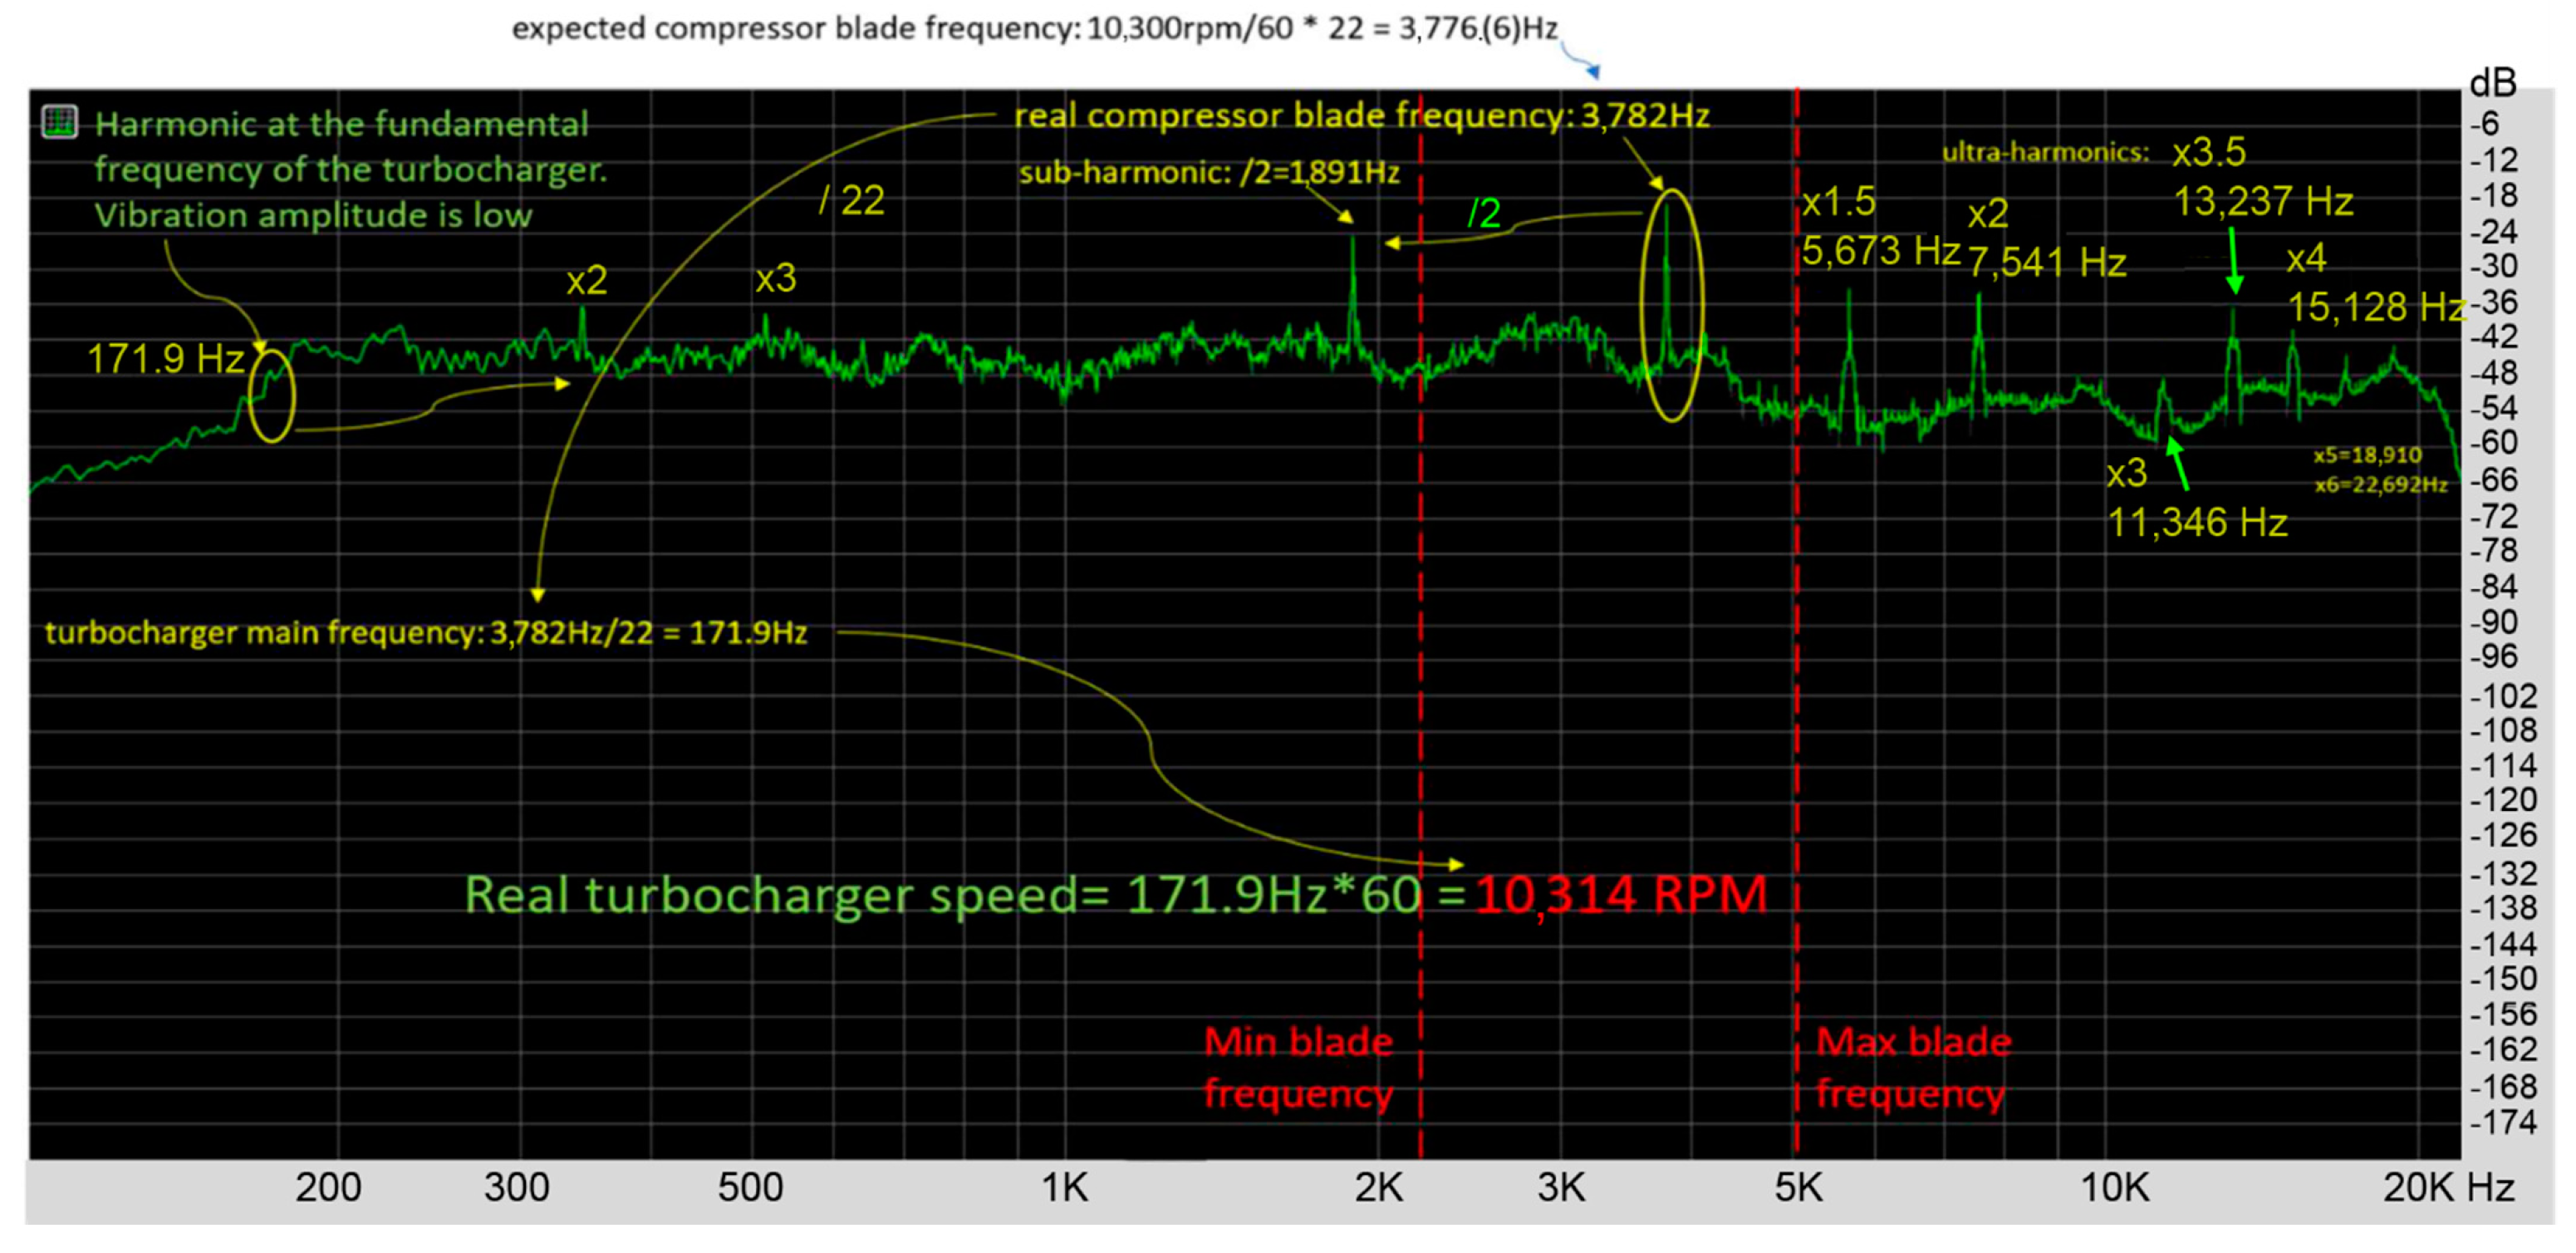
Assuming that current engine operating point is between 100% and 25% of MCR, the top and bottom limits for the turbocharger speed could be estimated (for the MAN 5S60MC engine):
Max blade frequency υbmax = nb × max(TCrpm)/60 = 22 × 13,850/60 = 5078 Hz,
Min blade frequency υbmin = nb × min(TCrpm)/60 = 22 × 6150/60 = 2255 Hz.
Thus, the blade harmonic in the general turbocharger spectrum lies between these limits (
Figure 3):
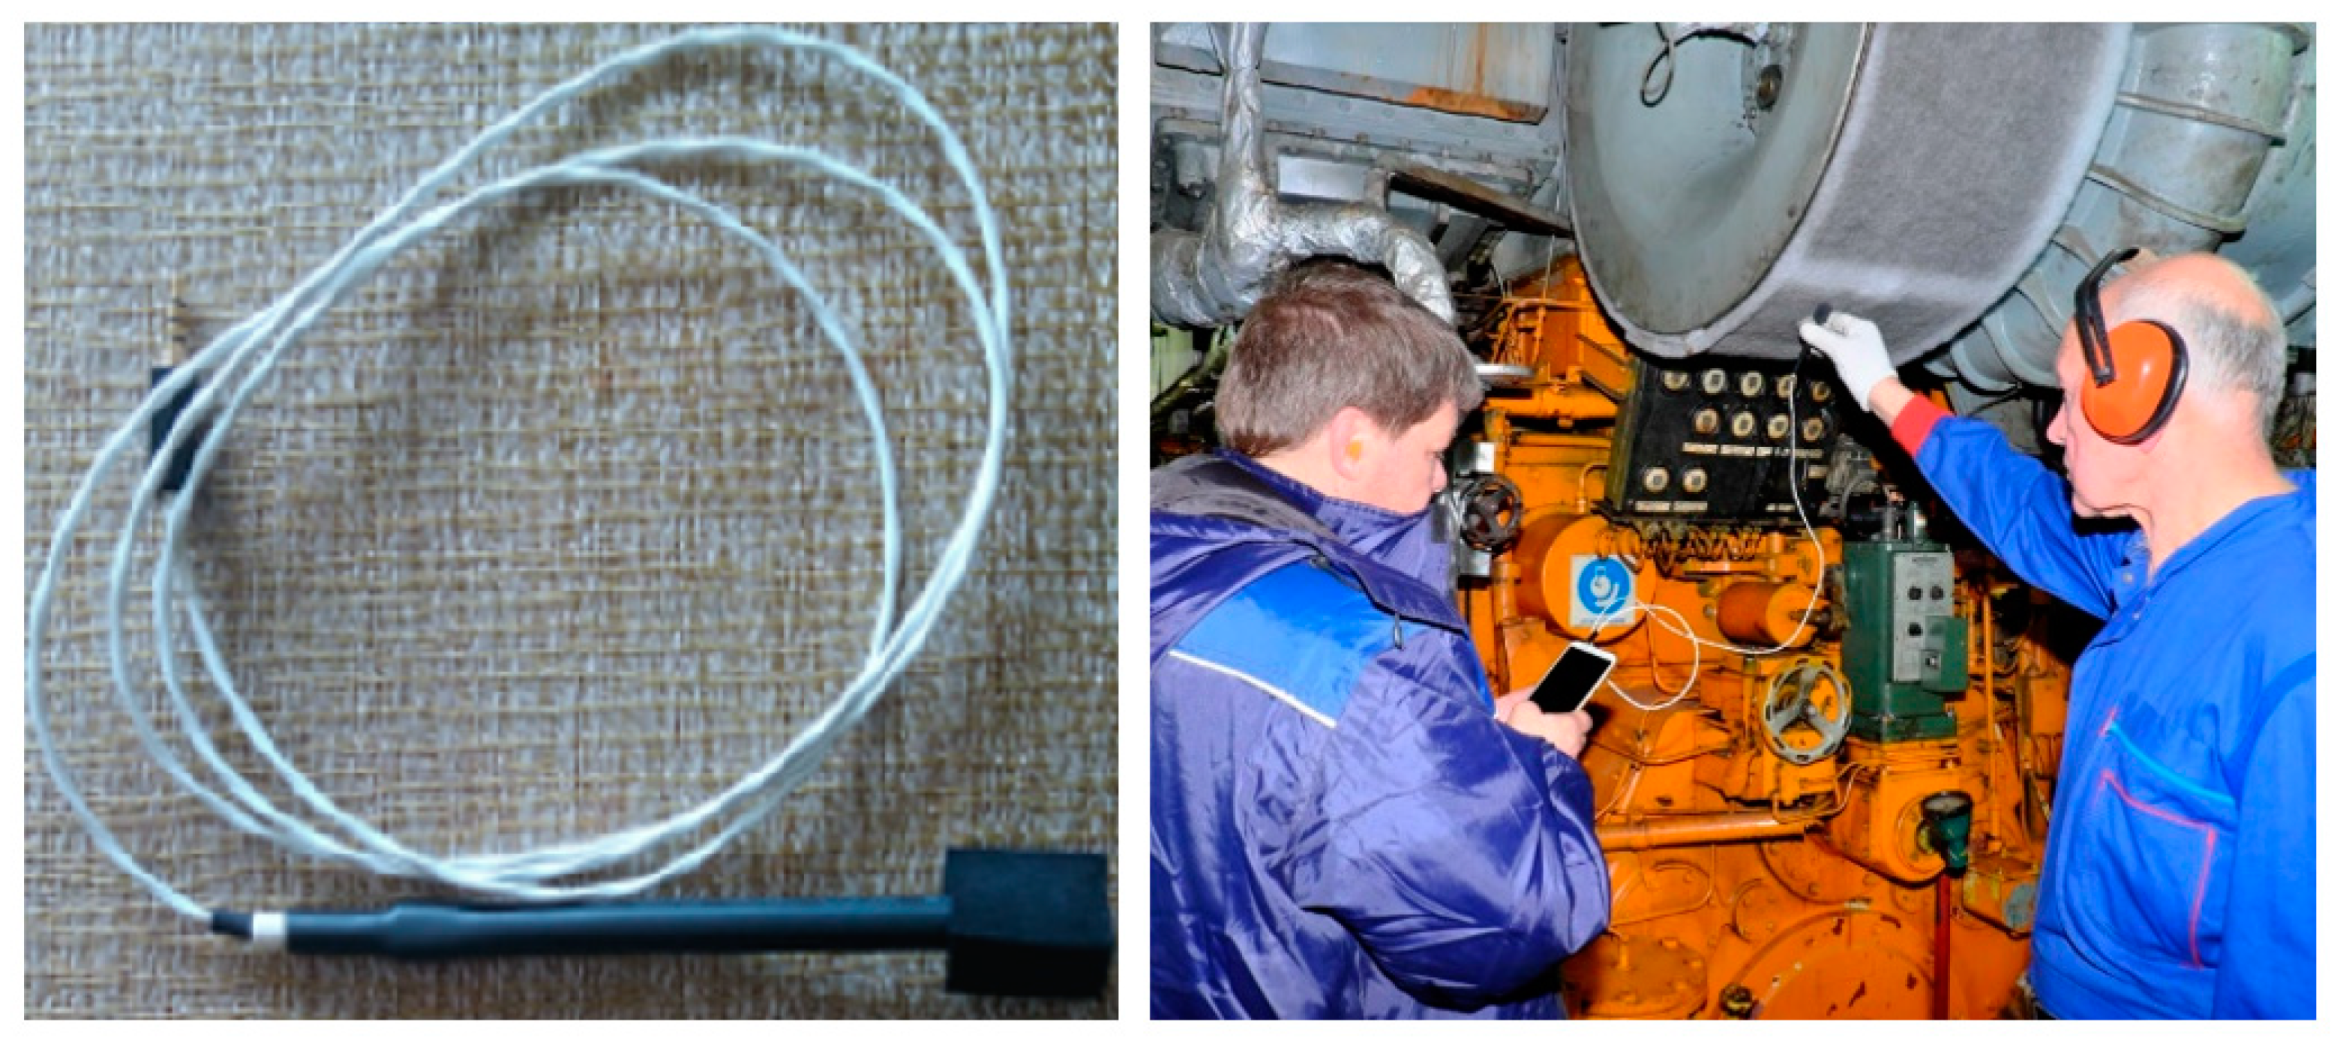
The experimental measurements (
Figure 4) were made with the electret microphone EM-4015-BC produced by Soberton Inc., Minneapolis, USA [
16]. The microphone has high sensitivity, a wide pass band, a narrow directional pattern, little distortion, and a low noise level. It should be noted that due to the current microphone upper limit, the presented spectrum above 12 kHz could be incorrect, but it is not significant, as for low-speed diesel engines turbochargers it is not necessary to record signals over 10 kHz, so it does not affect the conclusion.
The spectrum analysis (from
Figure 3) revealed the value of the actual blade frequency: 3782 Hz. Thus, the actual turbocharger speed is equal to 3782/22 = 171.9 Hz. Therefore, for a given engine operating point the TCA 66-20072 turbocharger actual speed is equal to 171.9 × 60 = 10,314.5 rpm.
It is notable that the main frequency (171.9 Hz) harmonic amplitude was relatively small and could be estimated at the range of spectrum noise. This could be assumed to be the indication of a small turbocharger rotor vibration level and highly probable as being the indication of normal rotor bearing conditions [
8,
12].
The acoustic spectrum of the TCA 66-20072 turbocharger also had sub-harmonics and ultra-harmonics:
sub-harmonic x0.5 = 1891 Hz; and
ultra-harmonics x2 = 7564 Hz, x3 = 11,346 Hz, x4 = 15,128 Hz, x5 = 18,910 Hz, x6 = 22,692 Hz.
Sub-harmonics and ultra-harmonics could be used as additional diagnostic signs for further experimental measurements of turbocharger operation.
For the signal, recorded at 44.1 kHz frequency, it was possible to conduct a spectrum analysis for harmonics with a frequency up to 22.05 kHz [
17]. For most marine engines the frequency of the turbocharger blades is always at least 2 times smaller. The maximum frequency of the recorded signal is also limited by the microphone characteristics. As the possible step for spectrum analysis is down to 1 Hz, the absolute error of turbocharger frequency estimation is generally < 1 rpm. The measurement time should be related to the response time of the turbocharger, which is typically about 1 to 3 s. Therefore, the accuracy of suggested method for turbocharger frequency measurement exceeds the typical accuracy of standard measuring devices.
The suggested method could be used for accurate measurements of instantaneous turbocharger speed, turbocharger rotor vibration level estimation, and rough estimation of the engine brake power.
3. VTR 564 Turbocharger of Low-Speed Diesel Engine Acoustic Analysis
Another set of experimental research was carried out for the ABB VTR 564-31 turbocharger [
18], installed on the MAN 6L80MC main marine engine of the capsize bulker [
19].
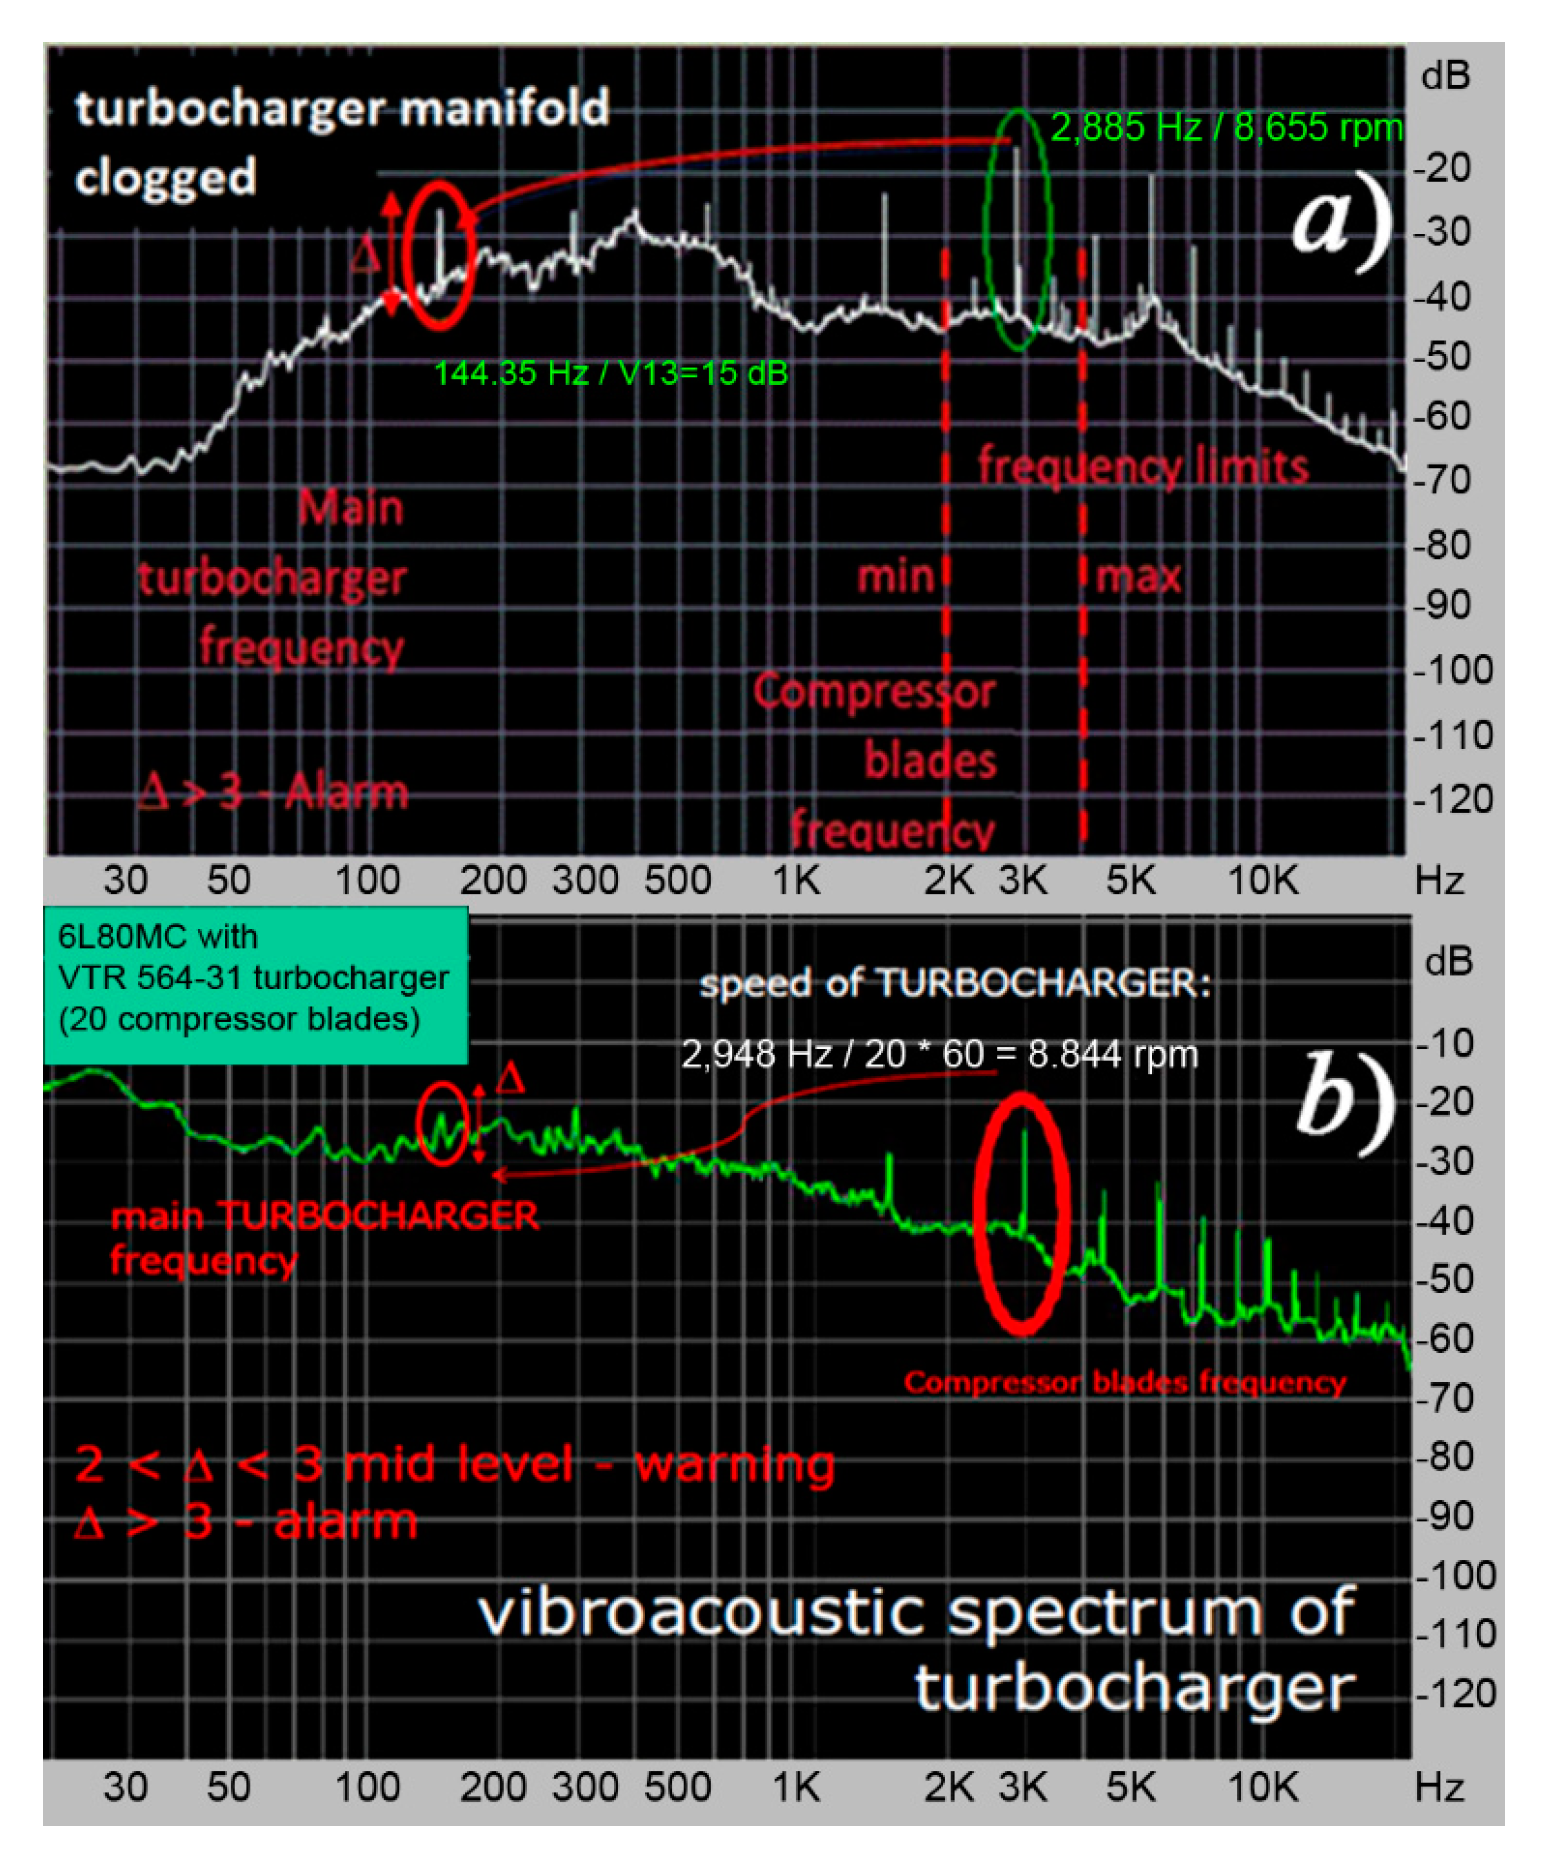
The compressor impeller has 20 blades and its acoustic spectrum for the engine operating point close to MCR is shown in
Figure 5. The assumed value of turbocharger speed for such conditions should be smaller than the turbocharger speed at the rated engine power. Therefore, the turbocharger speed for the MCR operating point could serve as the top limit.
Max blade frequency υbmax = nb × max(TCrpm)/60 = 20 × 12,000/60 = 4000 Hz.
As the engine operating point could be estimated as close to the MCR or at least between 50% and 100% of the MCR, the bottom limit of the turbocharger speed could be assumed to be υbmin = 2000 Hz.
For this turbocharger two cases were considered: before and after cleaning the engine exhaust system. The corresponding acoustic spectra are presented in
Figure 5.
The measurements made on the engine before the exhaust system cleaning gave a main harmonic frequency equal to 144.35 Hz, which was calculated from the blade frequency of the spectrum. It is clear that a main harmonic amplitude greater than 15 dB exceeded the general spectrum level (
Figure 5a). This increased level of the main harmonic amplitude was caused by the vibrations of the turbocharger rotor at the frequency of its rotation. The reason was dust, oil, and carbon deposits on the turbine nozzle and exhaust manifold walls, which distorted the gas flow path and caused vibrations in the turbocharger rotor.
Cleaning and revision of the exhaust manifold and turbine side of the turbocharger allowed the main harmonic amplitude to be lowered down, as shown in
Figure 5b. It is obvious that the level of the main harmonic amplitude was equal to the signal noise level in this case.
By scaling the spectrum diagram (
Figure 5b), the value of blade frequency was estimated as 2948 Hz—it was the closest harmonic to the top limit of 3 kHz. The left harmonic in the diagram (respective to the blade harmonics) is the sub-harmonic, which had a frequency two times smaller, 1474 Hz.
From the turbocharger blade frequency, the turbocharger rotor speed was calculated as TCrpm = 60 × 2948/20 = 8844 rpm.
The turbocharger standard tachometer indicated the turbocharger speed as 8800 rpm, so the error of the turbocharger speed estimation was about 0.5%. It is important to underline that as the error of the turbocharger speed estimation by the acoustic method is generally less than 1 rpm, it provides much more accurate turbocharger speed and further engine operating point estimation.
The frequency of the main harmonic for the turbocharger rotor speed was υturbocharger = υb/nb = 2948/20 = 147.4 Hz.
Obviously, the relatively high level of the main harmonic amplitude Δ could be an indication of an increased level of rotor vibrations [
8]. The level of the main harmonic amplitude Δ in
Figure 5 could be assumed to be lightly increased but still permissible. The relative main harmonic amplitude parameter δ is proposed to assess the level of ∆:
where
D is the variance of the signal level, calculated in a range from
υturbocharger − 50 Hz to
υturbocharger + 50 Hz and excluding the level of the main harmonic.
In all cases of measurements on marine engines, when high levels of fundamental harmonics were found, it was necessary to clean the flow path of the turbochargers. After cleaning, the level of the fundamental harmonic decreased down to δ < 2.
The set of experiments carried out on the number of MAN MC-series diesel engines shows that if the main harmonic amplitude becomes two to three times greater than the average spectrum level, it indicates a dangerous level of turbocharger rotor vibrations [
12].
More precise quantitative assessment of the permissible range of turbocharger rotor vibrations level requires further experimental investigations. Among other factors, it depends on the design peculiarities of the particular turbocharger: type and positioning of rotor bearings (sleeve or roller type, interior or external position), type of the exhaust gas supply to the turbine wheel (pulsating or constant-pressure flow, single or multiple inlet), and the type of turbine (axial or radial), etc. It is important to emphasize the ability to make such an assessment rapidly during normal engine operation and without any additional devices installed on the engine.
4. Eliminating the Leakage Effect of the Discrete Spectrum (LEE)
When analyzing the discrete spectrum of acoustic signals to estimate their frequency and amplitude properties, the problem of leakage effect elimination must be solved. This effect arises due to the finiteness of the time analysis carried out and its discrete representation. The leakage effect from spectral peaks to adjacent spectral lines is considered to be one of the main errors of the DFT [
17].
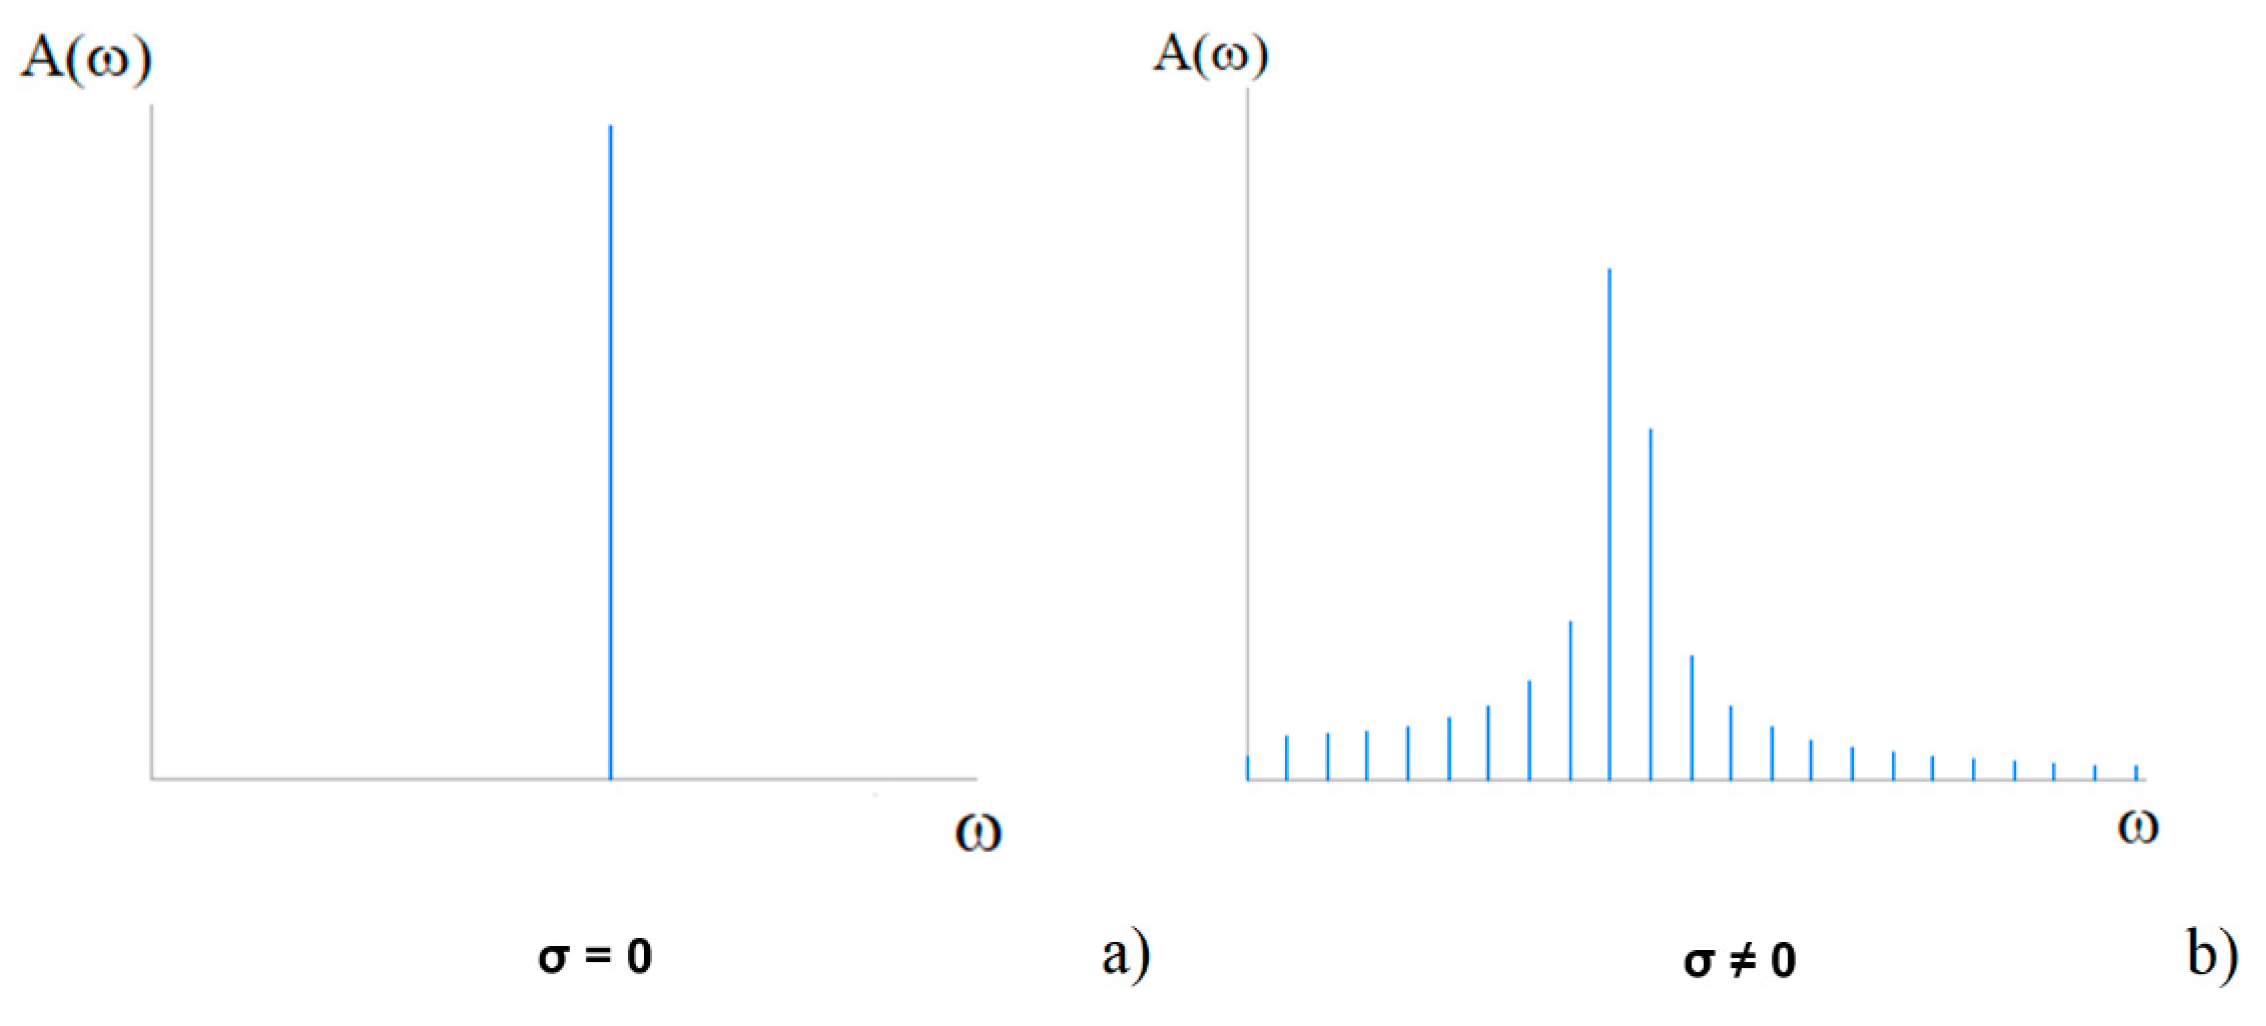
As an example,
Figure 6 shows the amplitude spectra of an identical sine signal with an integer (a) and a non-integer (b) sample number during one signal period.
Let the frequency of a signal be represented by
where
T is the period of the signal and
M =
n +
σ, wherein n is an integer and 0 <
σ < 1.
The maximum distortion of the amplitude, frequency, and phase of the central harmonic and the power leakage into adjacent spectral components occurs at
σ = 0.5 [
17].
Thus, when analyzing the parameters of the original signal of the spectrum, i.e., the central harmonics, the calculated amplitude, frequency, and phase will be set incorrectly if the number of samples per period is not an integer. In technical practice, an analog-to-digital converter (ADC) with a selected and fixed sampling frequency is used for discrete signal recording. It is therefore logical that the sample number during one period could never be integer, the σ parameter can lie in the interval from 0 to 1 depending on the measured signal and eigenfrequency, and the accuracy of estimating the signal parameters along the central harmonic will change.
The most common solution for leakage effect reduction is based on window transform methods. The principle of this method is to reduce the number of discontinuities at the edges. To reduce leakage it is necessary to reduce the signal amplitude of the signal near the edges. This procedure is carried out using the multiplication by the window function with the special form , where W(j) stands for window functions (Hamming, Hanning, Kaiser, etc.).
Using the time window, the original signal spectrum is changed and its amplitude is reduced by RMS Coeff times. This reduces the dependence of the basic harmonic amplitude on the value σ. This procedure allows the fundamental harmonic to be used to approximate the parameters of the signal with constant error, which is already acceptable for the intended purpose.
More specifically, the leakage effect can be eliminated by using a numerical method that processes complex DFT results. In [
17], a suggestion was made that the frequency m, the phase φ, and the amplitude A of the original signal from the values of two maximum harmonics in the spectrum should be specified. To do this, it is necessary to numerically solve a system of equations in a complex variable numerically:
where the
kth harmonic parameters are specified as
The harmonic coefficients can be represented in the form:
where
is a complex function independent of the amplitude, but dependent on the frequency and phase:
The method of solving Equation (6) was developed by R. Varbanets. He revealed the influence of noise level in the source signal on the calculated amplitude and frequency of the main harmonic (see
Figure 7, green line).
Equation (6) needs to be solved in case the lateral harmonic components are different from zero, i.e., greater than a specified small value
ε:
If
, then the leakage effect is suppressed and the frequency, amplitude, and phase of the central harmonic correspond to the initial measured signal parameters (
Figure 6a).
When solving Equation (6) for the situation of strong leakage effects (
σ ~ 0.5), after five iterations an error of less than 0.5% in frequency and phase was achieved. For a sinusoidal signal, the amplitude and frequency were restored to the values contained in the original record to 5 decimal places. Prior to this recovery procedure, the central harmonic error was 35% [
12,
17].
In addition, the error of estimating the frequency of the original record can be not negligible in relation to the frequency of the central harmonic. As the ADC sampling rate increases, this error decreases.
The solution to Equation (6) is not associated with additional memory, as is the case for the fast Fourier transform (FFT). Despite the iterative numerical solution for Equation (6), such a procedure only very slightly increases the overall computation time and makes it possible to obtain not only the spectrum of the signal, but also the restored fundamental frequency value, amplitude, and phase of the measured signal when it is close to sinusoidal.
This method was investigated in the case of noise in the original signal (with a white noise of 5% and 10% of the amplitude of the sinusoid).
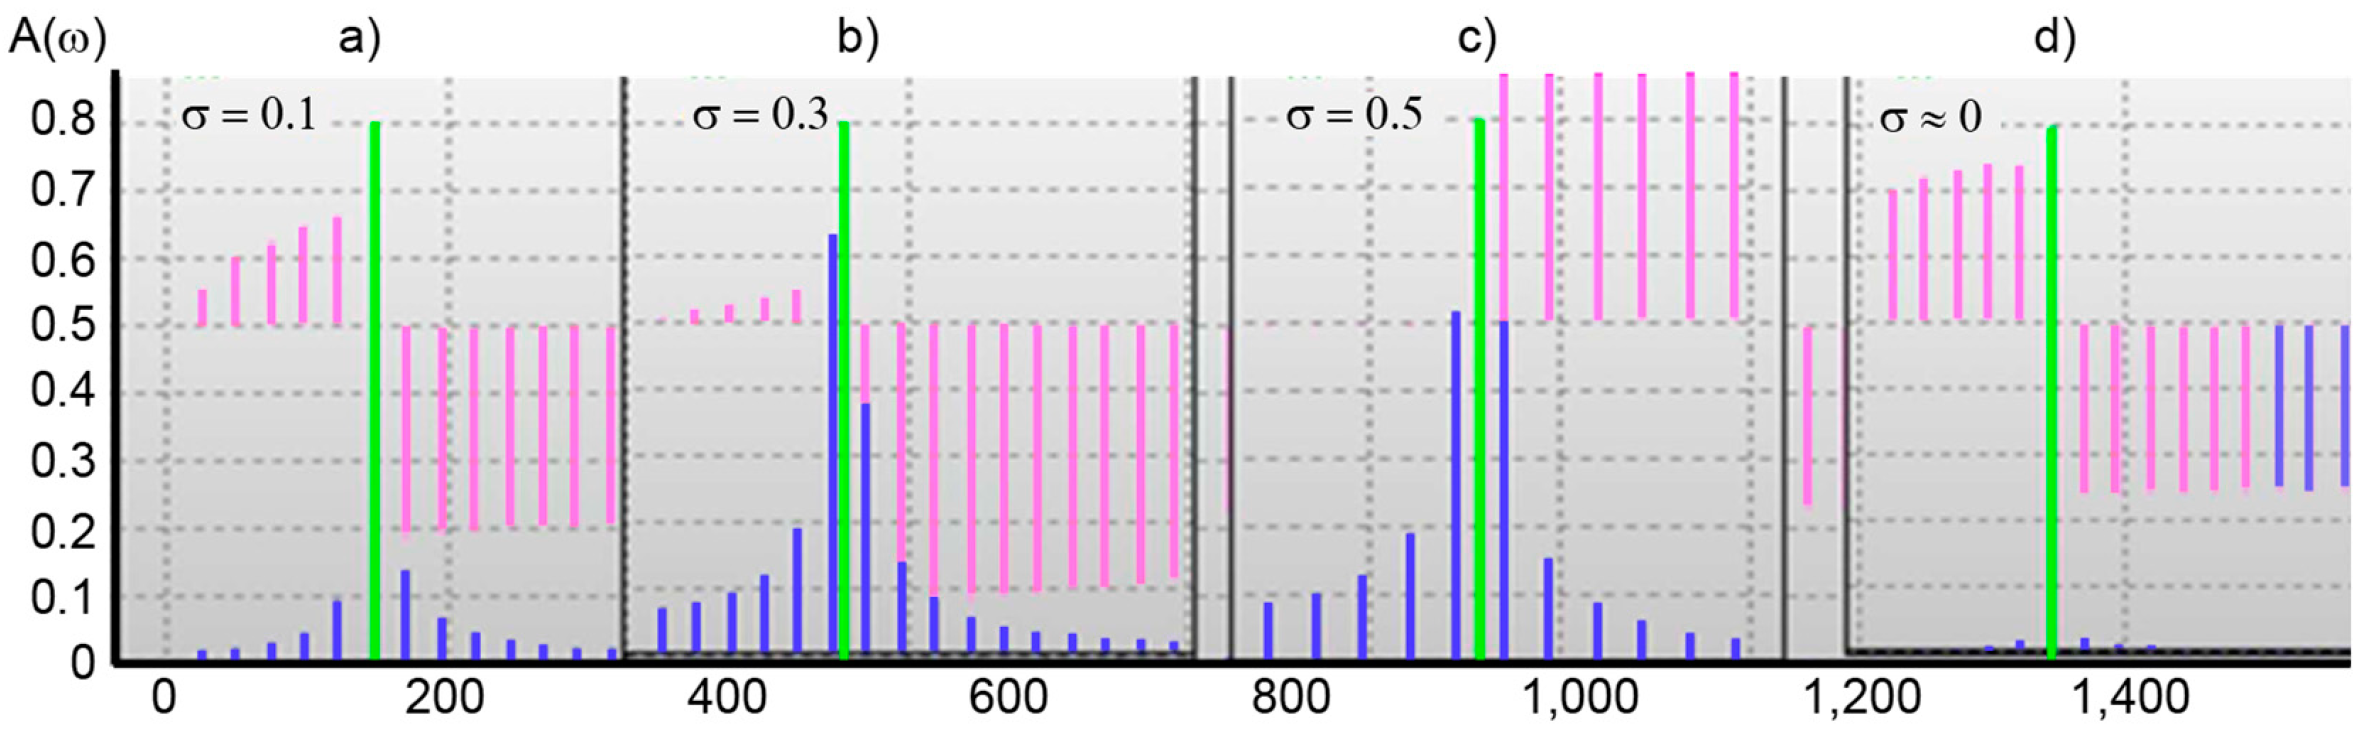
Figure 7 shows the solution of Equation (6) for a sinusoid with an amplitude of 0.8 and for the cases (a) σ = 0.1, (b) σ = 0.3, (c) σ = 0.5, and (d) σ = 0.
The central green line in each
Figure 7a–d is the main harmonic of a sinusoid with an amplitude of 0.8 with the restored amplitude, frequency, and phase, the result of solving Equation (6).
In all solved cases, no more than 5 complete iterations were needed to ensure the given accuracy. As a result of the solution of Equation (6), the phase and frequency of the signal with the addition of white noise to 10% were restored to the initial value, with an error of not more than 0.5%.
5. Application of the Acoustic Method for a CNG Engine
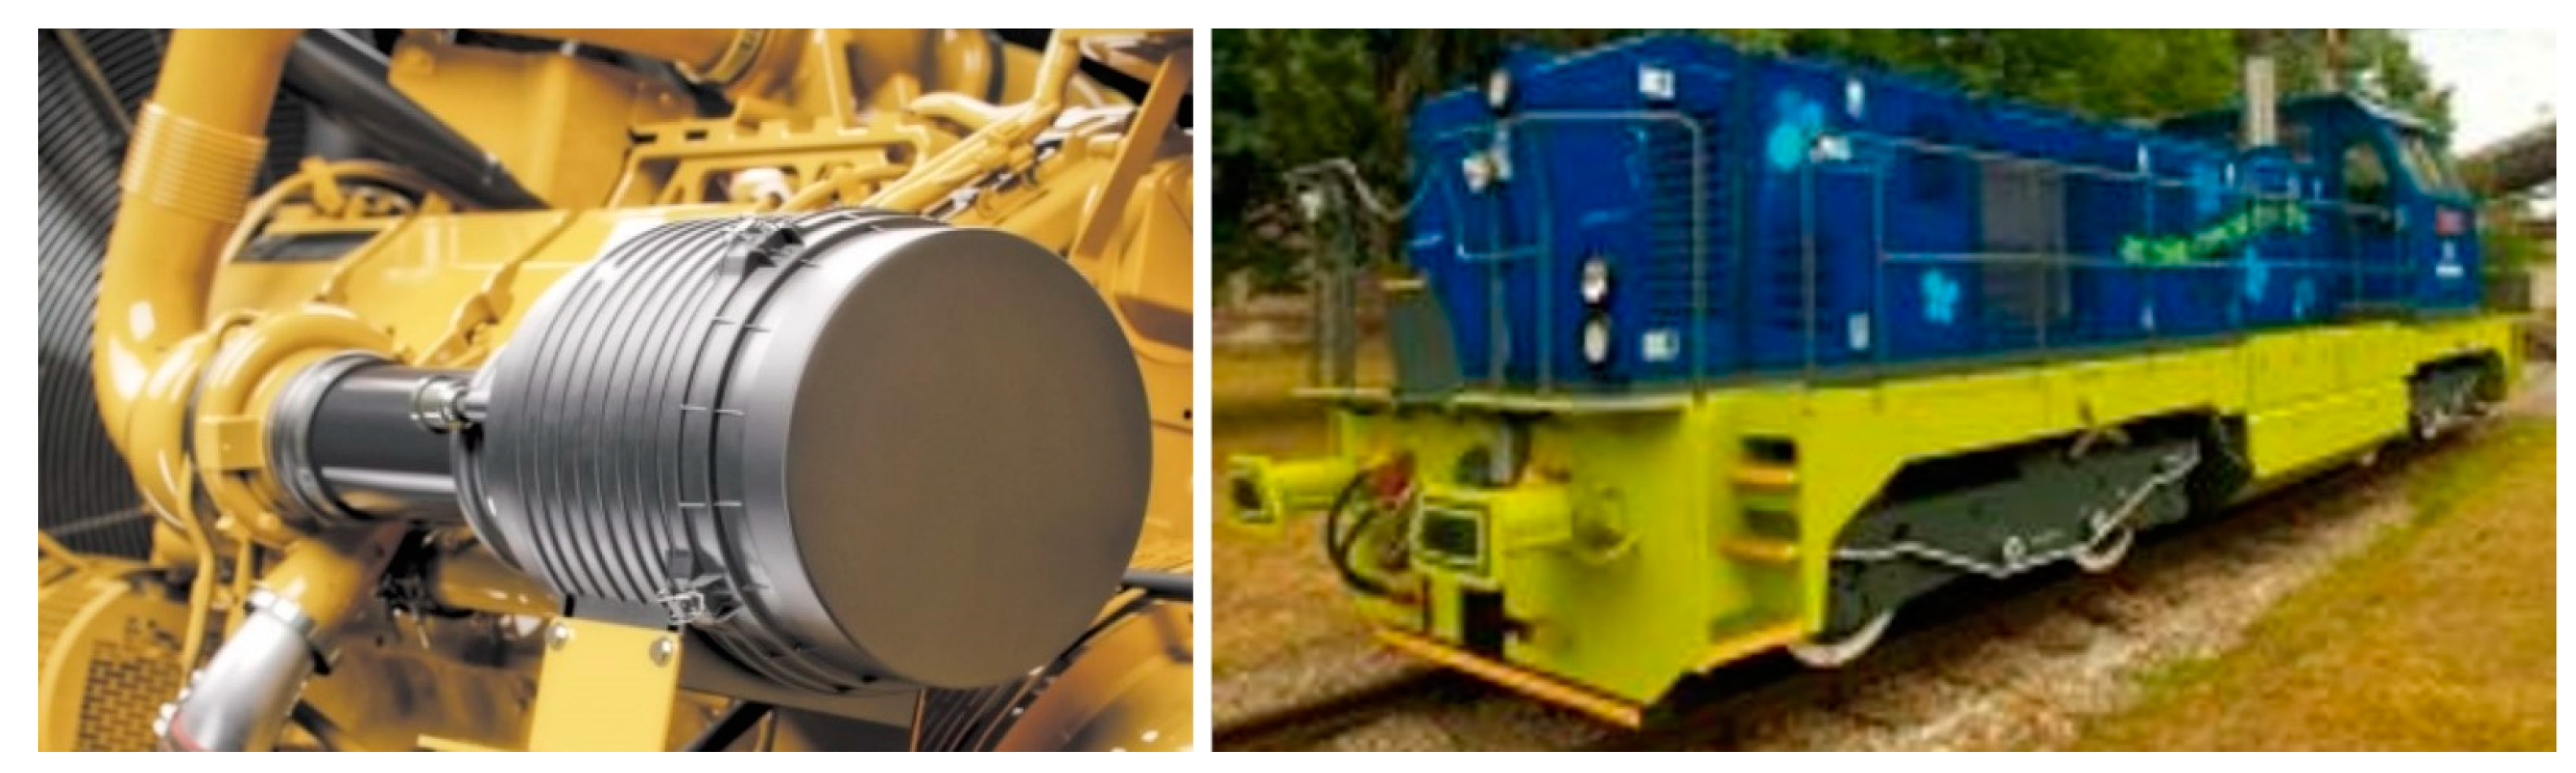
The described acoustic method was also successfully applied to a completely new engine developed for small vessels or locomotives, where compressed natural gas (CNG) is used instead of traditional fuels (see
Figure 8). The measurement was performed in the same configuration as described above for the engine shown in
Figure 4.
This CNG engine contributes to reduced environmental impact and has low operating costs. The use of these high-volume engines is not only in shipping and rail transport, but also in construction machinery and cogeneration units. The possibilities of using these engines are really wide thanks to ecological aspects, low price, and rich reserves of natural gas all over the world.
6. Acoustic-Based Turbocharger Continuous Monitoring System
The experiment was carried out with a smartphone and external microphone, with further analysis of the recorded acoustic signals carried out on a personal computer. The blade frequency and main harmonic amplitude on the turbocharger rotor frequency were estimated after signal spectrum calculations and DFT leakage effect elimination. As the signal measurement and treatment requires very little time, the stationary system for continuous turbocharger acoustic monitoring could be proposed.
The suggested system should include a special industrial-class microphone, installed either close to the compressor blades or outside the compressor volute, in a place with minimum interaction from aerodynamic noises or noises from engine mechanisms. The microphone should be a directional type and orientated to the signal source. We used a special protector made from porous rubber to cover the microphone from extraneous noise (see
Figure 4).
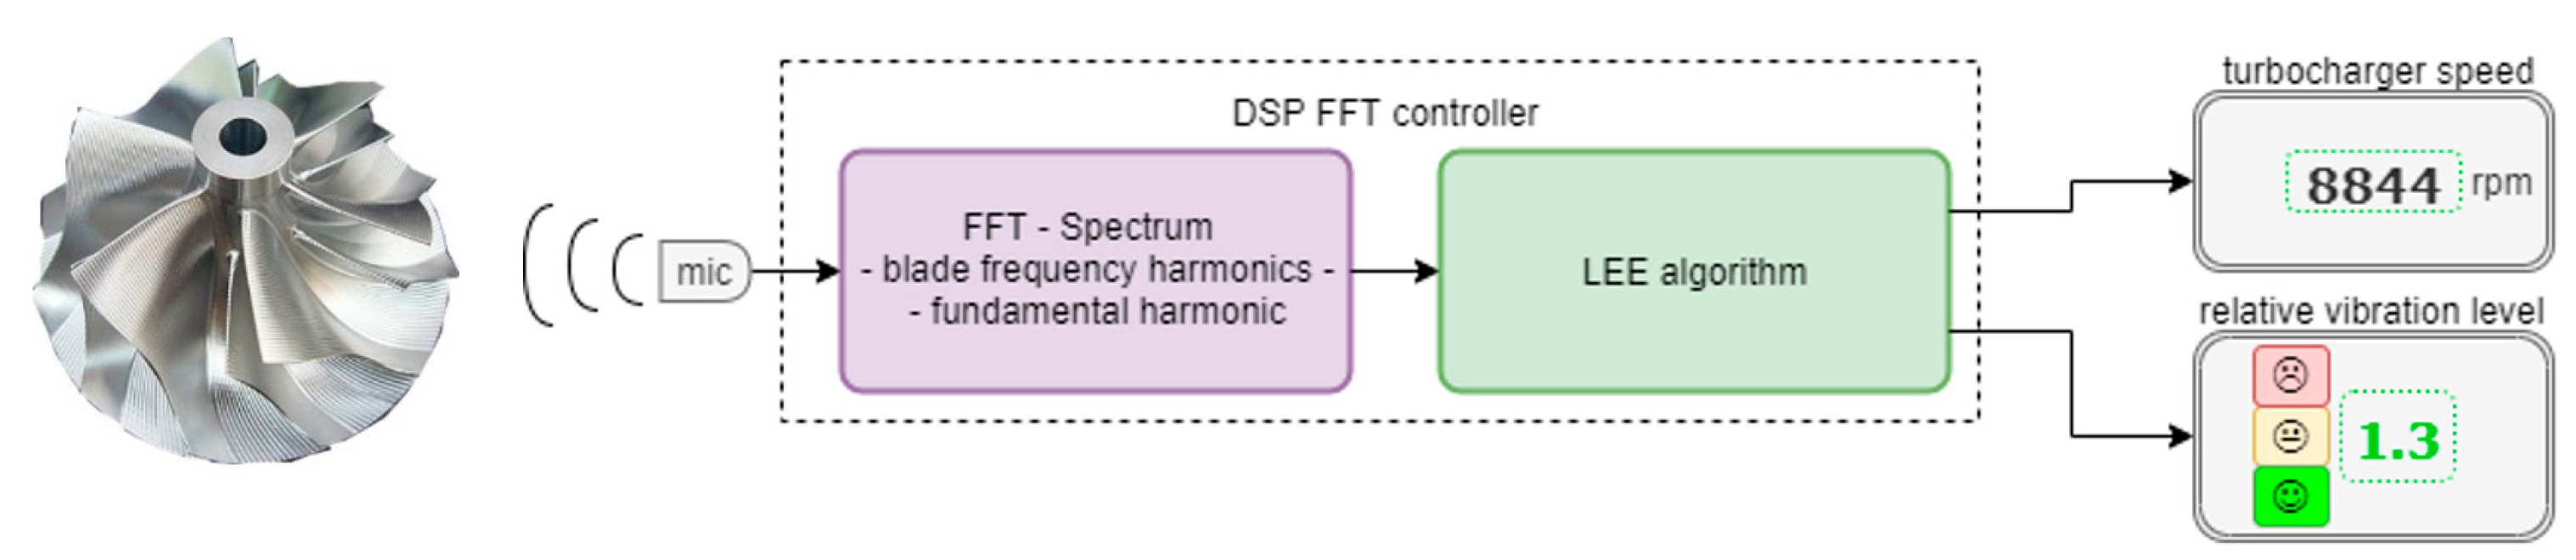
The signal from the microphone was processed by the DSP controller, which implements FFT, spectrum build-up, and DFT leakage effect elimination (
Figure 9). The instantaneous turbocharger rotational speed at some quasi-steady time interval and the relative rotor vibration level δ were the output parameters.
The quasi-steady time interval depends on the turbocharger inertia. It is assumed that the process at the time interval, which is shorter than the turbocharger time constant, could be considered a steady process, and the FFT procedure could be applied. For low-speed turbocharger engines the time interval is generally less than 1 s.
7. Conclusions and Further Research
In accordance with the main directions of increasing the efficiency of diesel engines it is relevant to reduce operating costs by using more technologically advanced and practical equipment [
20,
21]. The suggested system for continuous acoustic turbocharger monitoring could increase the efficiency of low-speed marine engine maintenance. At the same time the method based on a smartphone application could be a useful tool for marine engineers, as it does not require special equipment (in most cases in-built-in microphone could be used).
To define the limits of normal and abnormal rotor vibration levels for various types of turbochargers, further research is necessary. It can be noted that the acoustic spectrum analysis of a turbocharger can be quickly made under operating conditions.
The proposed method allows the turbocharger rotor speed and the vibration level to be determined by means of acoustic spectrum harmonic amplitude stabilization using the proposed algorithm. The method can be implemented in the continuous monitoring system of the turbocharger (
Figure 9). Tests on two-stroke marine engines have shown that the acoustic-based measuring system can be carried out, which allows:
continuous monitoring of turbocharger rotation speed and rotor vibration level;
reliability and ease of installation, as the sensor is in a low temperature zone; and
high accuracy rotation speed control, which makes it possible to monitor the total engine load.
The described acoustic method for estimating the parameters of turbochargers has already proved to be a useful tool for the development and operation of engines in its cur-rent form. The major advantage of the acoustic method is its simplicity. There is no need in expensive high-quality vibration sensor, its installation and calibration. Generally, even regular smartphone with in-build microphone can provide good results. For correct application, new users of this method may be advised to first determine the frequency spectrum of the relevant turbocharger in its nominal operating conditions.
During the development and application of this measuring method, the influence of the acoustic background was also investigated, for example due to the running of another engine running nearby. This problem can be solved applying the directional microphone and its positioning close to the source of the blade harmonics sound, as has been success-fully verified.
This method can also be used for automotive engines but requires some modifications. First, the microphone should be able to record sound up to 40 kHz and second, special software should be able to record sound at 80.2 kHz. When using a data rate of 44.1 kHz, the maximum detectable turbocharger speed is approximately 70,000–100,000 rpm.
Further research and development of the continuous monitoring system is focused on the automatic detection of excessive turbocharger rotor vibrations and the appropriate intervention without an operator. The development of appropriate algorithms and software is underway, which will be the content of another publication.
The extension of the application of the method to the issue of detection of transient modes of the turbocharger is also considered. The time constant of the large marine engine turbochargers could be estimated as 0.5–2 s. So, if the turbocharger speed is relatively constant within this period of time, the method could be applied even for engine transient op-eration. For faster transition processes, special processing of the recorded signal is required, which is the subject of ongoing research.


 ,
, 


