Article

Underwater Image Enhancement Based on Local Contrast Correction and Multi-Scale Fusion

1
Laboratory of Underwater Intelligent Equipment, School of Automation, Hangzhou Dianzi University, Hangzhou 310018, China
2
Key Laboratory of Submarine Geosciences, Second Institute of Oceanography, Ministry of Natural Resources, Hangzhou 310012, China
*
Author to whom correspondence should be addressed.
J. Mar. Sci. Eng. 2021, 9(2), 225; https://doi.org/10.3390/jmse9020225
Submission received: 1 February 2021 / Revised: 16 February 2021 / Accepted: 18 February 2021 / Published: 19 February 2021
(This article belongs to the Special Issue Machine Learning and Remote Sensing in Ocean Science and Engineering)

Abstract

:
In this study, an underwater image enhancement method based on local contrast correction (LCC) and multi-scale fusion is proposed to resolve low contrast and color distortion of underwater images. First, the original image is compensated using the red channel, and the compensated image is processed with a white balance. Second, LCC and image sharpening are carried out to generate two different image versions. Finally, the local contrast corrected images are fused with sharpened images by the multi-scale fusion method. The results show that the proposed method can be applied to water degradation images in different environments without resorting to an image formation model. It can effectively solve color distortion, low contrast, and unobvious details of underwater images.

1. Introduction

Given the shortage of natural resources on land, humans need to develop alternative resources in different bodies of water, such as the ocean. Thus, increased attention has been paid to the research of underwater images. However, underwater images often show some degradation effects, such as color skewing, blurring, and poor detail [1]. In the underwater imaging process, the propagation of light presents exponential attenuation through two processes: light scattering and light absorption [2]. Light scattering is caused by particles suspended in the water. They cause the light to be reflected and refracted many times before it reaches the image acquisition device, thereby blurring the image. Light absorption is caused by the water medium. Different wavelengths of light in the water body can present different degrees of attenuation. The red light has a faster attenuation speed than the blue light and the green light. It also has the longest wavelength and the lowest frequency [3], which leads to visual color distortion in underwater images. Considerable research has attempted to find a suitable color correction and detail enhancement method for underwater images.
In recent years, many studies focus on underwater image defogging and color correction to propose different methods [4,5,6,7,8].
Existing underwater image enhancement methods can be classified from two perspectives: the image formation model-based (IFM-based) method and the image formation model-free (IFM-free) method [3]. The IFM-based method refers to the mathematical modeling of the degradation process of underwater images. By estimating the model parameters and inverting the degradation process, a clear underwater image can be obtained, which belongs to image restoration. The dark channel prior (DCP) [9] is a defog algorithm specially designed for outdoor image scenes. This method assumes that clear day images contain some pixels with extremely low intensities (close to zero) in at least one color channel. When it is directly applied to underwater scenes, this method loses its effectiveness due to the underwater light attenuation properties and the difference between land and underwater environments. Some researchers tweaked the DCP algorithm to make it work in underwater scenarios. For example, Chiang et al. [10] proposed to combine the DCP algorithm with the wave-length-dependent compensation algorithm for defogging and color correction. Galdran et al. [6] proposed a method using red channel compensation to recover the lost contrast in underwater images following the characteristic that red light attenuates fastest in underwater propagation. Lu et al. [5] proposed a new mathematical model for underwater images and used wavelength compensation to restore them.
The IFM-free method mainly improves the contrast and color of the image by redistributing pixel intensity without relying on the image formation model. Image fusion is an effective underwater image enhancement strategy. In 2012, Ancuti et al. [11] proposed a fusion-based approach, which generates two different versions of the input images. Then, four weights are determined using the Laplacian contrast, local contrast, saliency, and exposure. Finally, a multi-scale fusion strategy is adopted to combine the two fused images with the defined weights to obtain an enhanced image with improved global contrast and detail information. In 2017, Ancuti et al. [4] improved their previous fusion method, proposed a new red channel compensation method, and updated the weight calculation method. They obtained images with an enhanced display of the dark areas and improved overall contrast and edge sharpening.
With the continuous development of deep learning, researchers proposed several methods using deep neural networks. For example, Li et al. [12] proposed a weakly supervised color conversion method to correct underwater colors. Their method relaxed the need for paired underwater images for training and allowed the underwater images to be taken in unknown locations. Yu et al. [7] proposed Underwater-GAN. On the basis of the image formation model, they generated underwater images through simulation and constructed the Underwater image dataset. All these methods have good effects when processing underwater images. However, the availability of large underwater image datasets and ground truth increase the time cost of deep learning-based methods in practical applications.
In correcting image color, white balance methods are commonly used. Most of these methods estimate the color of the light source through specific assumptions. Then, they divide each color channel by its corresponding normalized light source intensity to achieve color constancy [4]. By contrast, the Gray-World [13] algorithm assumes that the average reflectance of light in the scene is achromatic. The color distribution of the light source can be estimated by averaging the channels of each color. The Max RGB [14] method has the following assumption: the maximum value of each channel is determined by a white patch [15]. It uses the maximum value to estimate further the color of the light source. The Gray-World and the Max RGB can be regarded as two applications of the Minkowski p-norm with p = 1 and p = . On this basis, Finlayson et al. [16] proposed Shade-of-Grey method, which estimates the color of the light source by modifying the Minkowski p-norm. Later, Weijer et al. [17] proposed the Grey-Edge, with the assumption that the average edge difference in a scene is achromatic. Although this method has a simple calculation, it can obtain better results than the previous color correction methods [18].
These methods not only have a good effect on detail enhancement or color correction but also have some limitations. For example, the DCP method designed by He et al. [9] for outdoor scene defogging can recover only a few details in the underwater environment, which cannot recover the color lost. The difference in color degradation between outdoor images and underwater images is not taken into account. Galdran et al. [6] proposed an algorithm specially used for underwater image enhancement, which has good results in dealing with low contrast and chromatic aberration of underwater images. The defect is that some images will appear with red supersaturation to varying degrees, making the overall image reddish. Therefore, an underwater image enhancement method that can solve color correction and detail enhancement should be determined. The underwater image enhancement algorithm based on fusion can effectively solve many problems of underwater images, such as blurring, low contrast, and color distortion. In this study, an underwater image enhancement method is proposed on the basis of local contrast correction (LCC) and fusion. The characteristics of color and details of underwater images are also considered in the proposed method. First, the white balance method based on red channel compensation is used to correct the image color. Then, two image input versions, LCC and sharpening, are introduced. Finally, the weight is calculated, and multi-scale fusion is performed following the obtained weight. The results show that the proposed method can be applied to water degradation images in different environments without using the image formation model. Color distortion and unobvious details of underwater images are effectively solved, and the local contrast effect is improved.
The rest of this study is structured as follows. In the second part, the detailed underwater image enhancement method is introduced. In the third part, the qualitative and quantitative analysis of the experimental results is carried out. Then, the advantages of the proposed method are discussed, and the results are summarized.

2. Local Contrast Correction and Fusion Algorithm

Given the underwater image formation mechanism and the attenuation of light propagation in the water, an improved LCC method with a multi-scale image fusion strategy is proposed in this study. The underwater image is compensated using the red channel, and the color compensated image is processed by a white balance. Then, two versions of the image input are generated: the LCC image and the sharpened image. Next, the Laplacian contrast weight, saliency weight, and saturation weight of the LCC and sharpened images are calculated, and the two groups of weights are normalized. Finally, LCC images and sharpened images and their corresponding normalized weights are fused. The multi-scale fusion method is also adopted to avoid artifacts. The algorithm flow is shown in Figure 1.

2.1. Underwater Image White Balance Based on Red Channel Compensation

Given the physical characteristics of light propagation in water, red light is absorbed first, and underwater images are mainly blue and green [19]. White balance is an effective way to improve the tone of an image. It eliminates unwanted colors created by various lighting or light attenuation characteristics. The Gray-World algorithm [13] is an effective white balance processing method for outdoor images. However, due to its characteristics, the red channel will be overcompensated in the underwater environment where the red attenuation is severe, resulting in red artifacts in the image. The red channel compensation method is used to solve this problem [4]. The compensated red channel RC of each pixel position (i, j) in the image is
R C ( i , j ) = R ( i , j ) + ( G ¯ R ¯ ) × ( 1 R ( i , j ) ) × G ( i , j ) ,
where R and G represent the red channel and the green channel of the input image, and each channel is normalized. R ¯ and G ¯ represent the average value of pixels of the corresponding channel.
After the red channel is compensated, the Gray-Word can be applied to underwater image scenes. This method considers that the average value of each channel component is a grayscale for an RGB image with many color changes
K = ( R C ¯ + G ¯ + B ¯ ) / 3 ,
where R C ¯ represents the average value of pixels in the red channel. Next, the gain of each channel is calculated as
K ζ = K / ζ         ζ { R C , G , B } .
Finally, the final pixel calculation method of each channel is shown as Equation (4)
ζ n e w = ζ × K ζ         ζ { R C , G , B } .
White balance processed image I can be obtained by combining ζ n e w .

2.2. Improved Local Contrast Correction Method

In addition to color aberration and blurring due to their characteristics, underwater images are usually interfered with by natural light or artificial light, which makes local areas of the image too bright. The white balance processing of the image will also lead to excessive brightness, so introducing the contrast correction method is necessary to solve this problem. The contrast reflects a measurement of the brightness level between the brightest and darkest areas of an image. Gamma correction is widely used as a global contrast correction method. It changes the image brightness by changing the value of a constant index γ. Gamma correction can be expressed as Equation (5)
O ( i , j ) = 255 [ I ( i , j ) 255 ] γ ,
where I ( i , j ) and O ( i , j ) represent the pixel values of each coordinate of the input image and the output image, respectively, and γ is usually a positive number from 0 to 3.
A simple gamma correction is a global method and does not apply to underexposed and overexposed scenes [20]. Local contrast correction method can carry out adaptive calculation following image properties [21], which is shown in Equation (6)
O ( i , j ) = 255 ( I ( i , j ) 255 ) g ( 128 B F m ( i , j ) 128 ) ,
where B F m ( i , j ) is an inverted low-pass version of the intensity of the input image. It is filtered with a bilateral filter. g is a parameter that depends on the image properties.
B F m ( i , j ) and g can be, respectively, expressed by Equations (7) and (8)
B F m ( i , j ) = 255 ( k , l ) I ^ S ( i , j ) f ( k , l ) ω ( i , j , k , l ) ( k , l ) I ^ S ( i , j ) ω ( i , j , k , l ) ,
g ln ( I ¯ / 255 ) ln ( 0.5 )       when   B F m = 255 , g ln ( 0.5 ) ln ( I ¯ / 255 )       when   B F m = 0 ,
In Equation (7), f ( k , l ) represents the input pixel and ω ( · ) represents the weight coefficient, which can be obtained by multiplying the spatial domain function d ( · ) with the range domain function r ( · )
d ( i , j , k , l ) = exp ( ( i k ) 2 + ( j l ) 2 2 σ 1 2 ) r ( i , j , k , l ) = exp ( f ( i , j ) f ( k , l ) 2 σ 2 2 )
where σ1 and σ2 are standard deviations of the Gaussian function. They are in the spatial domain and the range domain, respectively.
In Equation (8), I ¯ is the overall average value of the pixels of the input image. When I ¯ < 128 , the first part of Equation (8) is used for calculation; when I ¯ > 128 , the second part is used for calculation.
When the overall average value of image pixels approaches I ¯ = 128 , both parts of Equation (8) can be used for calculation, where the value of g is approximately constant to 1. In this case, the output image will hardly change. An improved LCC method is proposed in this study to solve this problem. Considering that the guided filter has better edge-preserving performance than the bilateral filter [22], the guided filter is used instead of the bilateral filter. For the uncertainty of variable g, the method proposed by Moroney et al. [23] is used to define it as constant 2. The improved method is shown in Equation (10)
O ( i , j ) = 255 ( I ( i , j ) 255 ) 2 ( 128 G F m ( i , j ) 128 ) ,
where G F m ( i , j ) is a mask provided by the guided filtered image of the inverted version of the input.
G F m ( i , j ) = 255 1 | ω | k : i ω k ( a k I i + b k ) ,
where I is the guide image and a and b are the constant coefficients of this linear function when the window center is located at k, which can be obtained from Equation (12)
a k = 1 | ω | i ω k I i p i μ k p ¯ k σ k 2 + ε b k = p ¯ k a k μ k
where μ and σ2 represent the expectation and variance of I in window ωk, respectively, |ω| is the number of pixels in filter window ωk, and p ¯ k = 1 | ω | i ω k p i is the average value of input image in window ωk.
Guide image I is used as the input image to obtain GFm, indicating that Ii = pi. The numerator term of ak in Equation (12) can be expressed as p k p k ¯ p ¯ k p ¯ k . According to expectation and variance function V = E ( X ) 2 ( E ( X ) ) 2 , Equation (12) can be expressed as
a k = σ k 2 σ k 2 + ε b k = p ¯ k ( 1 a k )
Let b ¯ i = 1 | ω | k : i ω k b k and b ¯ i = 1 | ω | k : i ω k b k , Equation (11) can be written as
G F m ( i , j ) = 255 ( a ¯ i I i + b ¯ i ) .

2.3. Image Sharpening

Contrast correction can improve overexposure and underexposure of the image. It can also repair the missing color area. However, the underwater image is usually fuzzy, and the details are not obvious. Thus, the sharpening version of underwater images is introduced in this study as another input version.
The guided filter can achieve the edge smoothing effect of the bilateral filter, and it has a good performance for edge detection. Accordingly, the second input version adopts the guided filter method, and the sharpening result can be expressed as
O ( i , j ) = s × [ I ( i , j ) q ( i , j ) ] + I ( i , j ) ,
where I is the input image, q is the image obtained after guided filtered by I, and s is the constant coefficient. In this study, s = 1. The calculation method of q can be obtained from Equation (16)
q i = 1 | ω | k : i ω k ( a k I i + b k ) .

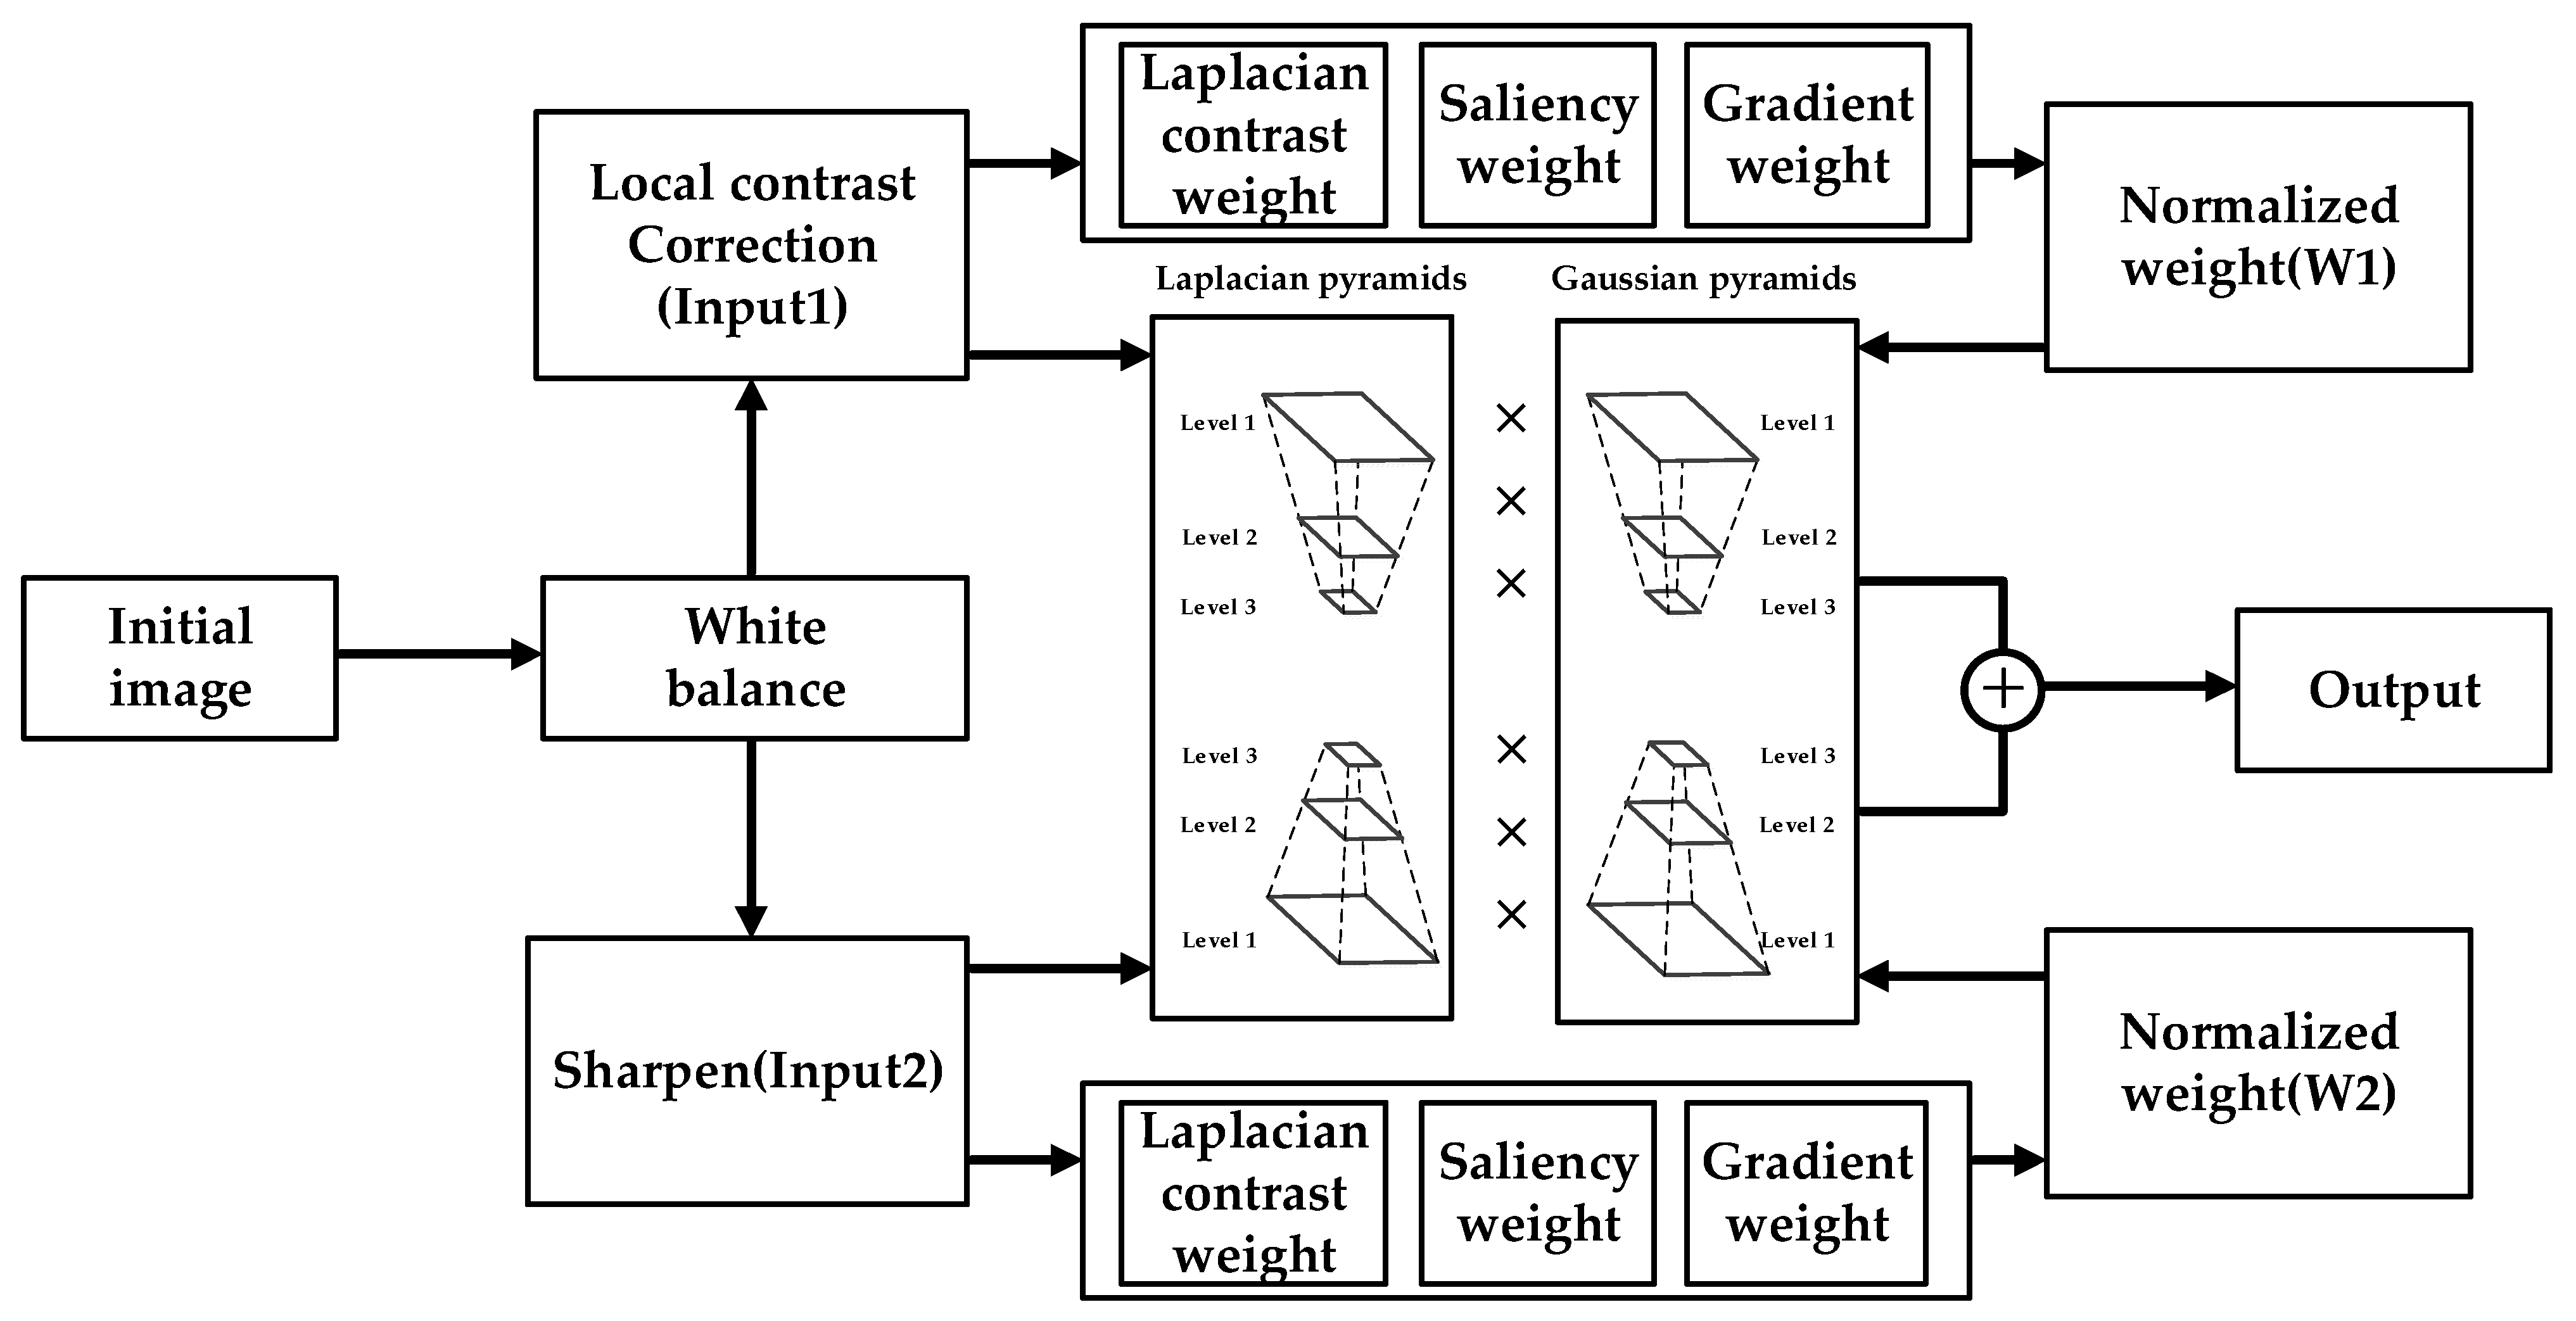
2.4. Multi-Scale Fusion

2.4.1. Selection of Weights

Using a weight graph in the fusion process can highlight the pixels with high weight value in the result. For the selection of weight image, the Laplacian contrast, saliency, and saturation features of the image are selected in this study.
Laplacian contrast weight (WL) estimates the global contrast. It calculates the absolute value of the Laplacian filter applied to each luminance channel. This filter can be used to extend the depth of field of the image [24] because it can ensure that the edges and textures of the image have high values. However, this weight is not enough to restore contrast because it cannot distinguish between the ramp and flat regions. Therefore, saliency weight is also used to overcome this problem.
Saliency weight (WSal) can highlight objects and regions that lose saliency in underwater scenes. The regional contrast-based salient object detection algorithm proposed by Cheng [25] is used to detect the saliency level. This method considers global contrast and spatial coherence that can produce a full resolution saliency map. The algorithm is shown in Equation (17)
W S a l ( I p ) = I i I D ( I p , I i ) .
The algorithm expressed by Equation (17) is the histogram-based contrast method, where D(Ip, Ii) is the color distance metric between pixels Ip and Ii in the L*a*b* space for perceptual accuracy [26].
Saturation weight (WSat) makes the fusion algorithm adapt to the chromatic information through a high saturation region. For each input Ik, the weight can be calculated as the deviation between the R k , G k , B k color channel and the luminance Lk of the k t h input (for each pixel value position)
W S a t = [ ( R k L k ) 2 + ( G k L k ) 2 + ( B k L k ) 2 ] / 3 .
After the weight estimates of two different input versions are obtained, the three weight estimates of each input version are combined into one weight in the following way: for each input version n, the resulting WL, WSal, and WSat are linearly superimposed to obtain the integrated weight. Then, N aggregated maps are normalized on a pixel-per-pixel basis. The weight of each pixel in each map is divided by the overall weight of the same pixels. The normalization method can be expressed by Equation (19)
W ¯ n = W n n = 1 N W n + δ .
where W ¯ n is the normalized weight and N = 2. δ is the constant coefficient. The denominator is set to 0.001 to prevent it from becoming 0.

2.4.2. Multi-Scale Fusion

Concerning image fusion, Equation (20) can be used for simple processing of the two groups of input images. However, this method will lead to artifacts in the resulting images. Thus, the fusion method based on multi-scale Laplacian pyramid decomposition is adopted in this study to avoid this situation [27].
F u s i o n ( i , j ) = n = 1 N W n ( i , j ) I n ( i , j ) .
The Laplace operator is applied to get the first layer of the pyramid for the input image version. Then, the second layer image is obtained by downsampling the layer, and so on. A three-tier pyramid is set up in this study. Similarly, the normalized weight version W ¯ n , corresponding to each layer of the Laplacian pyramid, filters the input image using the low-pass Gaussian filter kernel function G to obtain the Gaussian pyramid of the normalized weight image. The pyramid of fusion can be expressed as follows
p y r a m i d l ( i , j ) = n = 1 N G l { W n ( i , j ) } L l { I n ( i , j ) } ,
where p y r a m i d l ( i , j ) is the level of the pyramid, N is the number of input images, Gl is the level l of the Gaussian pyramid, and Ll is the level l of the Laplacian pyramid.

2.5. Underwater Image Quality Evaluation Metric

The underwater image quality evaluation metric aims to analyze and score the processed underwater image objectively. At present, two recognized methods can be used for underwater image quality evaluation. These methods are underwater color image quality evaluation (UCIQE) [1] and underwater image quality measures (UIQM) [28].
The UCIQE method is used to quantify uneven color blurring and low contrast in describing underwater images. The underwater image is converted from RGB color space to CIEL*a*b* color space. Then, each component is calculated, which can be expressed by Equation (22)
UCIQE = c 1 × σ c + c 2 × c o n l + c 3 × μ s ,
where σc is the standard deviation of chroma; conl is the contrast of luminance; μs is the average value of saturation; and c1, c2, c3 are the weight coefficients.
The UIQM method consists of three parts: underwater image colorfulness, sharpness, and contrast measurement. It can be expressed as follows
UIQM = c 1 × UICM + c 2 × UISM + c 3 × UIConM ,
where UICM, UISM, and UICONM correspond to image colorfulness, image sharpness, and image contrast, respectively, and c1, c2, c3 are the corresponding weight coefficients. When the color correction results of underwater images need to be evaluated, UICM needs to be given a greater weight value. UISM and UIConM also need to be given greater weight when evaluating sharpness and contrast.

3. Results and Discussion

The underwater image data used in the experiment in this section are all real underwater scenes derived from Li’s website, including datasets from Ancuti et al. [4], Fattal [29], Chiang et al. [10], and CB et al. [30]. These datasets include scenes of underwater green, blue, and blue-green [31]. The contrast experiments are carried out from the aspects of colorfulness recovery and contrast enhancement. Then, a comprehensive metric evaluation is performed to prove the advantages of this method.

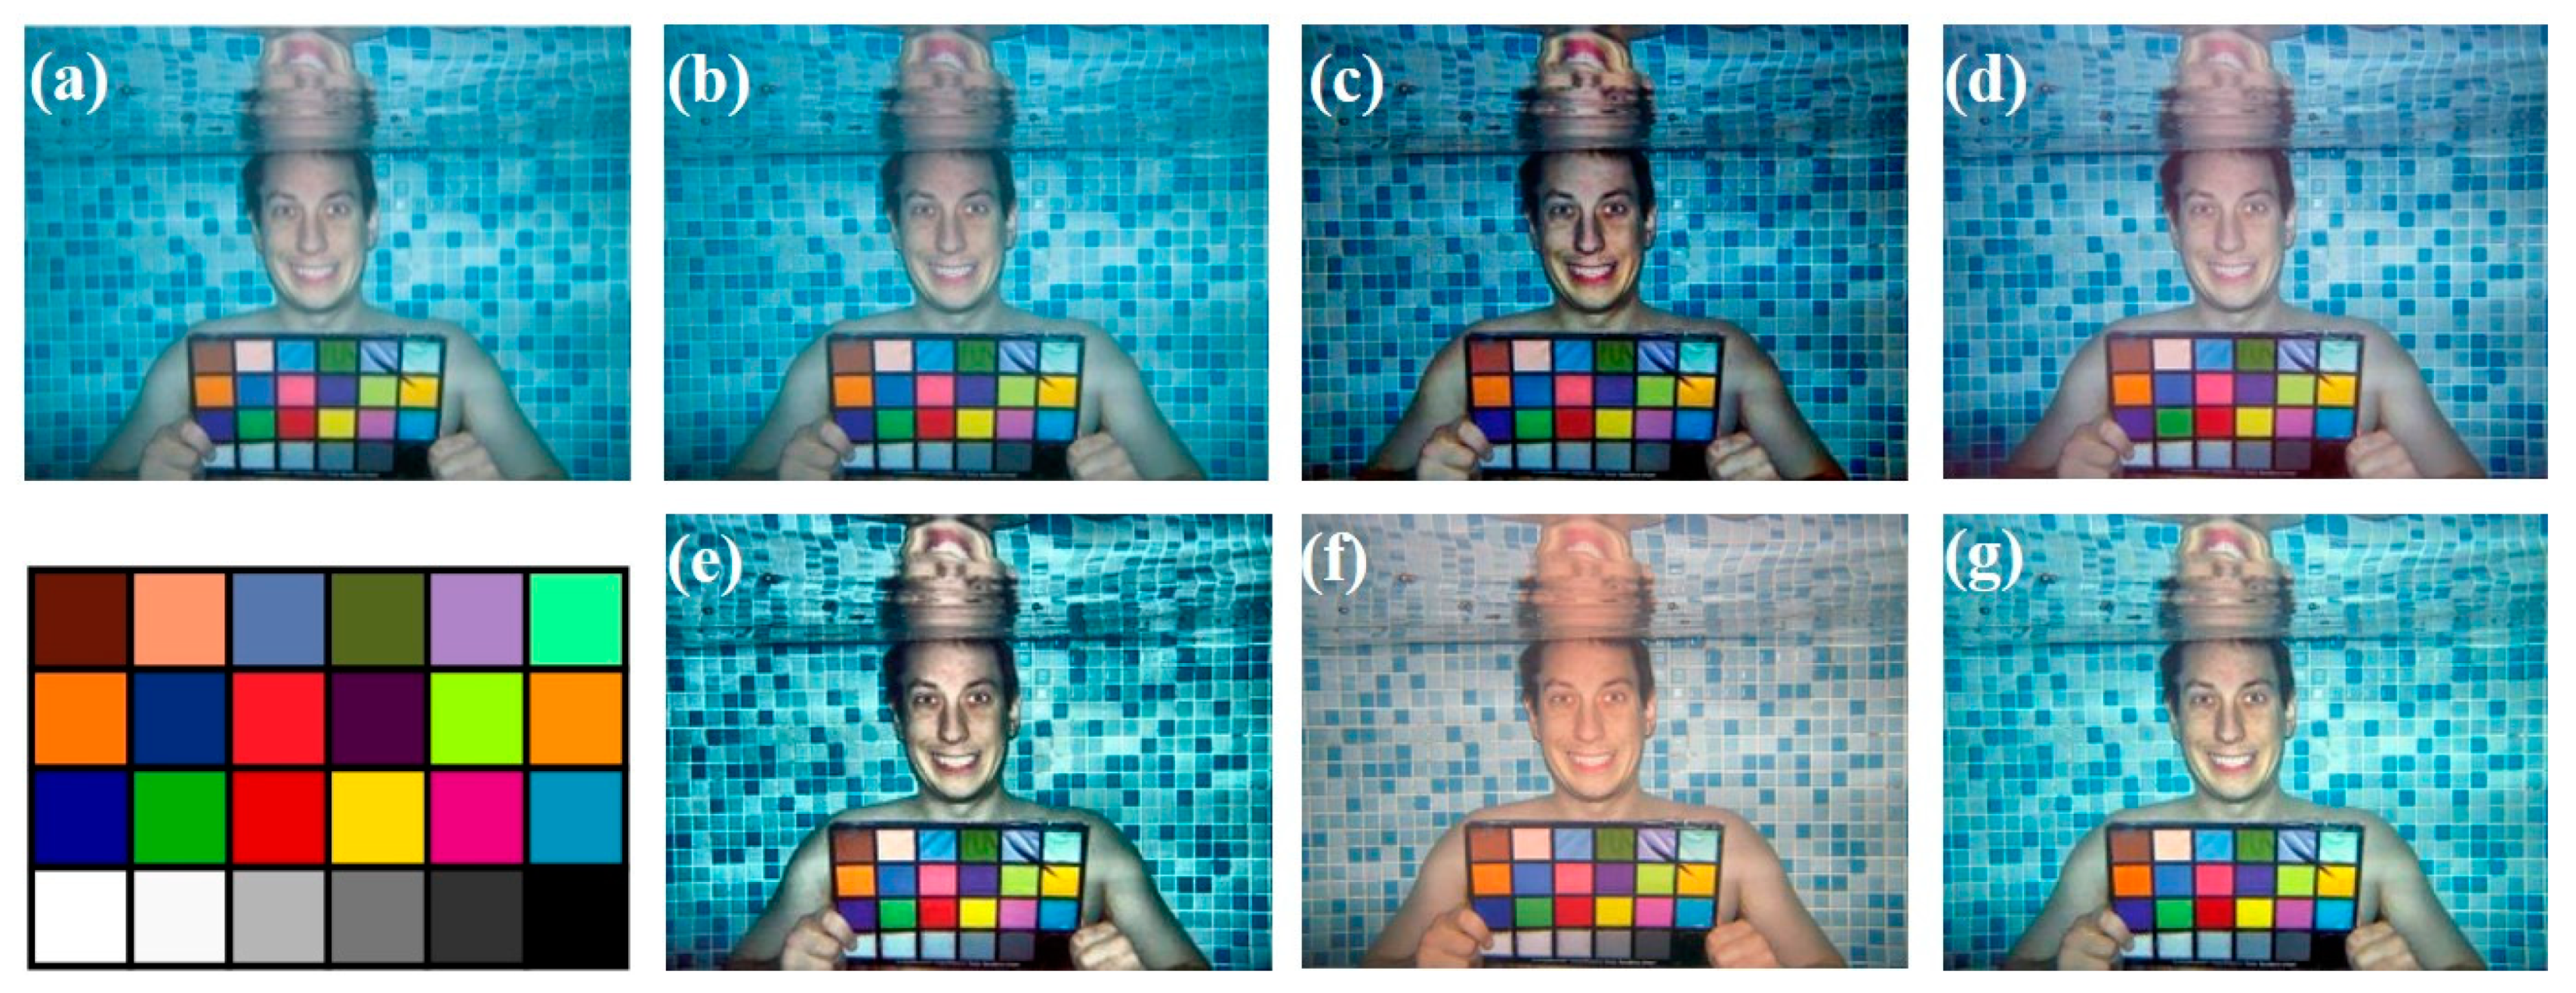
3.1. Color Restoration Experiment

The photos taken by people submerged in water and holding standard color cards are shown in Figure 2. The color restoration effects of the original image, Reference [9], Reference [32], Reference [6], Reference [11], Reference [4], and the proposed method in this study are shown starting from the first line, respectively. Figure 2b has no change based on the original image. Figure 2c,e are sharper than our method, but they are dark in colorfulness and poor in visual effect. Figure 2d,f are better than others, in which Figure 2f is better in overall visual effect, but the photo suffers from overall redness. Among these methods, the color recovery of this algorithm is worse than that of Figure 2f. However, it reflects the better color recovery of standard color card.
From the perspective of quantitative metric, the underwater image colorfulness measure (UICM) metric mentioned in Section 2 (as shown in Table 1) shows that the two methods proposed by Ancuti et al. [11] and the method proposed in this study achieved a higher score than the other methods. The proposed algorithm has a lower score than that in Figure 2e but higher than other methods.

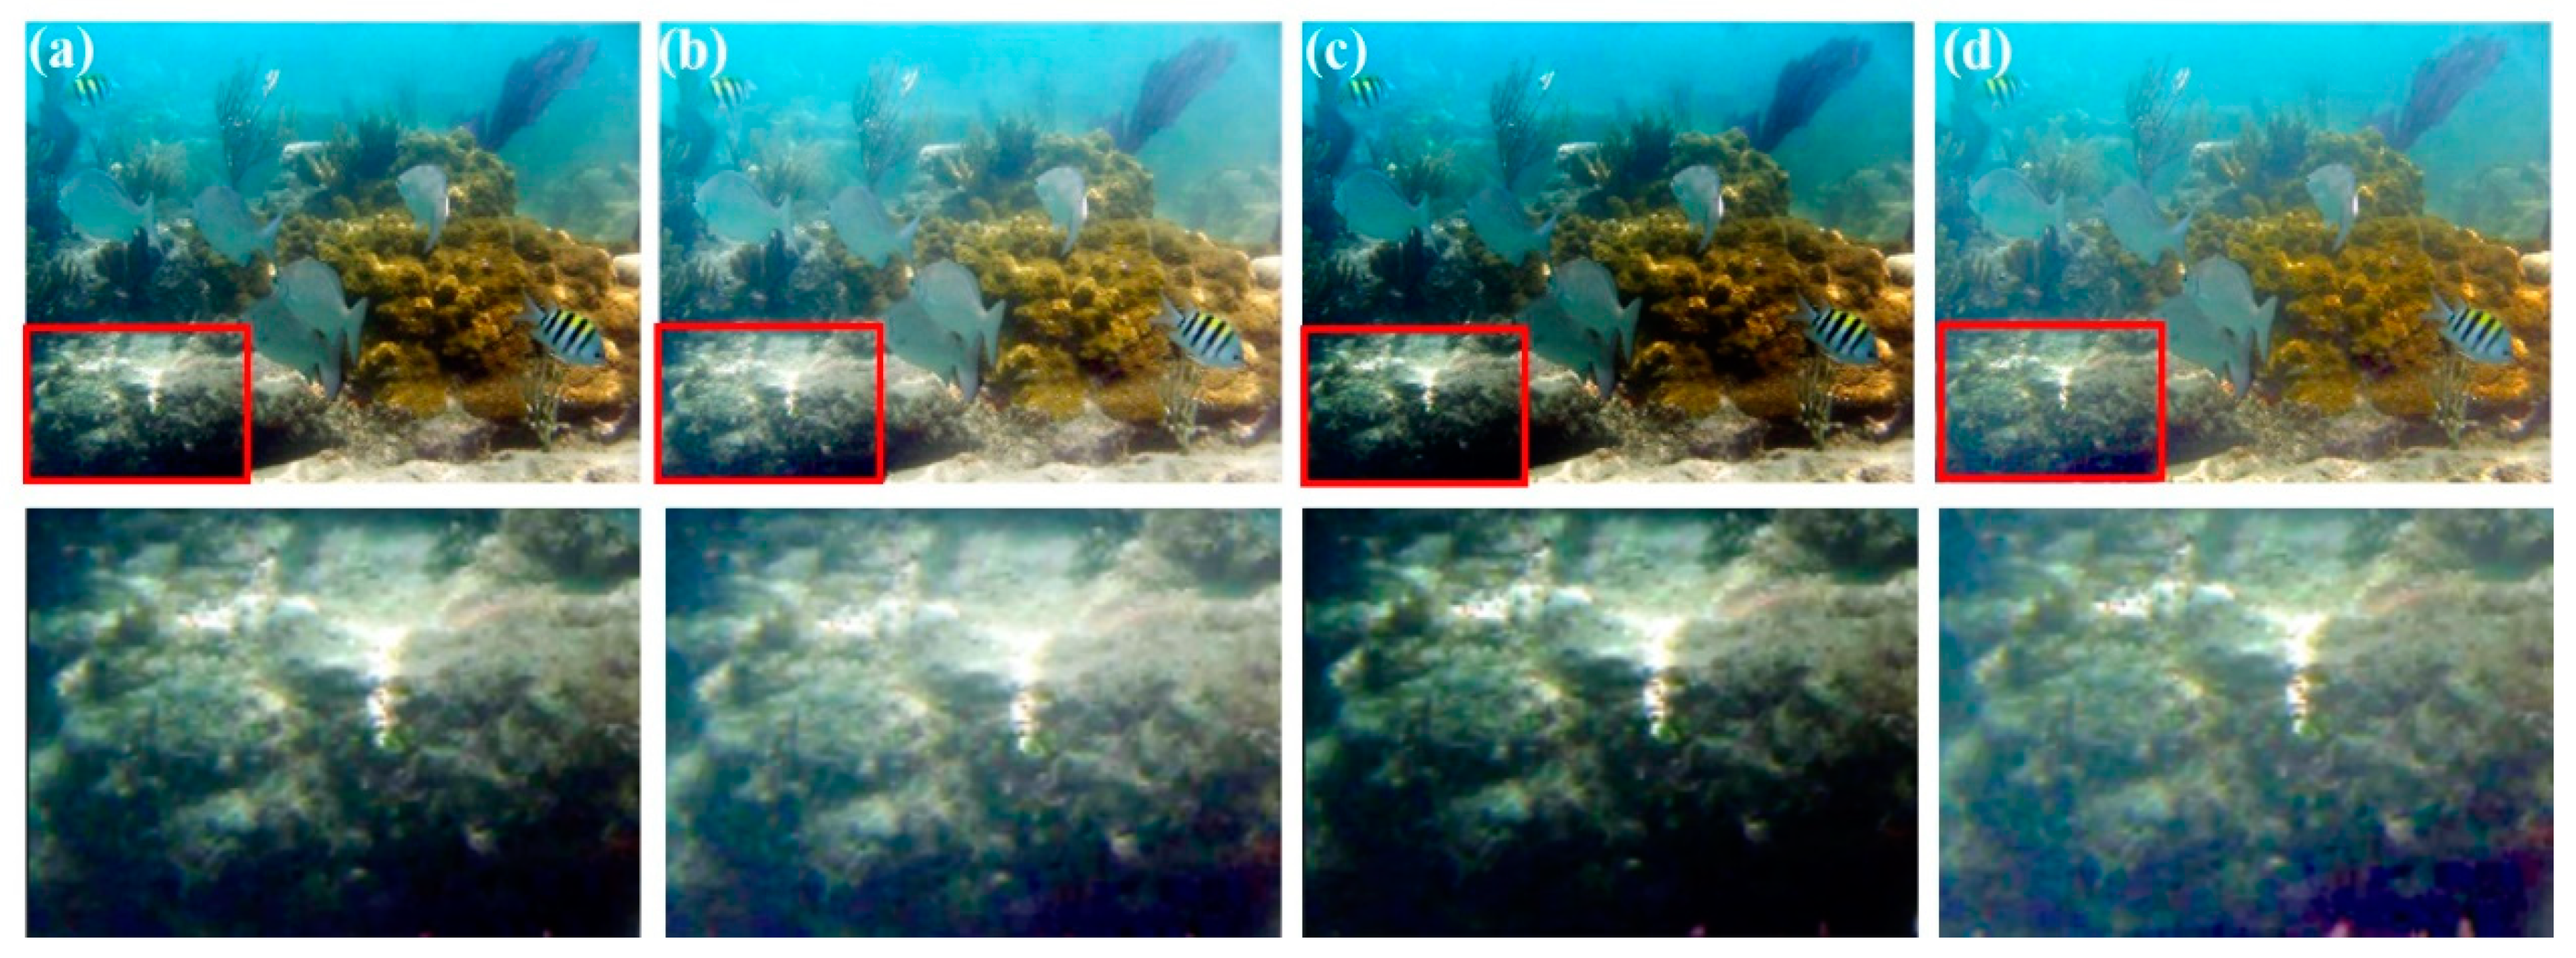
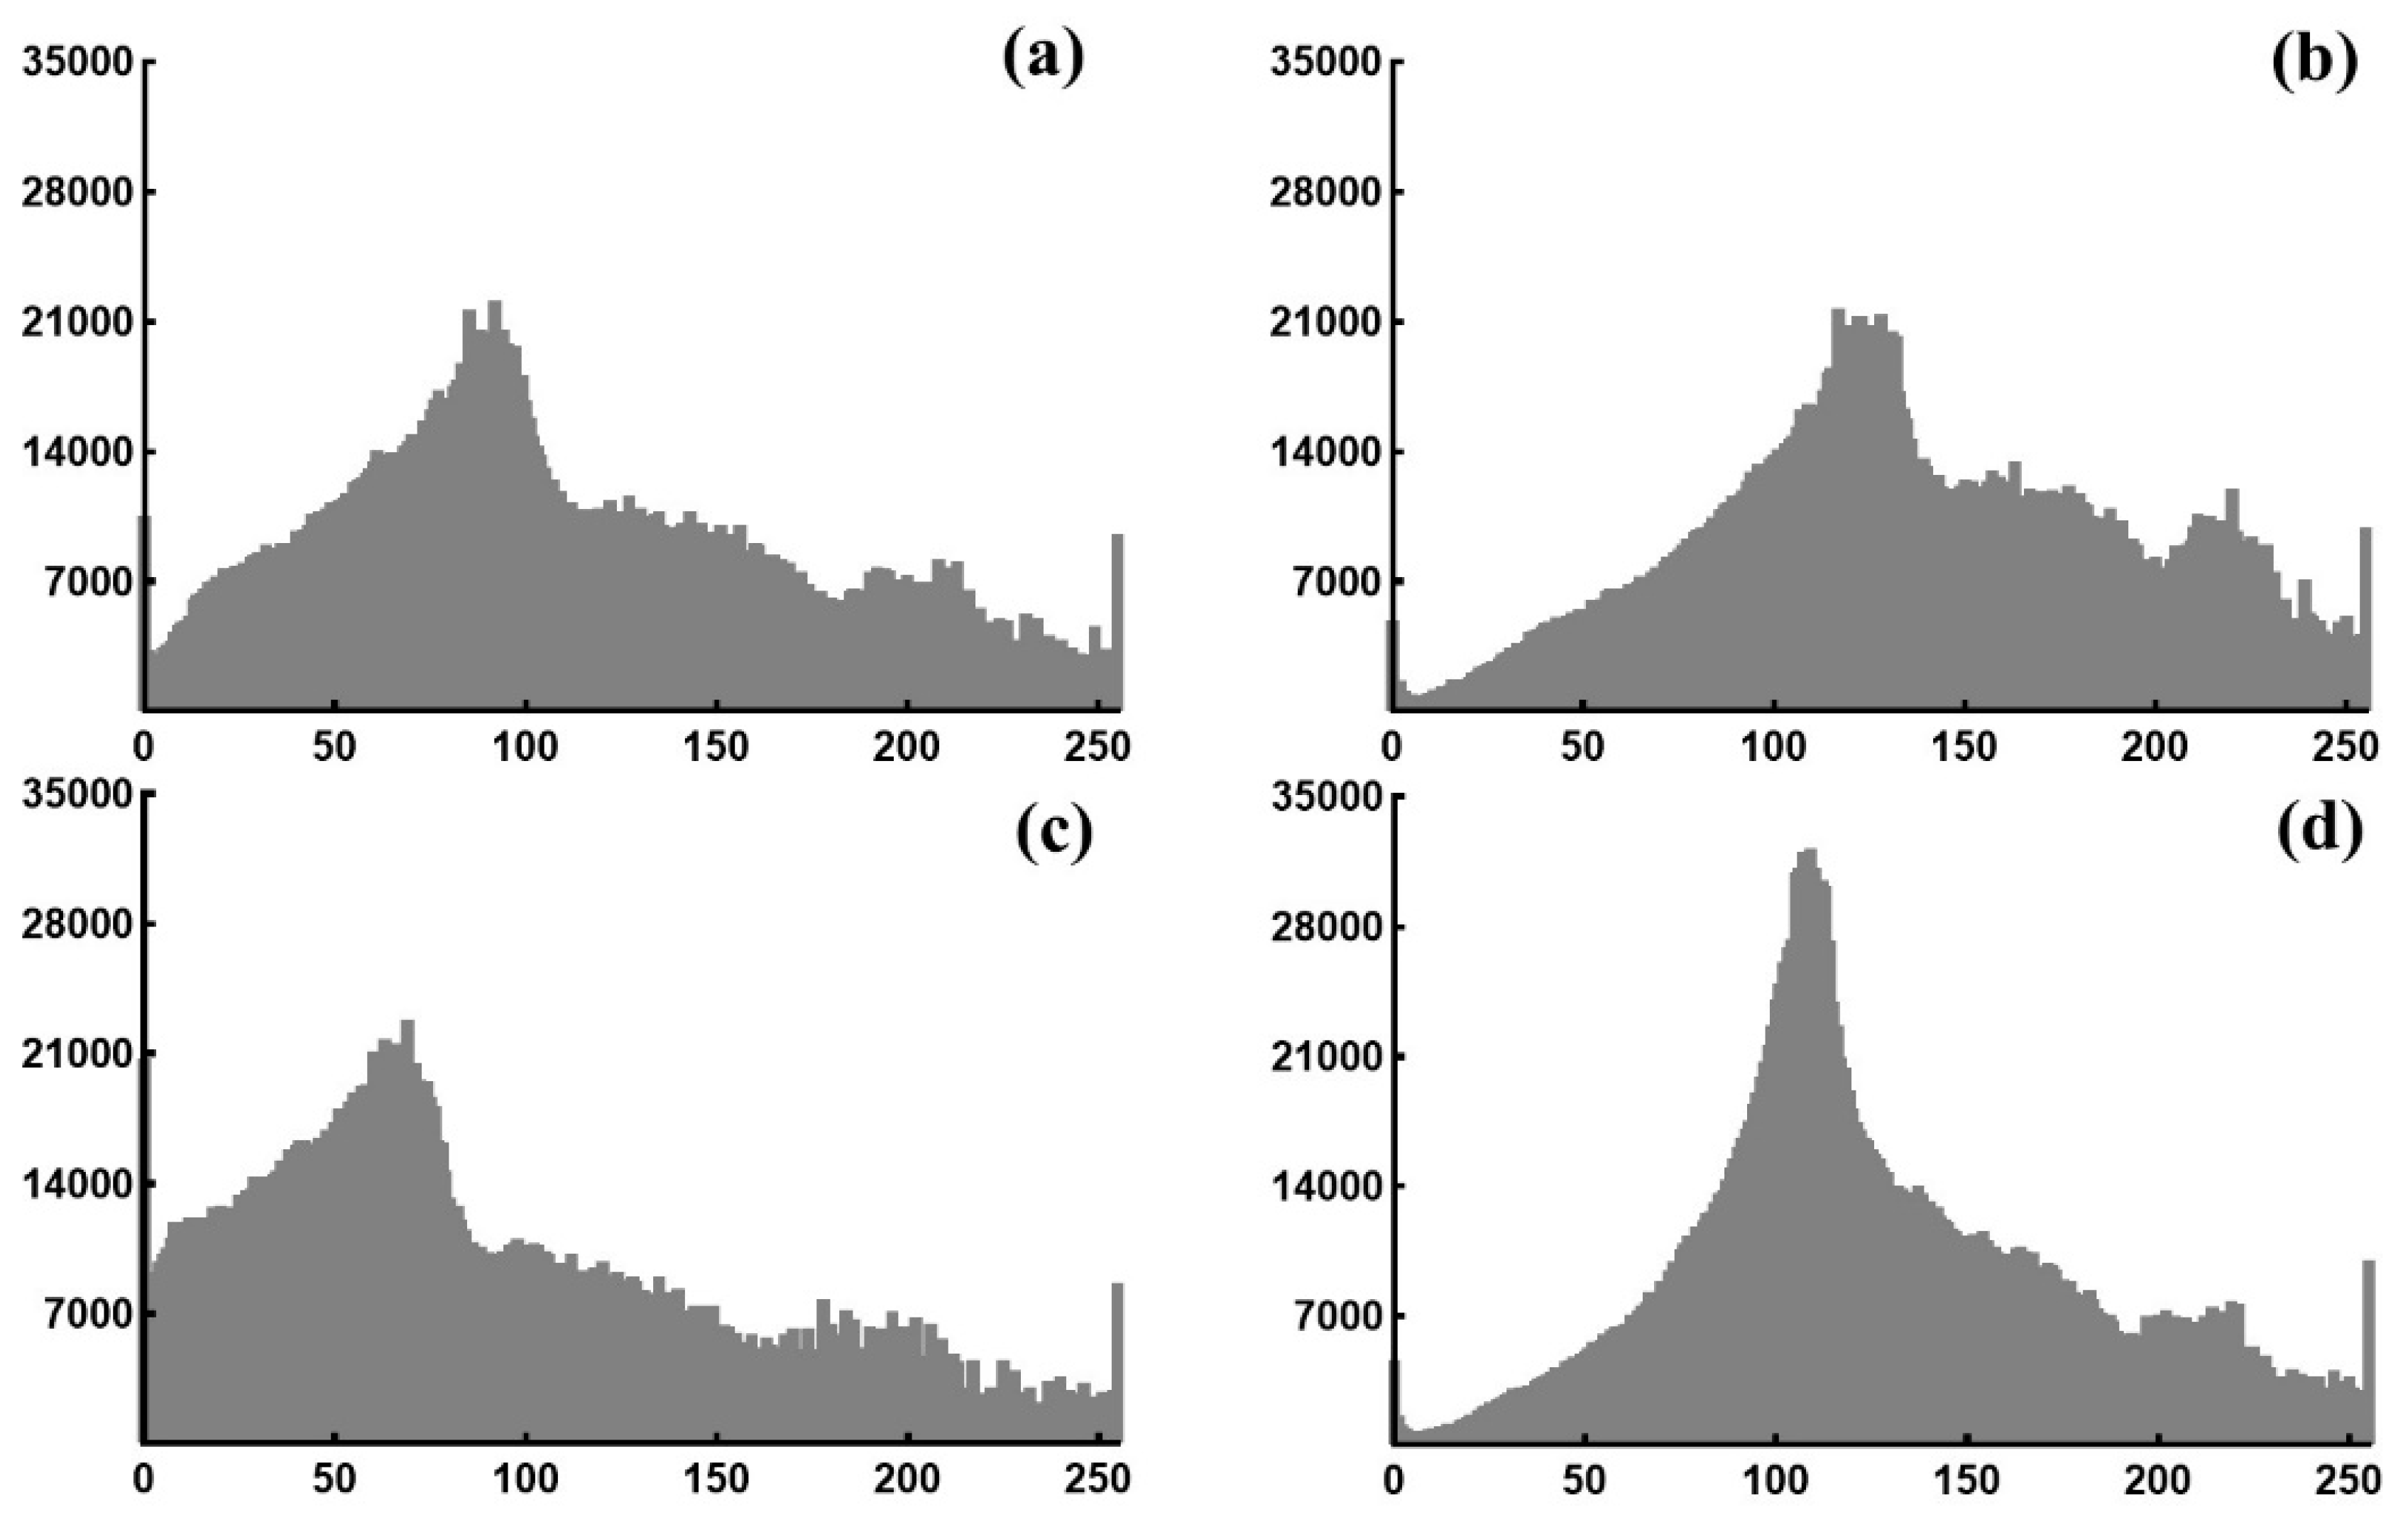
3.2. Contrast Correction Experiment

A bluish-green underwater scene image with extreme light and dark areas is selected from the dataset. It is used to prove the effectiveness of the improved LCC method in this study. Figure 3a is the image after white balance, and Figure 3b,c are the global contrast correction. The last two figures are the processing effect of γ = 0.7 and γ = 1.3, respectively. Figure 3b,c are brighter and darker overall than the original image, respectively. Concerning the area within the red frame, although Figure 3b brightens the dark area, it makes the original bright area too bright. Figure 3c makes the dark area darker while suppressing the bright area, thus losing more image information. Figure 3d is the improved LCC method in this study. In the red frame, the bright area is not too bright, and the image information of the dark area is obtained. The improved method has also captured more natural colors than the global contrast method. Note that the experimental results presented in this section are not the final results, but the results of LCC, it looks blurred visually because the image is not sharpened.
From the gray histogram (see Figure 4), compared with the global contrast correction, the improved method considers the suppression of extremely bright areas and enhancement of extremely dark areas. As a result, more pixels are concentrated in the middle area.

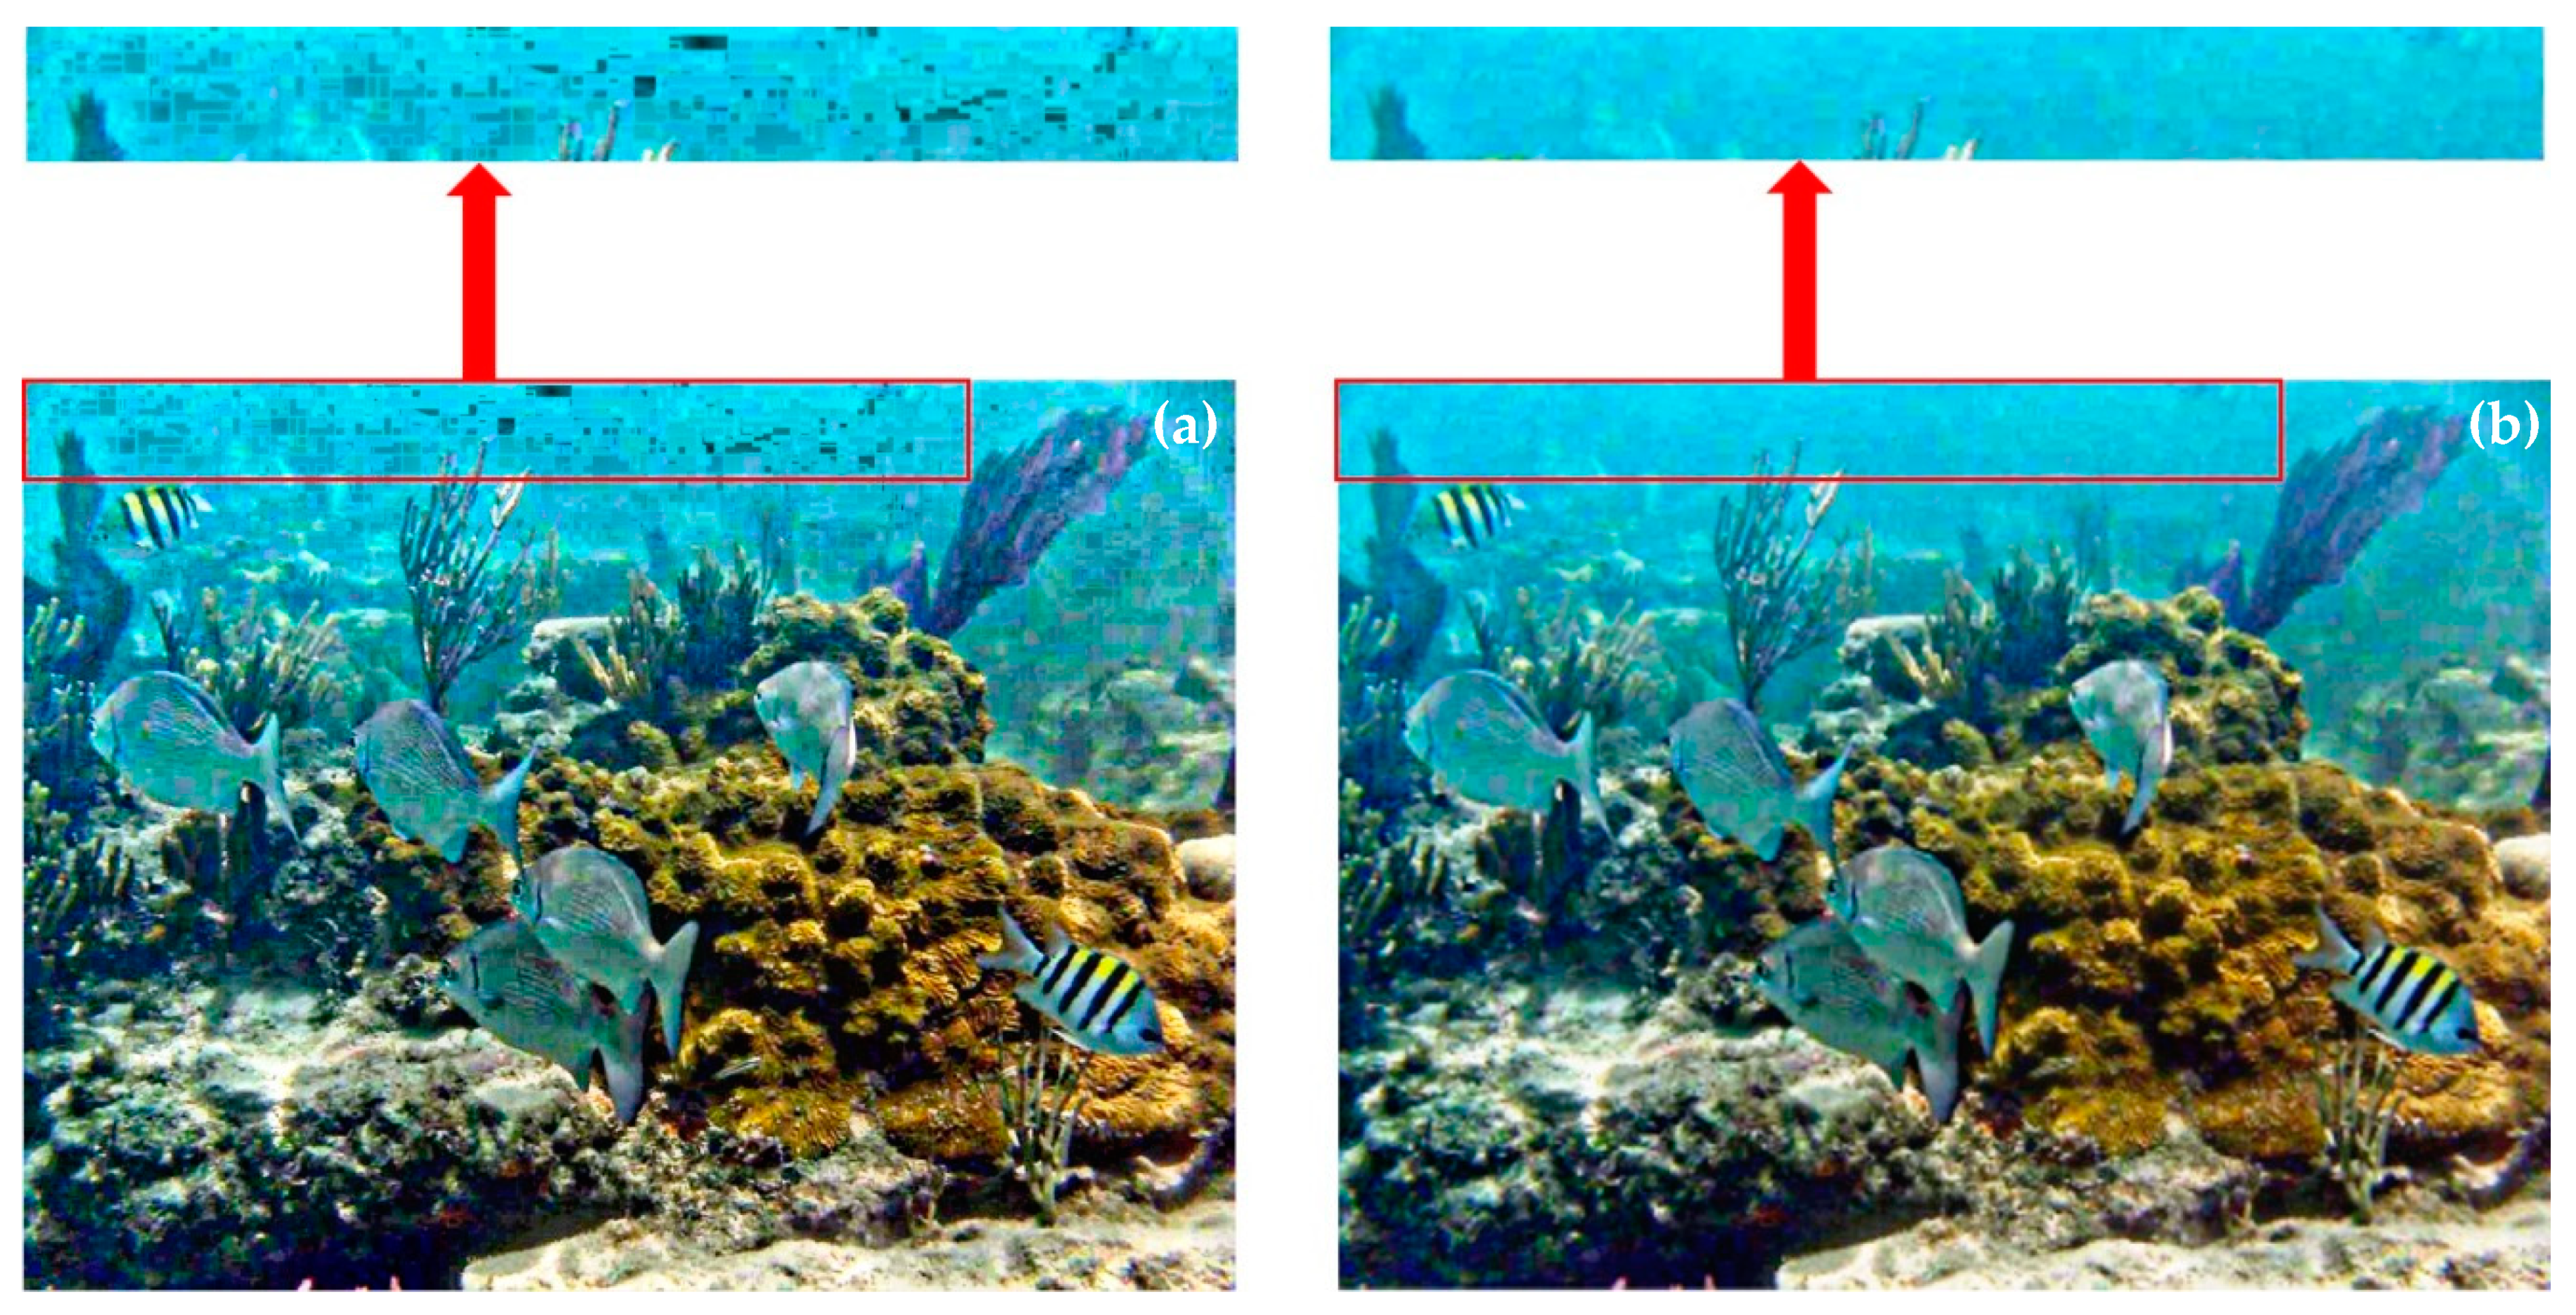
3.3. Comparison of Simple Weighted Fusion and Multi-Scale Fusion

The advantage of a multi-scale fusion strategy over a simple weighted fusion is that it can effectively avoid artifacts in fusion results. Figure 5 is a comparison between using simple weighted addition and multi-scale Laplacian pyramid decomposition fusion. The enlarged area in the red box shows that many unnecessary block artifacts will appear in the image when the simple weighted addition fusion method is used. The multi-scale fusion strategy can effectively suppress the artifacts, as shown in Figure 5b.

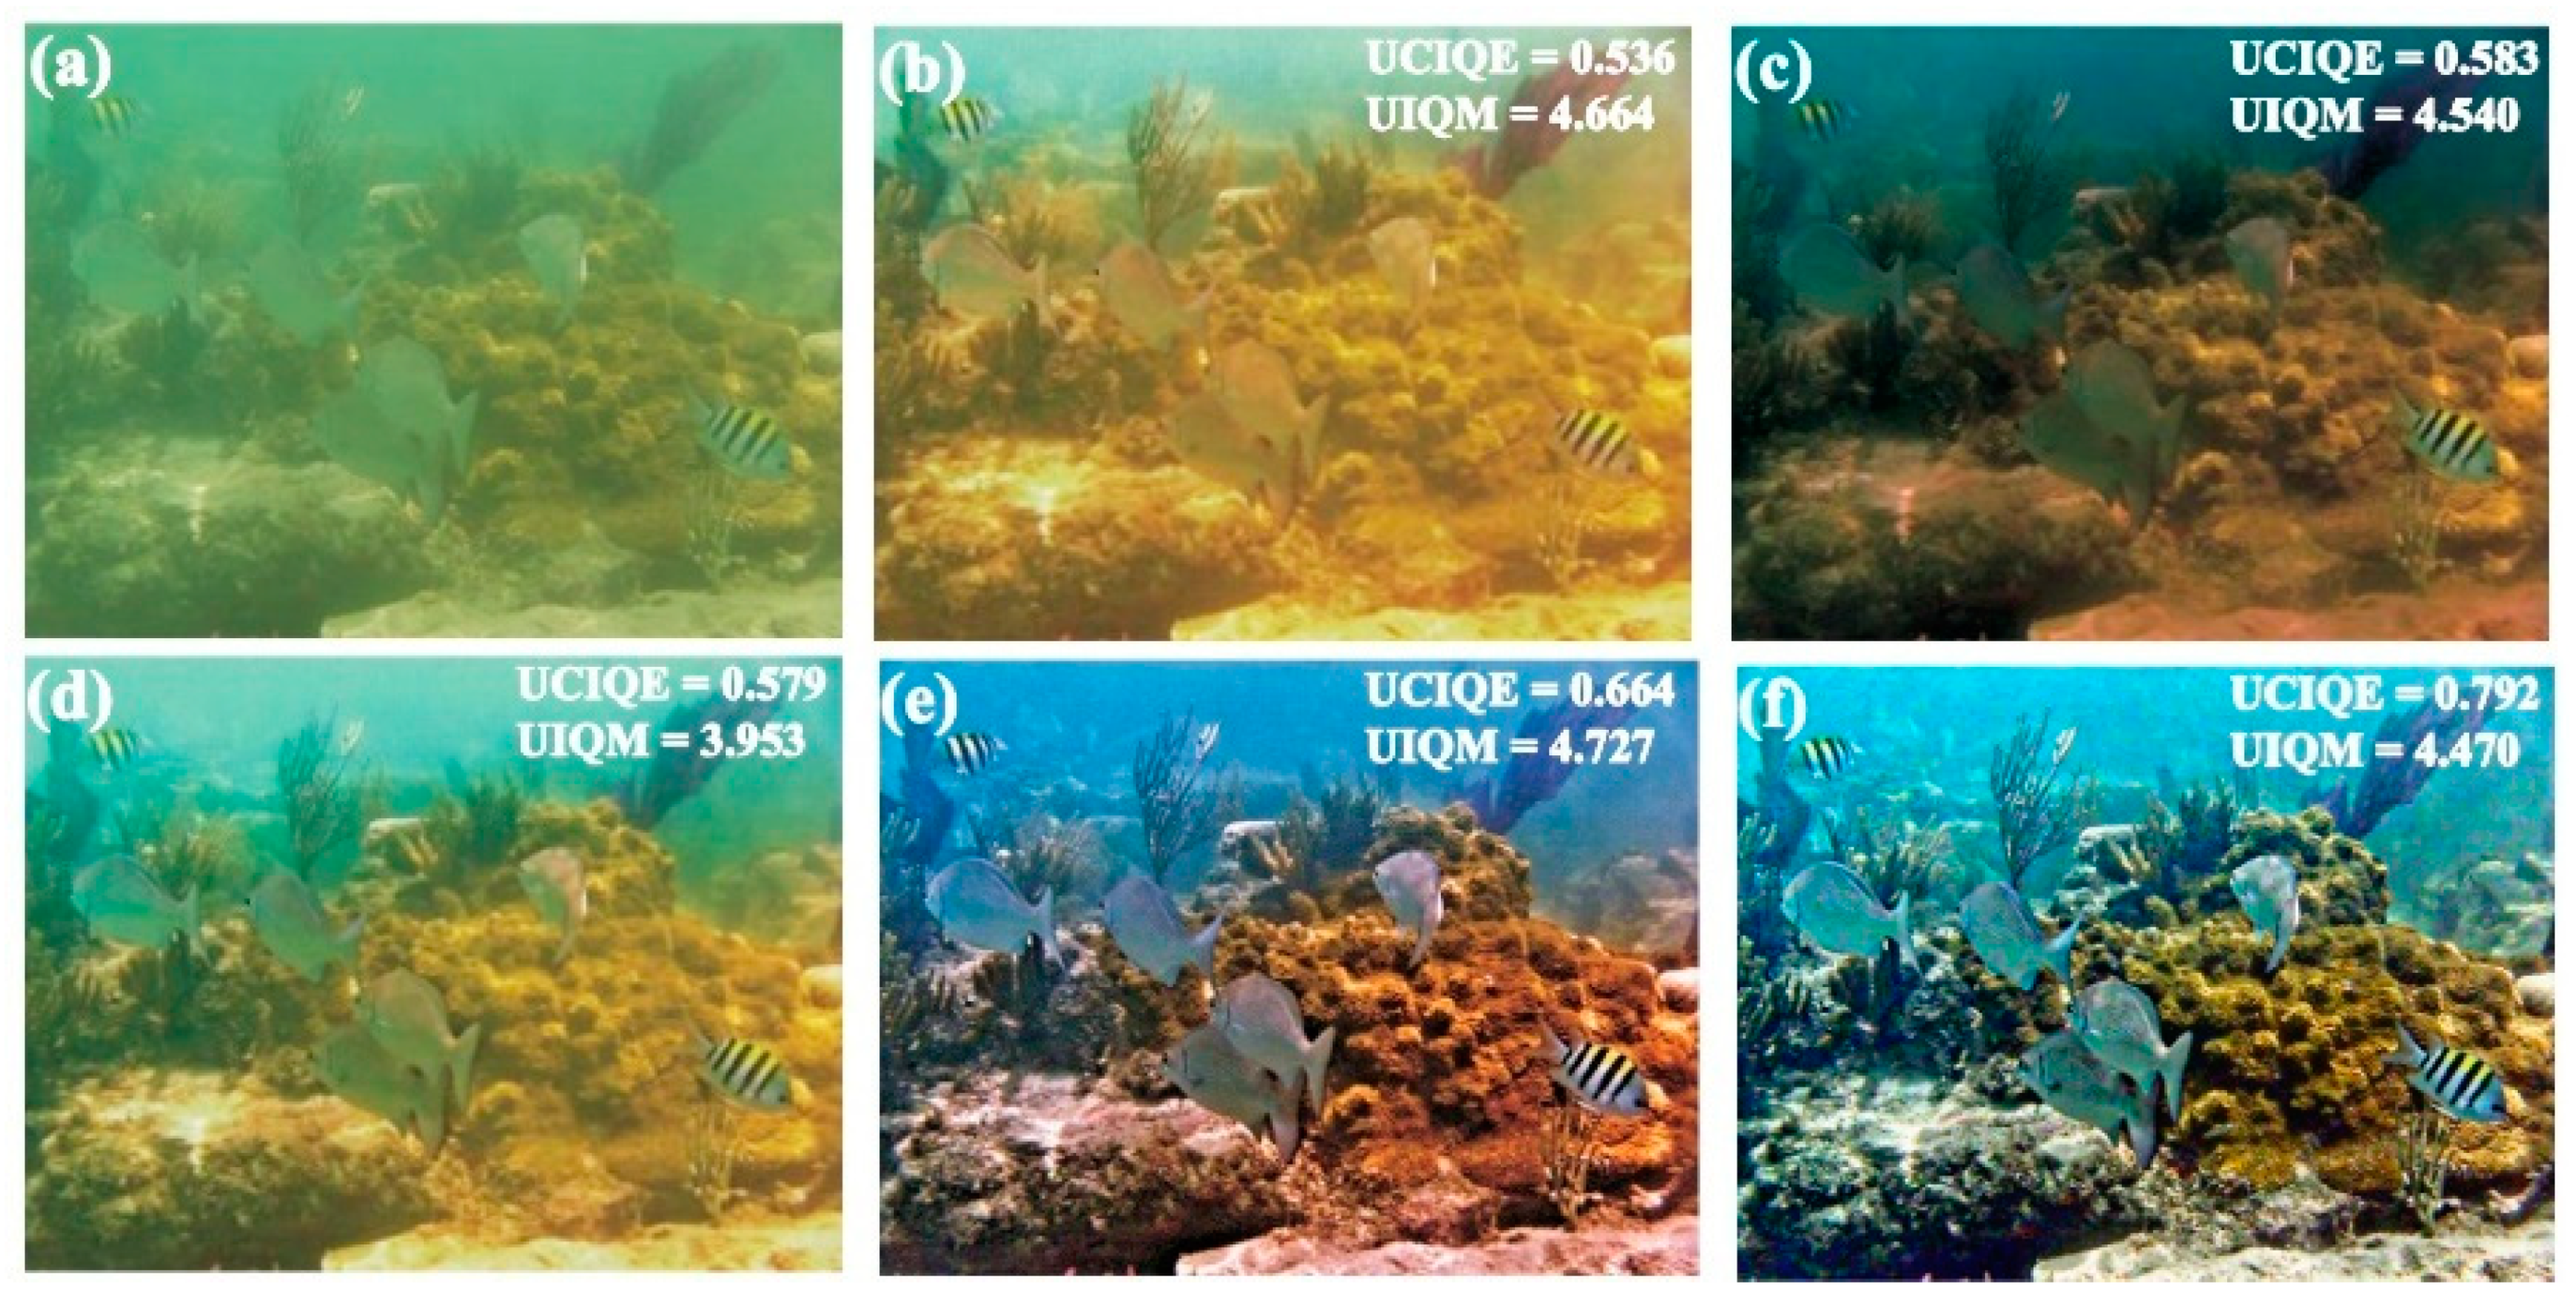
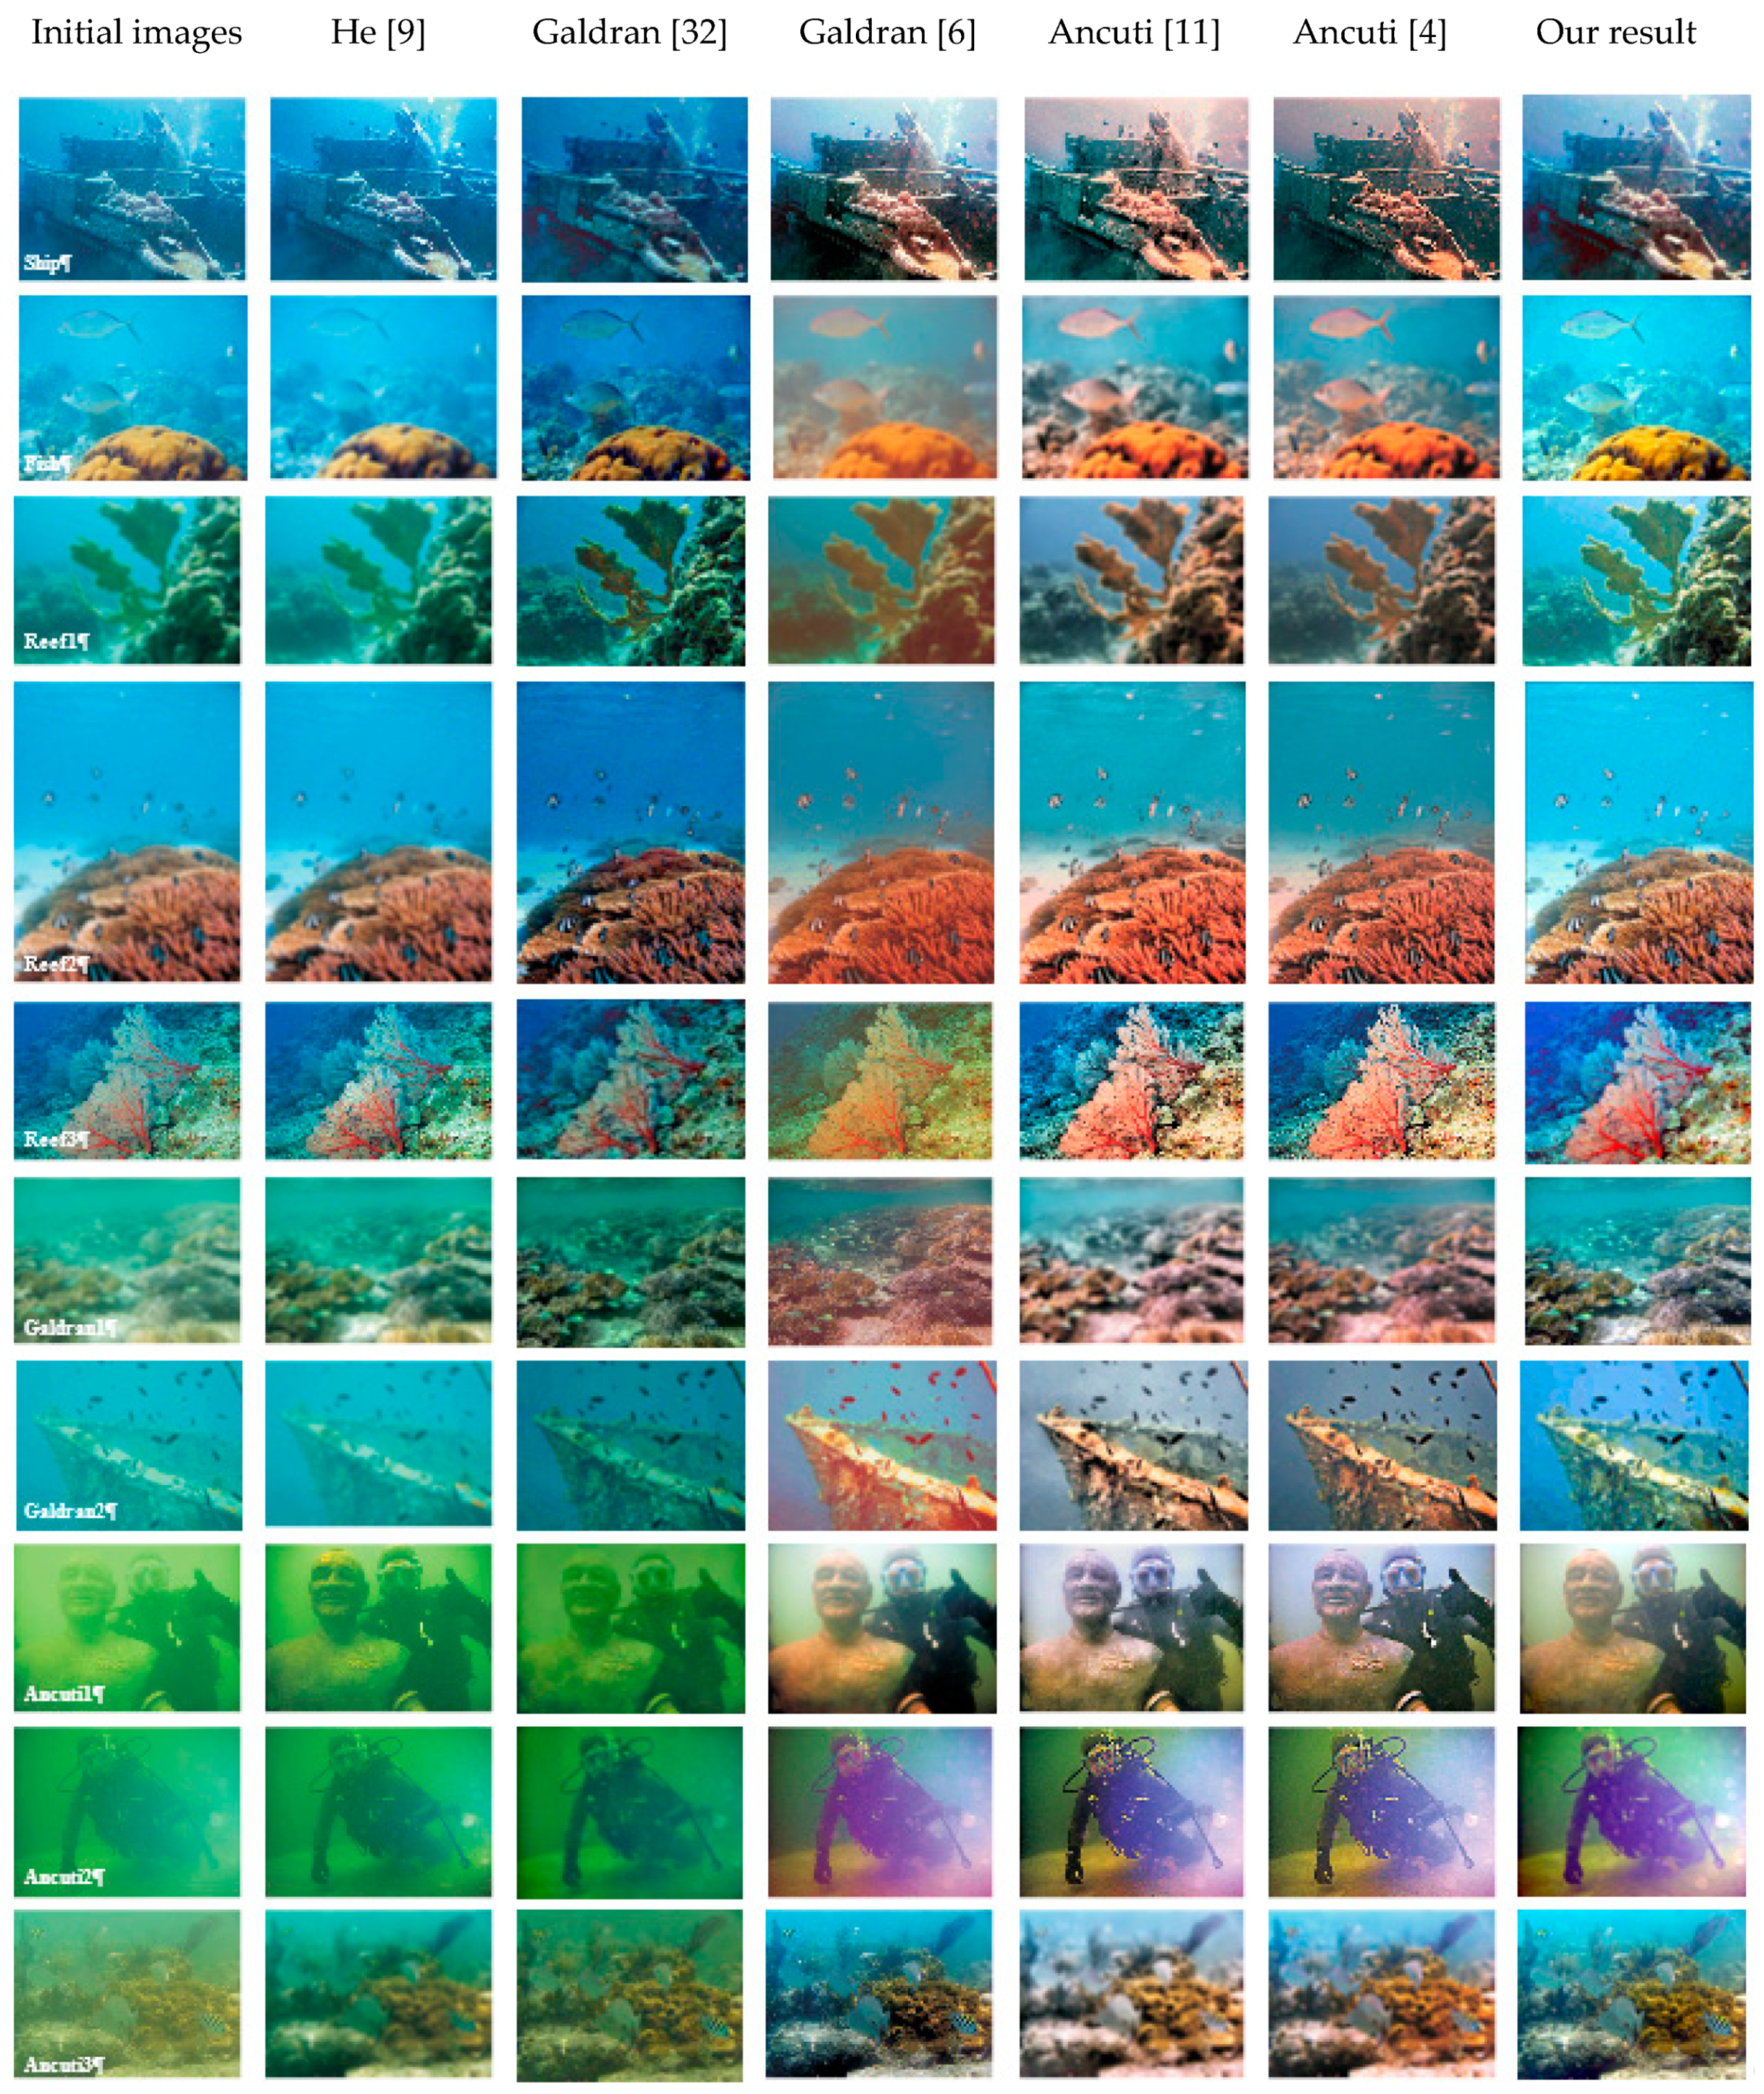
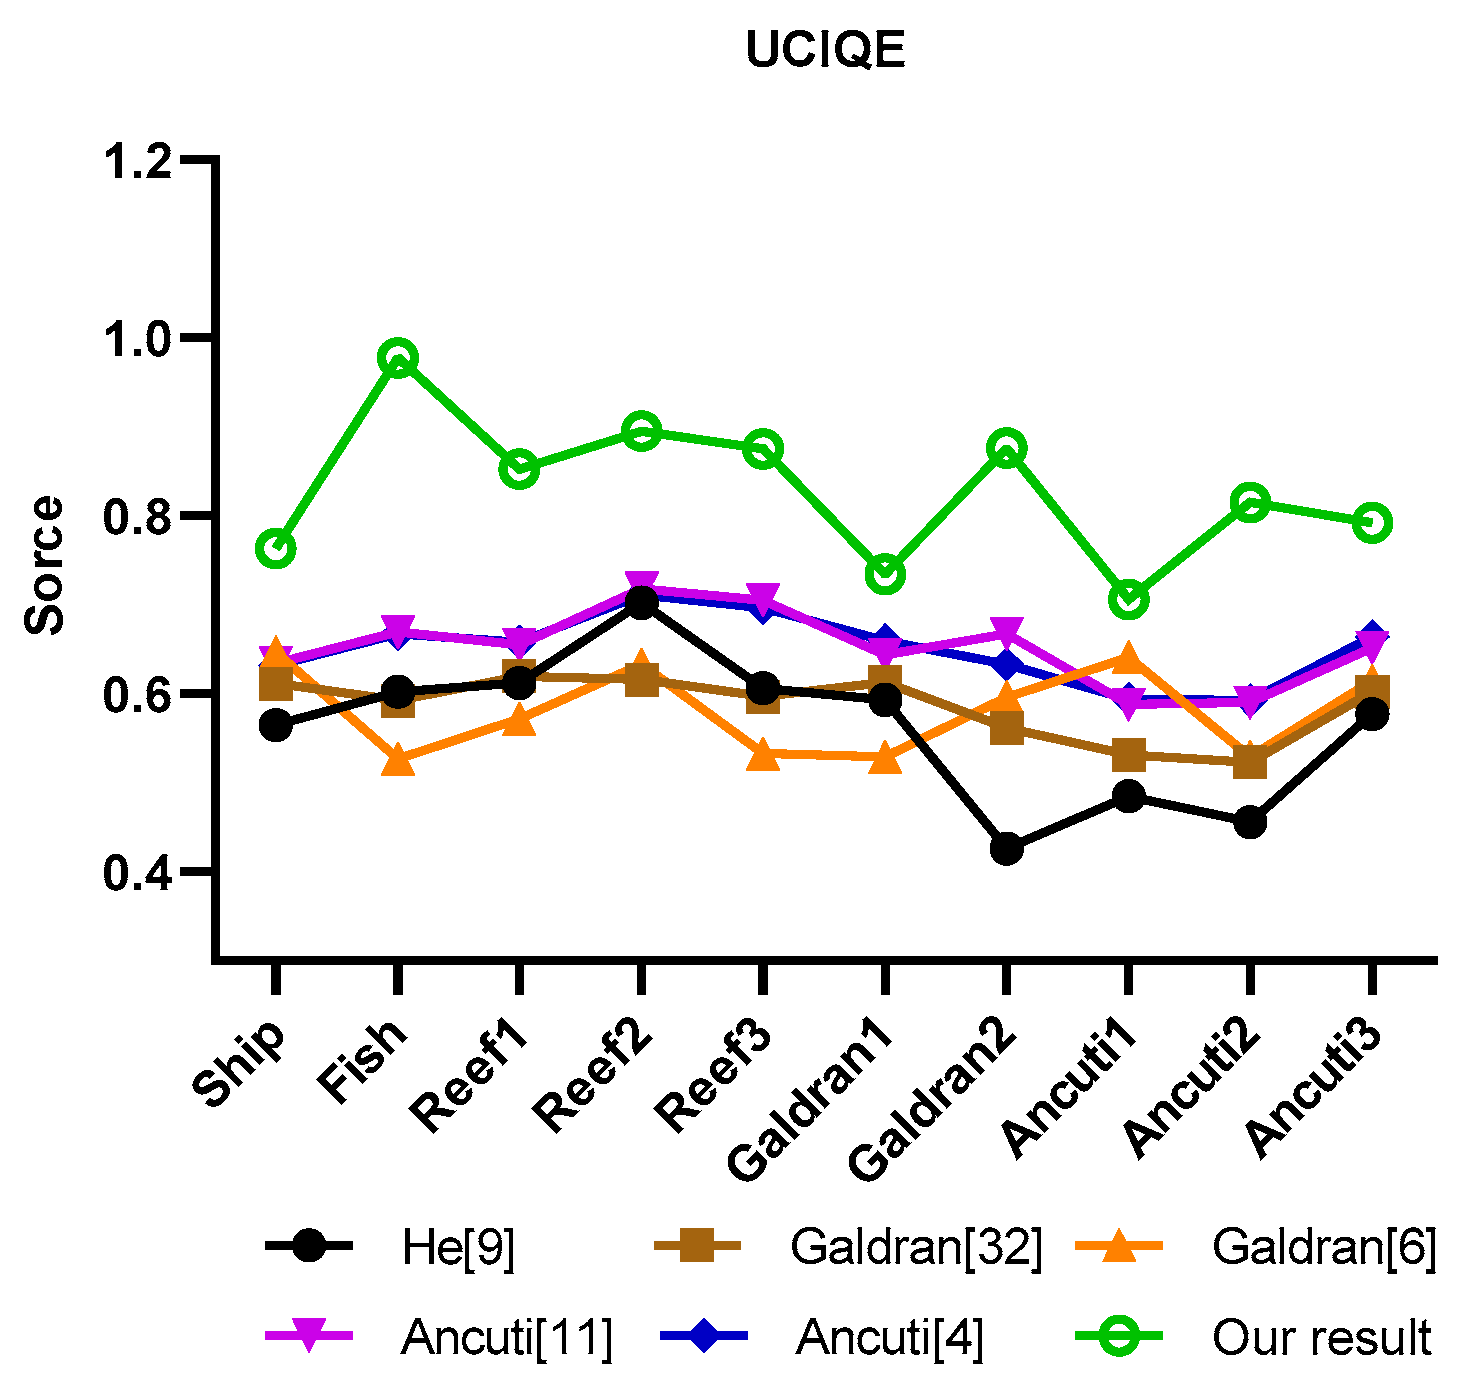
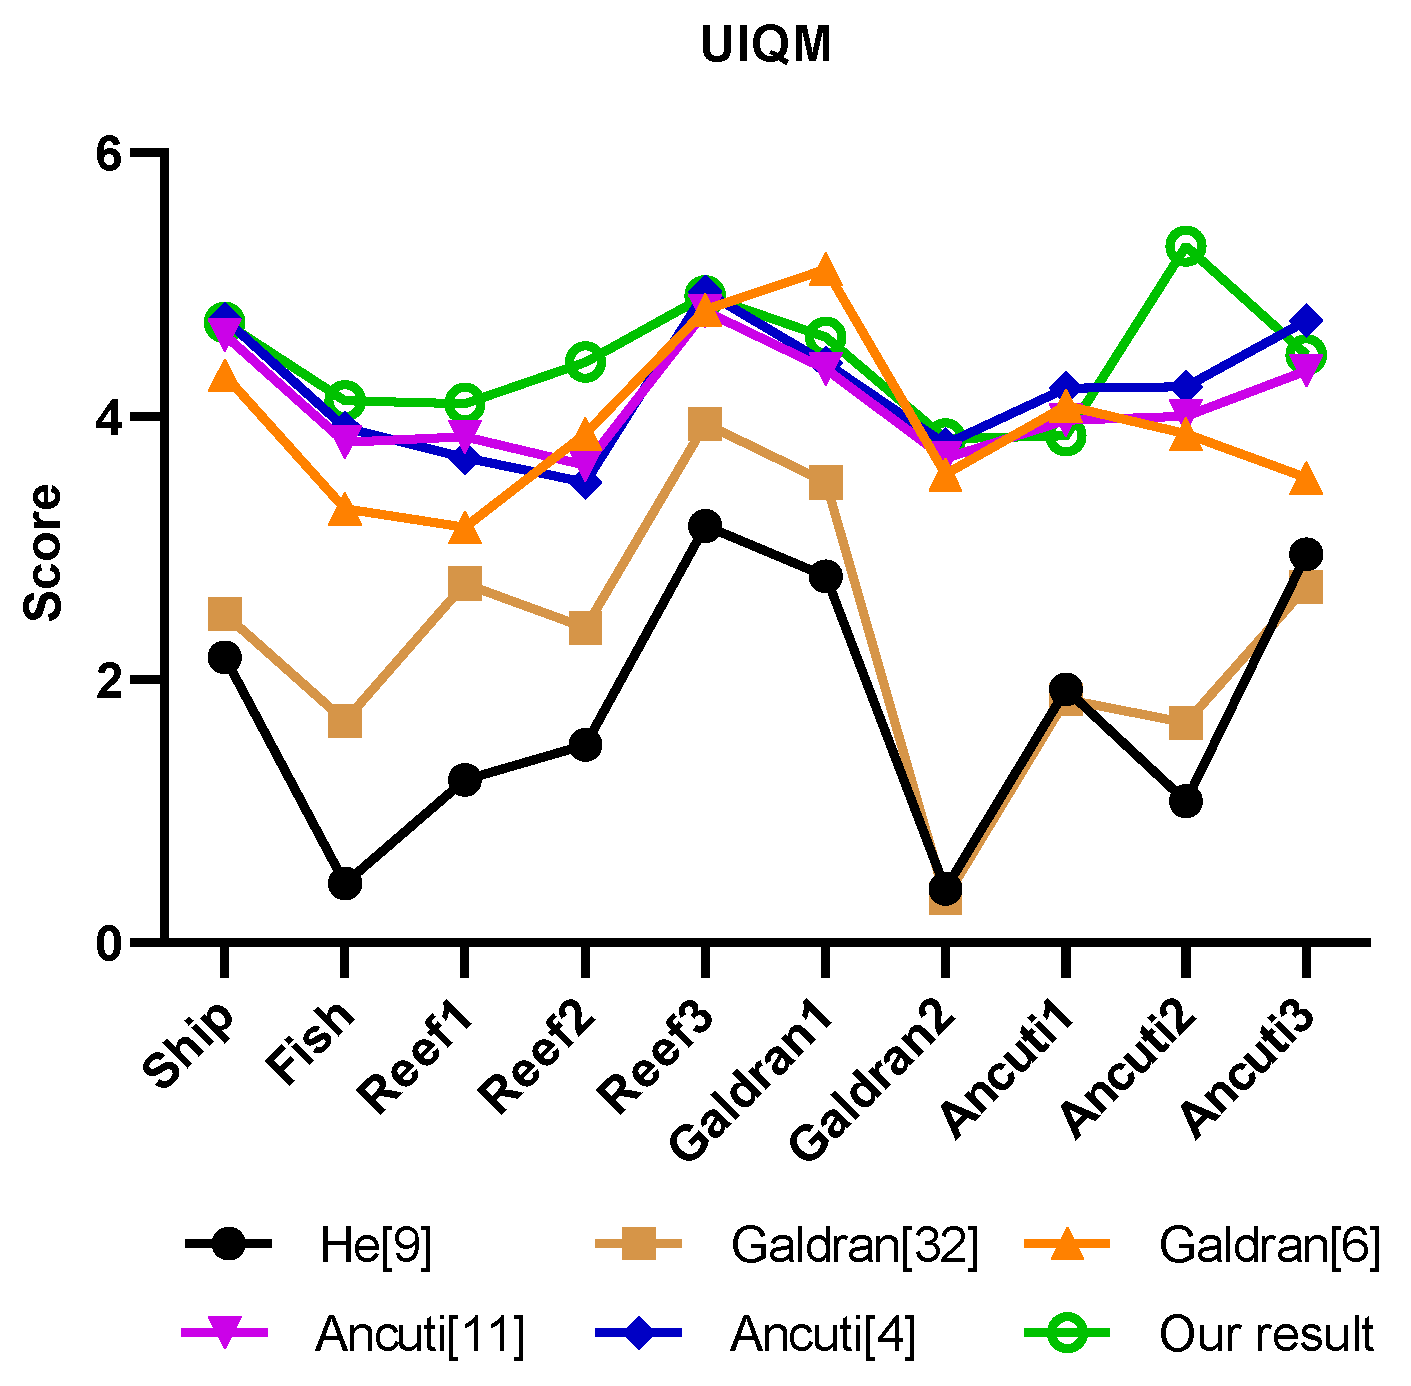
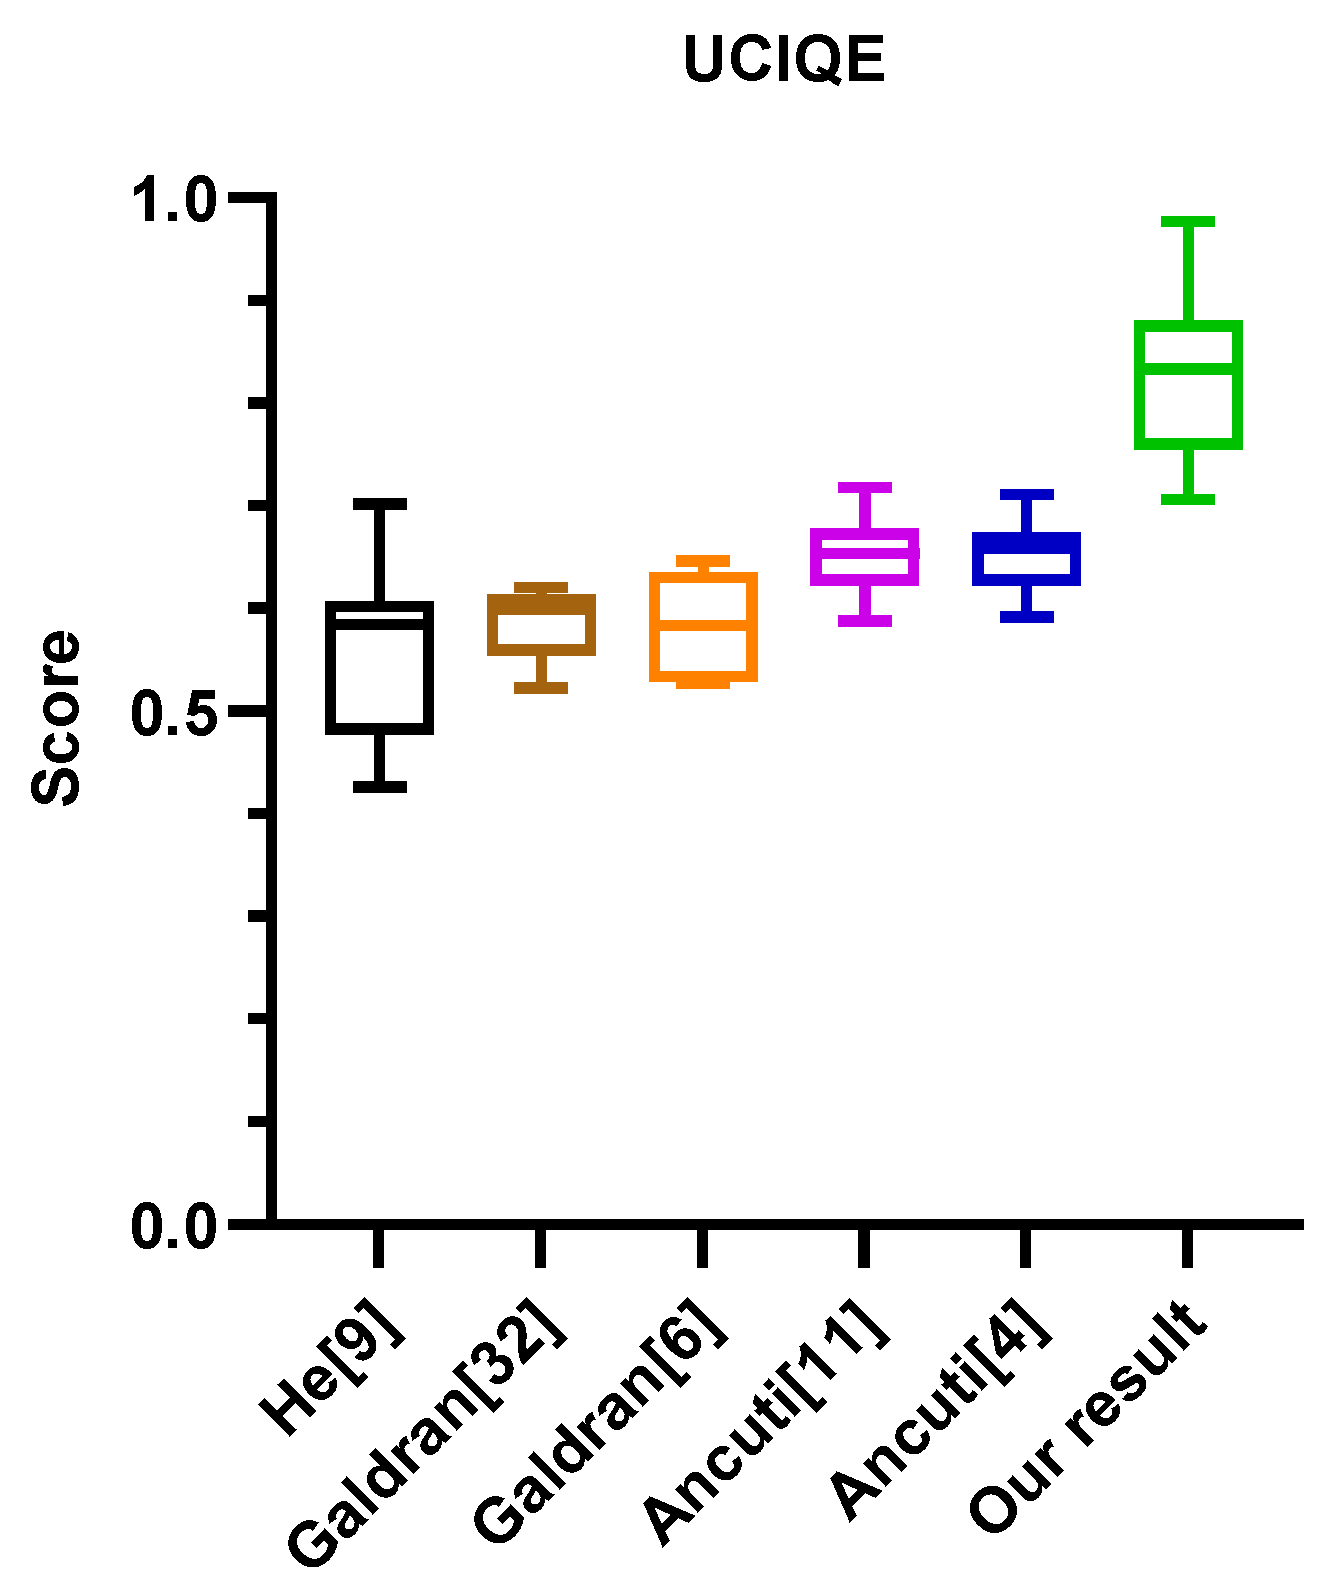
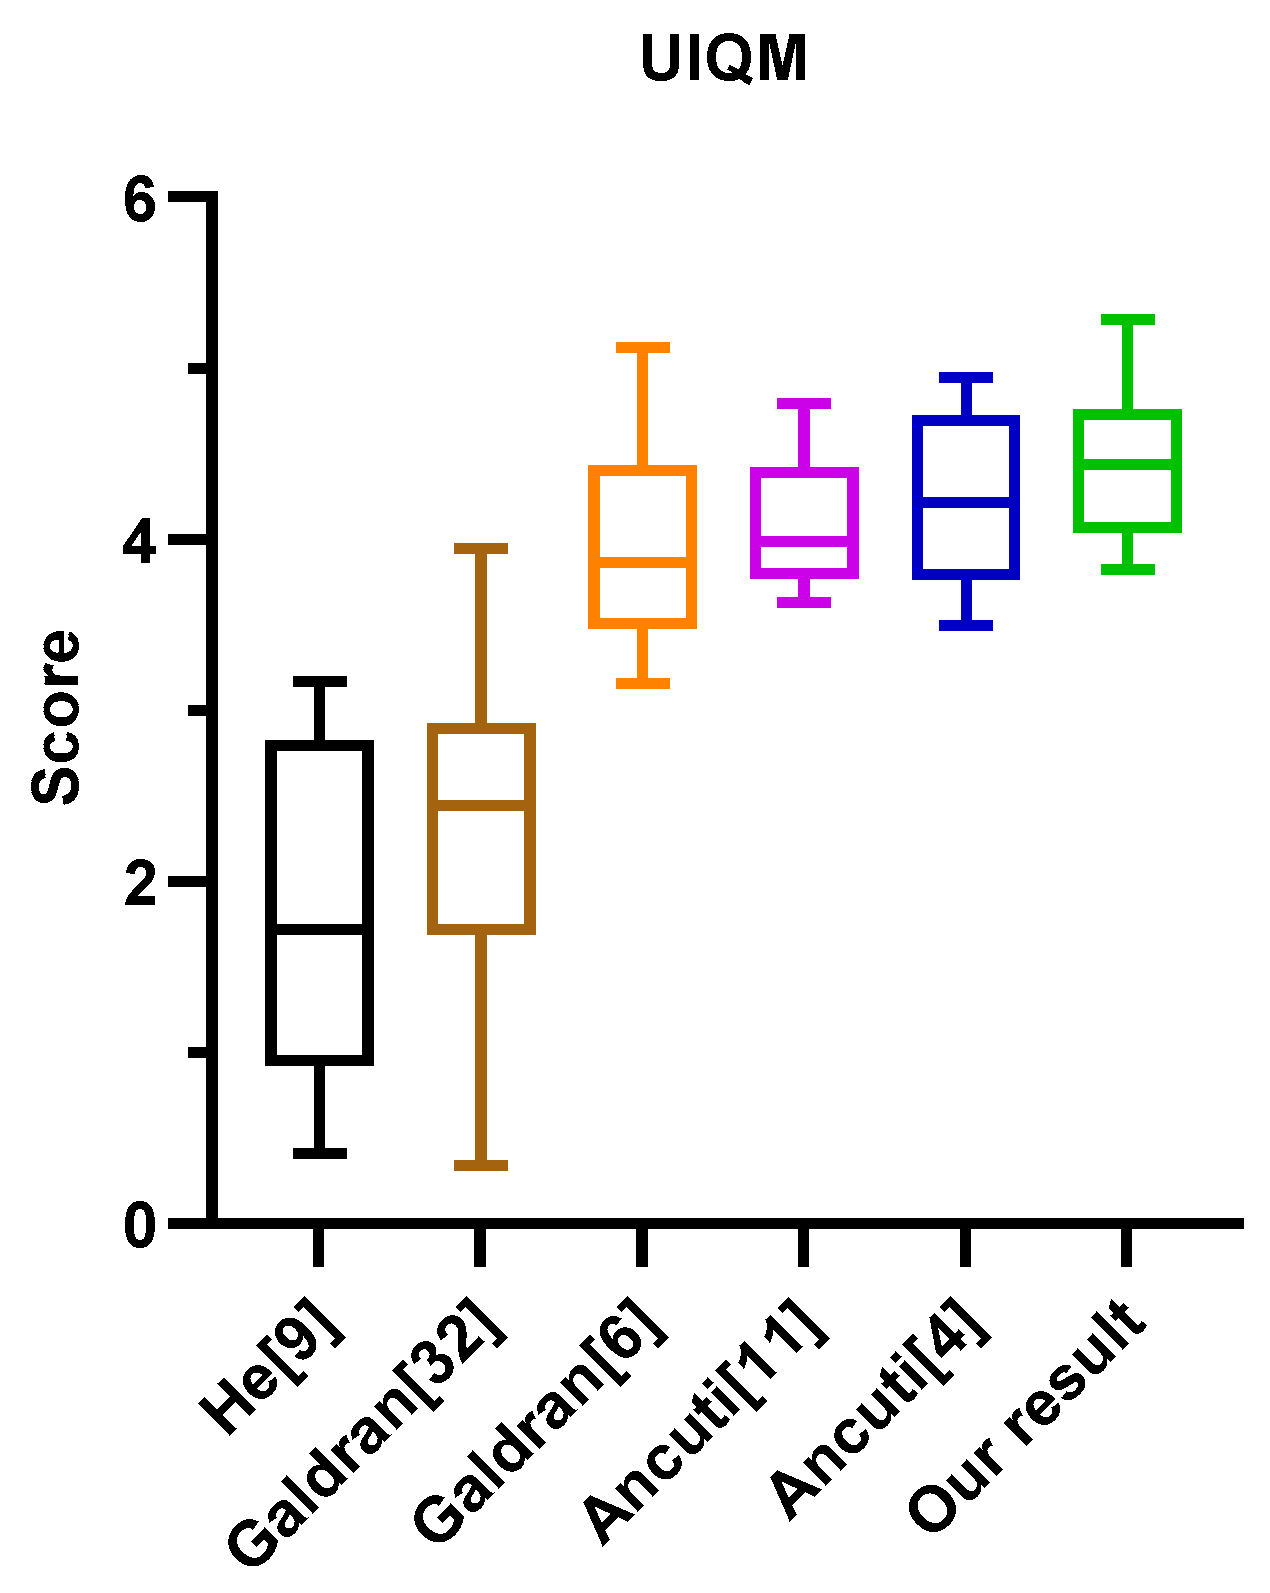
3.4. Image Qulity Evaluation

The typical underwater images of blue, green, and blue-green scenes are selected for comparative experiments. They are used to verify the applicability of the proposed algorithm in different scenes. The colorfulness and detail are compared, and the quantitative indicators UCIQE and UIQM are used for score comparison. The effect of the proposed algorithm on image detail enhancement is verified by feature point matching.
The comparison between the image enhancement results of the proposed and other algorithms is shown in Figure 6. The hue of Figure 6b is brighter based on the original image, and the oversaturation of the red channel makes the image redder. The image of Figure 6c is darker after processing, and the effect of Figure 6d is better than those of Figure 6a,c. However, these three methods cannot effectively remove the atomization effect of the underwater image. The details are also not prominent. The fusion strategy is used, as shown in Figure 6e. Compared with other methods, it can restore the color and enhance the image details. The details are strengthened, and the phenomenon of red saturation is suppressed in this study.
More underwater image contrast experiments, including serious color distortion and unclear details, are shown in Figure 7. Concerning color correction, Reference [9] and Reference [32] fail to improve color distortion. The results of Reference [6] produce different degrees of red saturation phenomenon. By contrast, the proposed method effectively suppresses the red oversaturation phenomenon, and the visual experience is better than the other methods. Concerning detail enhancement, the performance of Reference [11] in the underwater environment with serious color distortion is not good. The results are generally bright, and the image details are lost. The improved effect of Reference [4] is better. The proposed method further improves the detail effect of the image. It also considers color correction and detail enhancement, and the overall visual effect is better than Reference [9] and Reference [33] and slightly better than Reference [4].
Next, the comparison results in Figure 7 are evaluated by the UCIQE and UIQM performance metrics, and the evaluation results are shown in Table 2. The highest evaluation metric result indicates the underline. In the UCIQE metric, this method is better than the comparison method in the UQIM metric after integrating the uneven color blur and low contrast of the underwater image. Overall, this method is better than the contrast method in terms of image color, sharpness, and contrast.
The UCIQE and UIQM evaluation metrics obtained by applying different methods in different underwater scenes in Table 2 are drawn into a line chart to show the advantages of this method intuitively. The UCIQE metric is greatly improved compared with other methods, as shown in Figure 8. The UIQM metric also has a better performance than Ref. [6], Ref. [11], and Ref. [4], as shown in Figure 9.
The robustness of the method is discussed, and the data in Table 2 are further analyzed. The box graph is drawn, as shown in Figure 10 and Figure 11. The upper and lower edges of each box graph represent the upper and lower limits of the evaluation metric, respectively, and the green line represents the median of the evaluation metric. No outliers are observed in the evaluation of the UCIQE and UIQM metrics, and the fluctuation is smaller than the other methods. Thus, the proposed method has good performance in underwater images in different scenes.
Feature point matching is one of the basic tasks in computer vision algorithms, which is helpful to underwater animal classification and fish recognition [34]. The accuracy of feature point matching can prove the effectiveness of the method in detail enhancement. In this study, the scale-invariant feature transform (SIFT) operator is used for matching the feature points of two groups of underwater images, and the same experiment is done on the processed images. The results show that the number of local feature points of the processed images has increased significantly (see Figure 12).
The proposed method is superior to the existing newer methods in overall effect, but it also has some limitations. It cannot effectively suppress the scattered speckle interference light in the underwater scene (such as ship and Ancuti2 in Figure 7). Although it aims to restore and enhance the underwater image, for the image with low resolution (the image contains some mosaics), the unnatural block mosaics will be enhanced in image detail enhancement. It cannot also process the motion-blurred image effectively.

4. Conclusions

In this study, the traditional global contrast method is improved and combined with a multi-scale fusion strategy, aiming at a single image, without the help of image formation model and many datasets. The experimental results show that the proposed method considers the color restoration and detail enhancement of underwater images, and it has a good effect in contrast correction. In the qualitative and quantitative comparative experiments, the improved method has shown better performance than the recent methods. The SIFT feature point matching is also compared before and after image enhancement. The comparison results prove the effectiveness of this method in image detail enhancement. The limitations of this study will be solved in future works.

Author Contributions

All authors contributed substantially to this study. Individual contributions were conceptualization, F.G. and K.W.; methodology, K.W., Z.Y., and Q.Z.; software, K.W.; validation, F.G., K.W., and Z.Y.; formal analysis, K.W.; investigation, Z.Y. and Y.W.; resources, Z.Y. and Y.W.; writing—original draft preparation, K.W.; writing—review and editing, F.G. All authors have read and agreed to the published version of the manuscript.

Funding

This research was funded by the Open Foundation of Key Laboratory of Submarine Geosciences, MNR, grant number KLSG2002.

Institutional Review Board Statement

Not applicable.

Informed Consent Statement

Not applicable.

Data Availability Statement

The publicly archived datasets of the underwater image data used in this paper, are derived from Li’s website: https://li-chongyi.github.io/proj_benchmark.html.

Conflicts of Interest

The authors declare no conflict of interest.

References

  1. Yang, M.; Sowmya, A. An underwater color image quality evaluation metric. IEEE Trans. Image Process. 2015, 24, 6062–6071. [Google Scholar] [CrossRef] [PubMed]
  2. Wang, N.; Zheng, H.; Zheng, B. Underwater image restoration via maximum attenuation identification. IEEE Access 2017, 5, 18941–18952. [Google Scholar] [CrossRef]
  3. Wang, Y.; Song, W.; Fortino, G.; Qi, L.-Z.; Zhang, W.; Liotta, A. An experimental-based review of image enhancement and image restoration methods for underwater imaging. IEEE Access 2019, 7, 140233–140251. [Google Scholar] [CrossRef]
  4. Ancuti, C.O.; Ancuti, C.; De Vleeschouwer, C.; Bekaert, P. Color balance and fusion for underwater image enhancement. IEEE Trans. Image Process. 2017, 27, 379–393. [Google Scholar] [CrossRef] [PubMed] [Green Version]
  5. Lu, H.; Li, Y.; Zhang, L.; Serikawa, S. Contrast enhancement for images in turbid water. J. Opt. Soc. Am. A 2015, 32, 886–893. [Google Scholar] [CrossRef] [PubMed] [Green Version]
  6. Galdran, A.; Pardo, D.; Picón, A.; Alvarez-Gila, A. Automatic red-channel underwater image restoration. J. Vis. Commun. Image Represent. 2015, 26, 132–145. [Google Scholar] [CrossRef] [Green Version]
  7. Yu, X.; Qu, Y.; Hong, M. Underwater-GAN: Underwater Image Restoration via Conditional Generative Adversarial Network. In ICPR 2018: Pattern Recognition and Information Forensics; Springer: Cham, Switzerland, 2018; pp. 66–75. [Google Scholar]
  8. Hou, G.; Pan, Z.; Wang, G.; Yang, H.; Duan, J. An efficient nonlocal variational method with application to underwater image restoration. Neurocomputing 2019, 369, 106–121. [Google Scholar] [CrossRef]
  9. He, K.; Sun, J.; Tang, X. Single image haze removal using dark channel prior. IEEE Trans. Pattern Anal. Mach. Intell. 2010, 33, 2341–2353. [Google Scholar]
  10. Chiang, J.Y.; Chen, Y.-C. Underwater image enhancement by wavelength compensation and dehazing. IEEE Trans. Image Process. 2011, 21, 1756–1769. [Google Scholar] [CrossRef]
  11. Ancuti, C.; Ancuti, C.O.; Haber, T.; Bekaert, P. Enhancing underwater images and videos by fusion. In Proceedings of the 2012 IEEE Conference on Computer Vision and Pattern Recognition, Providence, RI, USA, 16–21 June 2012; pp. 81–88. [Google Scholar]
  12. Li, C.; Guo, J.; Guo, C. Emerging from water: Underwater image color correction based on weakly supervised color transfer. IEEE Signal Process. Lett. 2018, 25, 323–327. [Google Scholar] [CrossRef] [Green Version]
  13. Buchsbaum, G. A spatial processor model for object colour perception. J. Frankl. Inst. 1980, 310, 1–26. [Google Scholar] [CrossRef]
  14. Land, E.H. The retinex theory of color vision. Sci. Am. 1977, 237, 108–129. [Google Scholar] [CrossRef]
  15. Ebner, M. Color Constancy; John Wiley & Sons: Hoboken, NJ, USA, 2007; Volume 7. [Google Scholar]
  16. Finlayson, G.D.; Trezzi, E. Shades of gray and colour constancy. In Proceedings of the Twelfth Color Imaging Conference: Color Science and Engineering Systems, Technologies, Applications, Scottsdale, AZ, USA, 9–12 November 2004; pp. 37–41. [Google Scholar]
  17. Van De Weijer, J.; Gevers, T.; Gijsenij, A. Edge-based color constancy. IEEE Trans. Image Process. 2007, 16, 2207–2214. [Google Scholar] [CrossRef] [Green Version]
  18. Gijsenij, A.; Gevers, T. Color constancy using natural image statistics and scene semantics. IEEE Trans. Pattern Anal. Mach. Intell. 2010, 33, 687–698. [Google Scholar] [CrossRef]
  19. Sethi, R.; Indu, S. Fusion of underwater image enhancement and restoration. Int. J. Pattern Recognit. Artif. Intell. 2020, 34, 2054007. [Google Scholar] [CrossRef]
  20. Ju, M.; Ding, C.; Guo, Y.J.; Zhang, D. Idgcp: Image dehazing based on gamma correction prior. IEEE Trans. Image Process. 2019, 29, 3104–3118. [Google Scholar] [CrossRef]
  21. Schettini, R.; Gasparini, F.; Corchs, S.; Marini, F.; Capra, A.; Castorina, A. Contrast image correction method. J. Electron Imaging 2010, 19, 023005. [Google Scholar] [CrossRef]
  22. He, K.; Sun, J.; Tang, X. Guided image filtering. In Computer Vision—ECCV 2010; Springer: Berlin/Heidelberg, Germany, 2012; pp. 1–14. [Google Scholar]
  23. Moroney, N. Local color correction using non-linear masking. In 8th Color and Imaging Conference Final Program and Proceedings, Proceedings of the 8th Color and Imaging Conference, Scottsdale, AZ, USA, 7–10 November 2000; Society for Imaging Science and Technology: Springfield, VA, USA, 2000; pp. 108–111. [Google Scholar]
  24. Nandhini, R.; Sivasakthi, T. Underwater image detection using laplacian and gaussian technique. In Proceedings of the 2020 7th International Conference on Smart Structures and Systems (ICSSS), Chennai, India, 23–24 July 2020; pp. 1–5. [Google Scholar]
  25. Cheng, M.-M.; Mitra, N.J.; Huang, X.; Torr, P.H.; Hu, S.-M. Global contrast based salient region detection. IEEE Trans. Pattern Anal. Mach. Intell. 2014, 37, 569–582. [Google Scholar] [CrossRef] [PubMed] [Green Version]
  26. Zhai, Y.; Shah, M. Visual attention detection in video sequences using spatiotemporal cues. In Proceedings of the 14th ACM International Conference on Multimedia, Santa Barbara, CA, USA, 23–27 October 2006; pp. 815–824. [Google Scholar]
  27. Burt, P.; Adelson, E. The Laplacian pyramid as a compact image code. IEEE Trans. Commun. 1983, 31, 532–540. [Google Scholar] [CrossRef]
  28. Panetta, K.; Gao, C.; Agaian, S. Human-Visual-System-Inspired Underwater Image Quality Measures. IEEE J. Ocean. Eng. 2016, 41, 541–551. [Google Scholar] [CrossRef]
  29. Fattal, R. Dehazing using color-lines. ACM Trans. Graph. 2014, 34, 1–14. [Google Scholar] [CrossRef]
  30. Carlevaris-Bianco, N.; Mohan, A.; Eustice, R.M. Initial results in underwater single image dehazing. In Proceedings of the Oceans 2010 Mts/IEEE Seattle, Seattle, WA, USA, 20–23 September 2010; pp. 1–8. [Google Scholar]
  31. Anwar, S.; Li, C. Diving deeper into underwater image enhancement: A survey. Signal Process. Image Commun. 2020, 89, 115978. [Google Scholar] [CrossRef]
  32. Galdran, A. Image dehazing by artificial multiple-exposure image fusion. Signal Process. 2018, 149, 135–147. [Google Scholar] [CrossRef]
  33. Gibson, K.B.; Vo, D.T.; Nguyen, T.Q. An investigation of dehazing effects on image and video coding. IEEE Trans. Image Process. 2011, 21, 662–673. [Google Scholar] [CrossRef] [PubMed]
  34. Li, C.; Guo, C.; Ren, W.; Cong, R.; Hou, J.; Kwong, S.; Tao, D. An underwater image enhancement benchmark dataset and beyond. IEEE Trans. Image Process. 2019, 29, 4376–4389. [Google Scholar] [CrossRef] [PubMed] [Green Version]
Figure 1. Details of the proposed method. Input1 and Input2 represent local contrast correction (LCC) and image sharping, respectively. These two images are used as inputs of the fusion process. Then, the normalized weight maps are obtained, and multi-scale fusion is carried out on this basis.
Jmse 09 00225 g001
Figure 2. Color restoration: (a) Initial image, (b) He [9], (c) Galdran [32], (d) Galdran [6], (e) Ancuti [11], (f) Ancuti [4], (g) our result.
Jmse 09 00225 g002
Figure 3. (a) Initial image, (b) γ = 0.7, (c) γ = 1.3, and (d) our method.
Jmse 09 00225 g003
Figure 4. Gray histogram: (a) Initial image, (b) γ = 0.7, (c) γ = 1.3, and (d) our method.
Jmse 09 00225 g004
Figure 5. Output image using (a) weighted addition and (b) multi-scale fusion.
Jmse 09 00225 g005
Figure 6. (a) Initial image, (b) Gibson et al. [33], (c) Fattal et al. [29], (d) Lu et al. [5], (e) Ancuti et al. [4], and (f) our method.
Jmse 09 00225 g006
Figure 7. Comparison to different outdoor approaches and underwater enhancement approaches. The quantitative evaluation associated with these images is provided in Table 2.
Jmse 09 00225 g007
Figure 8. UCIQE metric.
Jmse 09 00225 g008
Figure 9. UIQM metric.
Jmse 09 00225 g009
Figure 10. Robustness of the UCIQE metric.
Jmse 09 00225 g010
Figure 11. Robustness of the UIQM metric.
Jmse 09 00225 g011
Figure 12. The first row contains the original pair of images with two SIFT features matching in the first column and one in the second column. The second row contains the enhanced pair of images using the proposed method with 16 SIFT features matching in the first and second columns.
Jmse 09 00225 g012
Table 1. Underwater image color restoration evaluation based on the UICM metric; the larger the metric, the better the resolution.
UICM
(a) Initial image(b) He [9](c) Galdran [32](d) Galdran [6](e) Ancuti [11](f) Ancuti [4](g) Our result
0.01220.01210.01430.01490.01630.01510.0156
Table 2. Underwater image enhancement evaluation based on the UCIQE and UIQM metrics. The larger the metric, the better the image.
He [9]Galdran [32]Galdran [6]Ancuti [11]Ancuti [4]Our Result
UCIQEUIQMUCIQEUIQMUCIQEUIQMUCIQEUIQMUCIQEUIQMUCIQEUIQM
Ship0.5652.1710.6112.4990.6464.3090.6344.6160.6324.7380.7634.714
Fish0.6020.4530.5921.6900.5273.3010.6693.8020.6673.9160.9774.119
Reef10.6121.2400.6202.7320.5723.1550.6553.8450.6583.6850.8525.145
Reef20.7021.5080.6162.3960.6333.8680.7183.6300.7113.4960.8954.099
Reef30.6063.1690.5973.9460.5334.8110.7054.7980.6974.9480.8755.095
Galdran10.5932.7850.6133.4990.5295.1200.6434.3560.6594.4010.7344.599
Galdran20.4260.4120.5620.3440.5963.5580.6673.6790.6333.7880.8763.828
Ancuti10.4851.9270.5311.8530.6414.0820.5883.9710.5944.2150.7063.853
Ancuti20.4561.0810.5231.6720.5293.8710.5904.0030.5924.2230.8155.289
Ancuti30.5772.9540.6022.7040.6143.5340.6524.3470.6644.7270.7924.470
Average0.5621.7700.5872.3330.5823.9610.6524.1050.6514.2130.8294.521
Publisher’s Note: MDPI stays neutral with regard to jurisdictional claims in published maps and institutional affiliations.

