Article

Cost-Effective Design of Port Approaches Using Simulation Methods Based on the Example of a Modernized Port in the Ustka

1
Faculty of Navigation, Maritime University of Szczecin, 70-500 Szczecin, Poland
2
Faculty of Hydraulic Engineering, National University of Civil Engineering (NUCE), Giai Phong 55, Hanoi 100000, Vietnam
*
Author to whom correspondence should be addressed.
J. Mar. Sci. Eng. 2021, 9(2), 211; https://doi.org/10.3390/jmse9020211
Submission received: 18 January 2021 / Revised: 8 February 2021 / Accepted: 12 February 2021 / Published: 18 February 2021
(This article belongs to the Special Issue Advances in Navigability and Mooring)

Abstract

:
Port design and approaches are usually carried out using real-time computer simulation methods for ship manoeuvring. So-called ship real-time simulation methods are relatively expensive, especially in terms of survey time. Several real-time simulation scenarios carried out by masters and pilots are usually performed, with several simulation attempts in each scenario. Each such attempt can last up to one hour, which, with a large number of scenarios, prolongs the research and increases its cost. Particularly time-consuming is the repetition of many scenarios with alternative solutions for infrastructure development and in various hydrometeorological conditions. To reduce the time-consuming of the tests, a new two-stage method was used to design the target approach on the modernized Port of Ustka. In the first stage, the simulations were carried out with significantly reduced floating navigation marking, and in the second stage with the target marking. Moreover, the so-called “Soft-Bank” method was introduced, i.e., the effects of a collision with the seabed and infrastructure were excluded. Such a solution leads to significant time benefits in conducting research and at the same time does not reduce confidence in the results obtained.

1. Introduction

The major aim of a case study [1] which is the illustration to presented Soft-Bank method was to design the new approach and breakwater solution for a general cargo ship of the following parameters: L = 133 m, B = 20 m, T = 7.9 m utilizing real-time ship manoeuvring simulation methods for the modernized Ustka Port located in the middle of the Polish coast. Additionally, the conditions of safe operation of port for the maximal vessel will be established. The main aim of the Ustka Port case study that was concerned with:
  • Determination of:
    • average ship dimensions and its characteristics like the power of the main engine, rudder type and its area or power of bow thruster,
    • safety waterway parameters needed for the safe operation of maximal ships,
    • turning place diameter concerning its shape.
  • Determination of safety conditions of port operation for:
    • admissible meteorological conditions for a given kind of ships and manoeuvres,
    • other navigational conditions and limitations like the presence of other ships on berths, use of position fixing systems on the approach, navigational markings, and vessel traffic service.
  • Determination of manoeuvring procedures during the entrance, berthing, un-berthing, exit port, and turning for different kinds of ships and propulsion systems.
  • Determining the conditions of ship mooring inside the port.
The above objectives are the objectives of the Ustka Port design case study that was the example of Soft-Bank method. The main objective of the paper is to present that method as the part of optimal port design strategy.
The major problem with designing the simulation experiment is the number of simulation trials (one trial is defined as one simulation run in given conditions), which have to be done within experiments. Each simulation trial is realized in real-time and it sometimes lasts more than half an hour in the presented case study.
The simulation trials are performed in groups (series) in the same controllable environmental condition but with different captains/navigators performing the simulation to achieve statistical variability of human (navigator) influence. The whole study must cover selected wind and current conditions. In single simulation series usually, 15 simulation trials are performed, which causes the design process is highly time-consuming. For example, in the Ustka case study, the 6 series are foreseen every 15 trials which make 90 simulation runs, each lasting more than 30 min in total which makes in total more than 60 simulation hours. When the infrastructure does not exist (like in the presented study) sometimes it needs to perform simulation in different infrastructure layouts, which again multiply the simulation time by the number of infrastructure solutions (proposed layouts).
In such cases, the simulation method is one of the most suitable to solve this research task. Several unsolved problems when ships outgrow the capacity of port infrastructure have been identified by Perkovic et al. [2]. The guidelines [3,4,5,6] also address the design issue. In parallel, the national and regional policy was identified [7]. Ports are also the subject of strategic risk assessments [8,9,10,11]. From the other side dedicated systems are used for met-ocean conditions monitoring near the ports and specialized quays [12]. The general rules of designing the ports and waterways for ships are presented in [13,14,15]. Methods applied in this study could be used also for other aspects of navigational safety like designing port regulations [16].
The methodology design of real-time simulations for waterway and port design purposes are presented in the latest PIANC guidelines [3,4]. The comprehensive study in this field, especially for the distribution of ship positions on the waterway, is presented by Irribaren [17]. Some general guidelines are presented in [18,19]. There are not many new types of research dealing with this topic mostly due to the process is highly related to the given case study. The design process also depends on the experience and knowledge of the simulation team. This is remarkable to the maritime simulation sector wherein compared to other branches of transportation like aviation or road engineering, there is still some freedom and art inside the process itself. The expert knowledge supported by pilots here is usually the key factor for conducting the simulations based on their previous design.
Benedict et al. [20] developed the computer-based support for the evaluation and assessment of ship handling simulator exercise results but dedicated mostly for training purposes of ship handling simulators.
Very useful in the navigator decision-making process are ship predictors, which are also quite common onboard usually achieved within ECDIS environment [21].
Zhang [22] presented a very comprehensive study on the assessment of the competence of seafarers trained on ship handling simulators in the scope of Bridge Team Management and implementing the International Convention on Standards of Training Certification and Watchkeeping for Seafarers (the STCW Convention).
Sarioz and Narli [23] presented the results of a real-time ship manoeuvring simulation study and its assessment intended to investigate the manoeuvring performance of large tankers in the Bosporus.
Inoue [24] developed a quantitative model for evaluating the difficulty of ship handling caused by a restricted manoeuvring area or by traffic congestion or by a combination of both. It includes acceptance criteria based on the mariner’s perception of safety.
Lataire et al. [25] presented the systematic investigation of ship manoeuvring in restricted waters is performed by Flanders Hydraulics Research (FHR) and Ghent University (UGent) through five different simulations techniques including real-time human-controlled and fast time. Another Classification of ship maritime simulators is presented by Cross and Olafsson [26].
Donatini et al. [27] described the results of a survey performed by the authors to assess how hydrometeorological conditions are presently modelled in ship manoeuvring simulators. They found that while mathematical models for the manoeuvring behaviour of ships are well documented in the literature, an overview concerning hydrometeorological modelling does not exist yet. The results are based on a wide questionnaire of simulator end users.
Several types of research were made in the field of effects on the ship models implemented within ship handling simulators like wind [28], waves [29], ice, and current [30]. Delefortrie and Vantorre [31] presented the overview of research and practical applications of ship’s behaviour and modelling in muddy areas.
Fast-time simulations (FTS) are the widely accepted preliminary study method in design of ports and its approaches [3,4,5]. The recent state of the art in this area is presented by the Benedict at all [32]. The drawbacks of FTS are the autopilot capabilities which is still far from human control and problems with automatic tug control which are the usual tool to enhance manoeuvres in ports which also was the case in the presented example.

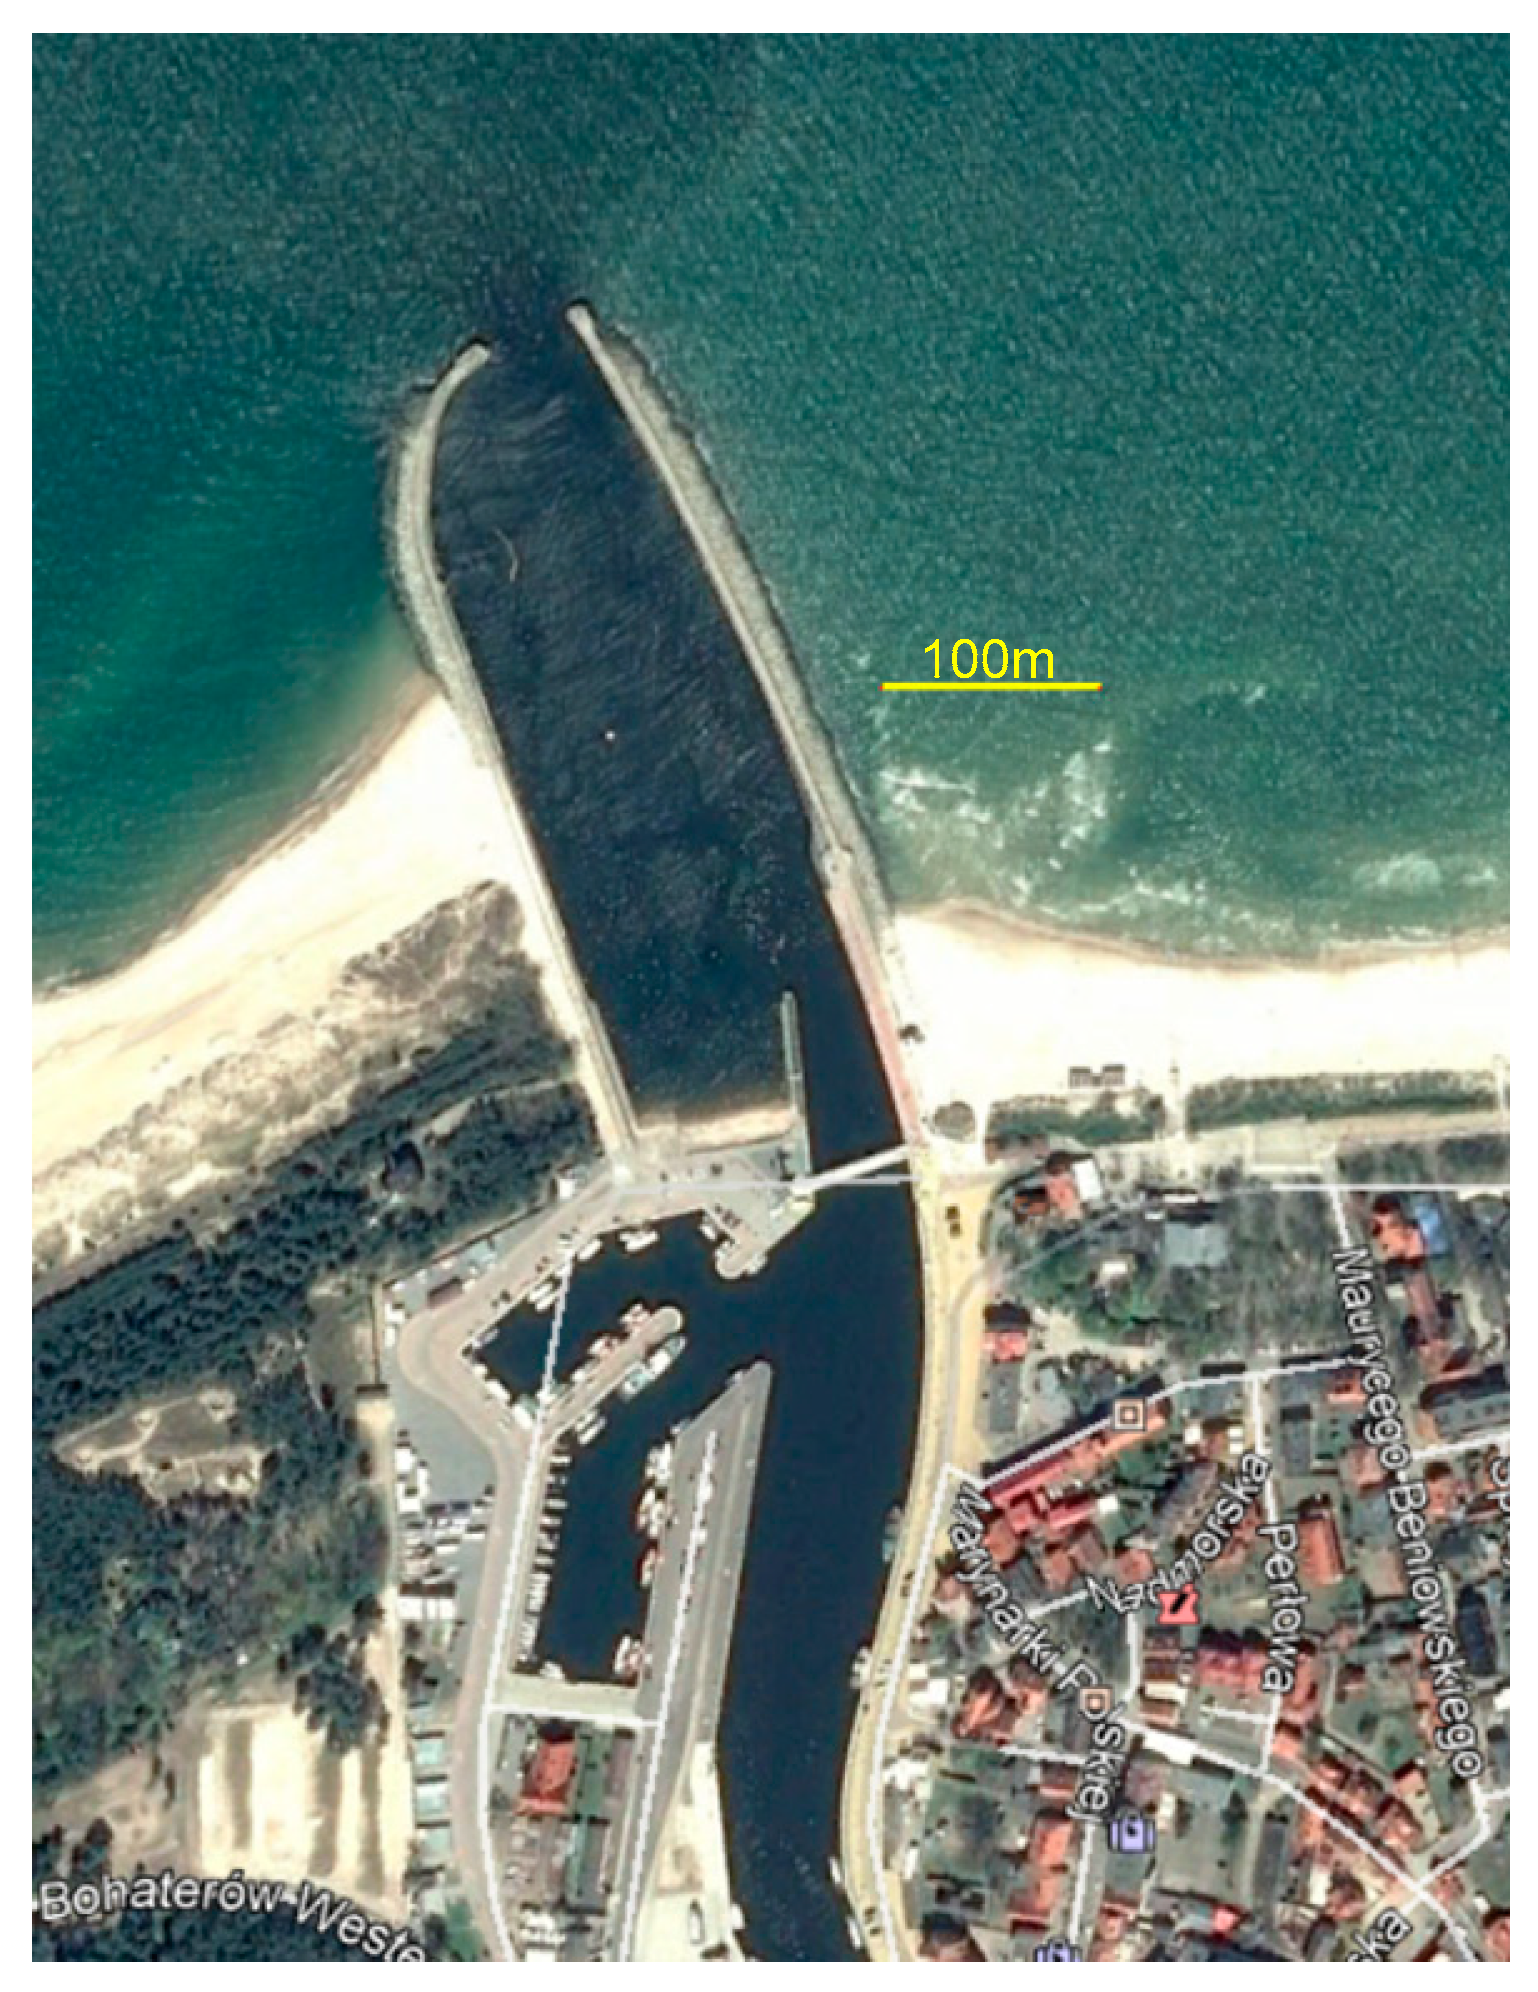
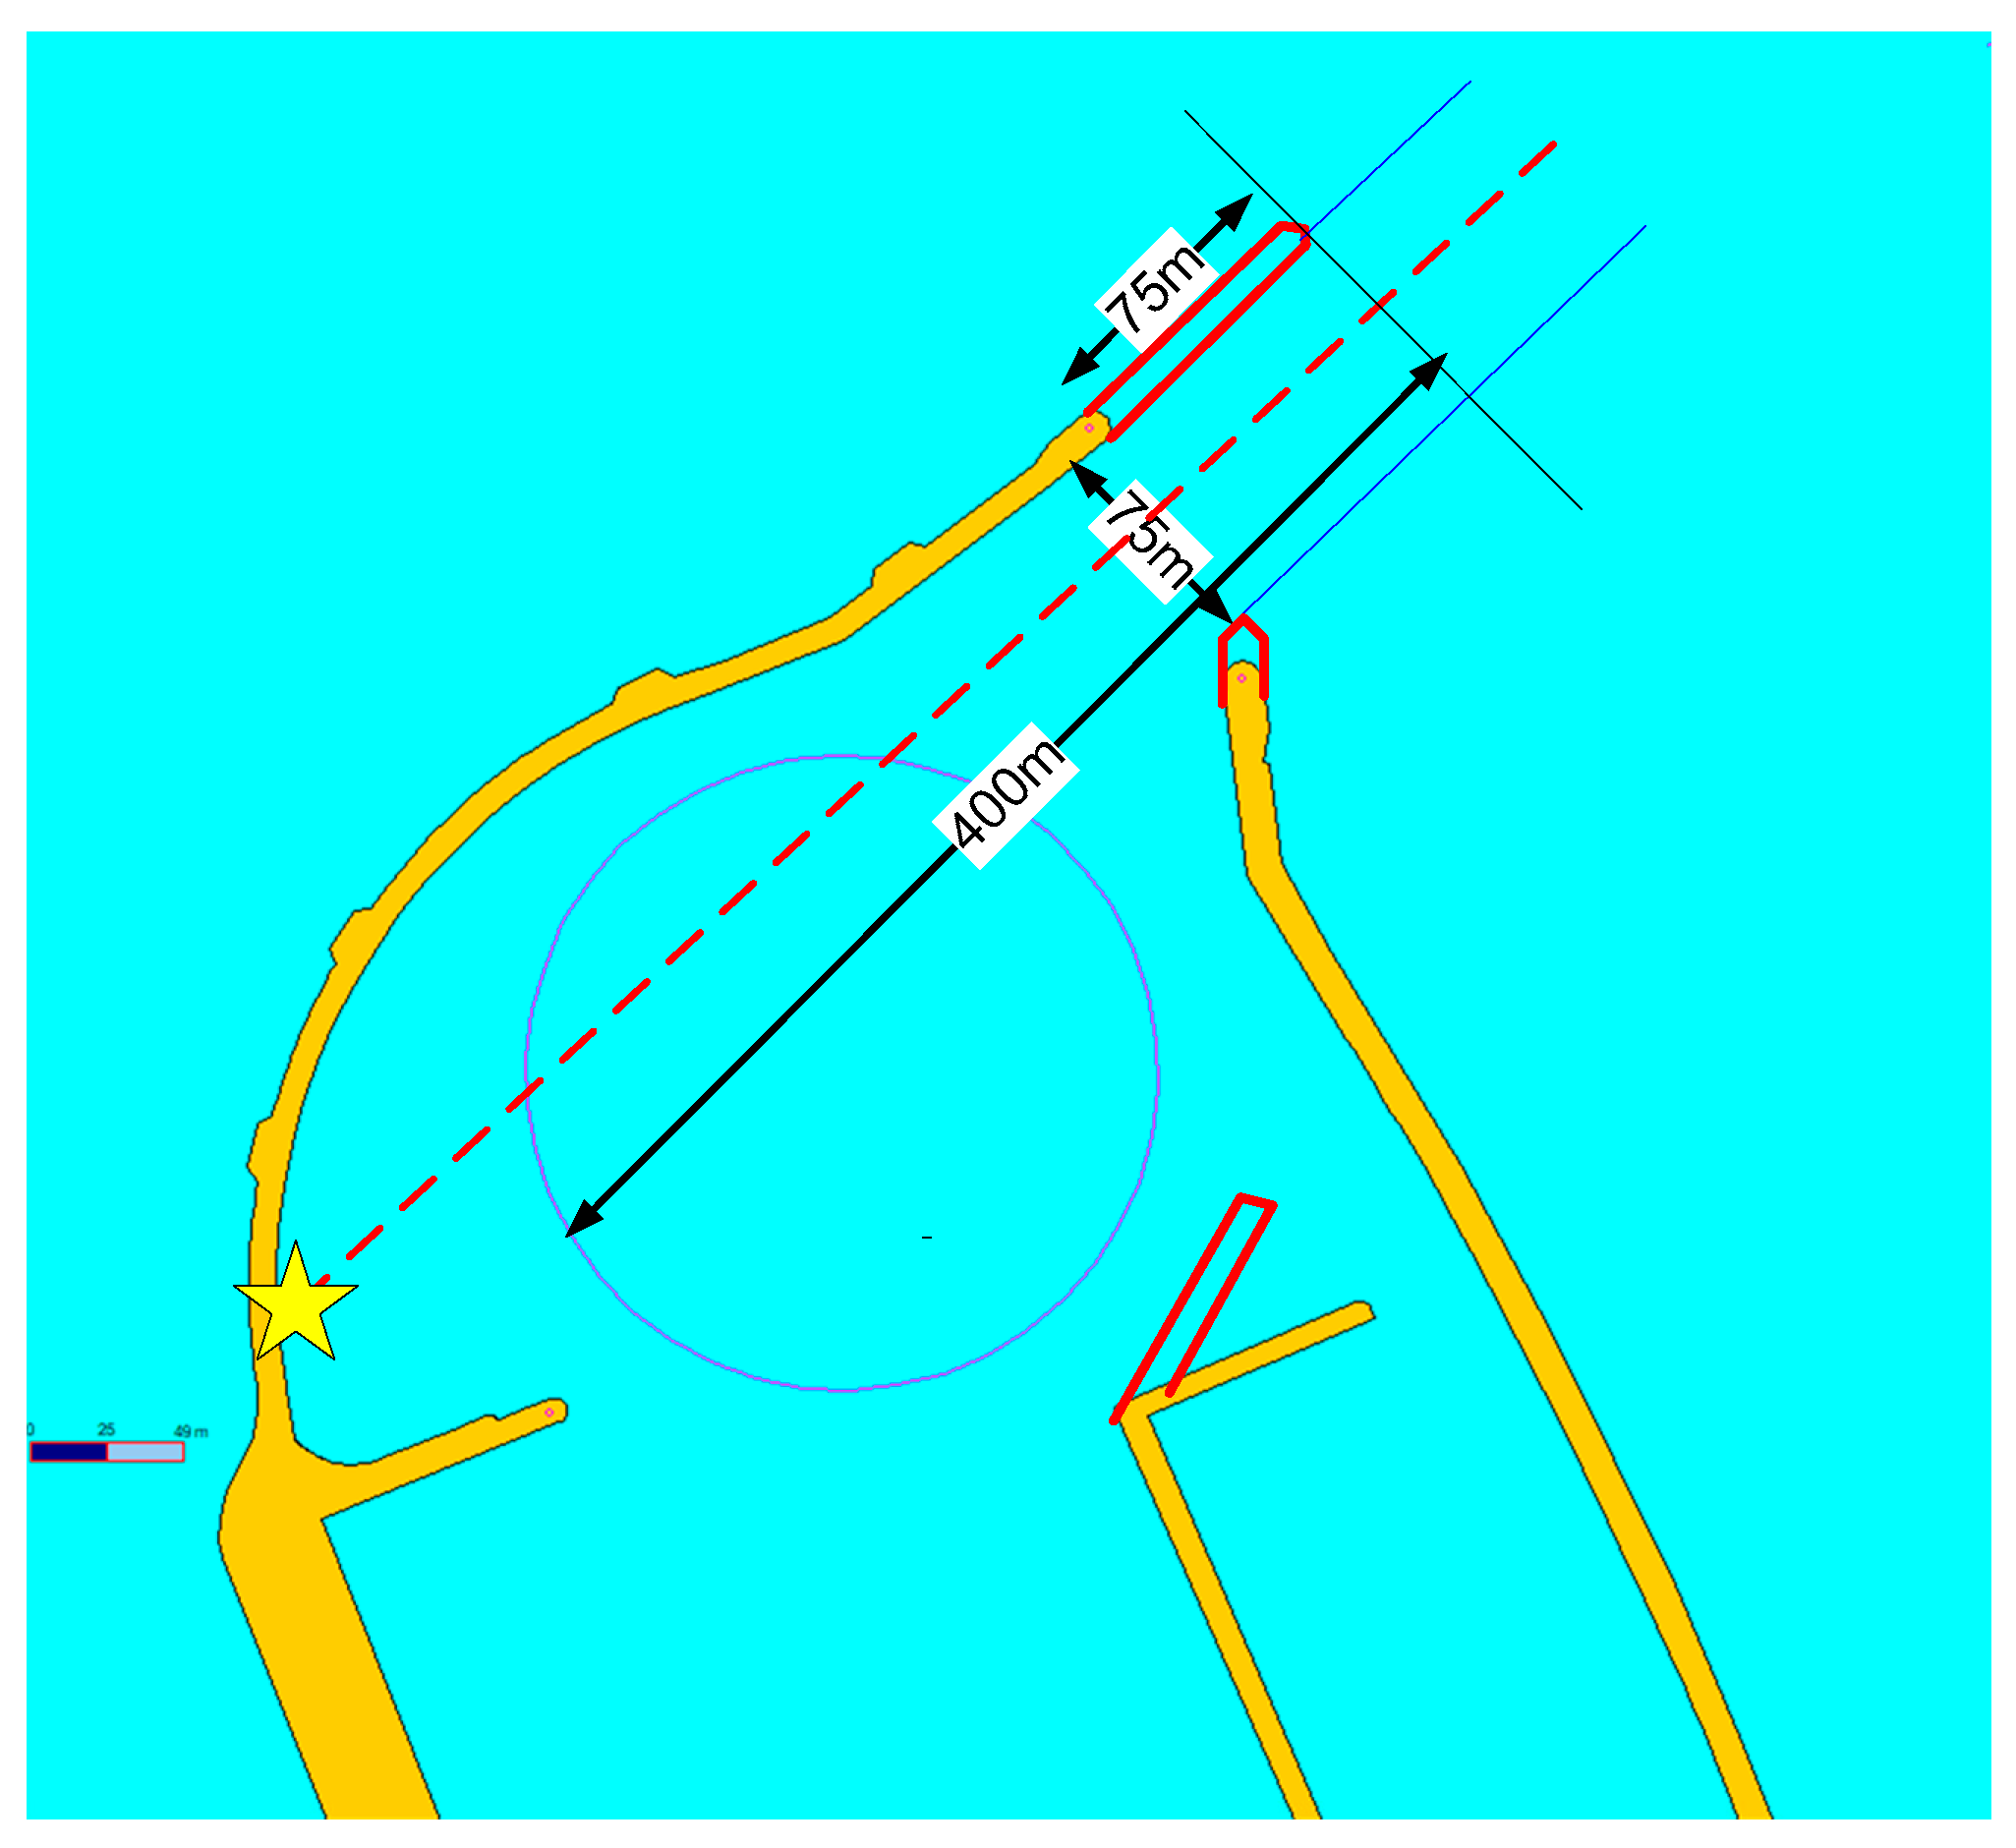
2. The Ustka Port Case Study

Ustka (Figure 1) is a medium Polish port located on the Baltic Sea serving around 100 merchant ships per year with fishing and pleasure craft traffic. The maximal length of ships before the presented research was L = 60 m, B = 12 m, and T = 4.0 m with several operational and weather restrictions.
The preliminary design of the breakwater layout is presented in Figure 2 (presented in yellow). After the extensive wave development inside port analysis, it was found that the wave was too high inside the port with NE winds and it was decided to investigate also the longer version of the breakwater (Figure 2 presented in red) together with the decreasing the entrance width and some works inside the port to reduce wave development inside the port.

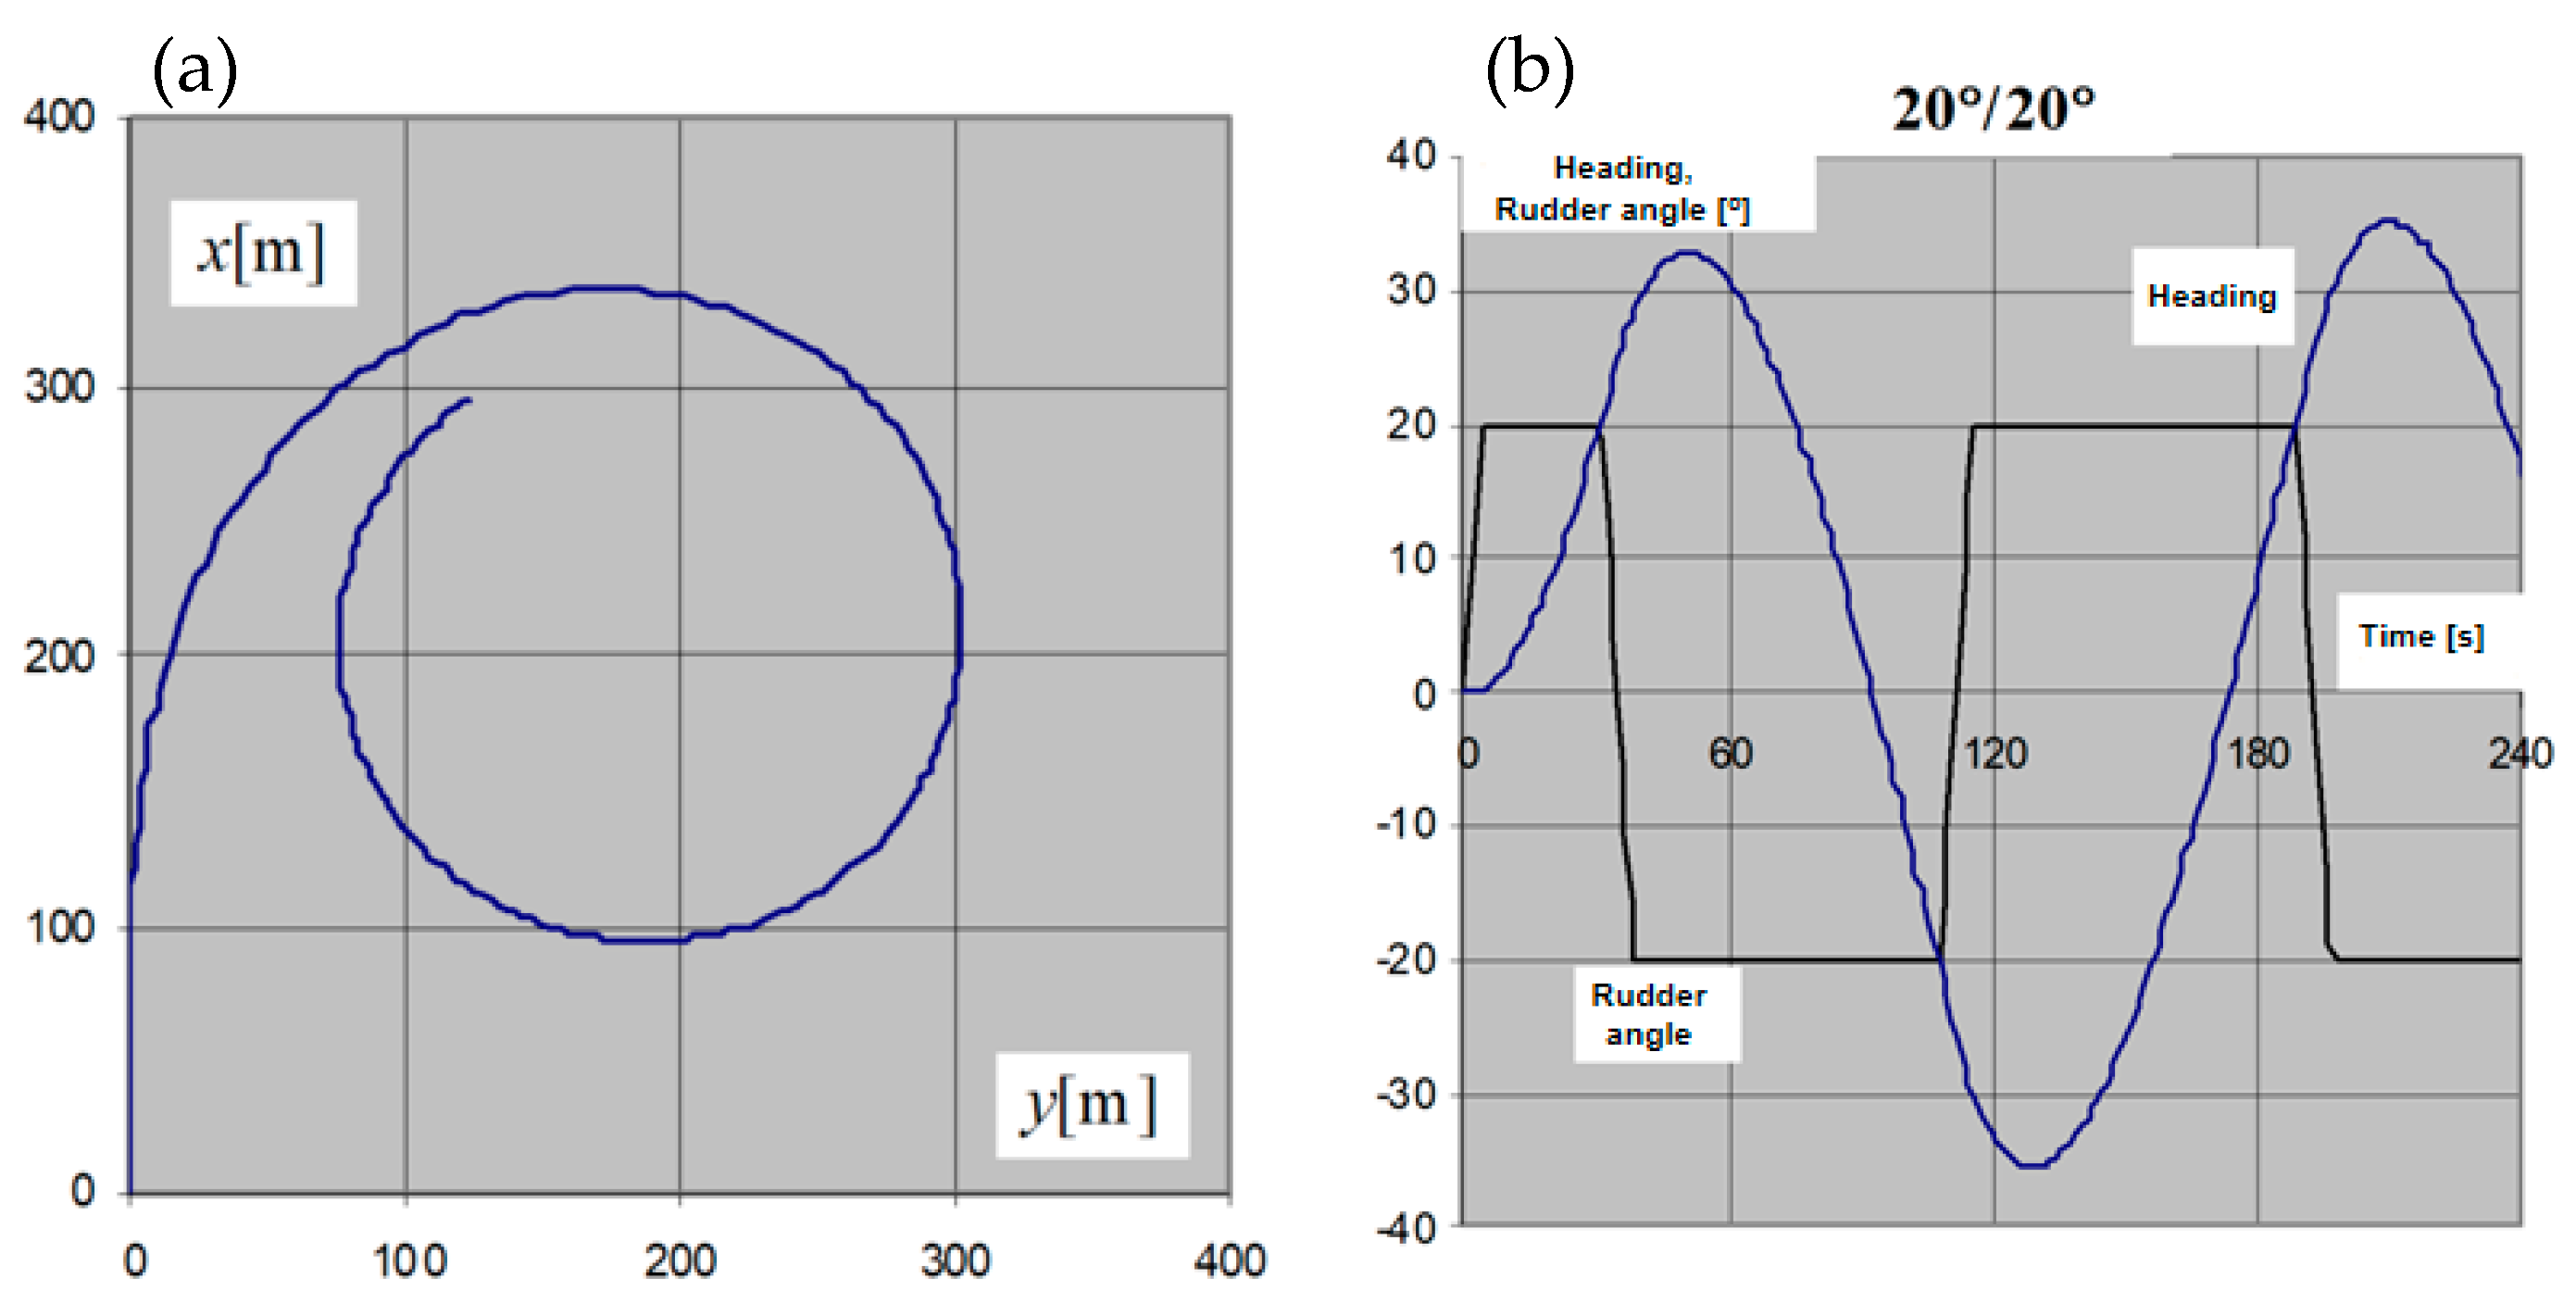
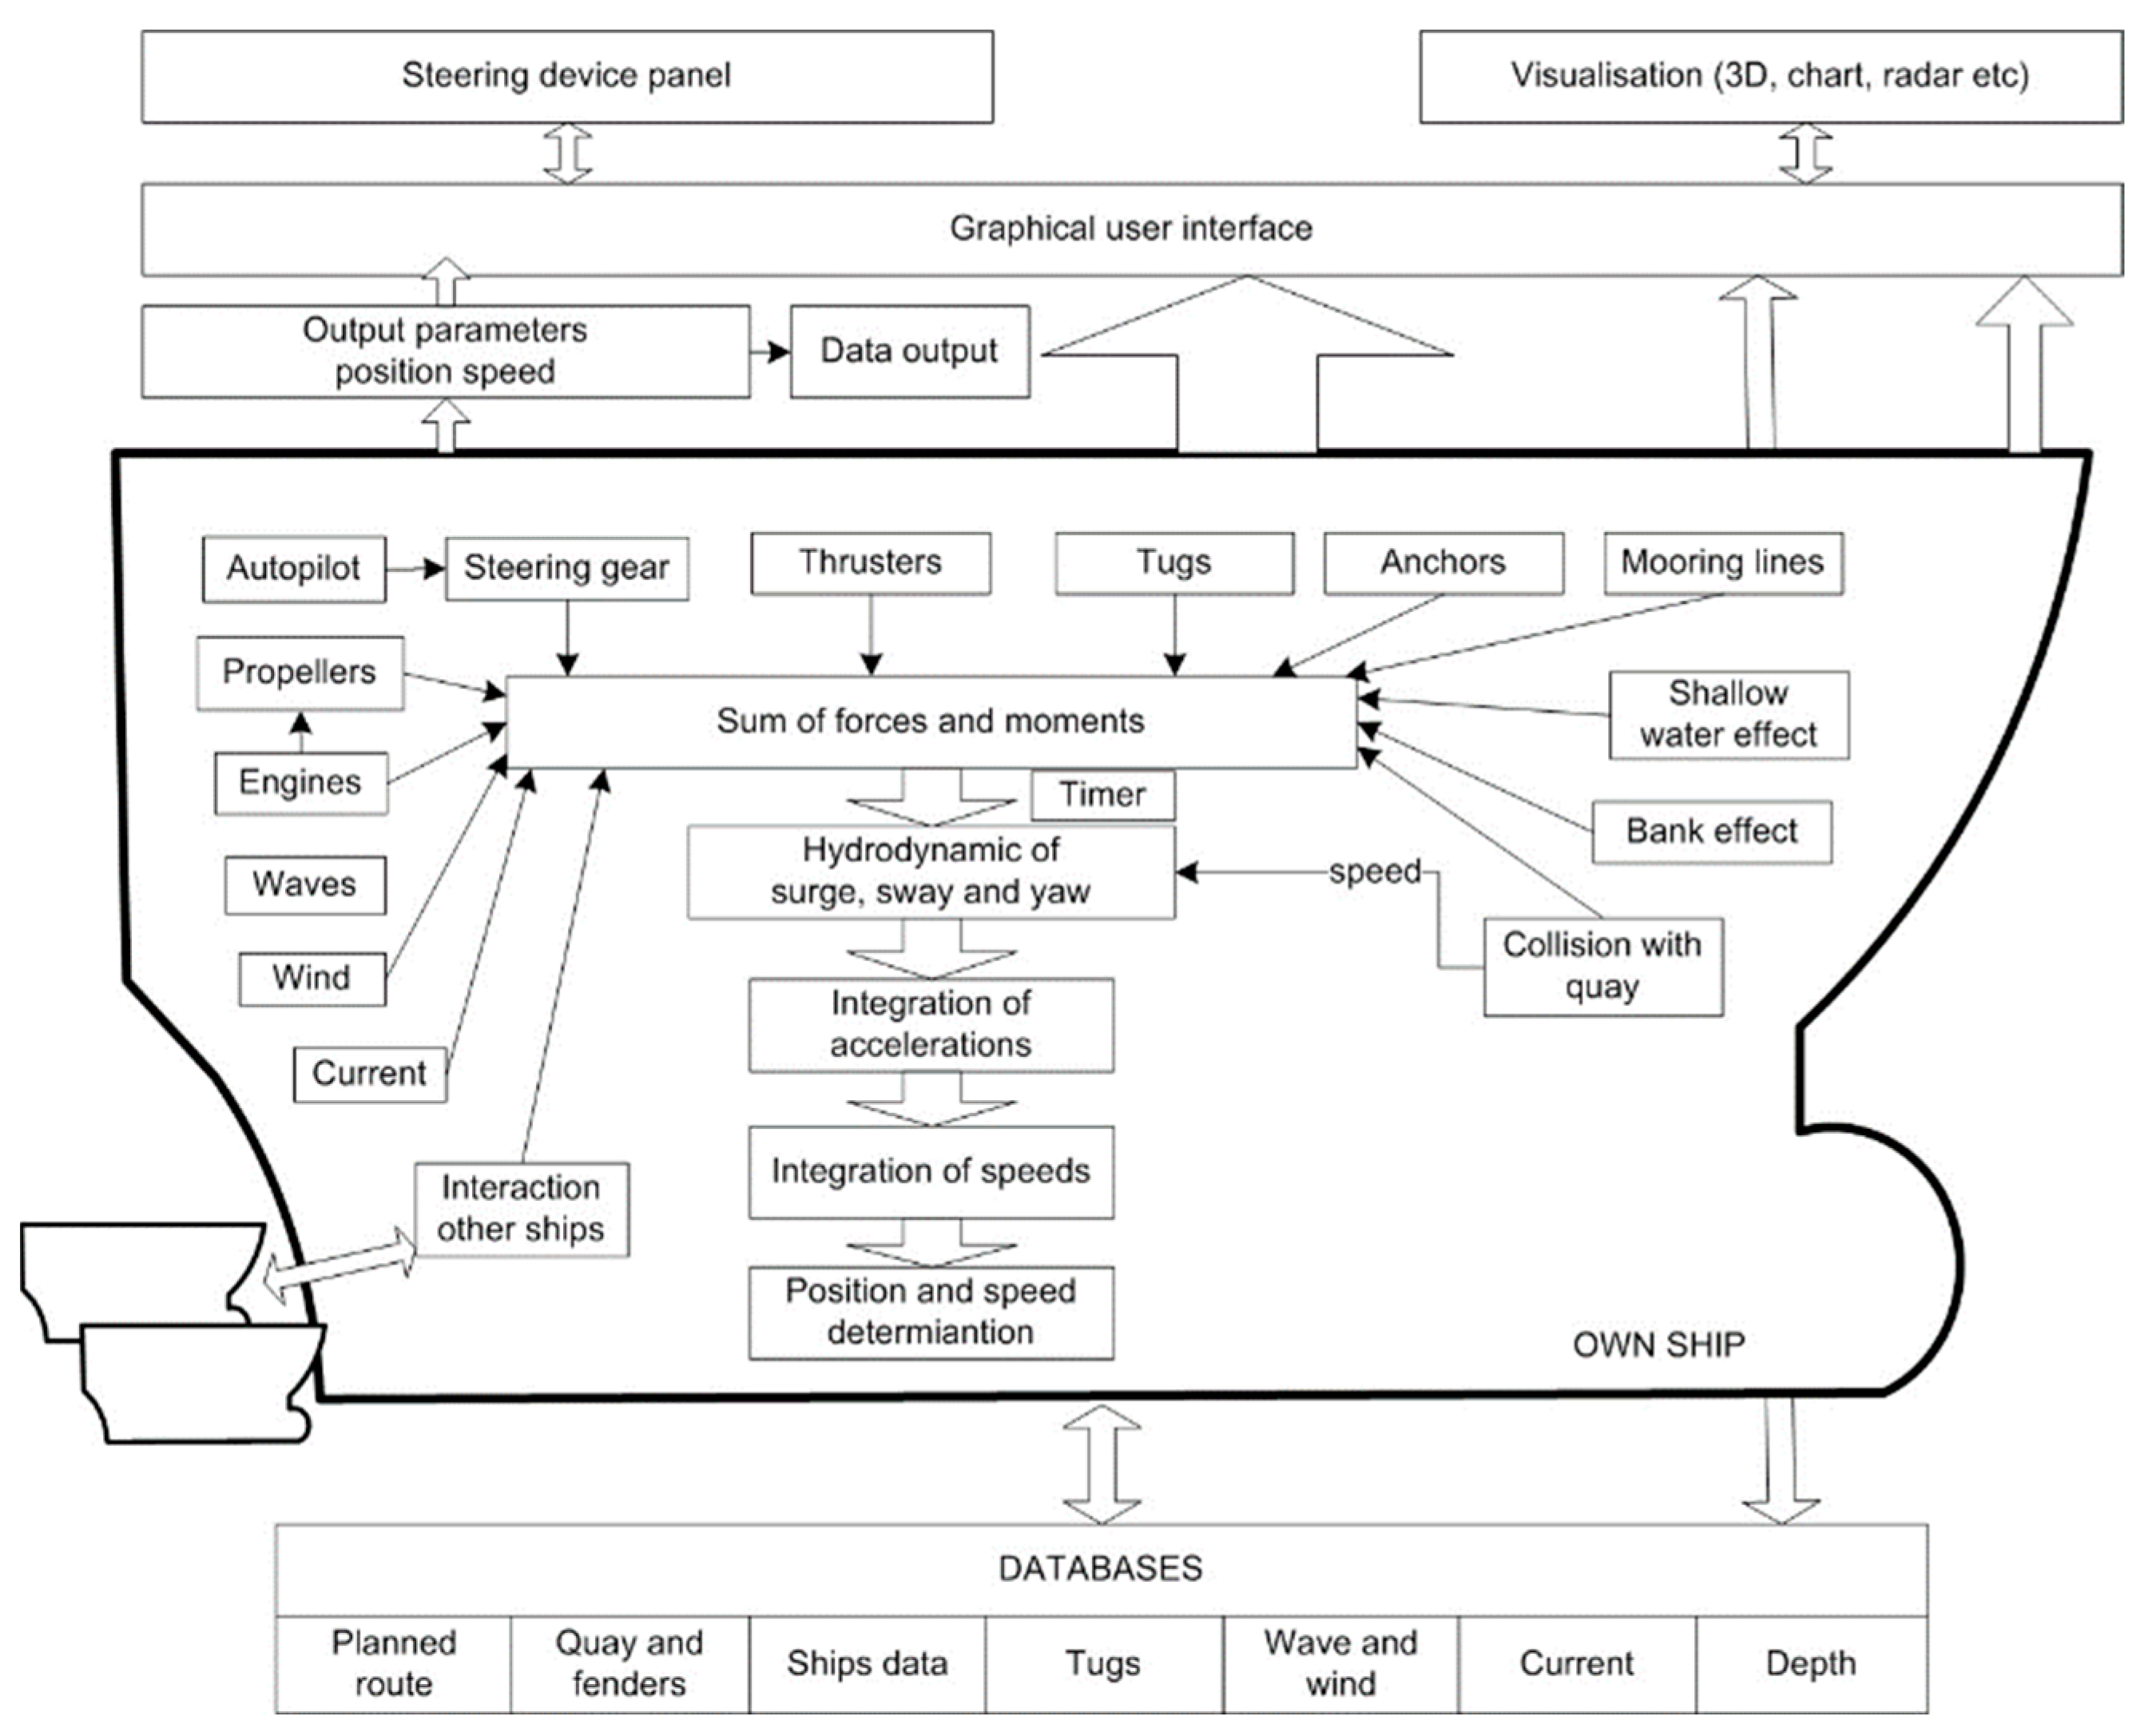
2.1. Selected Elements of Ship Mathematical Model Creation

The values of hydrodynamic coefficients of particular forces and moments have been predetermined according to published literature data from hull model tests (surface and underwater part), propeller, and stern rudder, streamer rudder of similar dimensions and shapes as the “characteristic” ship. In the case of gross mismatch, appropriate extrapolation of test results to the technical and operational conditions of the model ship has been applied. This was all the more important because not all coefficients can then be optimized (tuned, identified) according to the measurements carried out during the nautical manoeuvre tests of the tested craft or similar. The models are usually identified based on sea trials of a modelled ship or similar ships according to the procedure presented by Artyszuk [33]. The model used for Ustka Port development was validated based on four following groups of tests:
  • Speed tests
  • Braking and acceleration tests
  • Circulation tests (Figure 3)
  • Zig-Zag tests (Figure 3).
Therefore, the model represents the average ship with the average parameters for typical Baltic Sea general cargo vessel of L = 133 m, B = 20 m and T = 7.9 m. The model was created on the base of several available sea trials of similar ships which results was averaged and used for fitting the hydrodynamic coefficients. The selected model sea trials i.e., turning circle and 20°-20° Zig-Zag manoeuvre are presented in Figure 3.

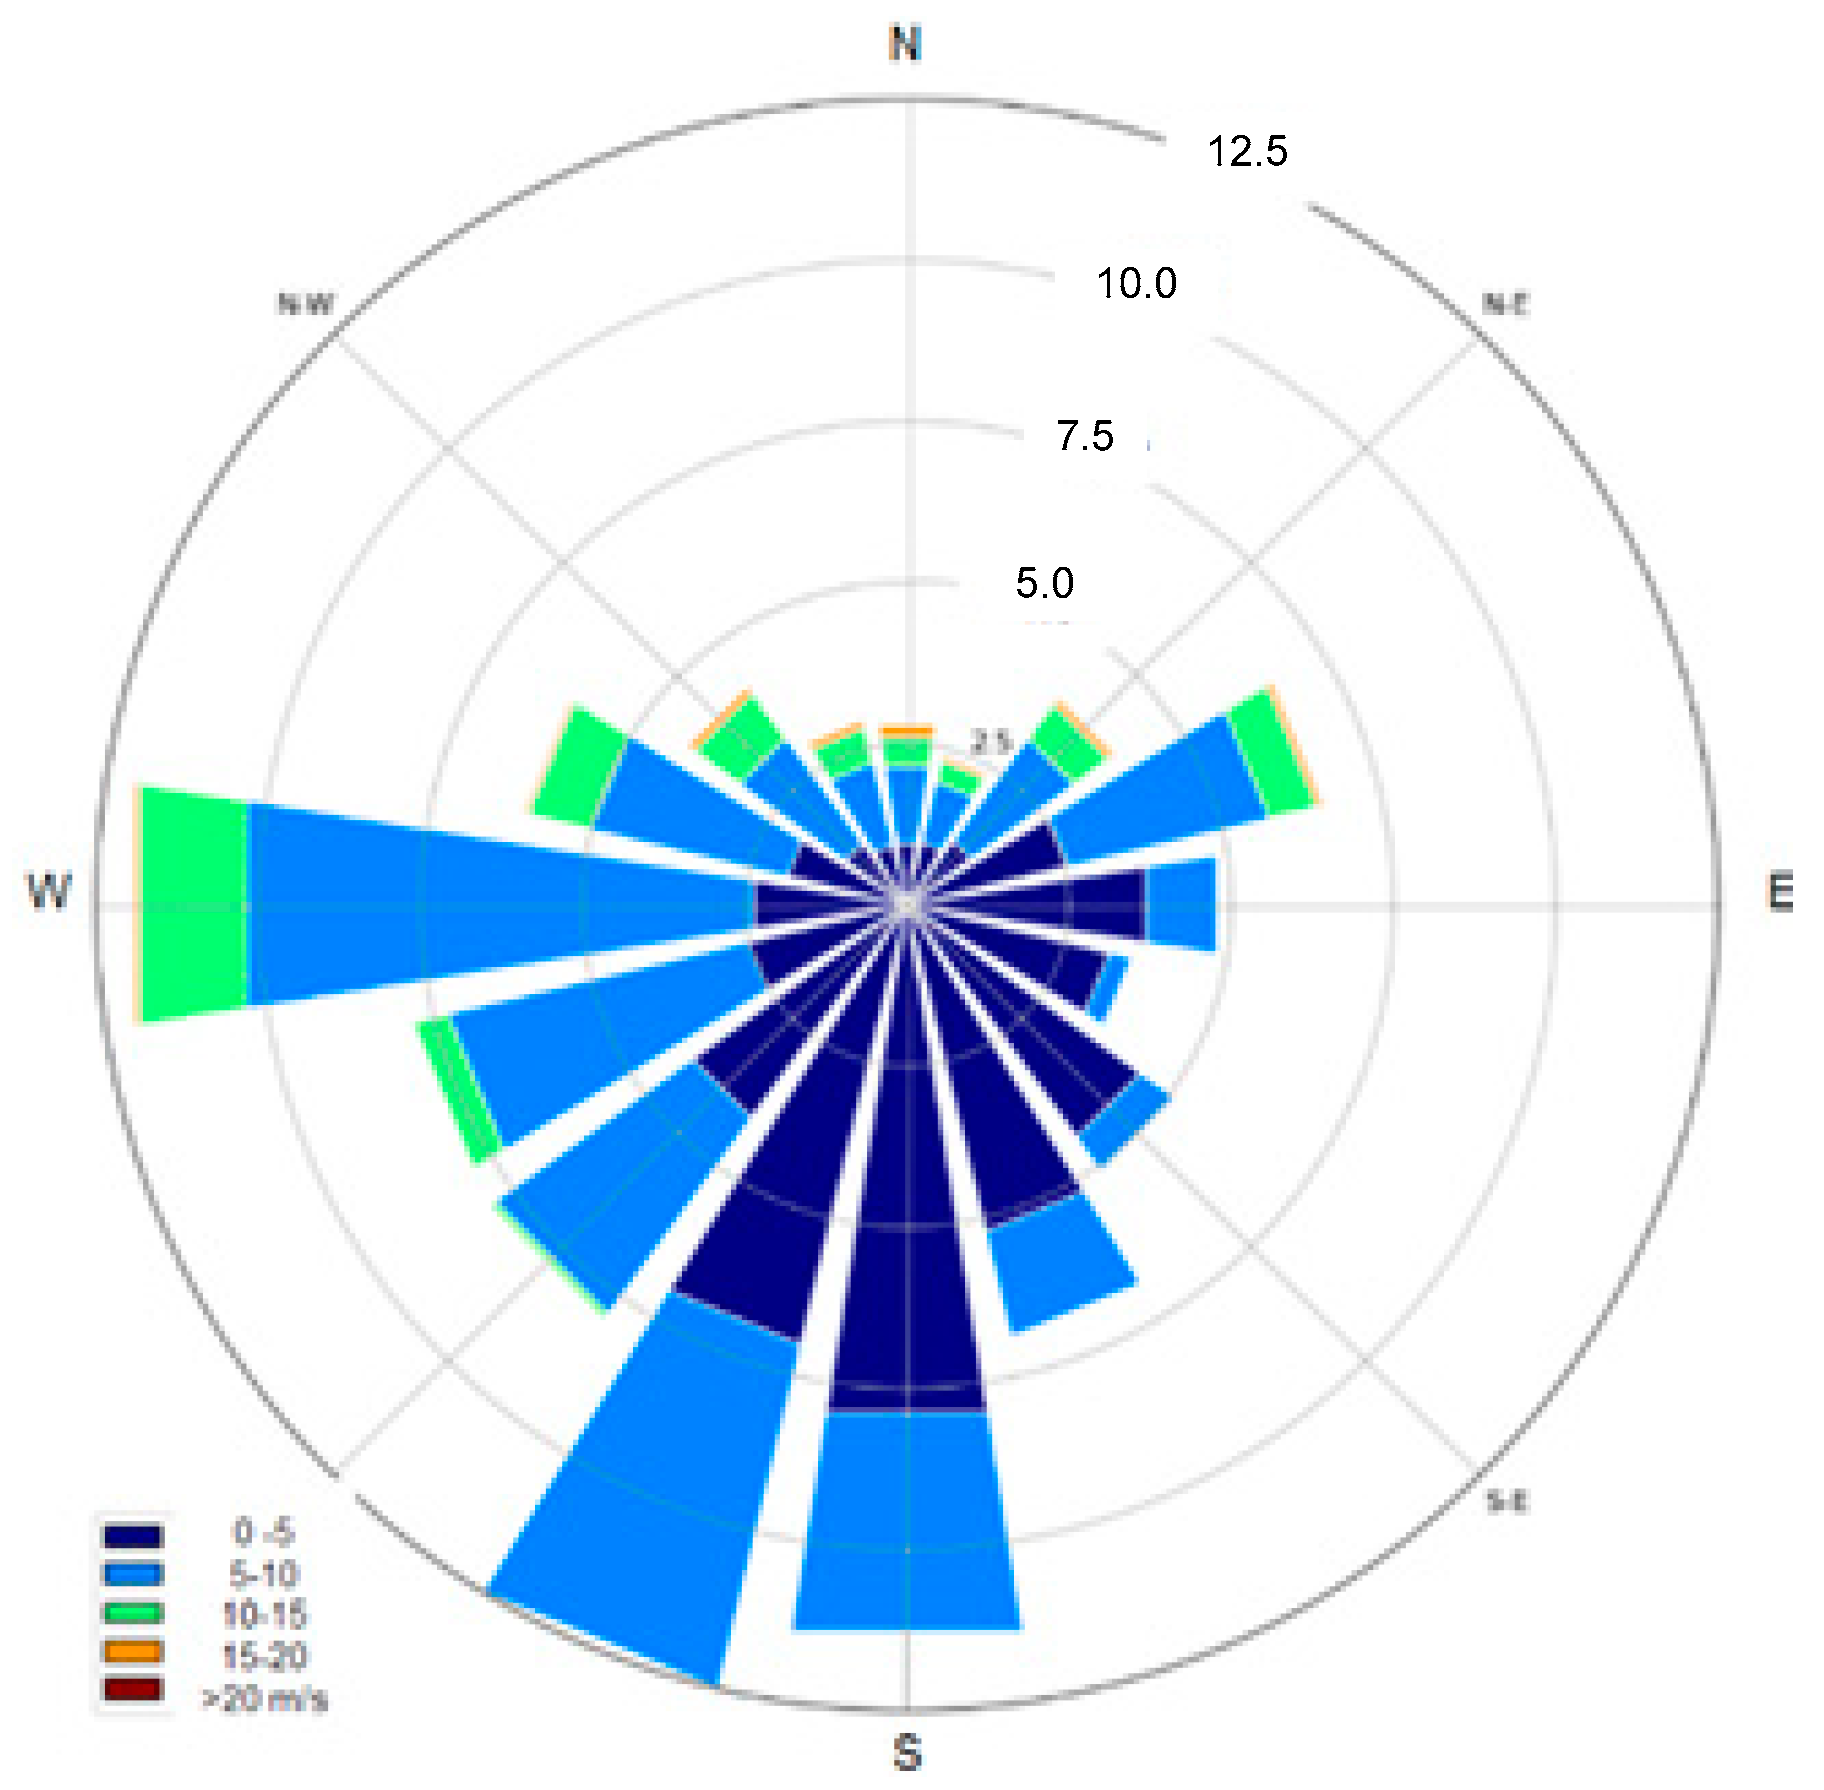
2.2. Selected Elements of Environment Modelling and Conditions Selection during Tests

The objective of the research: Research on the possibility of entrance and exit of a general cargo ship of L = 133 m, B = 20 m, T = 7.9 m in the modernized port of Ustka. Modernization of external breakwaters and construction of an internal port.
Breakwater system: The corrected arrangement of breakwaters according to Figure 2.
Ship parameters:
Type: General cargo, coaster. Lc = 133 m; B = 20.0 m; T = 7.9 m.
Propulsion: Right-hand conventional propeller, bow thruster typical power for this vessel.
Indicative speeds: FA (Full Speed Ahead) = 12 kn, HA (Half Ahead) = 9 kn, SA (Slow Ahead) = 6 kn, DSA (Dead Slow Ahead) = 4 kn.
Towing operation: One tug with a 20 tf of pull power.
Hydrometeorological conditions: Manoeuvres were performed for conditions without wind and wave (as a reference and for a preliminary acquaintance of the ship and the area by captains) and with wind 11 m/s (lower value of 6°B), and 17 m/s (upper value of 7°B) blowing from the north-western direction, which is the most unfavourable direction for the entrance. For the exit and ships turning, the winds up to 11 m/s from the north-western and north-eastern directions were assumed to be the most influential for the ship during turning.
Wind cover by infrastructure was assumed (Figure 4). The steady wind (no gusts) was used for the analysis.
The height of the wind-wave (the direction following the wind direction) was assumed equal: 0.9 m (wind 11 m/s) and 1.6 m (wind 17 m/s). The wave distribution is shown in Figure 4.
Good visibility and daytime visibility were assumed, which results from the type of simulator visualization.
One-way traffic of ships has been assumed.
The weather conditions, especially the wind and water level changes were analysed before planning the simulations. The influence of climate change is also considered as a mean water level change and changes in the severity of strong winds. There are hydro- and meteorological stations in the Ustka Port. The data were collected with the use of this station and then after statistical analysis applied to the project and final solution. The possibility of storm surges was included as a deterministic factor in the under-keel clearance analysis as an additional reserve for storm surges and water level changes appropriate for this region.
The selected wind conditions represent the one from most extreme to easiest in the scope of ship manoeuvring. It is done before simulations by very careful planning the experiment conditions. In this case, it was decided to consider the following conditions: the close to extreme operation conditions, maximum average conditions, and zero wind conditions. The selected wind directions are also considering infrastructure-related factors like breakwater layout. The 20 years wind rose for Ustka is presented in Figure 5.
The prediction of weather is important for the operational stage of the process of ship entrance to the ports. Usually, ports use government regulated prediction platforms for their operation. As an appropriate tool for predictions, the Ensemble Prediction Systems (EPS) could be used. EPS are numerical weather prediction (NWP) systems that allow estimating also the uncertainty in a weather forecast as well as the most likely outcome [34]. This technique is based on running the NWP model several times with slightly different initial conditions [35]. Such a tool could be used also for hydrological problems like storm surges [36,37].

2.3. The Detailed Sea Trials Performed and Their Conditions

Five simulation series have been planned, each representing typical manoeuvres under different conditions, which have been selected to cause the greatest difficulty. The plan of research is presented in Table 1. The individual simulation series represent manoeuvring situations selected from the point of view of difficulty related to the operation of vessels in this area, i.e., successively:
  • series 1, 2, and 3—entry to the port of general cargo vessel L = 133 m without rotation and mooring. The purpose is to determine the parameters of the approach waterway and the safety of entrance and mooring energy.
  • series 4, 5 and 6—entry from the general cargo carrier port L = 133 m with rotation. The purpose is to define the parameters of the turning place, and waterways parameters during ship’s departure.

3. Methods

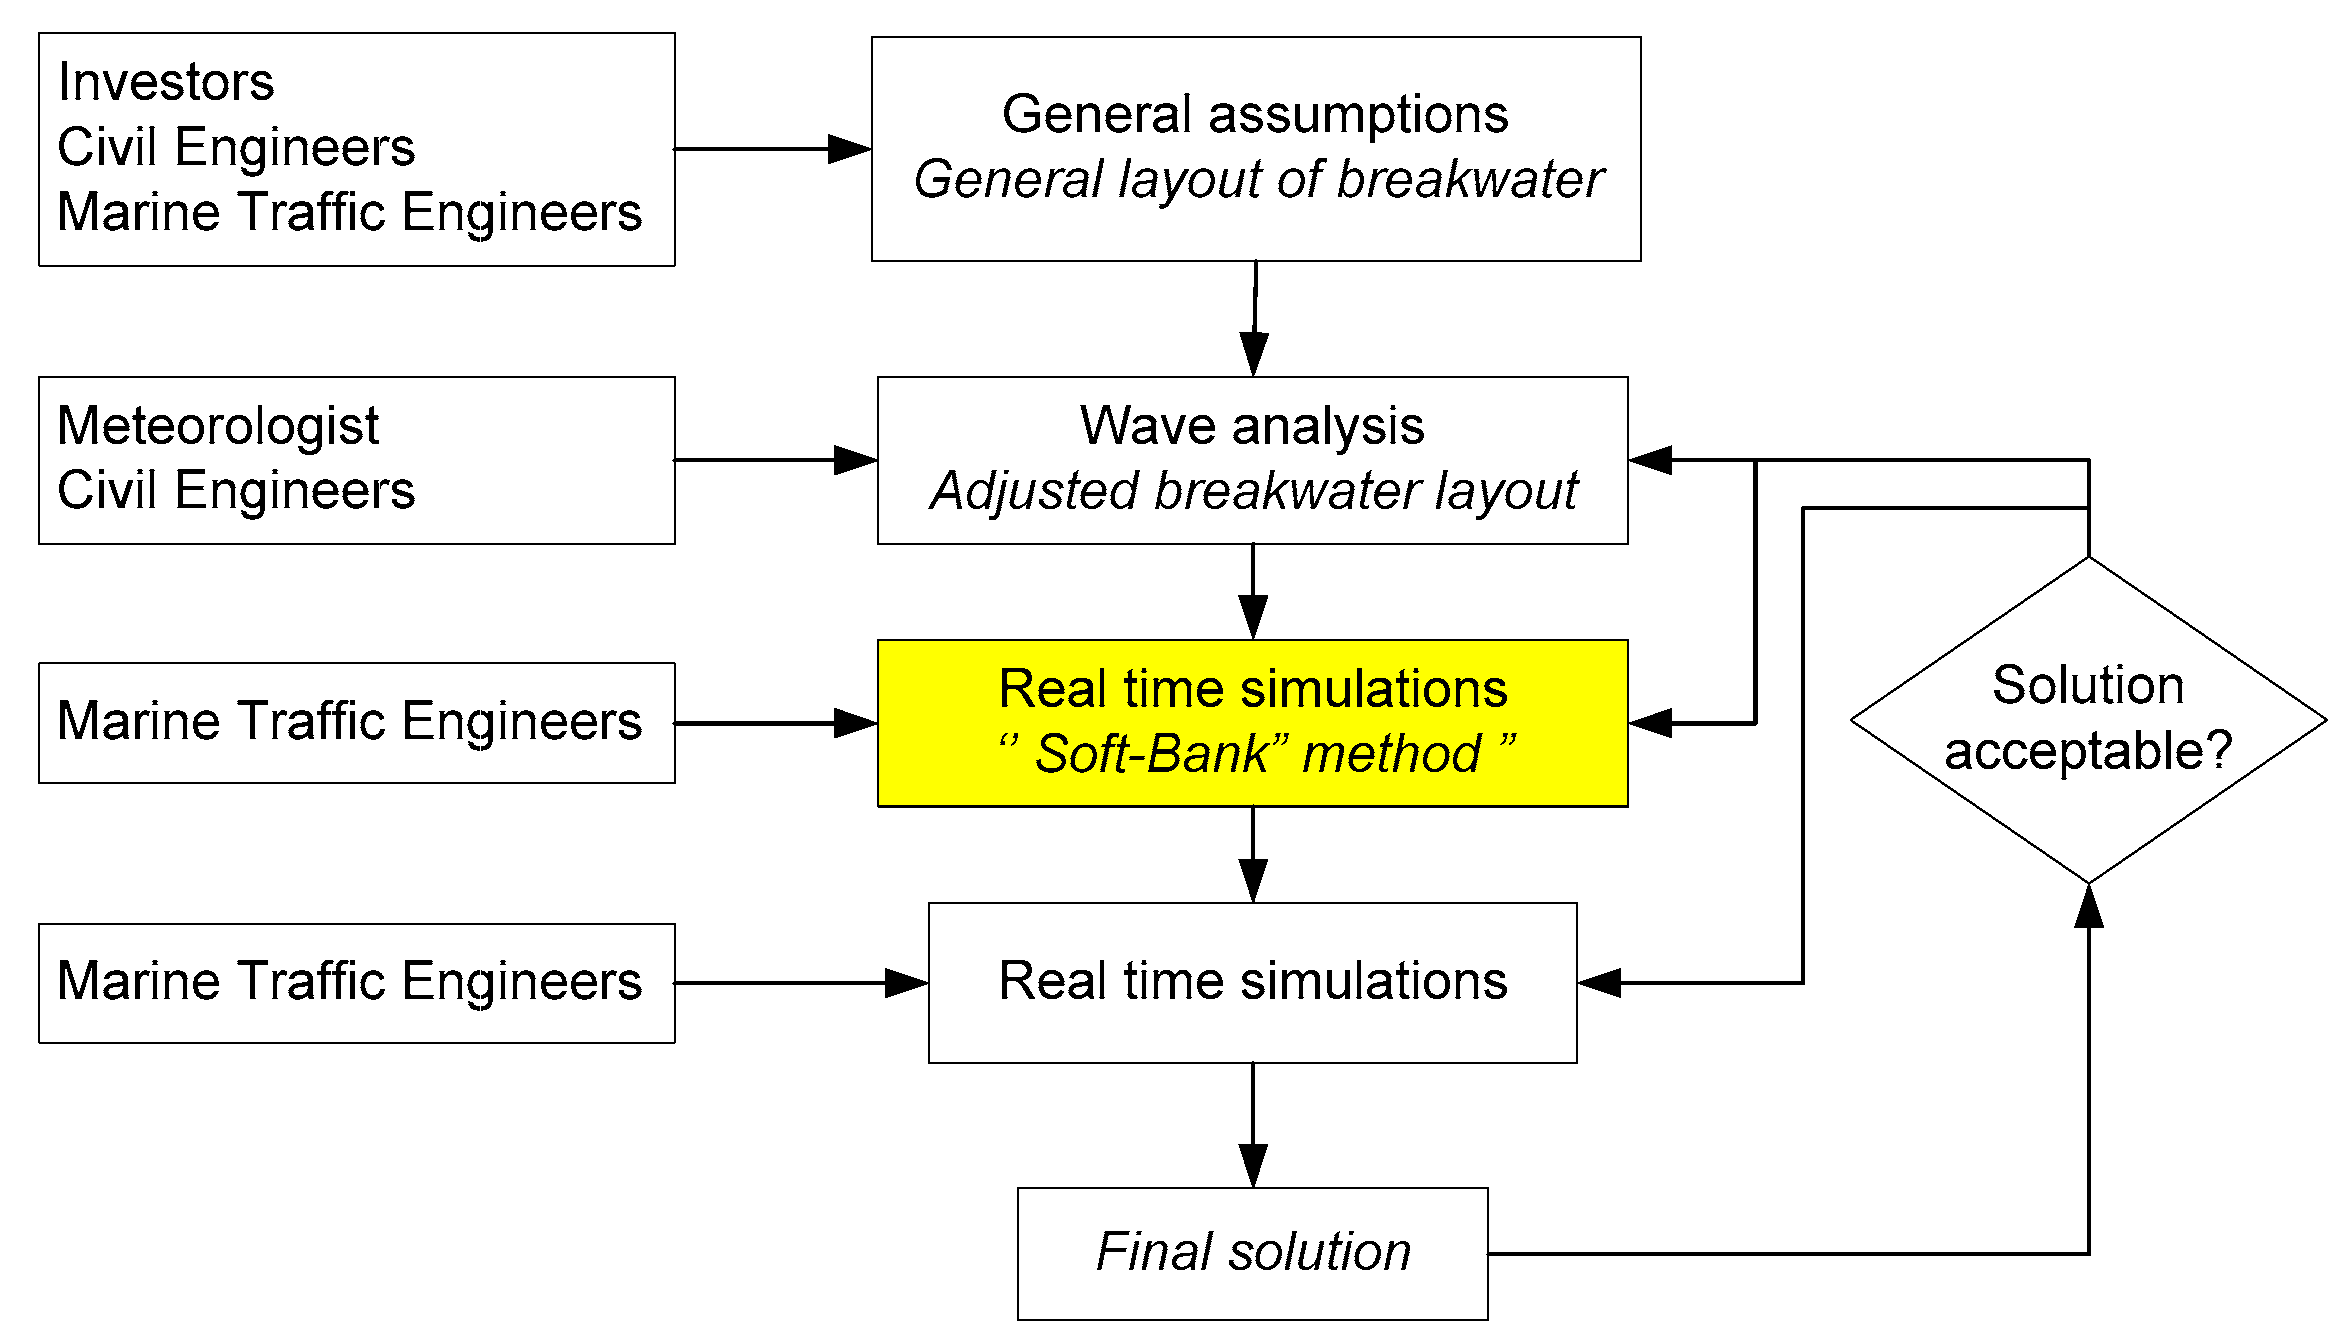
3.1. Proposed Method of Reducing Cost and Time of Simulation Analysis

The major change in the typical method used for designing the breakwater and port entrance in contrary to already existing methods [3,4,5,38] is the use of the so-called “Soft-Bank” method (Figure 6). This methodology is as follows:
  • Determine design water depth considering ships draft and under-keel clearance (H = 9.0 m in the presented study);
  • Design basic navigational aids with its minimum as possible number;
  • Design the navigable area without simulated embankments so no interaction between the ship and embankments is simulated;
  • Display the area layout on the electronic chart and inform the Captains performing the simulations that it is possible to passage the ship over the elements of infrastructure only in justified by environmental conditions cases;
  • Execute simulations and analyse the results.
The procedure is presented in Figure 6 is alike the standard port design procedure [3] with the novel “Soft-Bank” module included.
It should be mentions that that in port and waterway design from ships manoeuvring perspective other preliminary methods could be applied like:
  • Analytical methods like PIANC, ROM or Japanese;
  • Statistical methods based on generalisation of simulation experiments;
  • Fast Time Simulations (FTS) method.

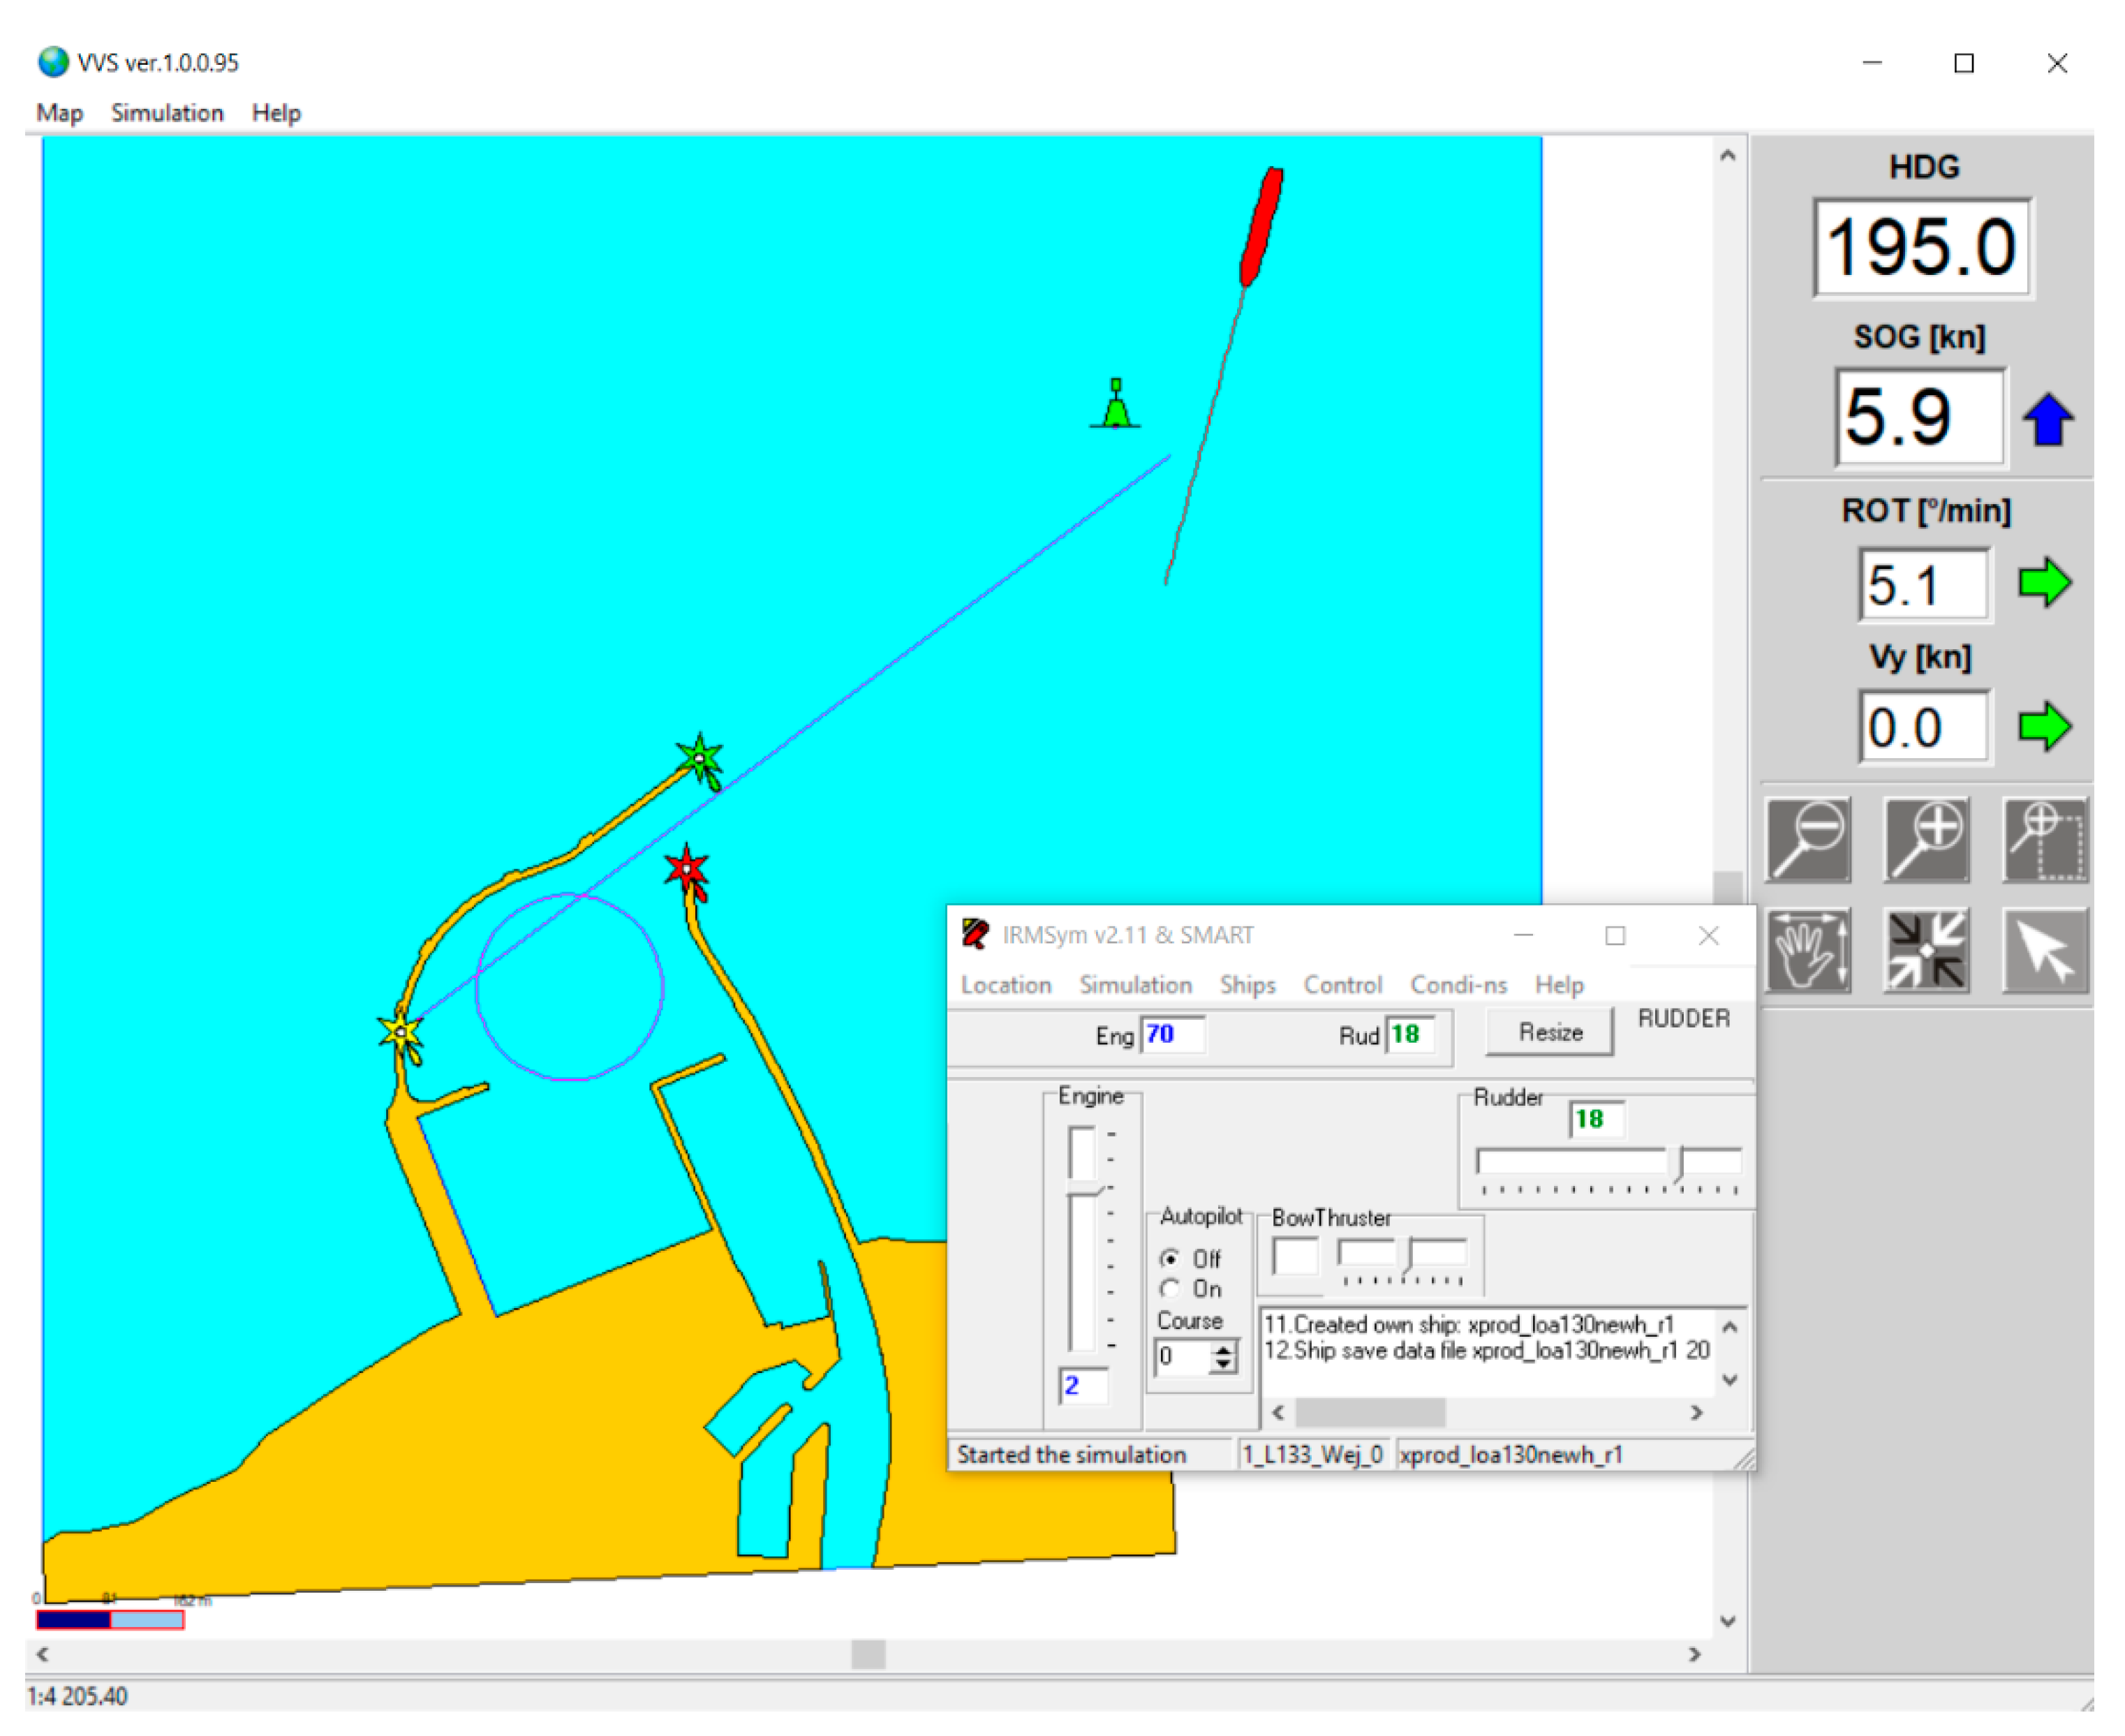
3.2. Real-Time Manoeuvring Simulation MethoD—Limited Task Simulator

The application of the real-time manoeuvring simulator with navigators (Captains and Pilots) as the control element in the loop, as applied in this study, is supposed to be the most reliable in port and waterways design studies [39]. There are several kinds of simulators with various applications, from the most advanced full mission simulators to limited task simulators. The latter was applied in the presented research. The simulator has 2D display and was made by the Maritime University of Szczecin research team and is described in [39,40]. The ship’s hydrodynamic model applied in this simulator is based on detailed parameters of hulls, propulsors, and steering devices. External influences like current, wave, shallow water, and collisions are modelled. Usually, depending on the availability, the actual manoeuvring characteristics are applied for the model’s validation. A special procedure for such validation is developed. The model of m/f Ustkamax used in the presented research is created with the modular methodology where all effects like hull hydrodynamic forces, propeller forces, and steering equipment forces together with given external influences are modelled as separate forces, and finally they are summed as perpendicular, parallel and rotational forces and later on movements [41].
The modular approach applied here for the ship manoeuvring simulator is presented in Figure 7. The graphical interface of the model is based on 2D display similar to the nautical chart (Figure 8). The interface includes also the data of ships basic parameters (position, course, speed, rotational speed, etc.), mooring pier and coastline location, navigational markings, soundings, external conditions information, tug steering interface, and line controller, and other control elements of the model. The model is implemented in Object Pascal with the use of Delphi™ environment and Visual C™ with the use of C++ language. Limiting to the usual 3DOFs (the horizontal planar motion) or in some application 4DOFs when the squat is included. The ship movement over the ground (thus the so-called dynamic effect of the water current is introduced) is given by Artyszuk [41]. The crucial element in modelling is the verification of the ship’s hydrodynamic model [42]. Usually, the verification process is made until 10% or smaller error between model and real ship data in the selected trials like turning trial, zig-zag, and stopping—acceleration is achieved [39].

3.3. Statistical Methods of Data Processing

Despite the real-time ship simulators are now very widely used and hydrodynamic models are becoming increasingly accurate, without efficient statistical data processing, it is usually not possible to draw reliable conclusions from the experiments. For the simulation data processing standard statistical models are proposed.

The Method of Simulation Result Data Processing

The most important safety factor is the horizontal area which is required for navigators to perform the safe manoeuvres [39,43]. Statistical processing of the simulation results allows the determination of the statistical parameters necessary to define a safe manoeuvring area (SMA). There are three specific values for the given waterway areas occupied by ships as the result of simulations. They are determined as (Figure 9):
  • Maximum waterway area needed for manoeuvring ships (extreme ships positions in all trials),
  • Average waterway area needed for manoeuvring ships (defined as mean SMA),
  • Waterway area on the given confidence level (defined as SMA on a given confidence level).
The analysis of simulation results is to determine the parameters of the ship’s horizontal safe manoeuvring area. In simulation trials, these parameters are determined by the width of the ship’s manoeuvring area, i.e., the area occupied by a single ship during a manoeuvre. The traffic lane (so-called PATH) is defined for a given ship and manoeuvre, while the safe manoeuvring area (SMA) is a term given to different ships and various manoeuvres (Figure 6). It can be seen from Figure 6 that the safe manoeuvring area (SMA) extends beyond the available water area (AWA) and encroaches on the navigational danger area (D), resulting in the need for some adjustments (e.g., dredging) to avoid potential accidents. SMA defined in such way is probabilistic 2D area which includes ships hydrodynamics with external effects (wind, wave, tugs, etc), position systems errors, and human-navigator performance during conducting the manoeuvre.
A safe manoeuvring area is an area in which the probability of exit of the ship beyond the AWA is at a relatively low level. In the port design studies, usually, 95% is applied in typical ship operations and 99% in more critical operations such as in presence of passengers of dangerous cargo or the existence of hard bottom [40]. The basic safe navigation condition needs to satisfy the following dependency:
d i α D i
where:
Di—width i-th point of the waterway at the bottom for safe isobath,
diα—width of safe manoeuvring area on the given confidence level (1-α).
It should be noticed that the general population here has the infinite number of variables of all possible simulation trials of the ship. The sample is defined as the series of simulation trials conducted with an adequate number at the same conditions. The width of the safe manoeuvring area of the ship is the range, which contains specified as a percentage part (fraction) of the general population. It can be defined as:
d i α = m d i + k α σ p i + k α σ l i
where:
m d i = m p i m l i
or using the equivalent dependence in the form of:
d i α = d i p α d i l α
for:
d i p α = m p i + k α σ p i   and   d i l α = m l i k α σ l i
where:
diα—width of the safe manoeuvring area at i-th point of the waterway on the confidence level equals to (1-α);
mdi—average of the safe manoeuvring area;
kα—factor dependent on the fraction of the general population, which should be covered by estimation (for SMA 95% k = 1.96);
mli, mpi—mean of the maximum distance of ship’s extreme points on the port side and starboard side of the waterway;
σli, σpi—standard deviations of the maximum distance of ship’s points to the port and starboard from i-th point of the waterway;
dilα, dipα—width of the port and the starboard safe manoeuvre area at i-th point of the waterway at defined confidence level (1-α).
The presented approach leads to the probabilistic method of safe manoeuvring area establishing is presented in Figure 10.

3.4. Conducting the Research

Several simulation series have been planned and then conducted as an illustrative to solve the port design problem:
  • Entrance and departure in no wind conditions (light conditions);
  • Entrance to the port with wind NW 11 m/s (moderate condition);
  • Entrance to the port with wind NW 17 m/s (severe condition);
  • Departure and turning manoeuvre in no wind;
  • Departure and turning manoeuvre with wind NW 11 m/s;
  • Departure and turning manoeuvre with wind NE 11 m/s.
The simulations according to the presented “Soft-Bank” methodology was made for the ship approach only (series 1–3). The shading effect of wind and wave were included in the simulation. Apart from the wind, the wave was modelled with a significant height of 0.9 m (moderate condition) for 11 m/s wind speed and 1.6 m (severe condition) for stronger winds. In total six experienced Captains were engaged to perform the simulations. The fifteen ship passages were conducted for each simulation series, which make 75 simulation runs in total. The single entrance manoeuvre of the ship for “Soft-Bank” method is presented in Figure 11.

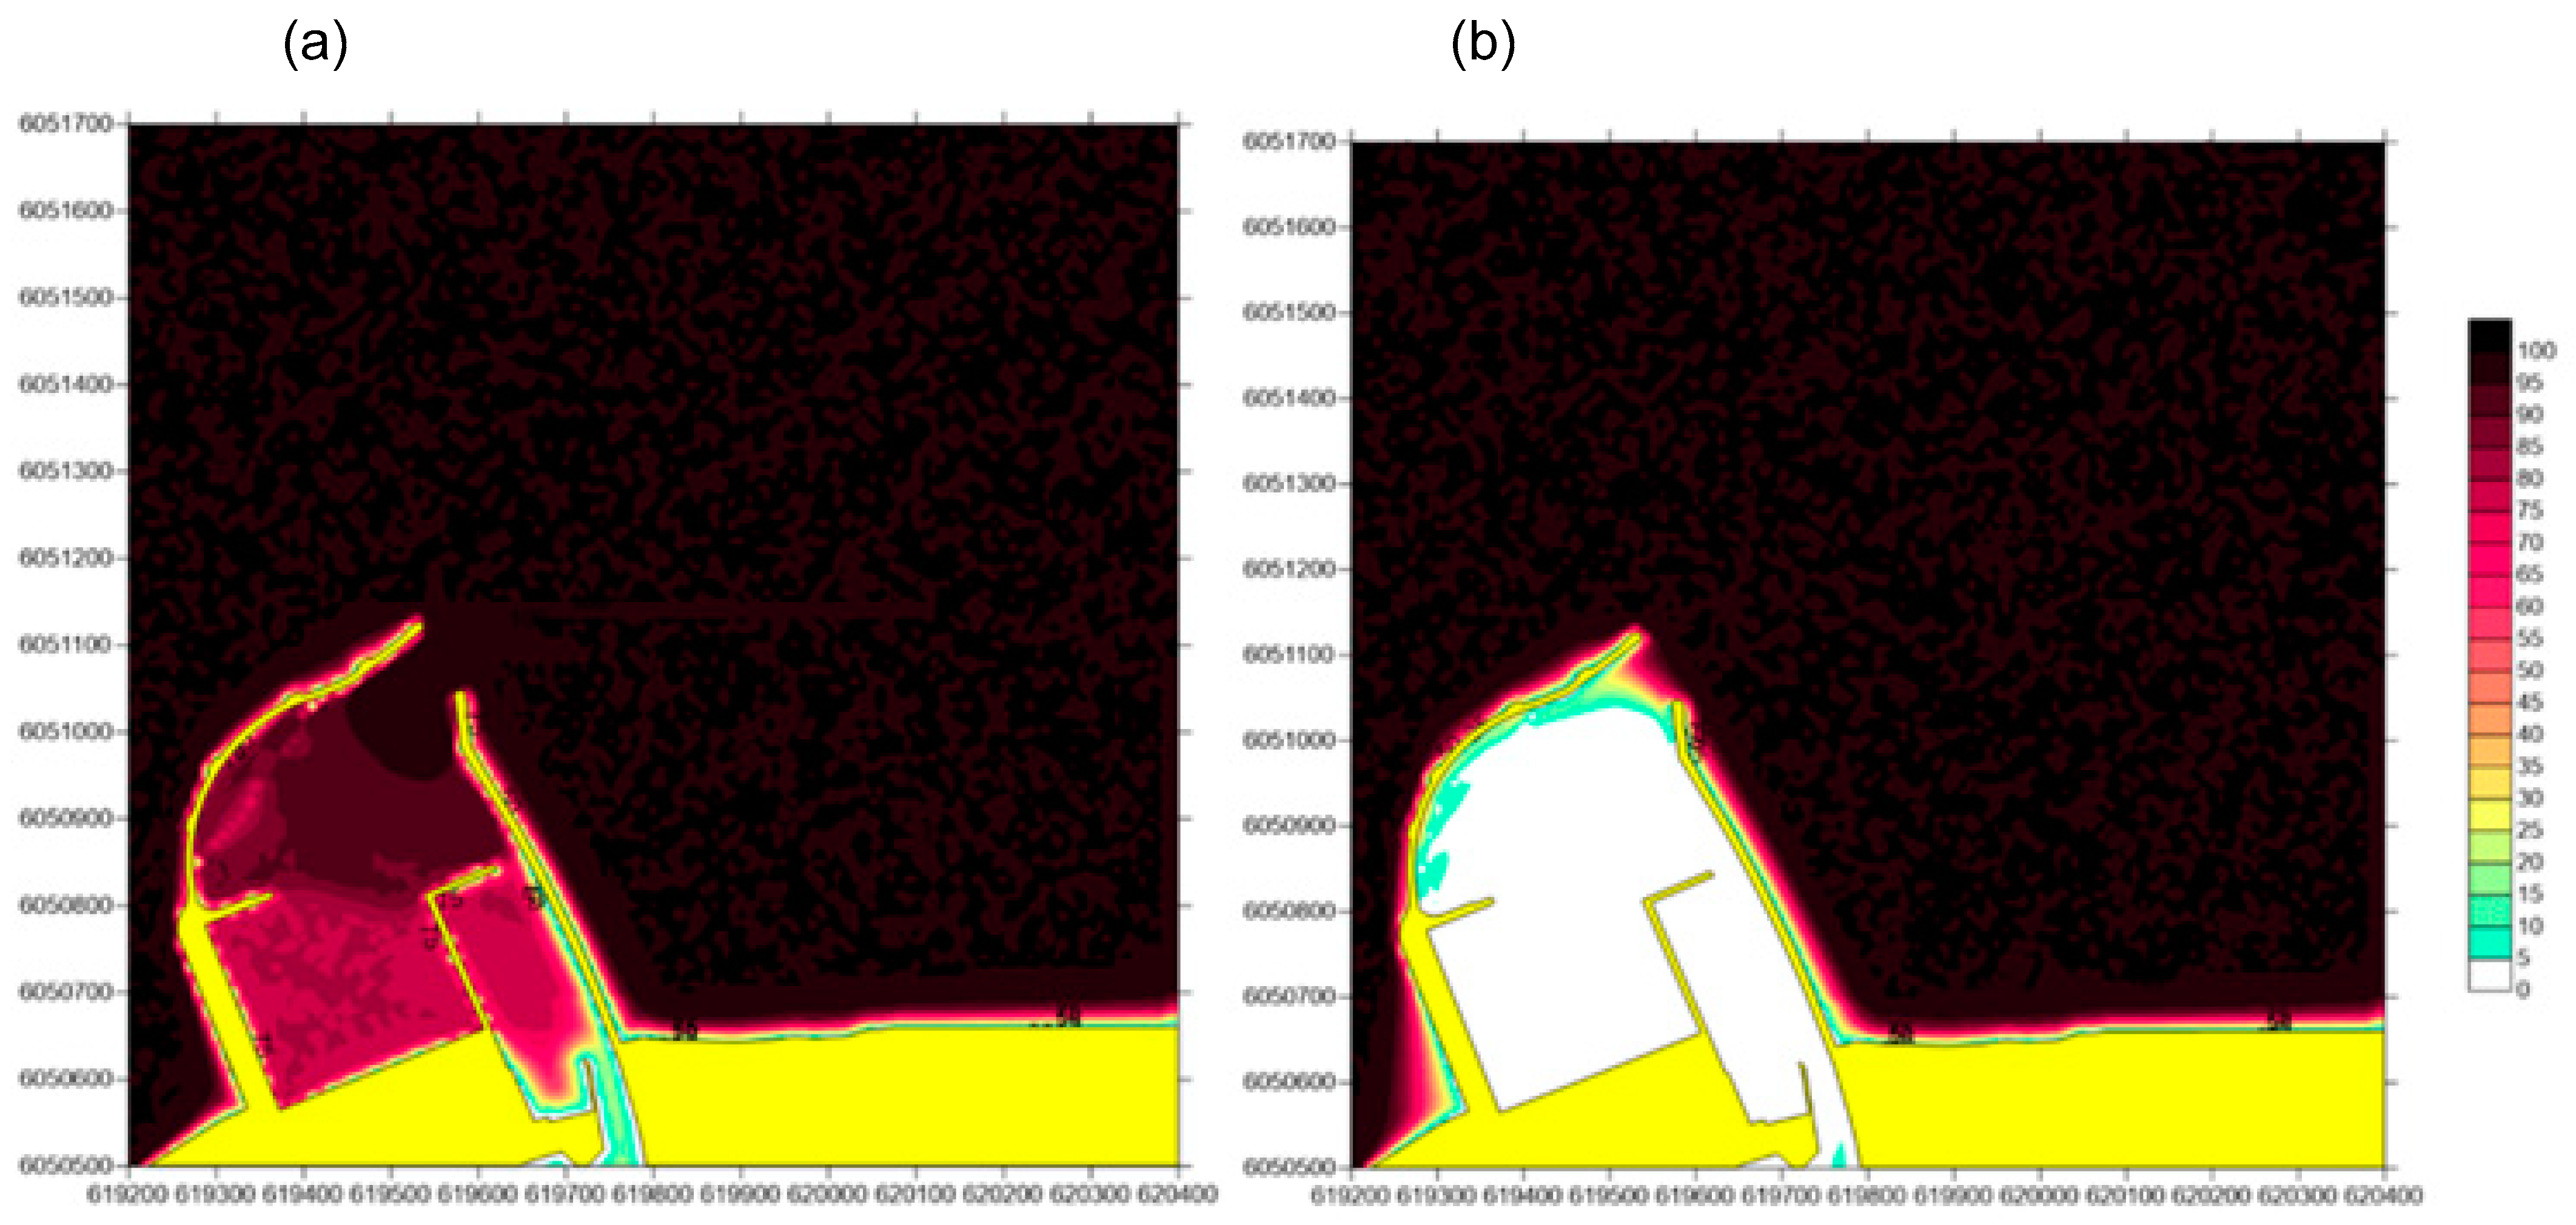
4. Results of Simulation Research and Discussion

All simulations were conducted by qualified captains and pilots experienced in this type of vessel and manoeuvre. Simulation data were recorded and analysed. The analysis of the simulation results was carried out based on the horizontal safe manoeuvring area criterion at the 95% confidence level (SMA) typically used in marine operations [5,39] according to the previously presented method.
As it is presented in Figure 12. the navigational marking in “Soft Bank” method is reduced to a minimum—there is only one green buoy on approach to show the Captains the turning point but only in a very approximately manner. Figure 13 presents the results of a standard method (without “Soft-Bank”) with final navigational markings and with modelled embankments and canal effects. The explanation for Figure 12 and Figure 13:
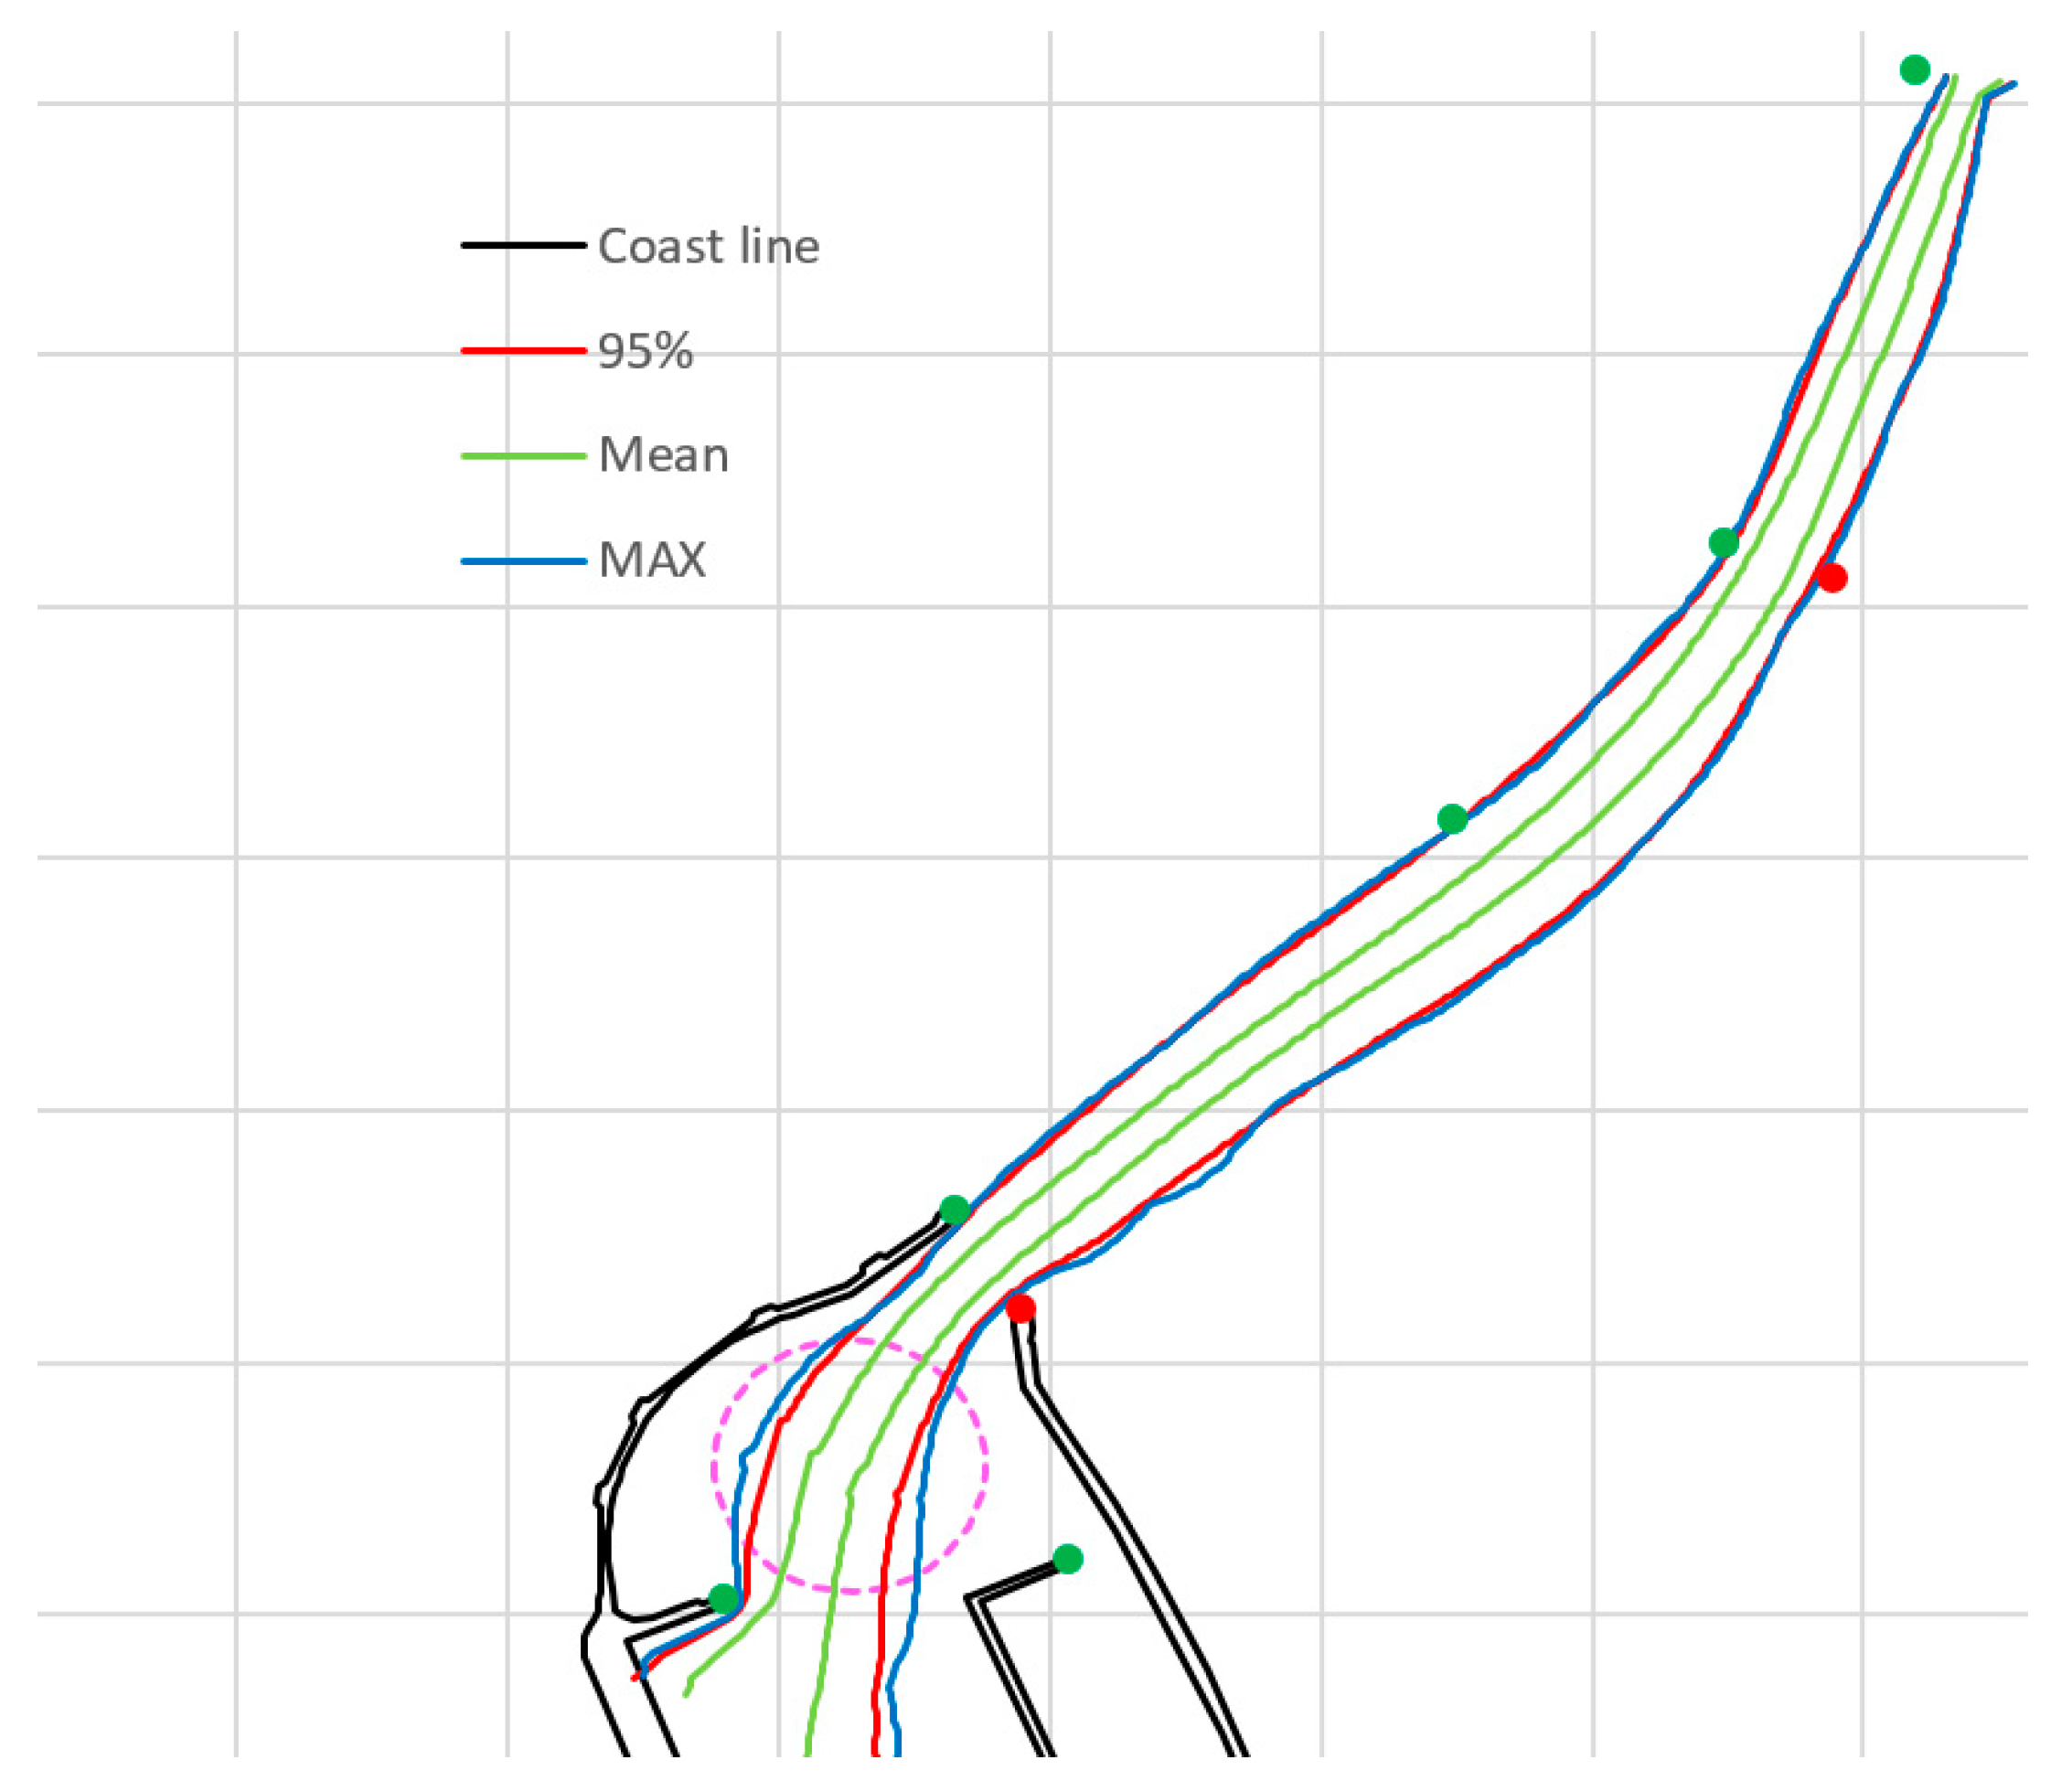
  • 95% is the Safe Manoeuvring Area (SMA) at a 95% level of confidence.
  • Mean is the average waterway area.
  • MAX is the maximal overbound area of all ships in series.

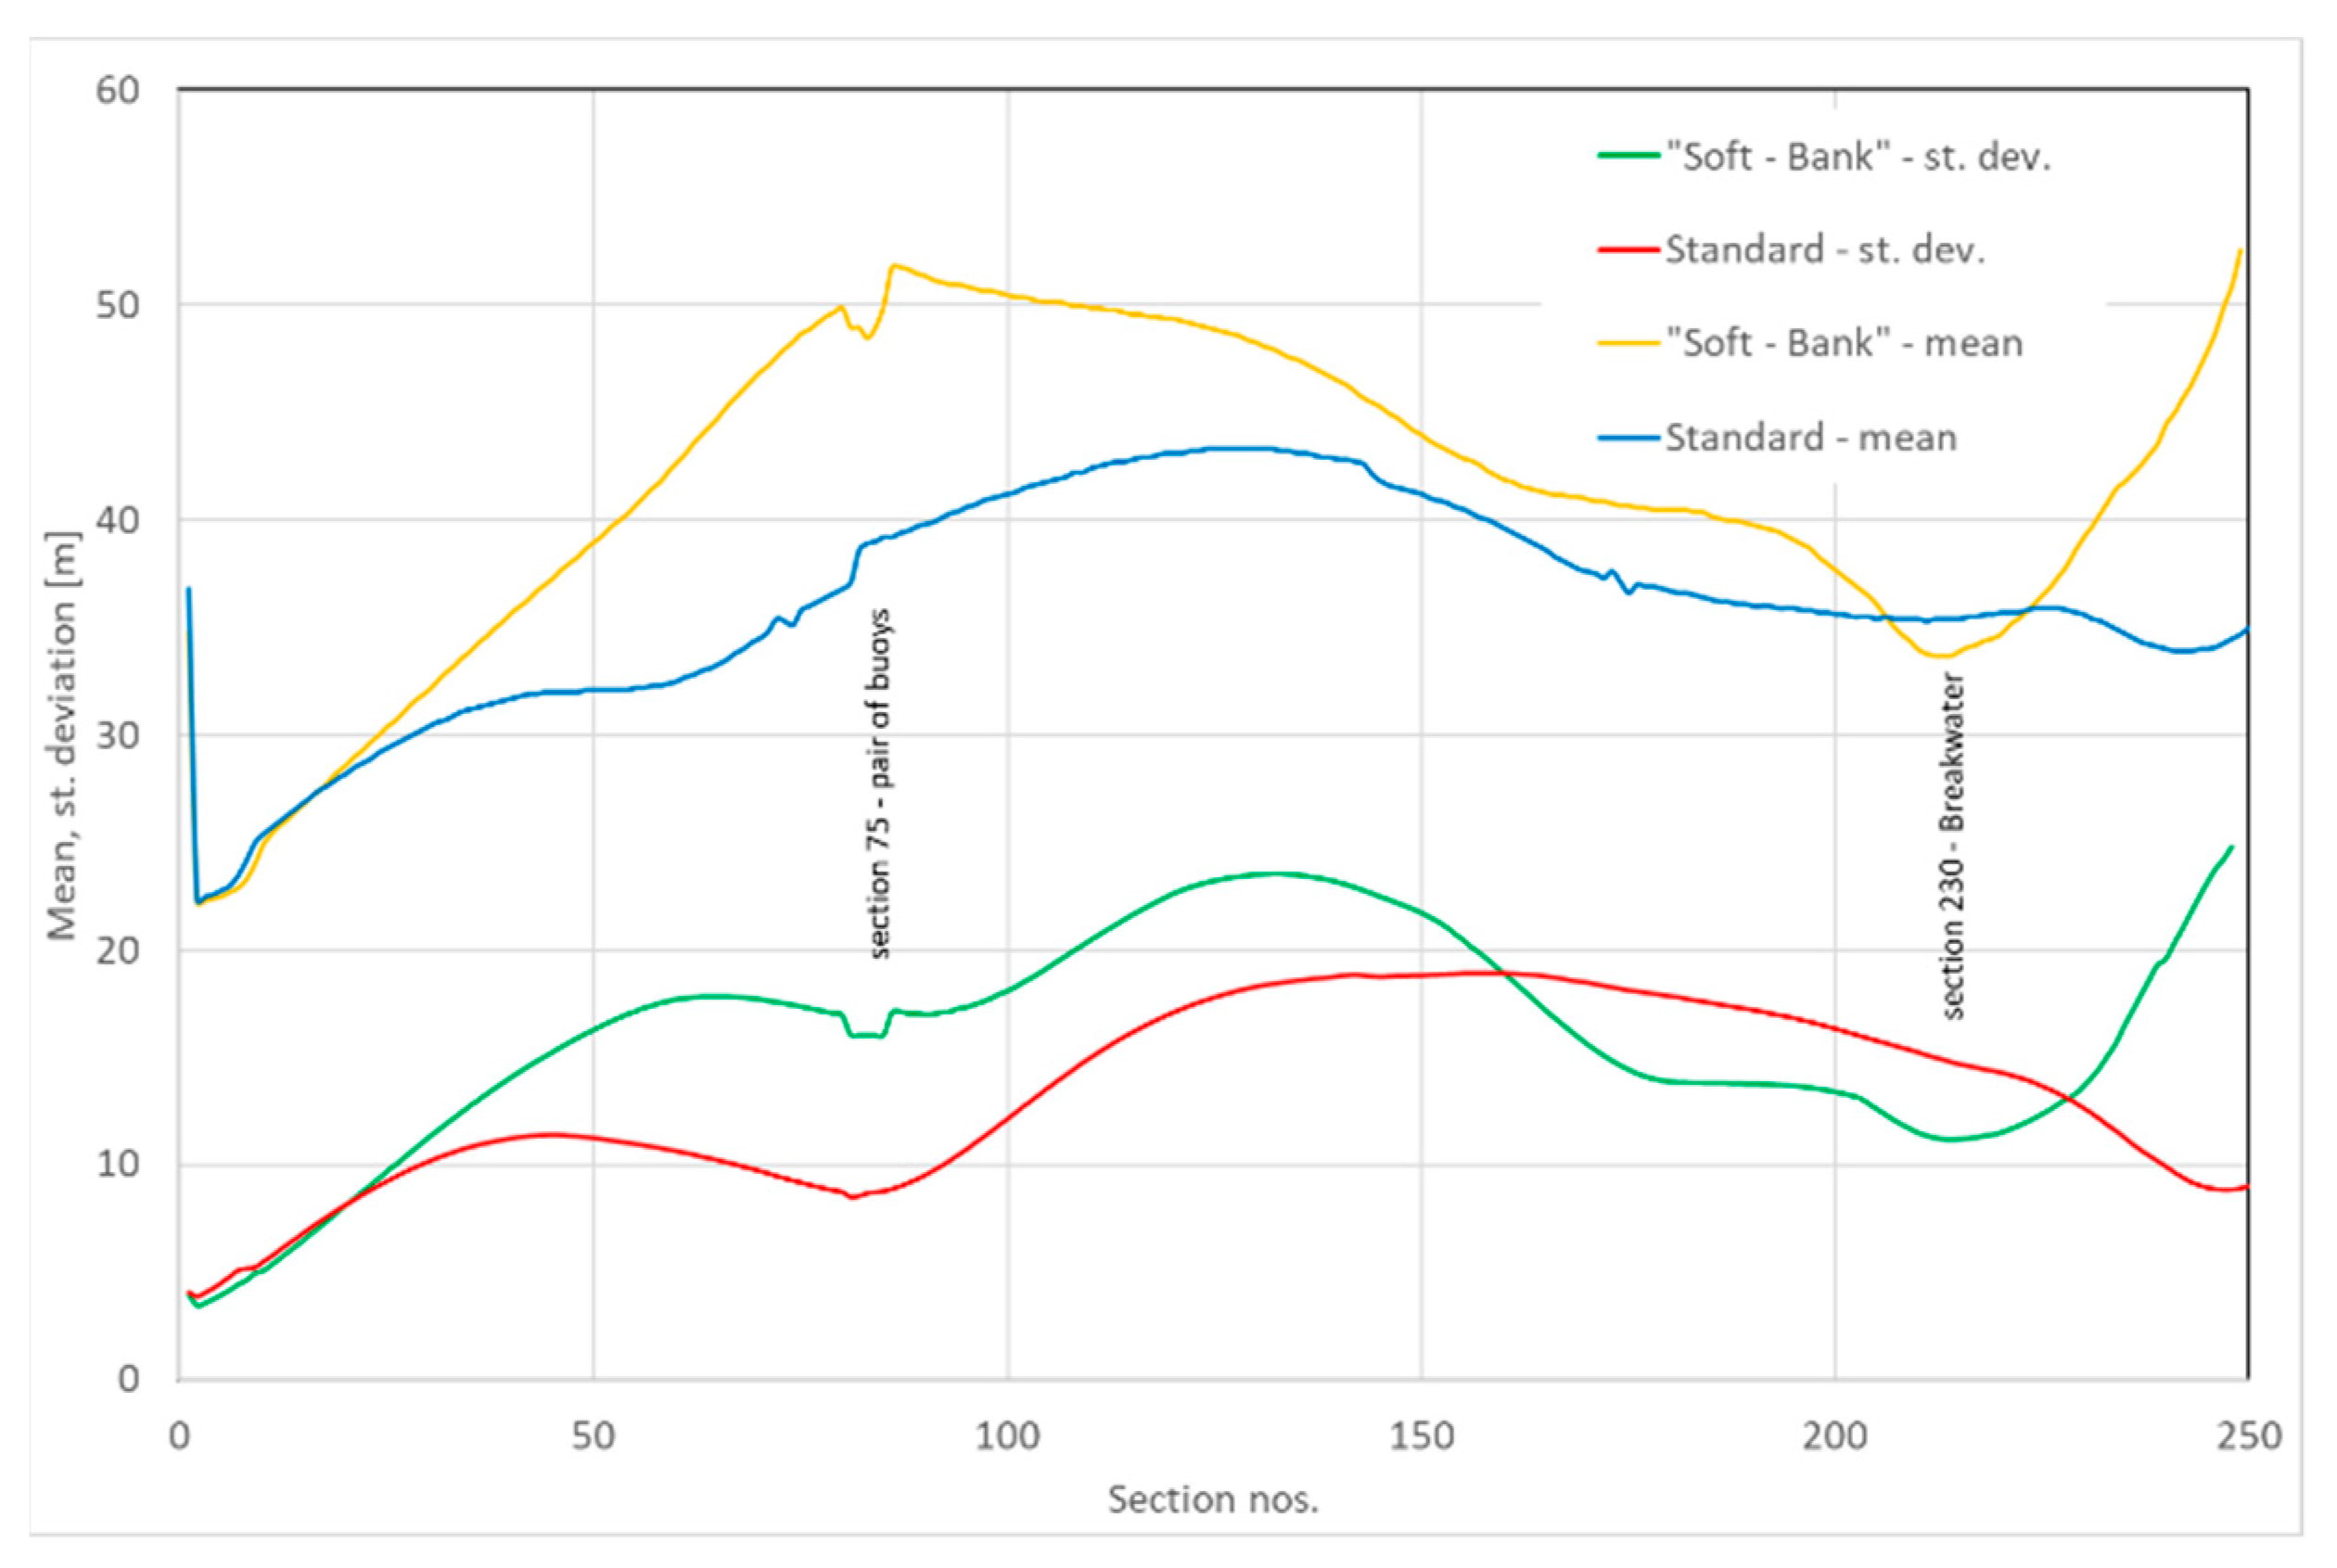
4.1. Comparison of Methods. Discussion

Table 2 shows channel widths obtained from different methods for two wind speeds. It can be noted that in the case of the simulation method, the channel widths under severe conditions may be smaller than under moderate conditions. This is because these manoeuvres are performed by experienced pilots and captains and not autopilot or artificial intelligence. Worse hydrometeorological conditions give fewer possibilities to manoeuvre freely (including the choice of speed and adjustments) and to manoeuvre correctly navigators have to do it very similar each time. In better hydrometeorological conditions, on the other hand, a man has more possibilities and selects the settings more freely. This is a common paradox when a man controls a ship. It should be noted that using analytical or empirical methods like PIANC, this phenomenon does not occur and the worse the conditions, the more manoeuvring space is necessary. Knowing this phenomenon, waterway designers use it by appropriately processing data from the simulation.
The basic statistical parameters of the manoeuvring area namely: mean and standard deviation are presented in Figure 14 for the designed approach waterway. The number of sections is 250 and the section width is 5 m. It can be observed that the mean and standard deviation is significantly lower for the standard method in comparison to the “Soft-Bank” method. It is because of the design, after the first step, navigational marking limits the waterway. Moreover, some changes in the waterway layout have been made so the movement of the ship on the approach is more optimized. The green buoy on the approach in “Soft-Bank” method (Figure 12) has been removed and the final layout of navigational marking is proposed (Figure 13) that consists of the gate of red-green buoys and two green buoys marking the starboard side of approach waterway. Such a design of waterways together with the navigational marking need an experienced marine traffic engineer engaged in the process.

4.2. The Limitation of the “Soft-Bank” Method

The presented method has some limitations, mostly in the following form:
  • The bank effect cannot be taken into account;
  • Limited possibility of taking into account the settlement of the vessel;
  • Impossible to take into account an accident in the form of a stranding and collision with embankments or a moored vessel or another civil engineering technical object;
  • The psychological impact on the navigator due to a false sense of safety due to not considering the ship’s collision possibility in simulation trials.
The first two limitations are not critical because there is the possibility to investigate them in the final stage of simulations if such need exists. In some research, however, depending on the investigated area effects presented in points 1 and 2 are not crucial and they could be neglected. Limitation number 3 is usually not critical since accidents are quite rare even in simulations. Limitation number 4 needs a deeper understanding of the Captains and Pilots. Usually, they are well debriefed before simulation (this was also the case in the Ustka Port study) and informed about such limitations. Clear instruction on how to behave shall be given because it could vast the overall effort of the simulation process. In the presented case, Captains and Pilots got the serious message in their task description namely: “The breakwaters and entrance waterway are modelled as “soft” and can be “passed over” by the ship—but this should be as much as possible avoided—this is done to determine possible changes in their layout. The quay is modelled as “hard” please impact with it to determine the energy of ship contact”.

5. Conclusions

The presented study showed the applicability of real-time simulation methods for design the new ports, their approaches, and the breakwater layouts. The case study of Ustka Port was used as a working example. Moreover, the “Soft-Bank” method developed and presented could let to reduce almost 50% workload for conducting the simulation runs by reducing the number of possible port infrastructure solutions. The presented approach gives also the possibility of predesign and opening the discussion about the proposed solution in the middle of research work which gives always some opportunity to test more solutions and optimize the overall project. The method itself is useful because it comprises the most important effects related to ship’s dynamics and enables suitable shaping of the layout of waterway and breakwaters without testing too many variants. The method has also great potential for designing the navigational marking like in this particular study the navigation marking was designed by the presented method, deciding on the possibility of mooring vessels in the vicinity of waterways (Some vessels could limit the existing waterways and decision could be done with presented method application. It should be noted that in comparison to the Fast Time Simulation (FTS) method, the Soft-Bank method seems to have both advantages and disadvantages. The Soft-Bank method is still more time consuming, especially when comparing different approach channel layouts and/or breakwater configurations. The Soft-Bank method enables to engage in the process of Captains and Pilots and tugs for manoeuvres which is usually problematic in the FTS method.
The case study was presented in [Gucma L., Łazuga K. & Perkovic M. 2019. Ship manoeuvres on existing turning places—when the size of the ship reaches the limits of port infrastructure on the example of Kołobrzeg Port. Proc. of European Navigation Conference (ENC) Warsaw.] to będzie 42), turning places design [11], and other types of port infrastructure dedicated for ships. The limitations of the presented method were selected and discussed. They generally do not negatively affect the overall process of waterway design since all its important drawbacks could be eliminated in the final step design like it was presented in the Ustka Port case study.
Moreover, it was observed that the real-time simulation method and the limited task simulator used here have proven their usefulness in port modernization work to increase the benefits of port operations without compromising navigational safety. The following precautions should be considered when planning and executing simulation experiments:
  • Simulators are widely used tools and proper verification, especially of the simulation hydrodynamic model and hydrometeorological conditions models, should be carried out at the outset to match simulations to reality as closely as possible.
  • The simulation method should be carried out by multiplying ship runs. The simulation studies based on a single or very small number of simulations without statistical data processing and experimental plan are questionable and do not present the proper value to port design needs.
  • In any real-time simulation project, a very good link between pilots with good local knowledge for validation and provision of domain expertise should be established.

Author Contributions

Conceptualization, L.G.; methodology, L.G.; software, L.G. and K.Ł.; validation, K.Ł., N.M.Q. and L.G.; formal analysis, K.Ł.; investigation, K.Ł. and N.M.Q.; resources, L.G. and N.M.Q.; data curation, K.Ł.; Writing—Original draft preparation, L.G.; Writing—Review and editing, K.Ł. and N.M.Q.; visualization, L.G.; supervision, K.Ł.; project administration, L.G.; funding acquisition, L.G. All authors have read and agreed to the published version of the manuscript.

Funding

This research received no external funding.

Institutional Review Board Statement

Not applicable.

Informed Consent Statement

Not applicable.

Data Availability Statement

Not applicable.

Conflicts of Interest

The authors declare no conflict of interest.

References

  1. Maritime University of Szczecin. Navigational Analysis of Ustka Modernization; 2019; Unpublished. (In Polish) [Google Scholar]
  2. Perkovic, M.; Brcko, T.; Luin, B.; Vidmar, P. Ship Handling Challenges When Vessels are Outgrowing Ports. In Proceedings of the IMLA-INSLC, Cape Town, South Africa, 16 September 2016. [Google Scholar]
  3. Pianc MarCom WG 121: Harbour Approach Channels–Design Guidelines. Available online: https://www.pianc.org/publications/marcom/harbour-approach-channels-design-guidelines (accessed on 3 October 2020).
  4. Pianc MarCom WG 158: Masterplans for the Development of Existing Ports. Available online: https://www.pianc.org/publications/marcom/masterplans-for-the-development-of-existing-ports (accessed on 3 October 2020).
  5. ROM 3. 1-99: Recommendations for the Design of the Maritime Configuration of Ports, Approach Channels and Harbour Basins; Puertos del Estado: Madrid, Spain, 2007; ISBN 978-84-88975-39-3. [Google Scholar]
  6. IALA GUIDELINE 1058: Use of Simulation as a Tool for Waterway Design and Aids to Navigation Planning. Available online: https://www.iala-aism.org/product/use-of-simulation-as-a-tool-for-waterway-design-and-aids-to-navigation-planning-1058 (accessed on 3 October 2020).
  7. Vuylsteke, A. Scale Enlargement in the Flemish Port Area; Vlaanderen, 2016. [Google Scholar]
  8. Billington, C.J. Managing Risks in Ports. In Managing Risks in Shipping: A Practical Guide; The Nautical Institute: London, UK, 2001; pp. 57–69. [Google Scholar]
  9. Port Marine Safety Code. Available online: https://www.gov.uk/government/publications/port-marine-safety-code (accessed on 3 October 2020).
  10. Gucma, S.; Przywarty, M.; Dzwonkowski, J.; Bilewski, M. Dimensioning of Fairway Bends—Kinematic Method of Numerical Simulation. J. Mar. Sci. Eng. 2020, 8, 138. [Google Scholar] [CrossRef] [Green Version]
  11. Vidmar, P.; Perkovič, M.; Gucma, L.; Łazuga, K. Risk Assessment of Moored and Passing Ships. Appl. Sci. 2020, 10, 6825. [Google Scholar] [CrossRef]
  12. Pianc MarCom WG 117: Use of Hydro/Meteo Information for Port Access and Operations (2012). Available online: https://www.pianc.org/publications/marcom/use-of-hydro-meteo-information-for-port-access-and-operations (accessed on 3 October 2020).
  13. McCartney, B.L. (Ed.) Ship Channel Design and Operation; ASCE manuals and reports on engineering practice; American Society of Civil Engineers: Reston, VA, USA, 2005; ISBN 978-0-7844-0770-7. [Google Scholar]
  14. Ligterngen, H.; Velsink, H. Port and Terminals; VSSD: Kanpur, India, 2012. [Google Scholar]
  15. Carl, A. Thoresen Port Designers Handbook, 3rd ed.; ICE Publishing: London, UK, 2014; ISBN 978-0-7277-6004-3. [Google Scholar]
  16. Gucma, L.; Łazuga, K. The Support of Port Regulation Creation and Update by Real-Time Ship Manoeuvring Simulation Studies Exampled by Port of Kołobrzeg. Trans Nav Int. J. Mar. Navig. Saf. Sea Transp. 2019, 13. [Google Scholar] [CrossRef]
  17. Iribarren, J.R. PIANC Bulletin No. 100; PIANC: Bruxelles, Belgium, 1999. [Google Scholar]
  18. William, C. Webster Shiphandling Simulation: Application to Waterway Design; National Academies Press: Washington, DC, USA, 1992; p. 2015. ISBN 978-0-309-04338-0. [Google Scholar]
  19. Permanent International Association of Navigation Congresses; Permanent Technical Committee II; Working Group No. 20. Capability of Ship Manoeuvring Simulation Models for Approach Channels and Fairways in Harbours: Report of Working Group No. 20 of Permanent Technical Committee II; General Secretariat of PIANC: Brussels, Belgium, 1992; ISBN 978-2-87223-040-2. [Google Scholar]
  20. Benedict, K.; Baldauf, M.; Felsenstein, C.; Kirchhoff, M. Computer-Based Support for the Evaluation of Ship Handling Exercise Results. WMU J. Marit. Aff. 2006, 5, 17–35. [Google Scholar] [CrossRef]
  21. Benedict, K.; Kirchhoff, M.; Gluch, M.; Fischer, S.; Baldauf, M. Manoeuvring Simulation on the Bridge for Predicting Motion of Real Ships and as Training Tool in Ship Handling Simulators. Int. J. Mar. Navig. Saf. Sea Transp. 2009, 3, 25–30. [Google Scholar]
  22. Zhang, W. Assessing the Competency of Seafarers Using Simulators in Bridge Resource Management (BRM) Training. Dissertation Thesis, World Maritime University, Malmo, Sweden, 11 May 2017. [Google Scholar]
  23. Sariöz, K.; Narli, E. Assessment of Manoeuvring Performance of Large Tankers in Restricted Waterways: A Real-Time Simulation Approach. Ocean Eng. 2003, 30, 1535–1551. [Google Scholar] [CrossRef]
  24. Eloot, K.; Verwilligen, J.; Vantorre, M. A Methodology for Evaluating the Controllability of a Ship Navigating in a Restricted Channel. Arch. Civil Mech. Eng. 2007, 7, 91–104. [Google Scholar] [CrossRef] [Green Version]
  25. Lataire, E.; Vantorre, M.; Delefortrie, G. The influence of the ship’s speed and distance to an arbitrarily shaped bank on bank effects. ASME 2015. [Google Scholar] [CrossRef] [Green Version]
  26. Cross, S.J.; Olofsson, M. Classification of maritime simulators, the final attempt introducing dnv’s new standard. In Proceedings of the International Conference on Marine Simulation and Ship Manoeuvrability 2000 (MARSIM 2000), Orlando, FL, USA, 8–12 May 2000; p. 7. [Google Scholar]
  27. Donatini, L.; Vantorre, M.; Verwilligen, J.; Delefortrie, G. Description of Hydro/Meteo Data in Ship Manoeuvring Simulators: A Survey on the State of the Art. Ocean Eng. 2019, 189, 106344. [Google Scholar] [CrossRef] [Green Version]
  28. Nam-Kyun, I.; Van-Luong, T. Ship’s Maneuverability in Strong Wind. J. Navig. Port Res. Int. Ed. 2008, 32, 115–120. [Google Scholar]
  29. Cieutat, J.M.; Gonzato, J.C.; Guitton, P. A New Efficient Wave Model for Maritime Training Simulator. In Proceedings of the Proceedings Spring Conference on Computer Graphics, Budmerice, Slovakia, 25–28 April 2001; pp. 202–209. [Google Scholar]
  30. Artyszuk, J. A Uniform Current in Ship Manoeuvring Mathematical Model. Annu. Navig. 2004, 8, 67–76. [Google Scholar]
  31. Vantorre, M.; Delefortrie, G.; Laforce, E.; Vlieger, H.D.; Claeys, S. Ship Manoeuvring at Very Small and Negative Under Keel Clearance. IFAC Proc. Vol. 2003, 36, 37–42. [Google Scholar] [CrossRef]
  32. Benedict, K.; Kirchhoff, M.; Fischer, S.; Gluch, M.; Klaes, S.; Baldauf, M. Application of Fast Time Simulation Technologies for Enhanced Ship Manoeuvring Operation. IFAC Proc. Vol. 2010, 43, 79–84. [Google Scholar] [CrossRef]
  33. Artyszuk, J. A Novel Method of Ship Manoeuvring Model Identification from Sea Trials. Annu. Navig. 2003, 6, 19–35. [Google Scholar]
  34. World Meteorological Organization. Guidelines on Ensemble Prediction Systems and Forecasting; WMO: Geneva, Switzerland, 2012; ISBN 978-92-63-11091-6. [Google Scholar]
  35. Molteni, F.; Buizza, R.; Palmer, T.N.; Petroliagis, T. The ECMWF Ensemble Prediction System: Methodology and Validation. Q.J. Royal Met. Soc. 1996, 122, 73–119. [Google Scholar] [CrossRef]
  36. Mel, R.; Lionello, P. Storm Surge Ensemble Prediction for the City of Venice. Weather Forecast. 2014, 29, 1044–1057. [Google Scholar] [CrossRef]
  37. Mel, R.; Viero, D.P.; Carniello, L.; Defina, A.; D’Alpaos, L. Simplified Methods for Real-Time Prediction of Storm Surge Uncertainty: The City of Venice Case Study. Adv. Water Resour. 2014, 71, 177–185. [Google Scholar] [CrossRef]
  38. Technical Standards and Commentaries of Port and Harbour Facilities in Japan. Japan Port and Harbour Association 1999 Translated by the Overseas Coastal Area Development Institute of Japan in 2002. Jpn. Port Harb. Assoc. 2002, 1, 455–473.
  39. Perkovic, M.; Gucma, L.; Przywarty, M.; Gucma, M.; Petelin, S.; Vidmar, P. Nautical Risk Assessment for LNG Operations at the Port of Koper. SV-JME 2012, 58, 607–613. [Google Scholar] [CrossRef] [Green Version]
  40. Gucma, L. Zarządzanie Ryzykiem w Rejonie Mostów Usytuowanych Nad Drogami Wodnymi w Aspekcie Zderzenia z Jednostkami Pływającymi. (Risk Management in the Area of Bridges Situated on Waterways in Respect to Ships Collisions); Scientific Publications of Maritime University of Szczecin: Szczecin, Poland, 2012; ISBN 978-838-990-70-5. [Google Scholar]
  41. Artyszuk, J. Towards a Scaled Manoeuvring Mathematical Model for a Ship of Arbitrary Size. Zesz. Nauk. Akad. Morska Szczec. 2005, 78, 21–37. [Google Scholar]
  42. Kobyliński, L. Capabilities of Ship Handling Simulators to Simulate Shallow Water, Bank and Canal Effects. TransNav Int. J. Mar. Navig. Saf. Sea Transp. 2011, 5, 247–252. [Google Scholar]
  43. Iribarren, J.R. Determining the Horizontal Dimensions of Ship Manoeuvring Areas. Bull. Perm. Int. Assoc. Navig. Congr. 1999, 100, 5–26. [Google Scholar]
Figure 1. Ustka Port—the present layout.
Jmse 09 00211 g001
Figure 2. Ustka Port—the preliminary design (yellow) and proposed changes in the breakwater after wave conditions modelling inside the port (red).
Jmse 09 00211 g002
Figure 3. Selected results from model trials: (a) turning circle and (b) 20°-20° Zig-Zag manoeuvre.
Jmse 09 00211 g003
Figure 4. Selected elements of environmental modelling. (a) wind scale-up factors for NE winds, (b) wave scale-up factors for NE wave system.
Jmse 09 00211 g004
Figure 5. The wind rose for Ustka Port. (wind 1 h averaged, data from 2000–2020).
Jmse 09 00211 g005
Figure 6. The flowchart of the new method of port approach area design applied in this study.
Jmse 09 00211 g006
Figure 7. The modular model of ship manoeuvring for the port design that was applied in this study.
Jmse 09 00211 g007
Figure 8. The 2D GUI (Graphical user interface) of the simulation model (with ships movement control panel activated).
Jmse 09 00211 g008
Figure 9. Definition of the ideas connected with horizontal areas taken by ships (PATH—lane of a single ship, AWA—available water area, SMA—safe manoeuvre area on the required confidence level, D—navigational danger).
Jmse 09 00211 g009
Figure 10. Definition of the probabilistic approach to determine horizontal areas from ships manoeuvring simulations (PATH—lane of a single ship, AWA—available water area, SMA—safe manoeuvre area on the given confidence level).
Jmse 09 00211 g010
Figure 11. The single simulation passage—entrance and berthing in zero wind conditions.
Jmse 09 00211 g011
Figure 12. Manoeuvring areas of a general cargo ship of L = 133 m on approach to modernized Ustka Port by “Soft-Bank” with limited (preliminary) navigational marking.
Jmse 09 00211 g012
Figure 13. Manoeuvring areas of L = 133 m general cargo ship on approach to modernized Ustka Port using the standard method with final navigational marking.
Jmse 09 00211 g013
Figure 14. Comparison of two parameters of manoeuvring areas of the investigated ship on approach to modernized Ustka Port using the “Soft-Bank” method for preliminary design and standard method for the final design.
Jmse 09 00211 g014
Table 1. The plan of simulation research in Ustka.
No.Name of FileManoeuvre Initial Speed (kn)Wind Speed (m/s)Wave on the Approach
(m)
No. of Trials
11_L133_Wej_0Entry into port and mooring on the starboard side6nono15
22_L133_Wej_NW11as above6NW 110.915
33_L133_Wej_NW17as above6NW 171.615
44_L133_Wyj_0Unmooring, turning and leaving port0nono15
55_L133_Wyj_NW11as above0NW 110.915
66_L133_Wyj_NE11as above0NE 110.915
Table 2. Channel widths were obtained from different methods for two wind speeds.
NoMethodsCaseChannel Widths
ModerateSevere
3SimulationsMean3033
95% confident8380
Max7975
1PIANC60 m
(3.0 B)
70 m
(3.5 B)
2Japanese (OCDI 2009)55.6 m
(2.8 B)
NA
B: ship width.
Publisher’s Note: MDPI stays neutral with regard to jurisdictional claims in published maps and institutional affiliations.

