Article

Improving Near Miss Detection in Maritime Traffic in the Northern Baltic Sea from AIS Data

1
Department of Mechanical Engineering, School of Engineering, Aalto University, 00340 Espoo, Finland
2
Department of Industrial Engineering, Dalhousie University, Halifax, NS B3H 4R2, Canada
3
School of Electronic and Optical Engineering, Nanjing University of Science and Technology, Nanjing 210094, China
*
Author to whom correspondence should be addressed.
J. Mar. Sci. Eng. 2021, 9(2), 180; https://doi.org/10.3390/jmse9020180
Submission received: 20 December 2020 / Revised: 25 January 2021 / Accepted: 5 February 2021 / Published: 10 February 2021
(This article belongs to the Section Ocean Engineering)

Abstract

:
Ship collision is the most common type of accident in the Northern Baltic Sea, posing a risk to the safety of maritime transportation. Near miss detection from automatic identification system (AIS) data provides insight into maritime transportation safety. Collision risk always triggers a ship to maneuver for safe passing. Some frenetic rudder actions occur at the last moment before ship collision. However, the relationship between ship behavior and collision risk is not fully clarified. Therefore, this work proposes a novel method to improve near miss detection by analyzing ship behavior characteristic during the encounter process. The impact from the ship attributes (including ship size, type, and maneuverability), perceived risk of a navigator, traffic complexity, and traffic rule are considered to obtain insights into the ship behavior. The risk severity of the detected near miss is further quantified into four levels. This proposed method is then applied to traffic data from the Northern Baltic Sea. The promising results of near miss detection and the model validity test suggest that this work contributes to the development of preventive measures in maritime management to enhance to navigational safety, such as setting a precautionary area in the hotspot areas. Several advantages and limitations of the presented method for near miss detection are discussed.

1. Introduction

Ship collision is the most common type of accident in the Northern Baltic Sea, a busy and ecologically vulnerable sea area [1,2,3,4,5,6]. Preventing ship collision helps reduce environmental pollution, casualties, and economic losses. Extensive research has been conducted to achieve a safe maritime transport system [7,8,9,10]. One widely used way to achieve this goal is to analyze non-accident information, such as near miss, and then use these findings to develop preventive measures to enhance navigational safety [11,12].
Ship navigation information provided by automatic identification system (AIS) data is widely used for ship collision analysis [13]. Various methods have been proposed to analyze near misses from historical AIS data. Generally, there are two different ways to understand and detect a near miss: the first way is using the nearness to an accident, while the second way is using the evasive action [14]. The first way, using the nearness to an accident, is more widely used—see [15,16,17,18,19,20,21,22], etc. Through this method, water traffic risk can be quantified based on the count or frequency of near miss. For example, the hotspots where the occurrence frequency of near misses is high can be identified [23]. However, the dynamic nature of ship behavior is often ignored by simplifying the encounter process. The widely adopted assumption that a ship maintains its course and speed under the threat of collision has been criticized in previous research studies [24,25]. Therefore, considering the dynamic nature of ship behavior helps improve the accuracy of near miss detection.
The second way measures the collision risk by obtaining insights into ship behavior characteristics during the process of collision avoidance. Statistical analysis reveals that ships prefer course alternation to prevent collision in actual operations [26]. The level of the course change varies with the risk severity. Navigators may conduct frenetic rudder actions in critical circumstances, such as the last moment before ship collision, to prevent collision [27,28,29,30]. However, regarding the non-normal maneuvers as the indicator of dangerous situations remains challenge. The rate of turn (ROT), which is utilized to reflect the collision risk in [27], is currently not a reliable parameter. One cause is that some maneuvers are carried out to follow the planned trajectory when reaching the turning points rather than to avoid collision [31]. Furthermore, some proactive navigators choose to adopt a milder maneuver in the early stages for safety, which cannot be detected by this ROT-based method. Therefore, the relationship between ship behavior and collision risk needs to be further clarified.
Moreover, these two above-mentioned ways of near miss detection still need to be strengthened in terms of the following aspects. First, traffic rules, such as International Regulations for Preventing Collisions at Sea (COLREGs) [32], have not been explained in detail. A ship has different action obligations at different encounter stages. The failure of undertaking her action responsibility has also been commonly understood as an important safety hazard in terms of ship accidents. For instance, in the early stages of collision risk, a stand-on ship changing its course and speed may cause other nearby ships to misunderstand its action intention, possibly generating a more serious encounter. However, these existing methods only utilize COLREGs to classify the encounter type into head-on, overtaking, and crossing encounters [16,18].
Second, the perceived risk of a navigator affects ships carrying out evasive maneuvers [33], while it is generally examined in modelling contexts. The concept of available maneuvering margins (AMMs), developed in [34,35], presents a ship’s capability to avoid ship collision. The AMM is adopted as a proxy for the navigator’s perceived risk when the ship starts to carry out an evasive maneuver [36]. If the ship acts earlier, it has more AMMs, leading to a higher probability to prevent the collision. However, collision risk is usually measured independently with the available maneuvering margin (AMM) of the ship, which may lead to inaccurate detection of the contextual risks [35]. Therefore, the AMM of a ship needs to be considered to reflect the perceived risk of a navigator for the detection of the near miss.
Third, these methods are mainly designed for measuring the collision risk of ship-pair encounter scenarios. The multi-vessel encounter is always divided into multiple ship pair encounters [37]. The multi-vessel encounter occurs frequently in dense water, such as in a port. Although nearby ships pose no direct threat to other ships, their existence may diminish their AMM. Moreover, complex traffic situations lead to more near misses [38], and they may also cause rule conflict where a ship is the stand-on ship (SO) and give-way ship (GW) simultaneously, which affects the navigator’s perceived risk. Therefore, a method of conducting collision risk analysis for multi-vessel encounters is needed.
The aim of this article is two-fold. First, this work proposes a novel method to detect near miss by linking ship behavior to collision risk. Near miss is defined as a possible collision if no ship takes proper evasive action. Ship behavior is affected by many factors, including the ship attributes (including ship size, type, and maneuverability), COLREGs, perceived risk of a navigator, and traffic complexity. Second, this proposed method is then applied to detect near miss in the Northern Baltic Sea. Through this work, we can identify the hotspot areas that are highly dangerous water areas in the Northern Baltic Sea. This work contributes to maritime traffic management, such as the determination of precaution areas to reduce the ship collision probability.
The remainder of this work is arranged as follows: Section 2 elaborates on the mathematical methodology adopted to detect near misses; then this proposed method is applied to water traffic in the Northern Baltic Sea area, and model evaluation tests are performed to assess the model’s performance in Section 3; a discussion and some recommendations for future research are provided in Section 4; Section 5 concludes.

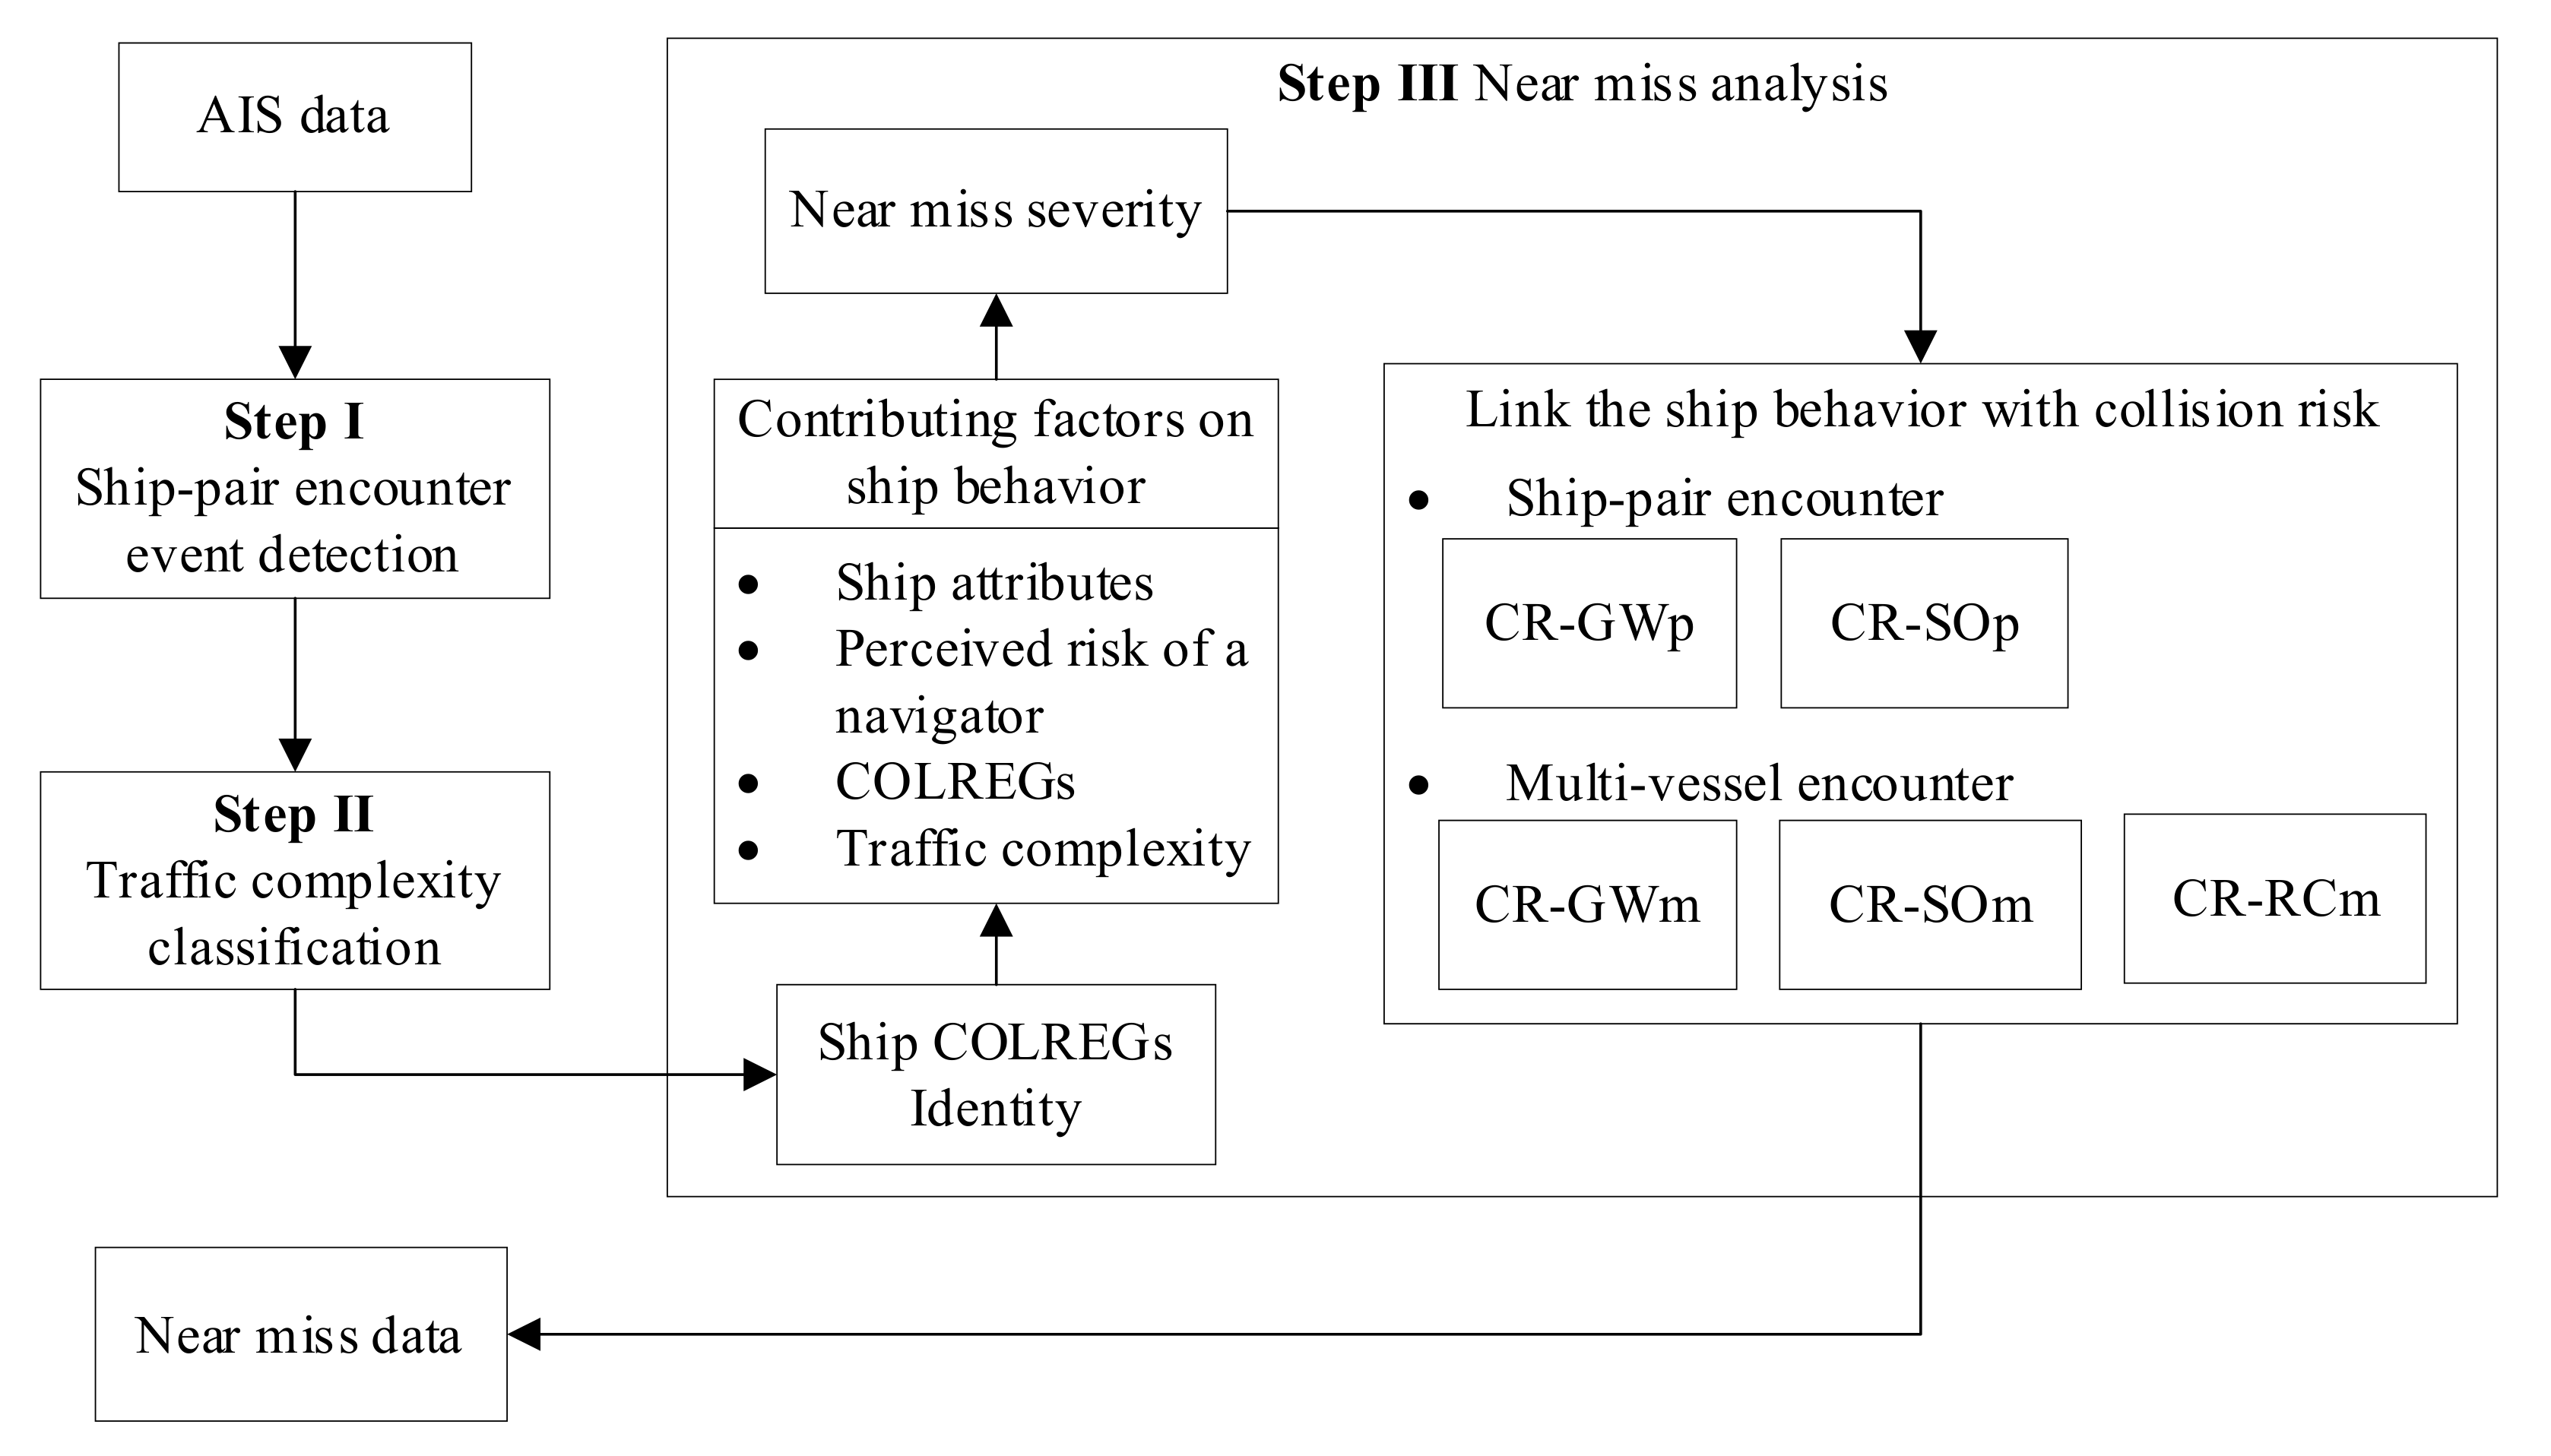
2. Materials and Methods

When a ship maneuvers for collision avoidance, its behavior is affected by its attributes, COLREGs, human factor, and traffic condition. To accurately link ship behavior to the corresponding collision risk, we consider the impact of ship attributes on ship behavior, the perceived risk by a navigator, ship action obligations at different stages as specified in COLREGs, and the complexity of the local traffic situation in the multi-vessel encounter scenarios.
The framework of near miss detection by linking ship behavior with collision risk is illustrated in Figure 1. The input is historical AIS data of the ship. The output is the detected near miss with different risk levels, through the following three main steps: ship pair encounter event (SPEE) detection (Step I), traffic complexity classification (Step II), and near miss analysis (Step III). Step III is the core part. These three main steps are elaborated in Section 2.1, Section 2.2 and Section 2.3, respectively.
When a ship pair is found to have possible danger, the near miss detection is activated at every time step. First, the sailing information for this ship pair is collected (Step I). Second, the surrounding traffic situation at this moment is checked to find whether there are other ships nearby (Step II). If there are other ships nearby, the sailing information for those ships is also collected. This sailing information includes ship size, type, longitude, latitude, speed, course, and heading.
Third, Step III is stimulated to analyze the near miss.
The ship COLREGs identity, such as give-way ship (GW) or stand-on ship (SO), is determined based on their relative bearing (RB) and relative heading (RH) at the moment when the collision risk occurs [36,37,39]. Four contributing factors are considered to determine the criteria of ranking the risk severity of the near miss. Based on this, the link between ship behavior and collision risk for each ship of this ship pair is then established with the following steps:
If it is a ship pair encounter, for a GW, the collision risk module for a GW (CR-GWp) is triggered. For a SO, the collision risk module for a SO (CR-SOp) is triggered.
If it is a multi-vessel encounter, it is determined whether or not the rule conflict exists. Rule conflict is where a ship is the SO and GW simultaneously.
If no rule conflict exits, the collision risk module for a GW (CR-GWm) is triggered. For a SO, the collision risk module for a SO (CR-SOm) is triggered.
If rule conflict exits, the collision risk module for a ship in the multi-vessel encounter scenario (CR-RCm) is triggered.
Finally, the collision risk of each ship of this ship pair ( C R S P E E ) at every time step is analyzed. The designed algorithm of the near miss detection is elaborated in Figure 2. These collision risk analysis modules, including CR-GWp, CR-SOp, CR-GWm, CR-SOm, and CR-RCm, are elaborated in Section 2.3.

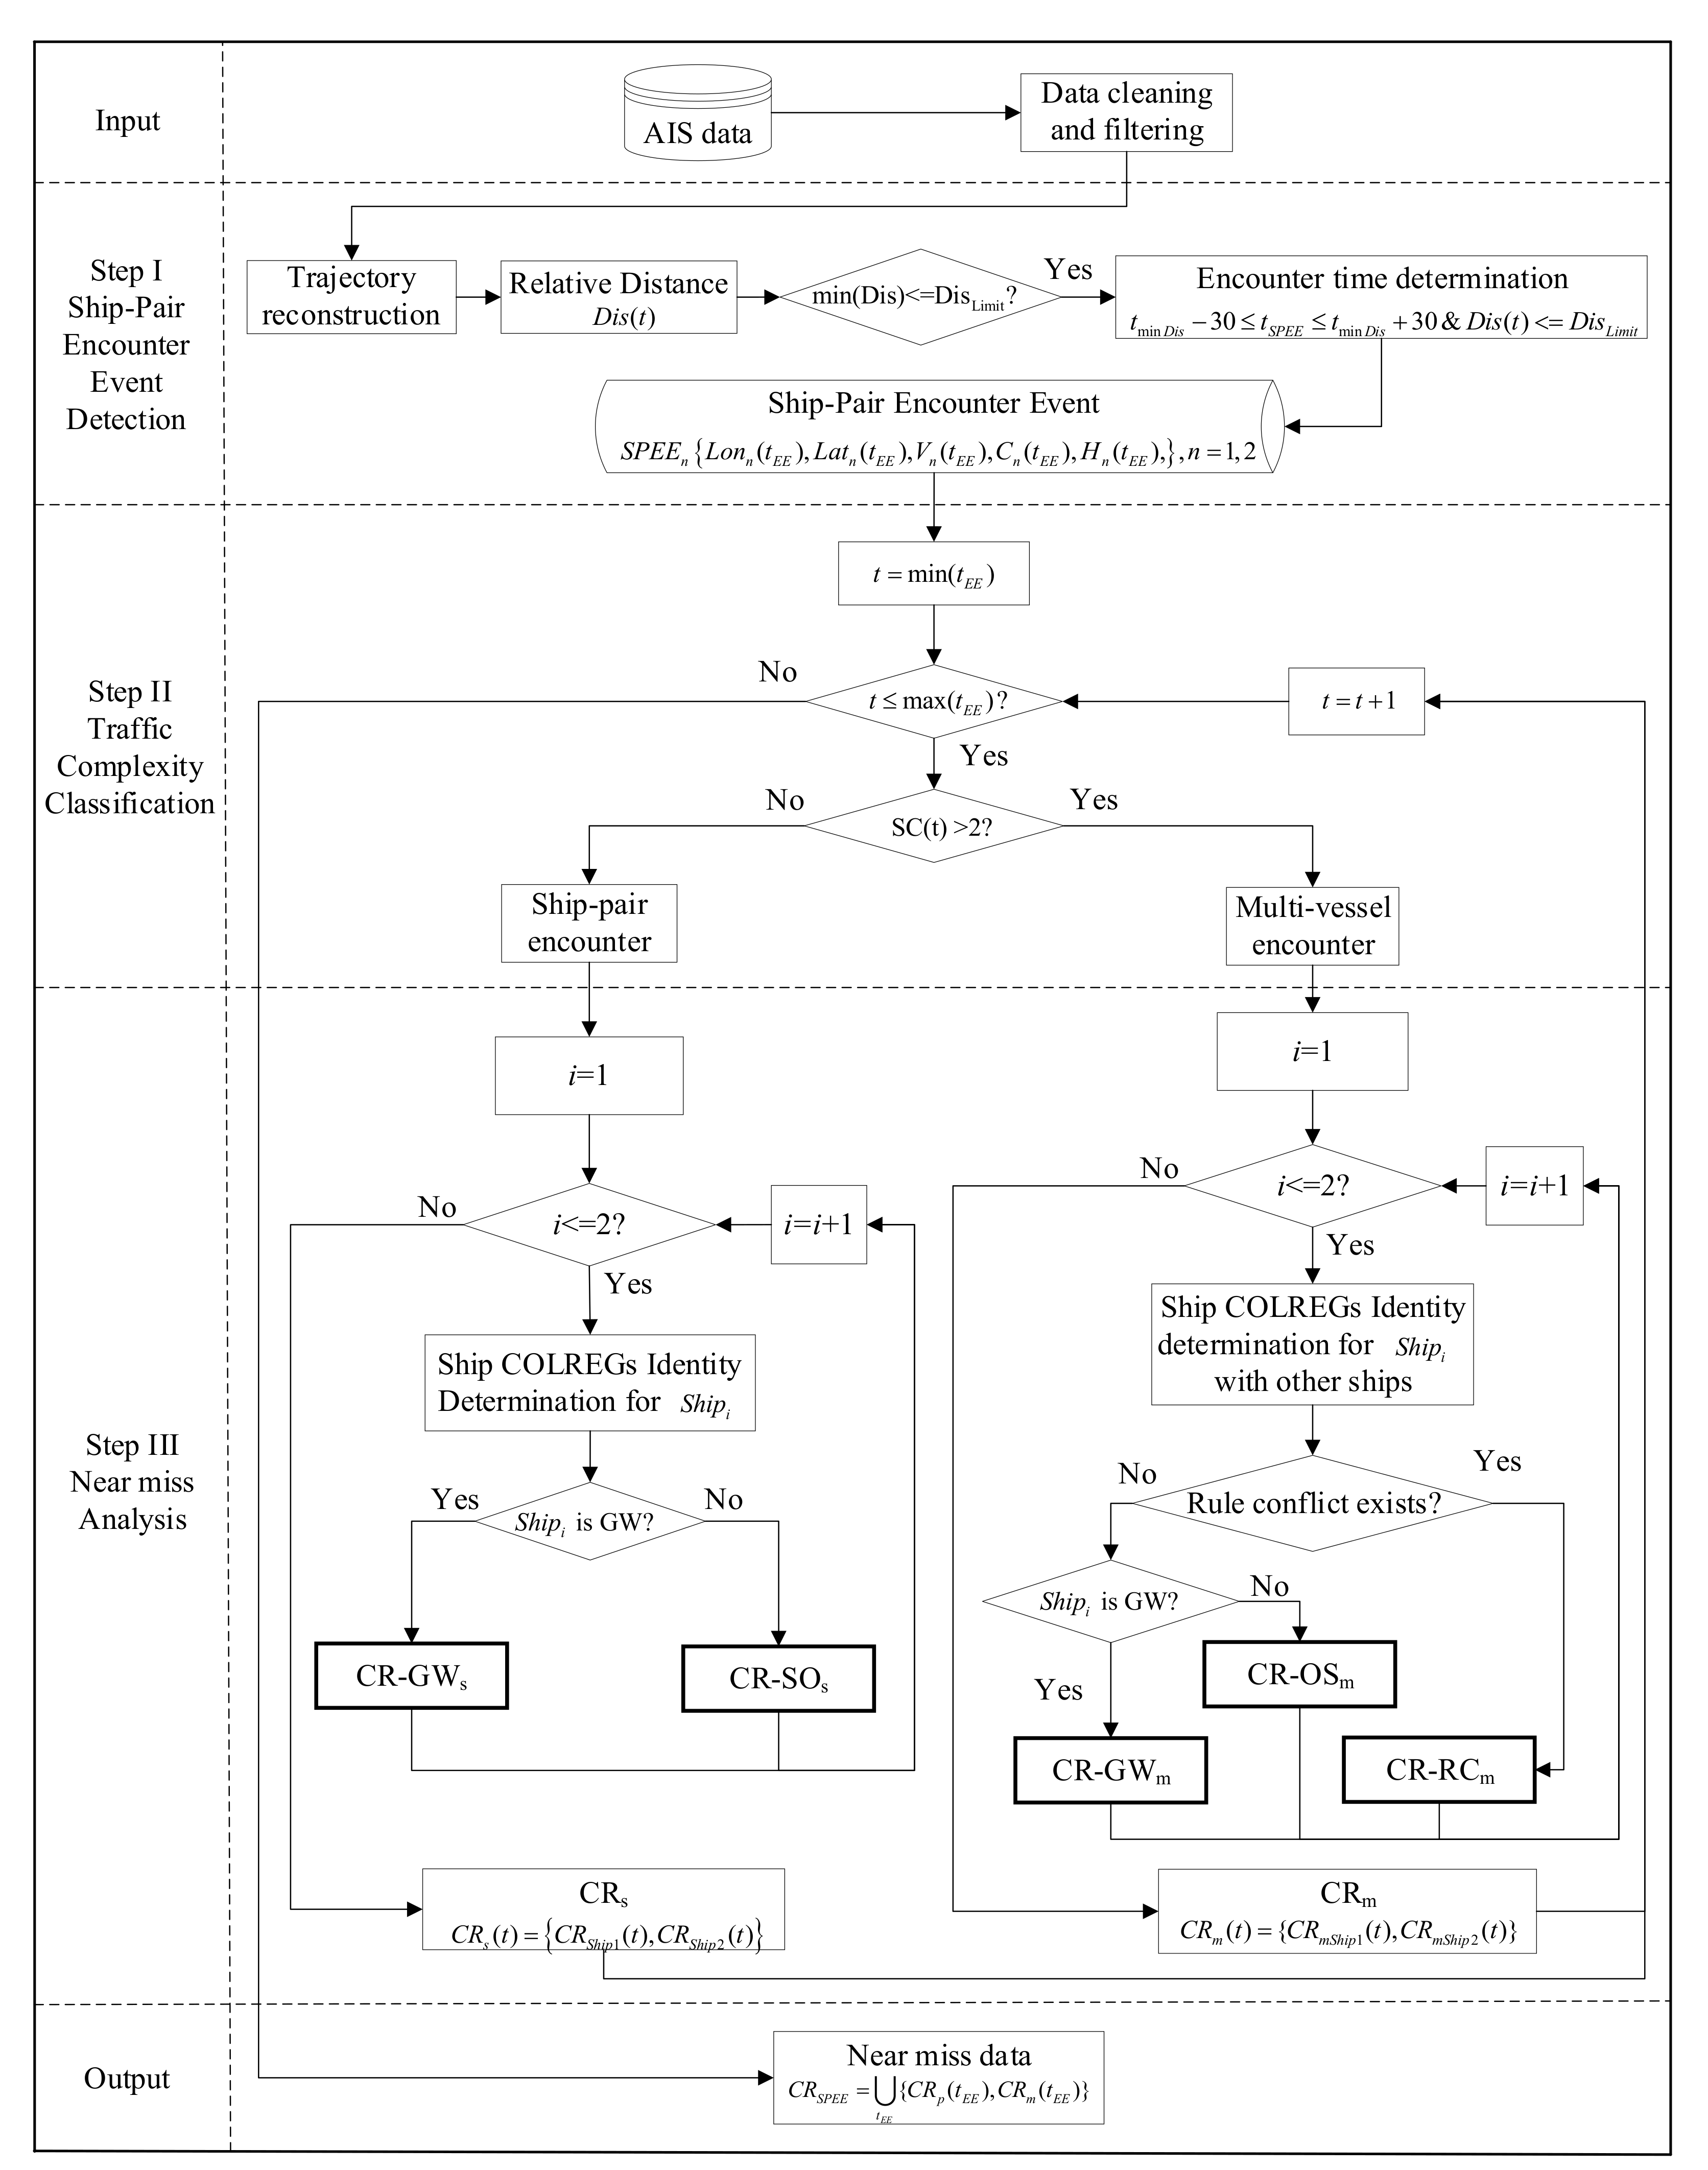
2.1. Step I: Ship Pair Encounter Event Detection

The analysis of the near miss from the perspective of a ship pair encounter as a process helps to detect the contextual risks [24]. Therefore, the concept of a ship pair encounter event (SPEE) is employed to denote the process of an encounter between a ship pair within a specified time period t S P E E [36]. The sailing information of one ship in one SPEE is expressed as S P E E ( t S P E E ) = L o n ( t S P E E ) , L a t ( t S P E E ) , V ( t S P E E ) , C ( t S P E E ) , H ( t S P E E ) . L o n (°) and L a t (°) are the longitude and latitude, respectively. V (kn) is the ship speed. C (°) is the ship course. H (°) is the ship heading. For the coordinate system of measuring the C and H , the north is 0 ° , and the C and H increase in a clockwise direction.
There are four steps to detect an SPEE from raw AIS data—see Step I in Figure 2. First is the extraction of the sailing information of each ship from the raw AIS data and deletion of some error. Second is the reconstruction of the ship trajectory based on the linear interpolation and the time step is 1 min. These first two steps are not the focus of this work. The AIS adopted in this work is the same as those in [12,19], which have been processed to remain in good quality. Third is the identification of two ships encountering each other. The targeted ship pair is a ship pair whose minimum relative distance is less than the distance limit D i s L i m i t . D i s L i m i t is set as 12 nm as it is the normal radar range setting [40]. The other ships in the circular area around this ship with a radius of 12 nm are equally important when determining the potential targets. Last is the determination of time period t S P E E , which is limited by the moment of the closet point of approach (CPA) ( t min D i s ) and D i s L i m i t . More information can be found in [36].

2.2. Step II: Traffic Complexity Classification

Traffic complexity classification is used to distinguish the ship pair encounter from the multi-vessel encounter. This can be identified from the ship count (SC)—see Step II in Figure 2. If S C > 2 , then this is a ship pair encounter. If S C = 2 , then it is a multi-ship encounter. This step is important, as rule conflict occurs only in multi-vessel encounter scenarios.

2.3. Step III: Near Miss Analysis

2.3.1. Ship COLREGs Identity

Ship COLREGs identity includes GW and SO. Ship COLREGs identity can be classified when the collision risk exists in good visibility [32]. The visibility in the summertime in the Northern Baltic Sea is assumed to be good [1,41]. Ship COLREGs identity is determined when the collision risk between the ship pair exists. The non-linear velocity obstacle (NLVO) algorithm is employed to detect the collision risk, which considers the dynamic nature of ship action during the whole encounter process [42]. When the collision risk is detected, the ship COLREGs identity is determined based on their RB and RH at this moment [36,37,39]. The RB and RH can be calculated based on the heading and course of each ship that is recorded in AIS data.

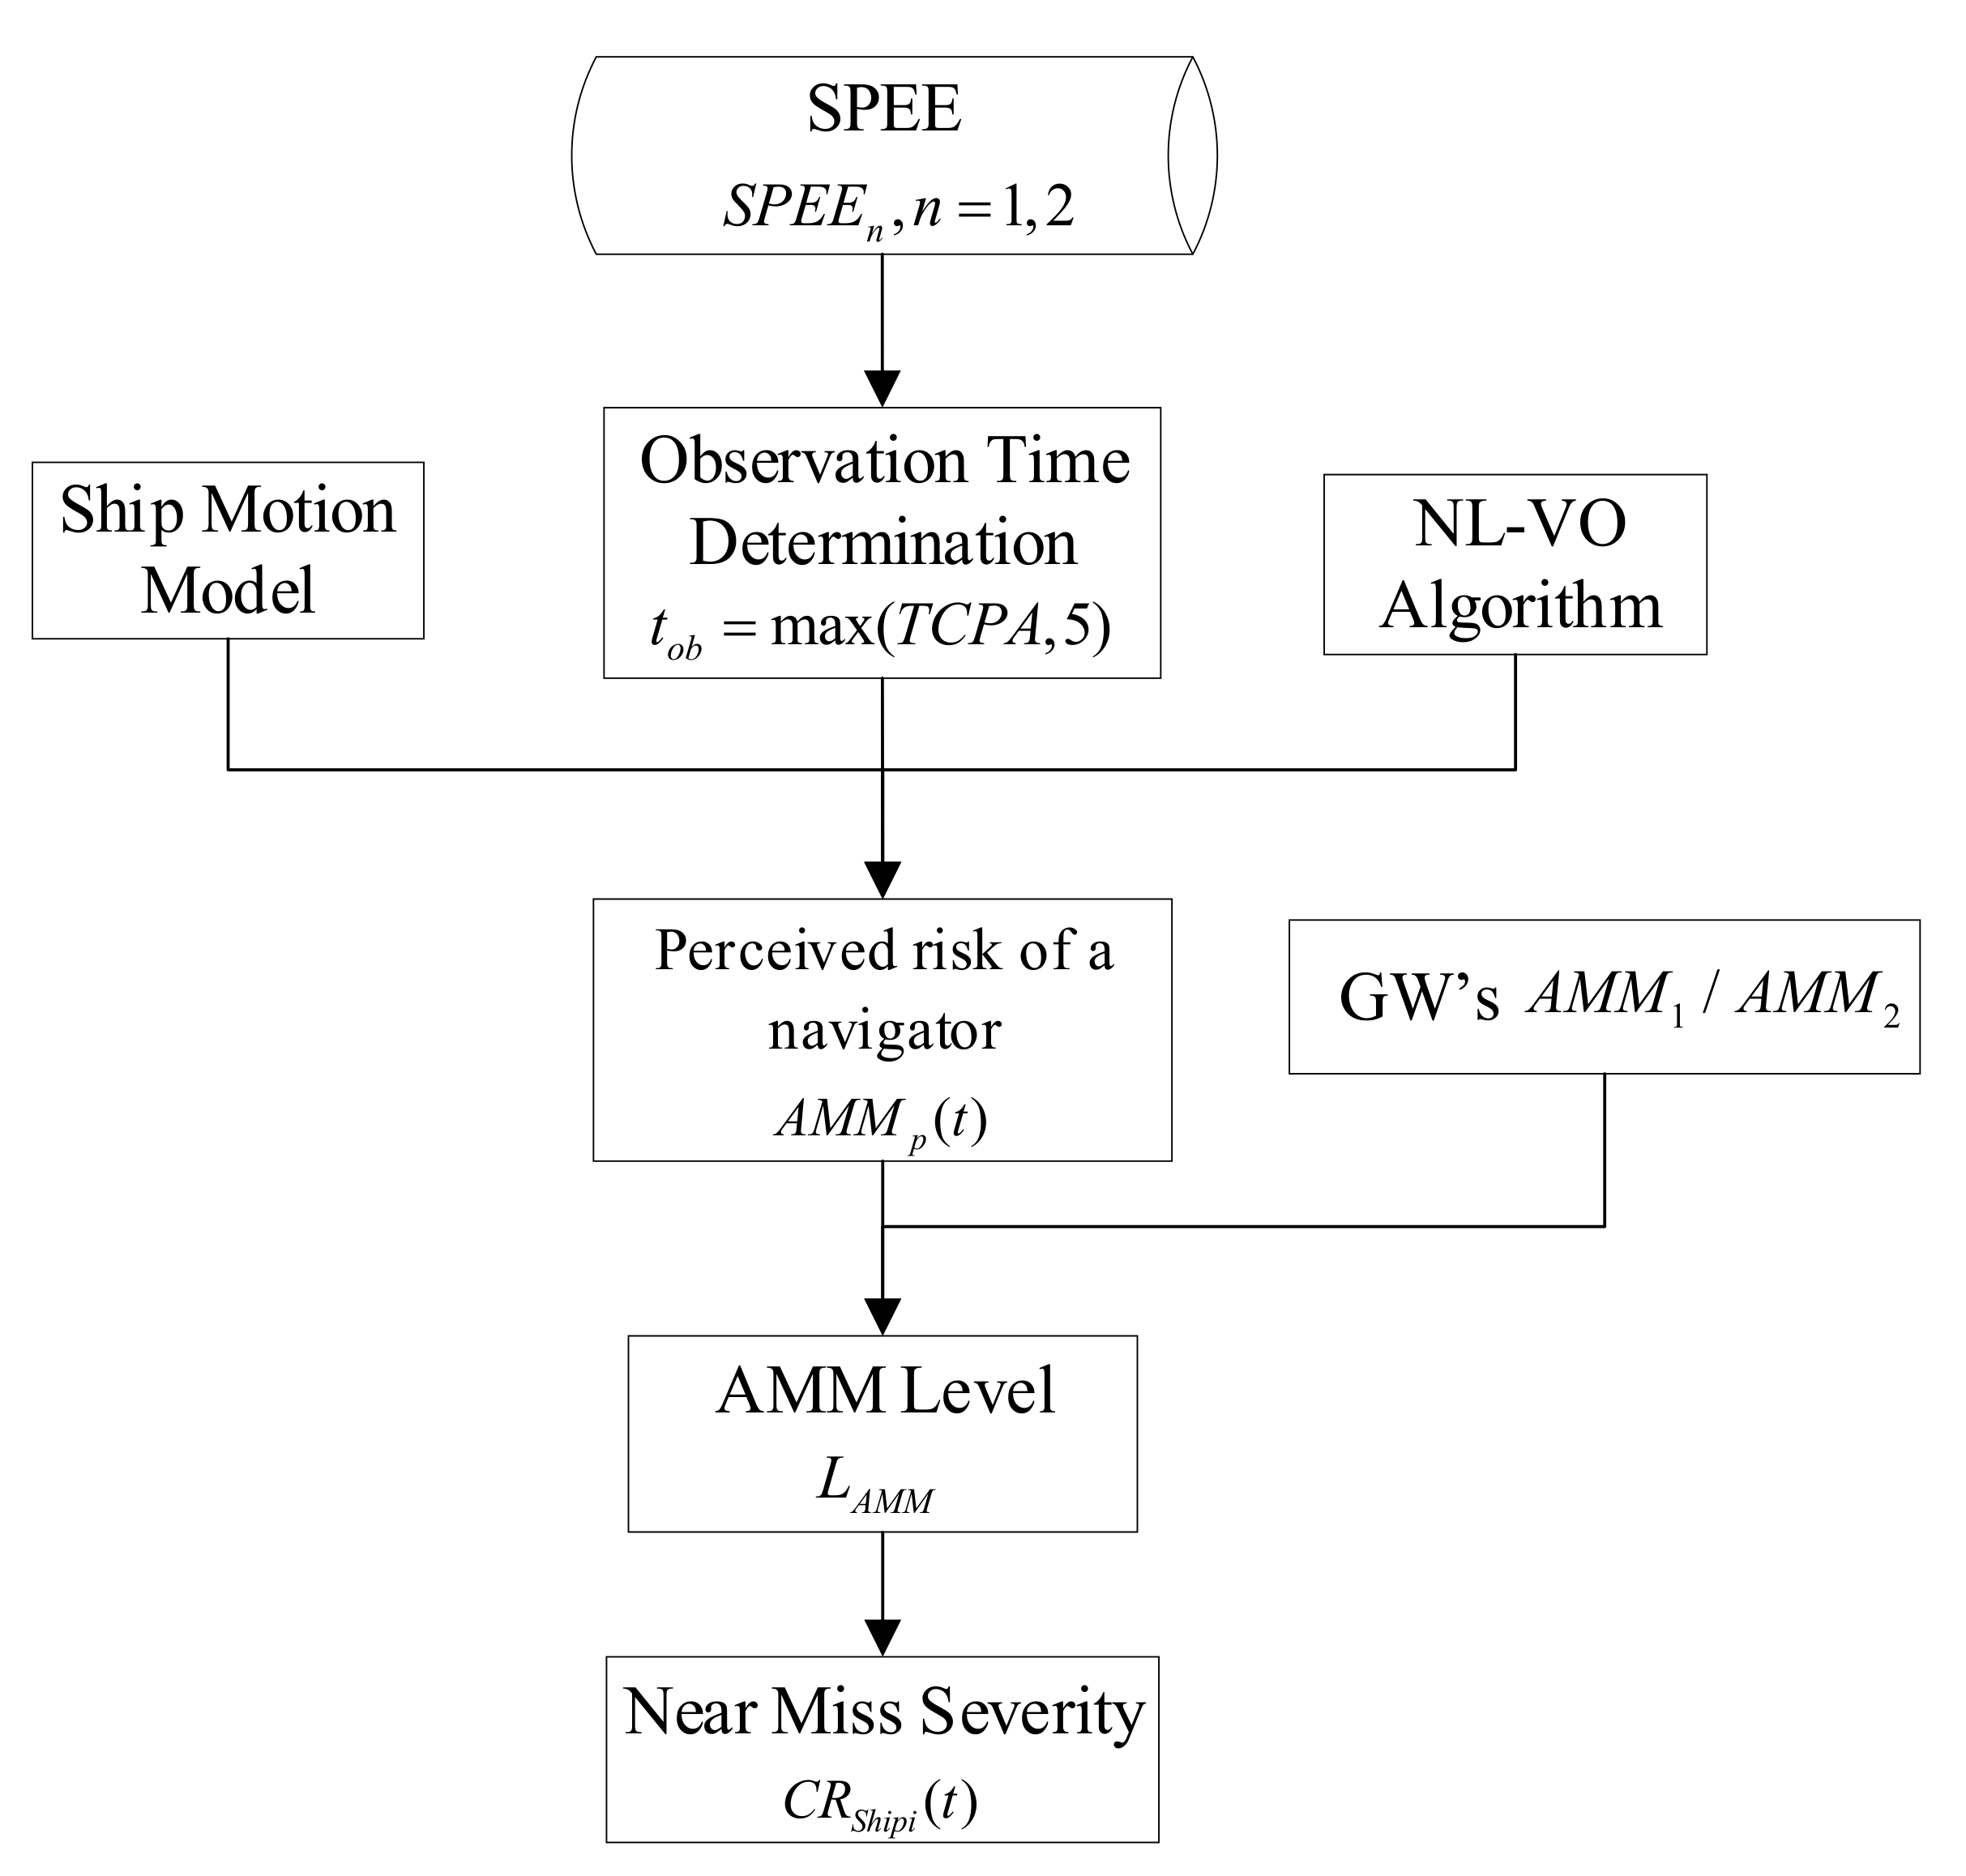
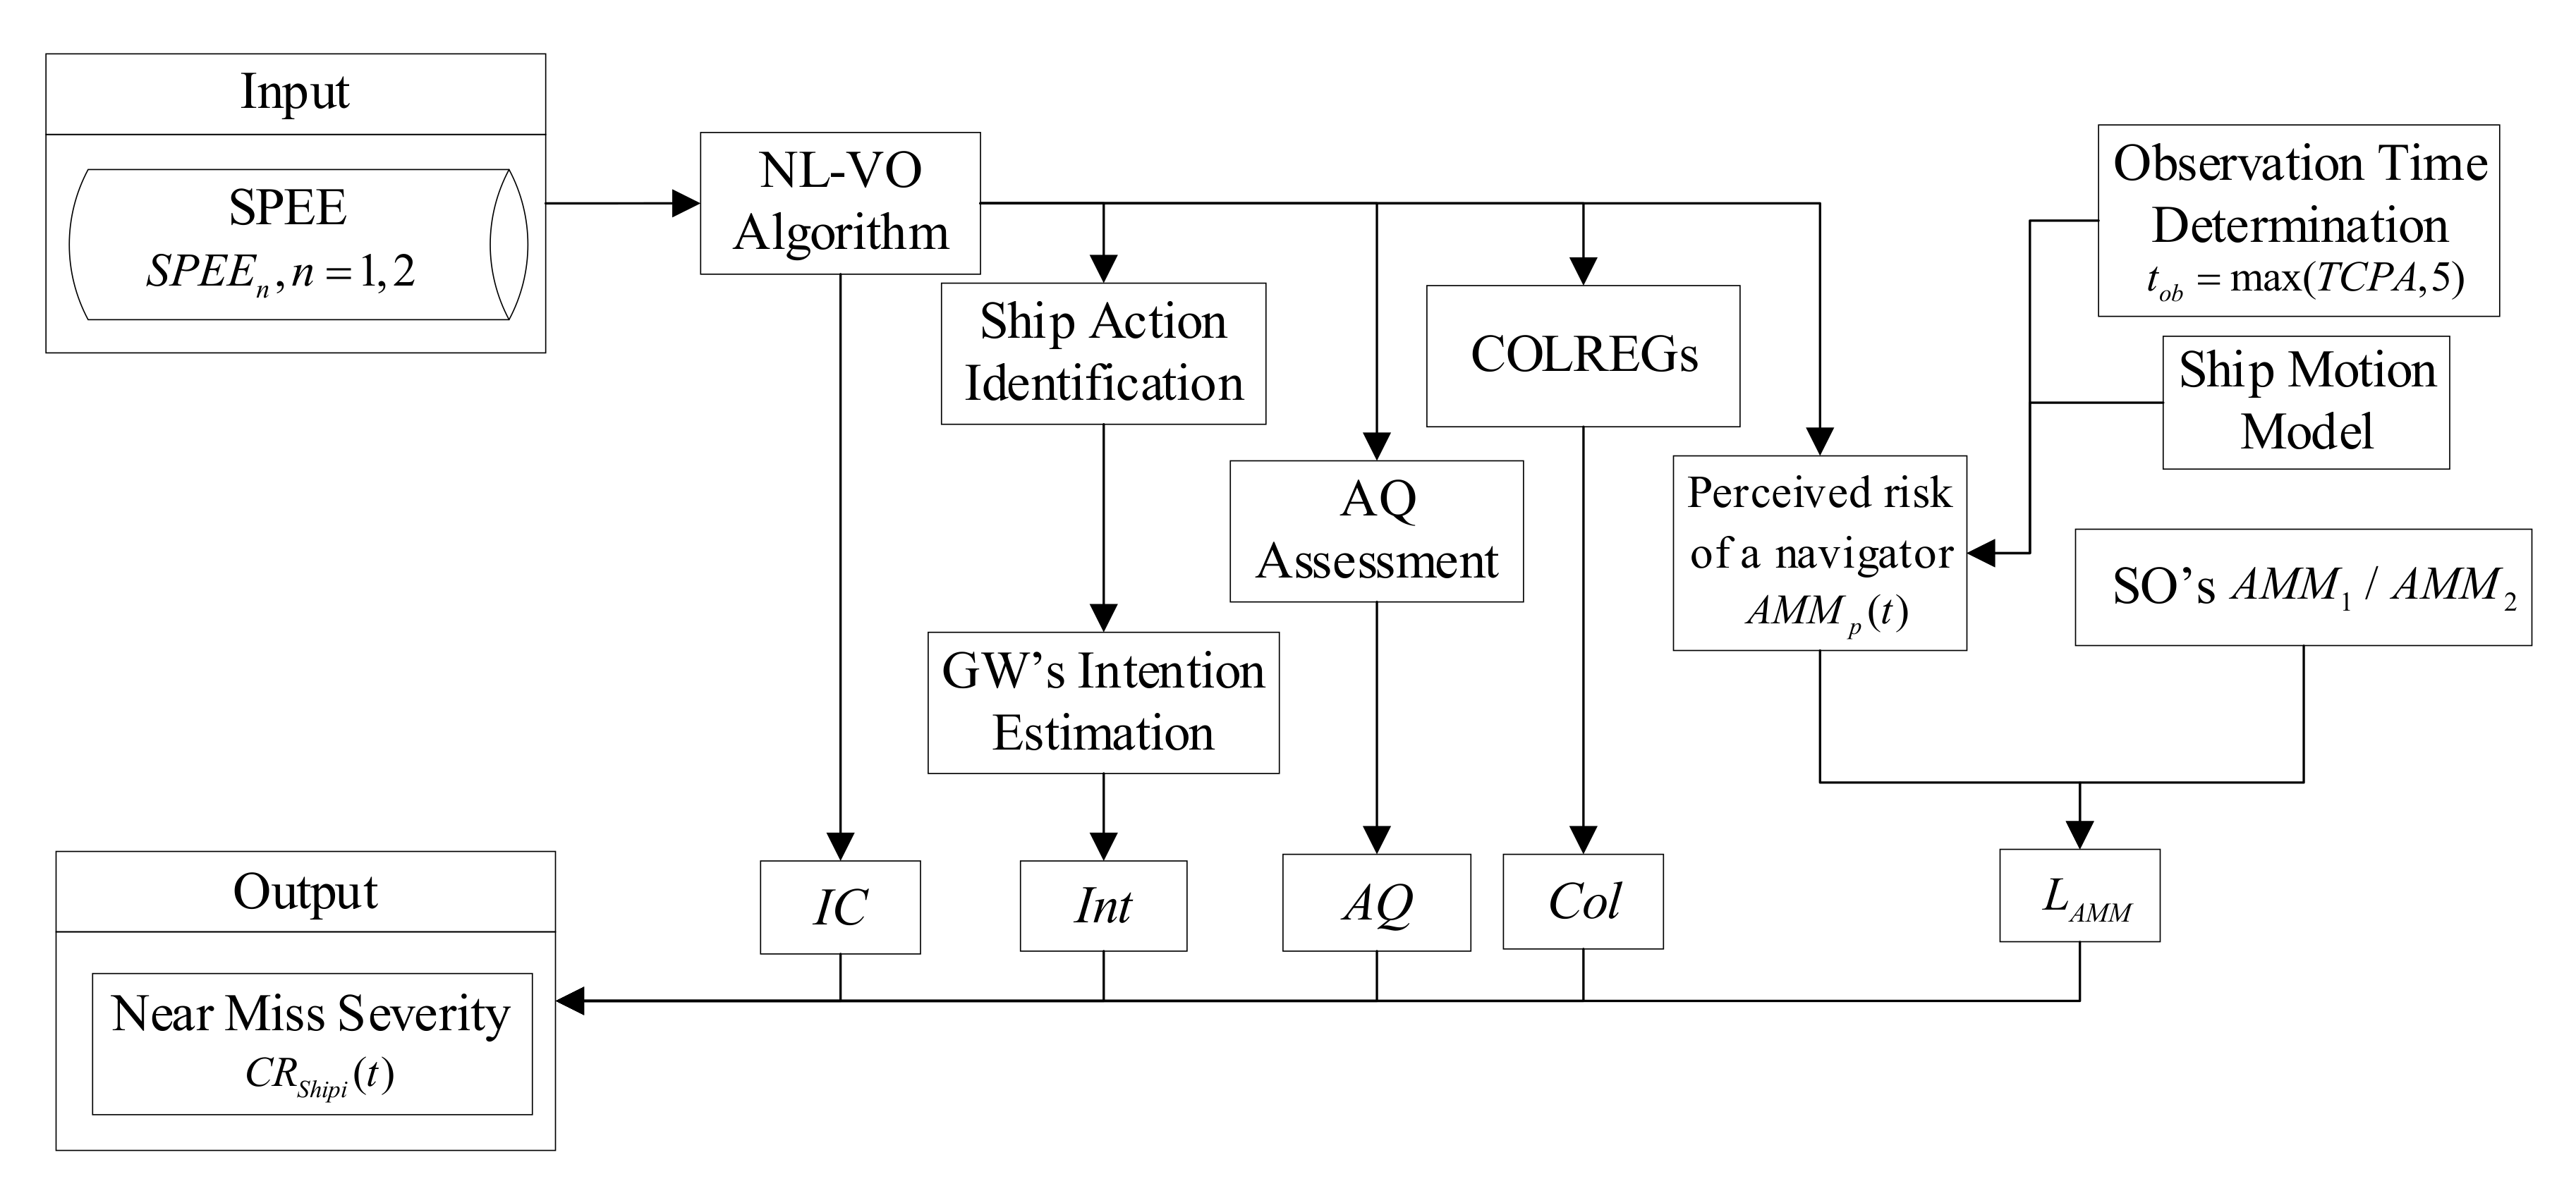
2.3.2. Near Miss Severity

In accordance with the alert management in the International Maritime Organization (IMO) [43], the severity of near miss is divided into four levels: safe, low risk, medium risk, and high risk—see Table 1.

Near Miss Severity of a GW

For a GW, the severity of near miss is quantitatively divided based on the perceived risk of a navigator. The AMM is adopted as a proxy for the navigator’s perceived risk when the ship starts to carry out an evasive maneuver [36]. The AMM is divided into three levels based on the characteristic of the ship taking the evasive action.
L A M M = H , i f   A M M A M M 1 M , o t h e r w i s e L , i f   A M M < A M M 2 ,
where L A M M is the level of the AMM. The upper limit of the AMM ( A M M 1 ) represents the fact that 90% of the ship starts to carry out an evasive action before its AMM drops to this. The lower limit of the AMM ( A M M 2 ) means that 99% of the ship starts an evasive action with a higher AMM than this. A M M 1 and A M M 2 for different ships with different sizes and COLREGs identity are listed in Table 2, which are derived from the actual encounters based on the method proposed in [36]. The small-sized ships have a length of less than 100 m; the length of the medium-sized ships ranges from 100 m to 200 m; the remaining ships large-sized ships (above 200 m).
The criteria for the severity of near miss divided into four levels from the perspective of the GW are presented in Table 1. The various colors represent the different severities of near miss. No risk is marked as green. Low, medium, and high risk are marked as yellow, orange, and red, respectively. For instance, for a GW, when a collision risk exists (IC = 1) and the L A M M of the GW is high ( L A M M = H), it is low risk.

Near Miss Severity of a SO

For a SO, the severity of near miss is quantified by employing the following five indicators [34]: (1) Conflict index IC. (2) Ship action intention index Int. (3) Ship action quality index AQ. (4) The index of ship risk resolution L A M M . Similarly, the AMM of SO is also divided into three levels ( L A M M ) based on the work conducted by Du et al. [36]—see Table 2. (5) COLREGs scrutiny index Col.
The criteria for the severity of near miss divided into four levels from the SO perspective are presented in Table 1. For instance, for a SO, if collision risk exists (IC = 1), the GW takes evasive action (Int = 1), but it is not sufficient to avoid collision (AQ = −1), the LAMM of the SO is high ( L A M M = H), and the GW’s evasive action complies with COLREGs (Col = 1), then the risk is medium.
Moreover, collision risk increases with traffic complexity, and traffic complexity depends on the ship counts [38]. The methods for ranking the severity of the near miss in the ship pair encounter and the multi-vessel encounter are designed in Section 2.3.3 and Section 2.3.4, respectively.

2.3.3. Near Miss Analysis in the Ship Pair Encounter Scenario

Near Miss Severity of a GW in the Ship Pair Encounter Scenario

In the ship pair encounter, the CR-GWp module is designed for a GW to assess collision risk (Figure 3). There are two main steps: first is the determination of L A M M based on the GW’s AMM ( A M M p ); second is to determine its risk severity in accordance with the criteria as specified in Table 1.
The AMM of a ship is measured as the proportion of maneuvers by which the ship can eliminate danger to all its available maneuvers [35]. Combined with the ship motion model and the NLVO algorithm, the GW’s AMM ( A M M p ) can be calculated as follows [36]:
A M M p ( t ) = δ s ( t ) δ a ( t ) ,   i f   V ( t ) R V ( δ s ( t ) , t o b ) : V ( t ) S N L _ V O ( t ) = ϕ t o b = max ( T C P A , 5 ) ,
where δ s is the value of the adopted rudder angle that can eliminate the potential danger. The near miss can be eliminated if this maneuver with the adopted rudder angle can move the current velocity ( V ( t ) ) out the velocity obstacle zone ( S N L _ V O ) within the observation time ( t o b ). R V ( δ s ( t ) , t o b ) is the reachable velocity of the ship after steering with a demanded rudder angle δ s within t o b . In this work, the Nomoto model is employed to calculate R V ( δ s ( t ) , t o b ) . δ a is the total available rudder angle. The time to closest point of approach (TCPA), is utilized to determine the observation time t o b . The minimum value of t o b is set as 5 min to ensure that the observation time is sufficient [36].

Near Miss Severity of a SO in the Ship pair Encounter Scenario

In the ship pair encounter, CR-Sop is designed for a SO to assess collision risk (Figure 4). The purpose of the CR-SOp module is to obtain five indicators (IC, Int, AQ, Col, and L A M M ) and link them with the classification criteria (Table 1) to determine the severity of near miss.
IC is determined based on the NLVO algorithm [42]. The ship intention estimation method proposed in [31], based on the combination of the NLVO algorithm and Douglas–Peucker algorithm (DP algorithm) [44], is utilized to determine Int. AQ assessment is conducted to classify the AQ into 1 or −1 [34]. The Rules 12, 15, 17, and 18 in COLREGs are scrutinized to determine the C o l [34]. L A M M is determined based on Formulas (1) and (2) [36].

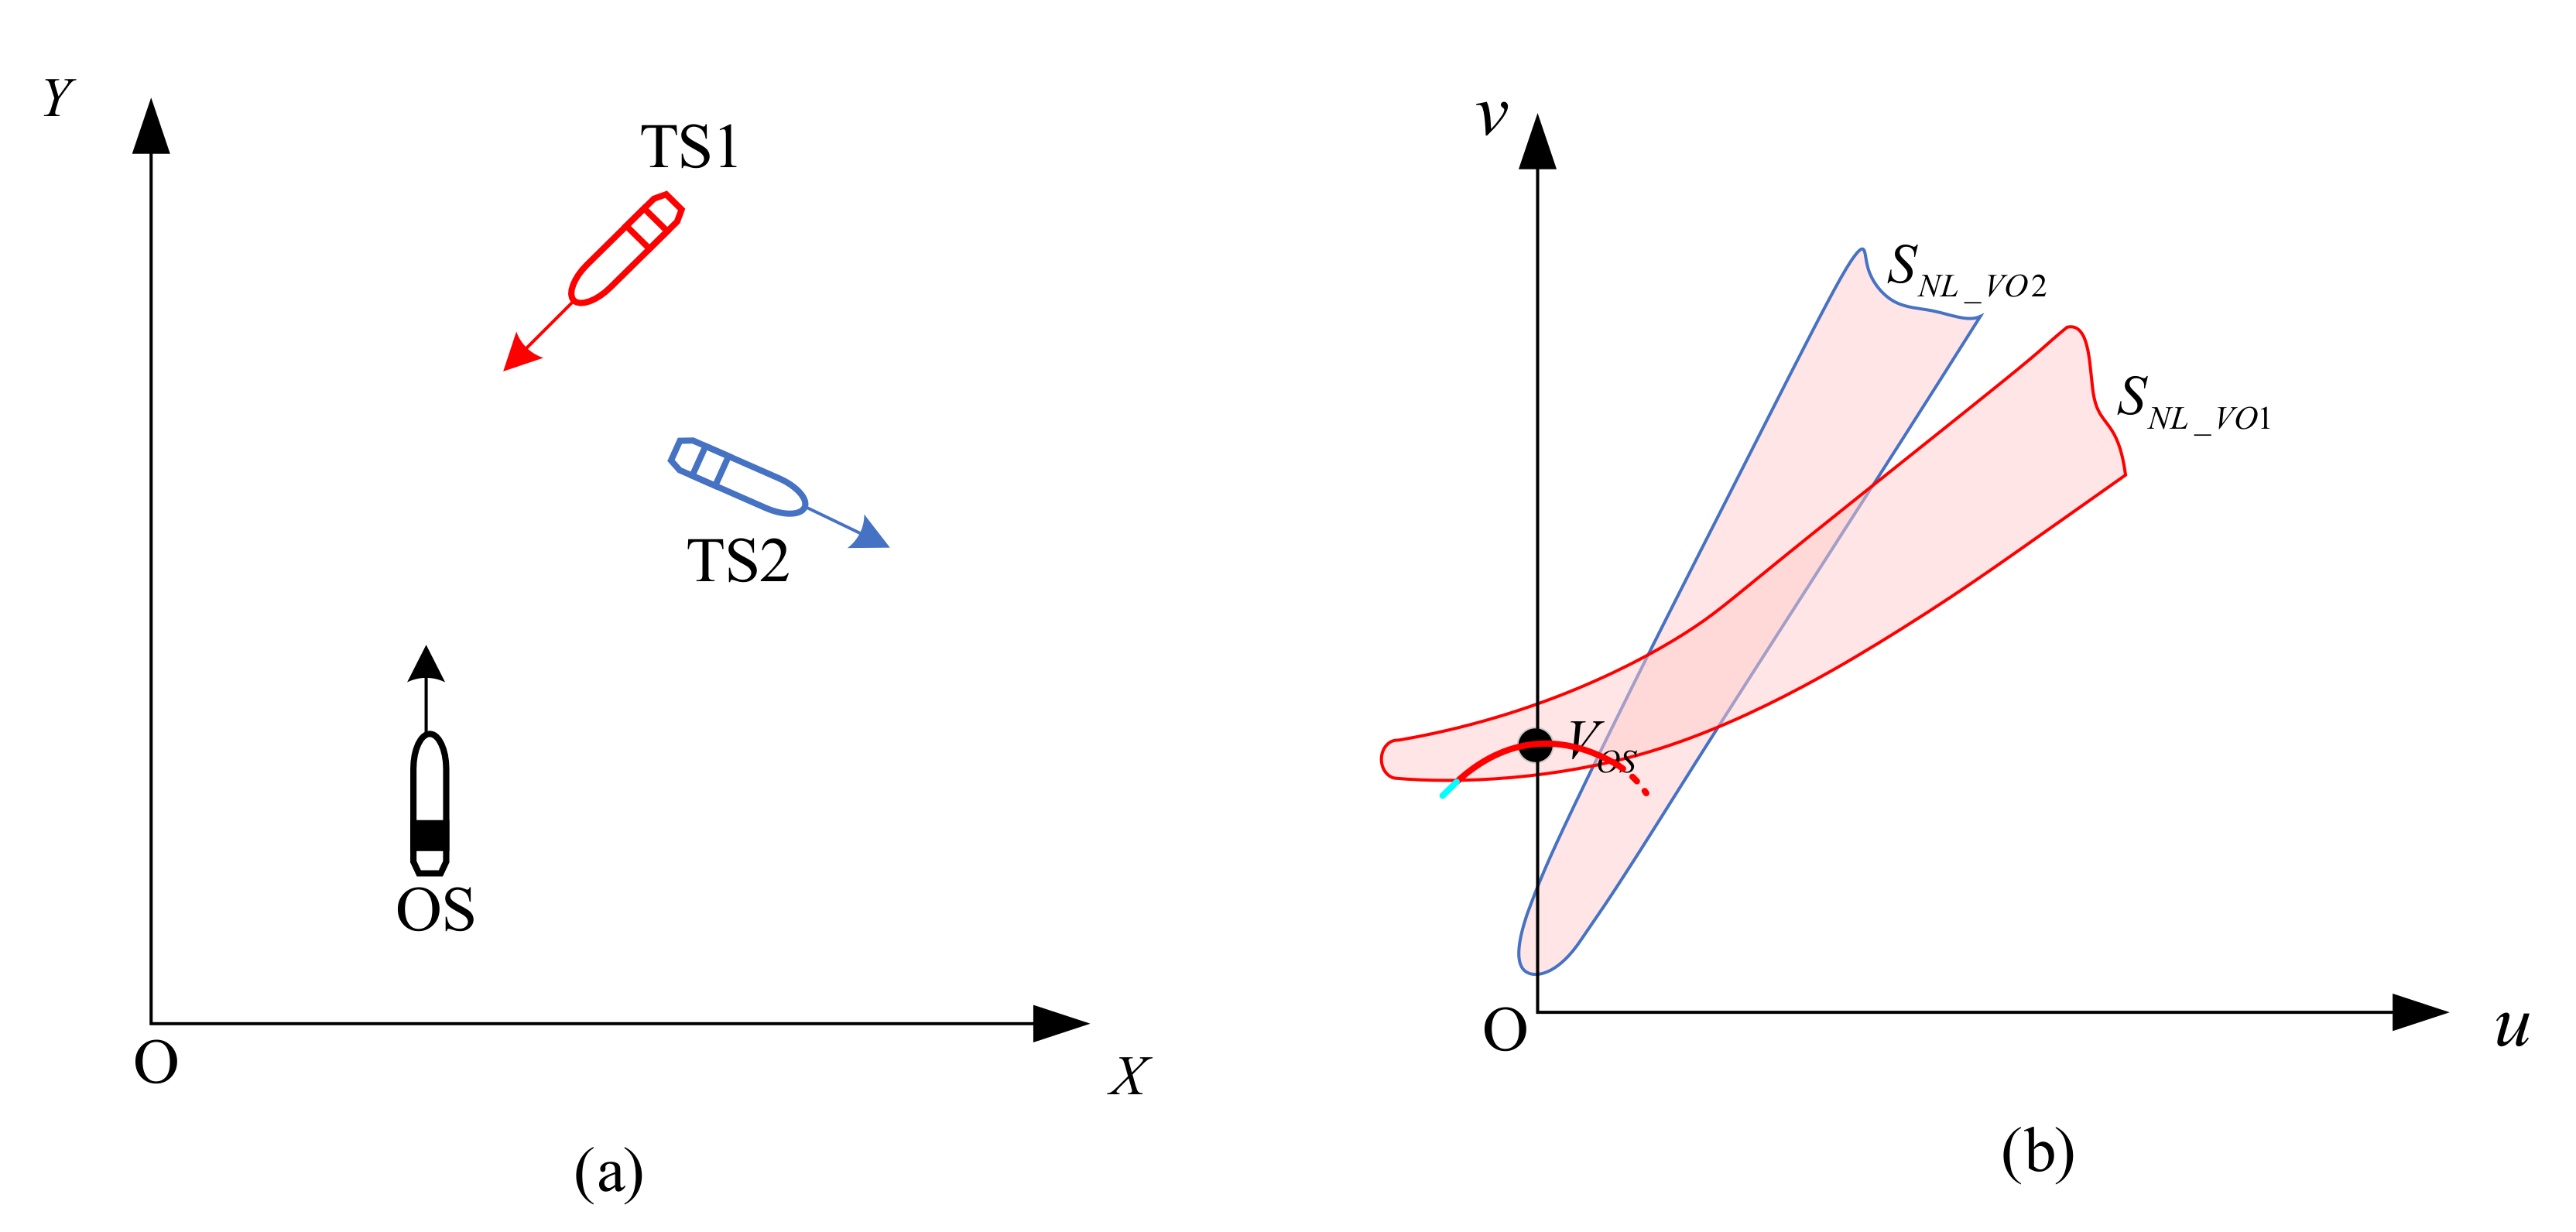
2.3.4. Near Miss Analysis in the Multi-Vessel Encounter Scenario

Traffic complexity provides assistance in measuring the difficulty and effort required for safe maritime transportation. Traffic complexity can be assessed in terms of ship maneuverability, expressed in a solution space for each ship [38], applying knowledge from the aviation domain [45]. Figure 5 illustrates that in the multi-vessel encounter scenario, with more ships nearby, a ship’s resolution space decreases due to the traffic complexity, and, consequently, there are fewer opportunities to prevent the collision. The own ship (OS) is marked in black. There are two target ships (TS) nearby, one target ship (TS1) marked in red and another target ship (TS2) marked in blue. Figure 5a,b present this multi-vessel encounter in geographical space and velocity space, respectively. Figure 5b demonstrates that the collision risk exists only between the OS and TS1 because the speed of the OS is only inside TS1′s velocity obstacle zone. However, the existence of TS2 decreases the OS’s resolution space. In Figure 5b, the arc line represents all available maneuvers of the OS. Although some maneuvers of the OS, indicated by the dotted line at the right end of the arc, resolve the collision risk between the OS and TS1, these maneuvers generate a new danger between the OS and TS2. Therefore, only the maneuvers of the OS, marked in green at the left end of the arc, can ensure the OS’s safety.
Therefore, with the impact of traffic complexity on the risk resolution of a considered ship, the AMM of the ship in the multi-vessel encounter scenario ( A M M m ) is modified based on Formula (2):
A M M m ( t ) = δ s ( t ) δ a ( t ) ,   i f   V ( t ) R V ( δ s ( t ) , t o b ) : V ( t ) S N L _ V O ( t ) = ϕ t o b = max ( T C P A j , 5 ) , j = 1 , 2 , , S C + 1 ,
where S N L _ V O ( t ) is the union of the velocity obstacle zone of all the surrounding ships—see the area marked in red in Figure 5b. Compared with Formula (2), the near miss can be eliminated if this maneuver with the adopted rudder angle can move the current velocity ( V ( t ) ) out the S N L _ V O ( t ) within t o b . T C P A j is the TCPA between the OS and all other surrounding ships. S C is the ship count of intrusive ships. Other symbols are the same as those in Formula (2).

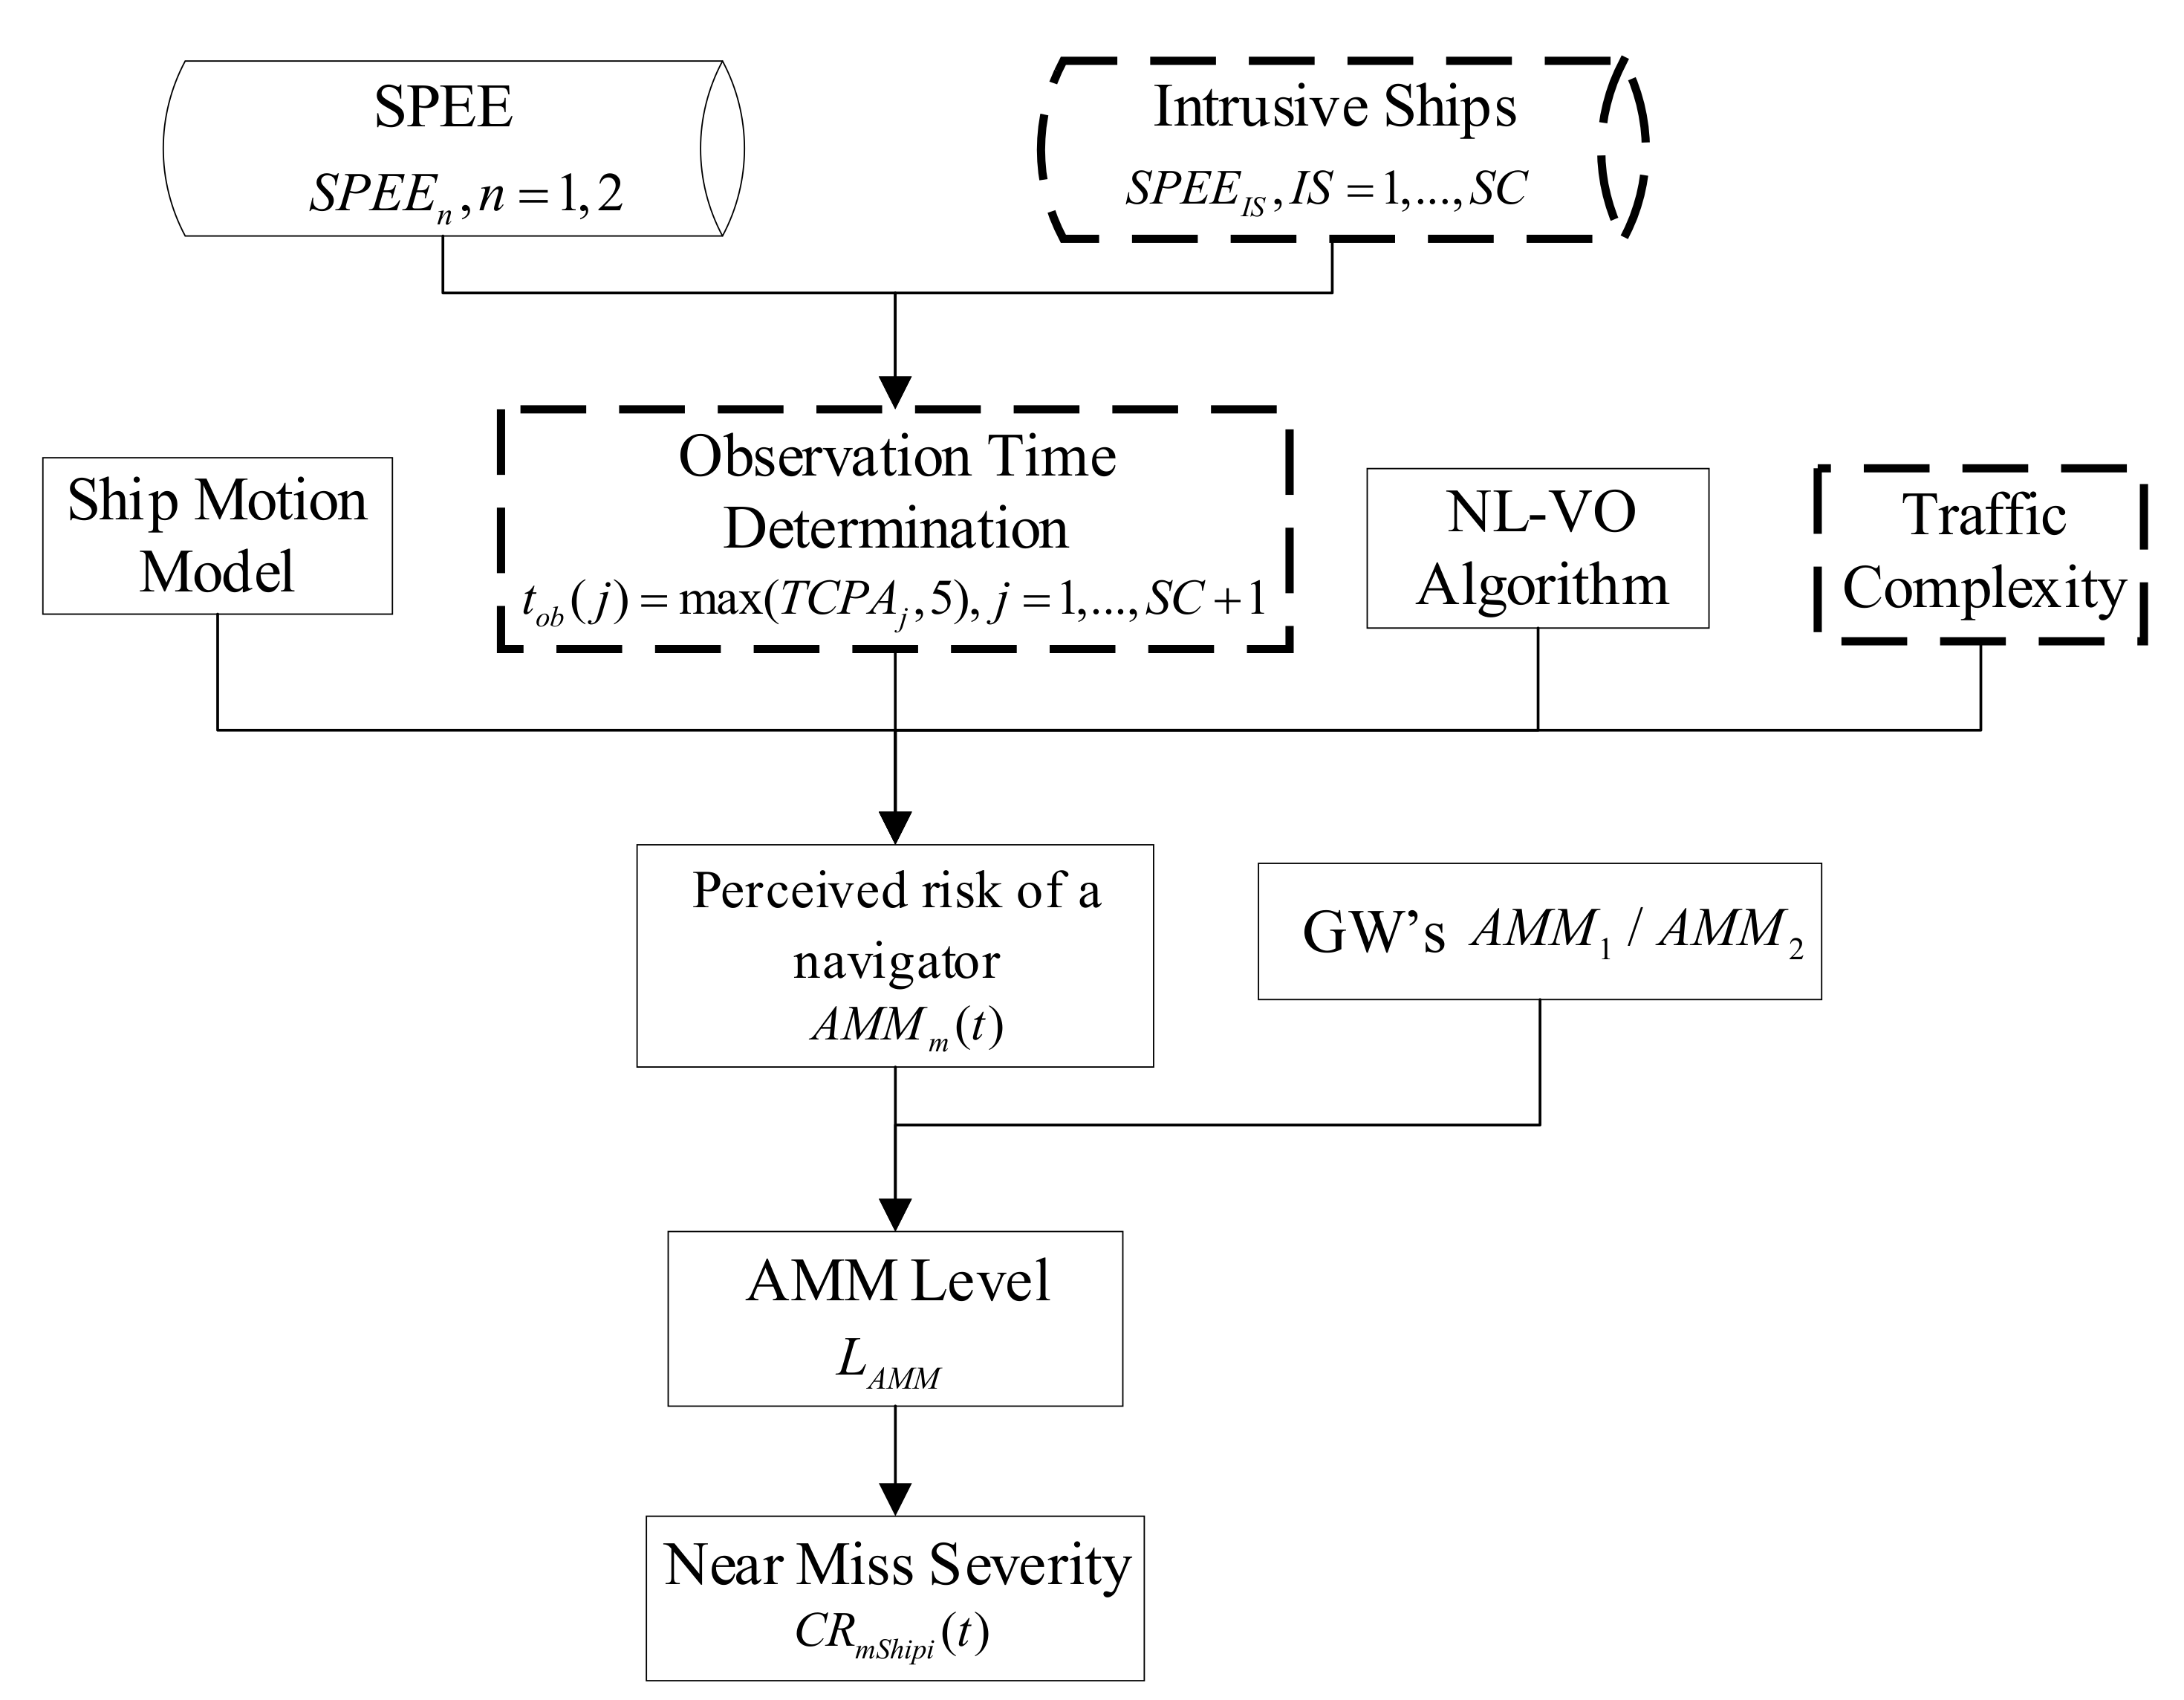
Near Miss Severity of a GW in the Multi-Vessel Encounter Scenario with No Rule Conflict

In the multi-vessel encounter scenario with no rule conflict, the CR-GWm module is designed for a GW to measure the severity of near miss—see Figure 6. Similar with CR-GWp in Figure 3, there are two main steps: (1) the calculation of GW’s perceived risk ( A M M m ) based on the Formula (3) to determine the L A M M ; (2) the link L A M M with the criteria listed in Table 1 to quantify the severity of the near miss.
There are three differences between CR-GWm and CR-GWp—see the dotted frame in Figure 6: first, apart from the sailing information of this ship pair, all the surrounding ships’ sailing information are input; the second difference is the determination of observation time t o b —see more in Formula (3); the third difference regards traffic complexity, which affects the GW’s risk resolution—see Figure 5 and Formula (3).

Near Miss Severity of a SO in the Multi-Vessel Encounter Scenario with No Rule Conflict

In the multi-vessel encounter scenario with no rule conflict, the CR-SOm module is activated for a SO to measure the severity of near miss—see Figure 7. Similar with CR-SOp in Figure 4, the calculation of five indicators (IC, Int, AQ, Col, and L A M M ) is the first step. Afterwards, these five indicators are applied to the criteria in Table 1 to determine the severity of near miss. The calculation of each indicator can be seen in Section 2.3.3.
In comparison with the CR-SOp in Figure 4, there are three differences in CR-SOm—see the dotted frame in Figure 7. First, the inputs are all the related ships’ sailing information, including the ship pair in question and the surrounding intrusive ships; the second is that the observation time, t o b , is also affected by the other surrounding ships, which can be calculated on the basis of Formula (3); third, the traffic complexity is employed for the calculation of AMM of the SO ( A M M m )—see Formula (3).

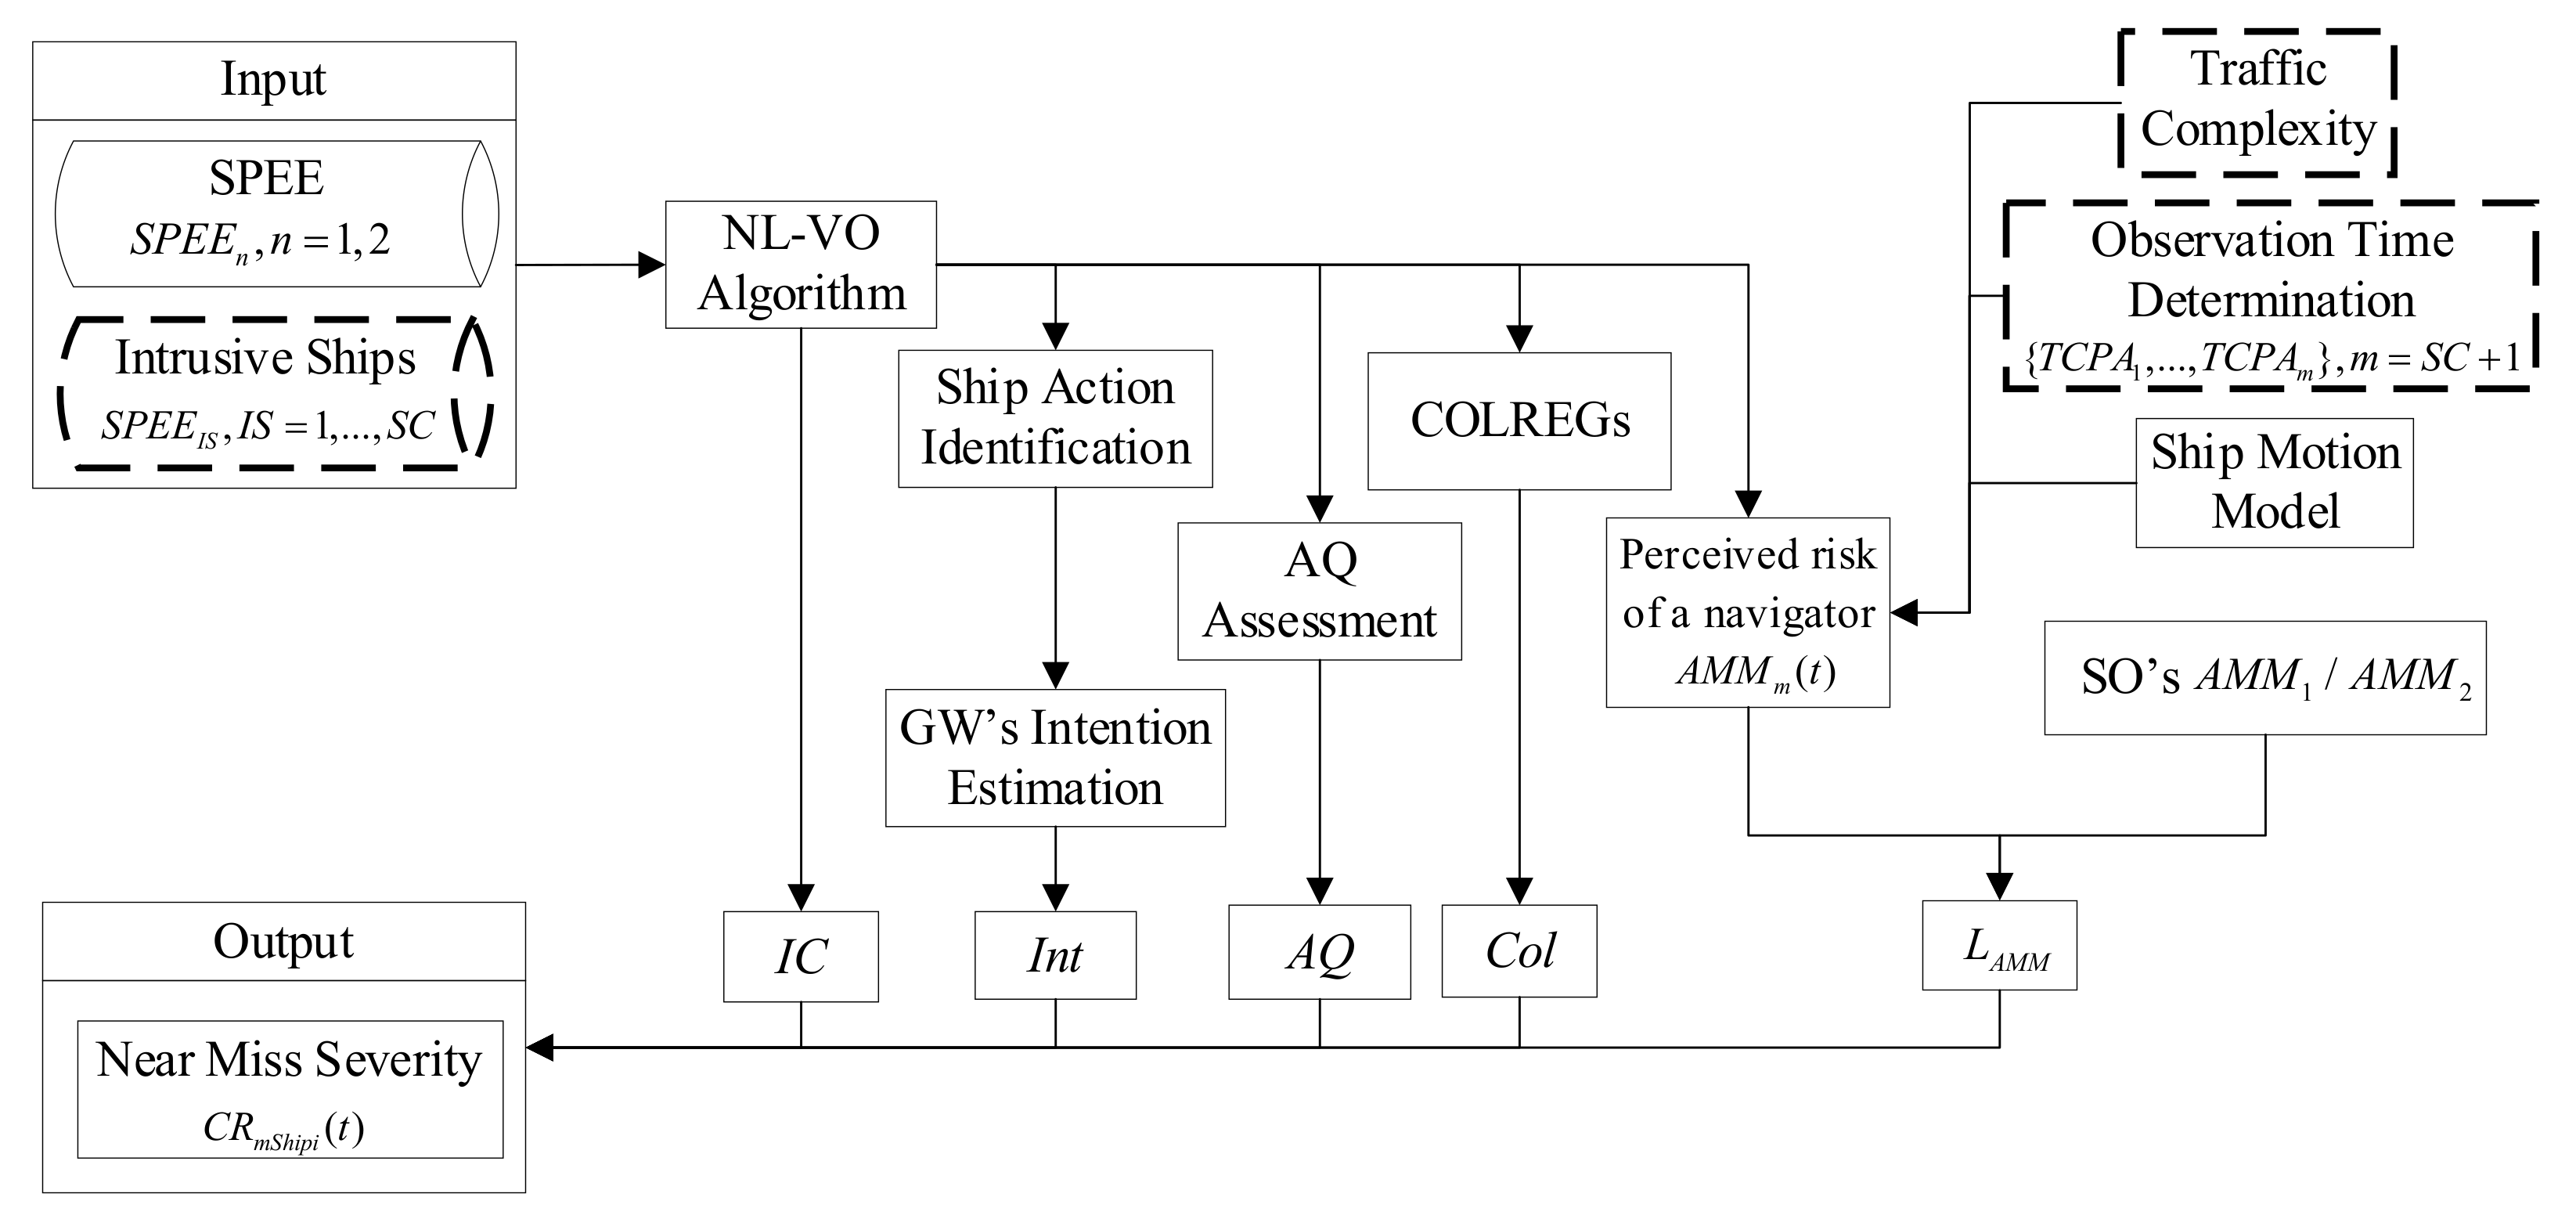
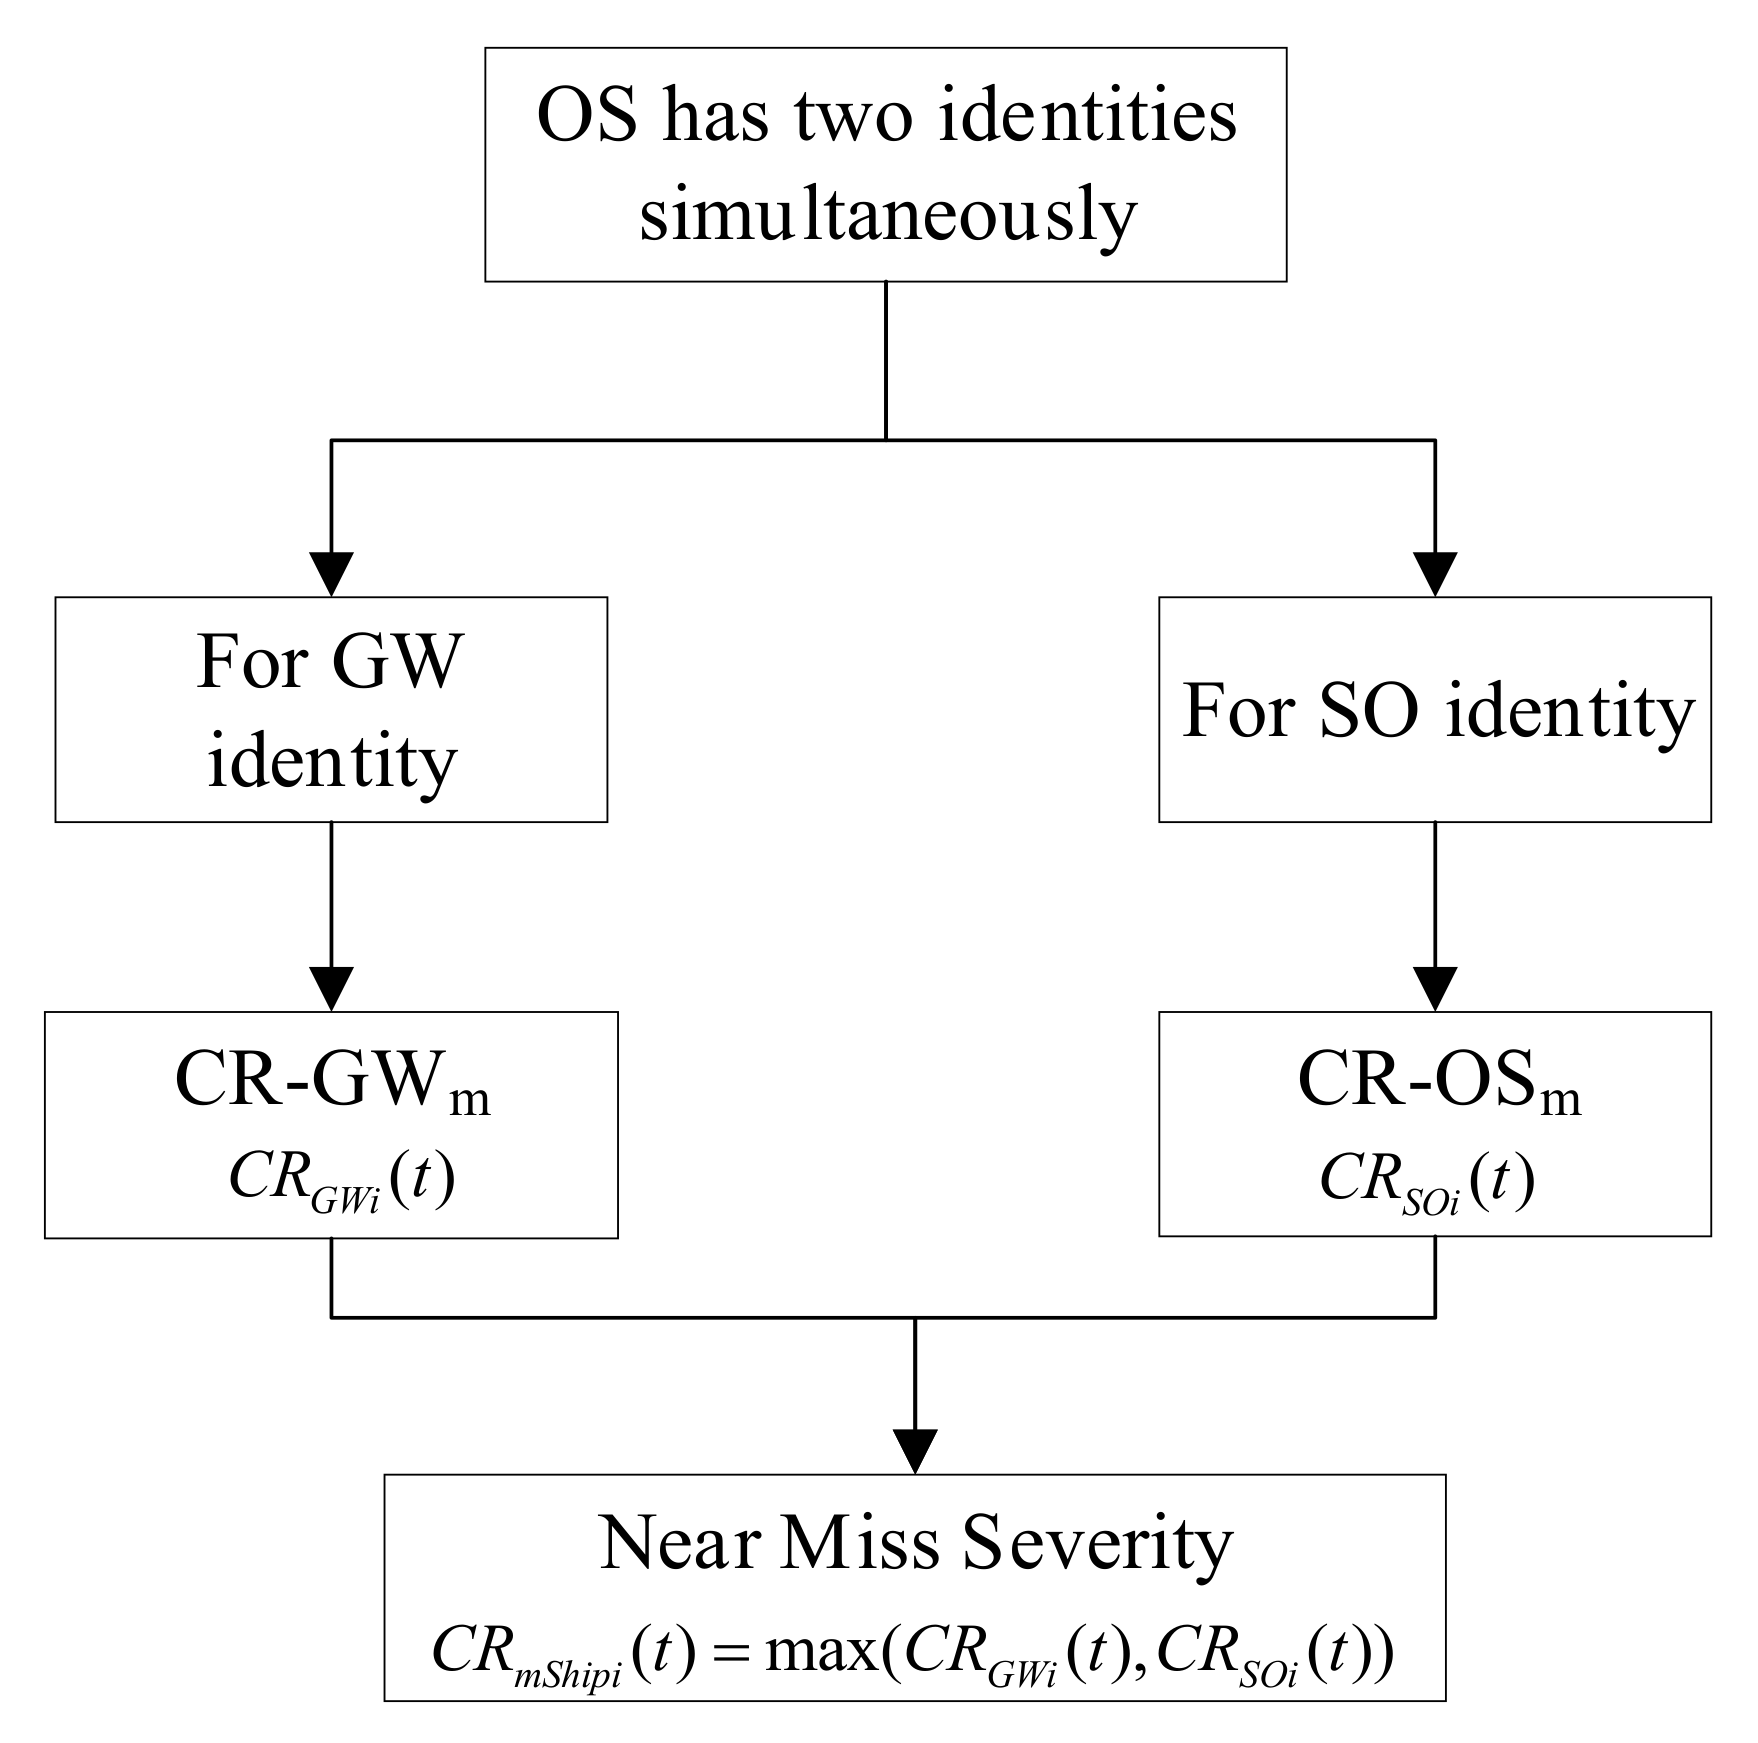
Near Miss Severity of a Ship in the Multi-Vessel Encounter Scenario with Rule Conflict

When rule conflict exists in the multi-vessel encounter scenario, the CR-RCm module is activated. The severity of this ship being as a GW and a SO are calculated simultaneously, and the maximum value among them is selected as the final severity of the near miss (Figure 8).

3. Application

In this section, the proposed method of near miss detection is applied to the Northern Baltic Sea, defined as the area north of 59°N. The AIS data were obtained from [46]. After data processing, including cleaning, filtering, and interpolation, the AIS data were applied to detect the possible near miss in the Northern Baltic Sea in Zhang et al. [12,19]. The promising results attest that the quality of this processed AIS data is acceptable. This processed AIS data are adopted in this work. Some results of the model application are shown in this section. Moreover, the model is evaluated using example encounter scenarios and spatial analysis of where encounters of different severity levels are found to occur.

3.1. Traffic Profile

In this work, only the passenger ship, tanker, and cargo ship were considered. Specific-purpose ships, including the tug, pilot vessel, wing in the ground, high-speed craft, and dredgers, were excluded due to their unknown working states, as their behaviors in working and non-working states are different [47]. The AIS data of July 2011 in the Northern Baltic Sea were used. There were 1638 ships in total, where around 61.8% of them are cargo ships (1012), 16% are passenger ships (262), and 22.2% are tankers (364).

3.1.1. Ship Pair Encounter Event Detection

30,344 SPEEs were detected. and around 26% of them (7969 times) were under collision threat. Ship COLREGs identity, i.e., GW or SO, was also identified. For a head-on encounter, according to COLREGs, the two ships should turn starboard for safe passage. The two ships were therefore considered as GW ships. Table 3 lists the number of GW and SO ships belonging to different ship types and ship length in all SPEEs under collision threat—more information can be found in [36].

3.1.2. Traffic Complexity Classification

Each SPEE was scrutinized to count the ship number. During the entire encounter period, if the ship number was larger than two at any certain moment, then the SPEE was marked as a multi-ship encounter. Among all SPEEs, 25,020 of them were multi-vessel encounter scenarios. The number of ships in each SPEE at each time step was statistical analyzed (Figure 9). The time step was set as 1 min. The occurrence times of ship encounters with more ships decreased sharply. For instance, the ship pair encounter existed for 349,756 min, while the three-ship encounter occurred for 233,490 min.

3.2. Demonstration of Near Miss Analysis

This demonstration was used to evaluate whether this proposed method can differentiate scenarios with different risk levels. The ship pair encounter scenario and multi-vessel encounter scenario are tested separately in Section 3.2.1 and Section 3.2.2.

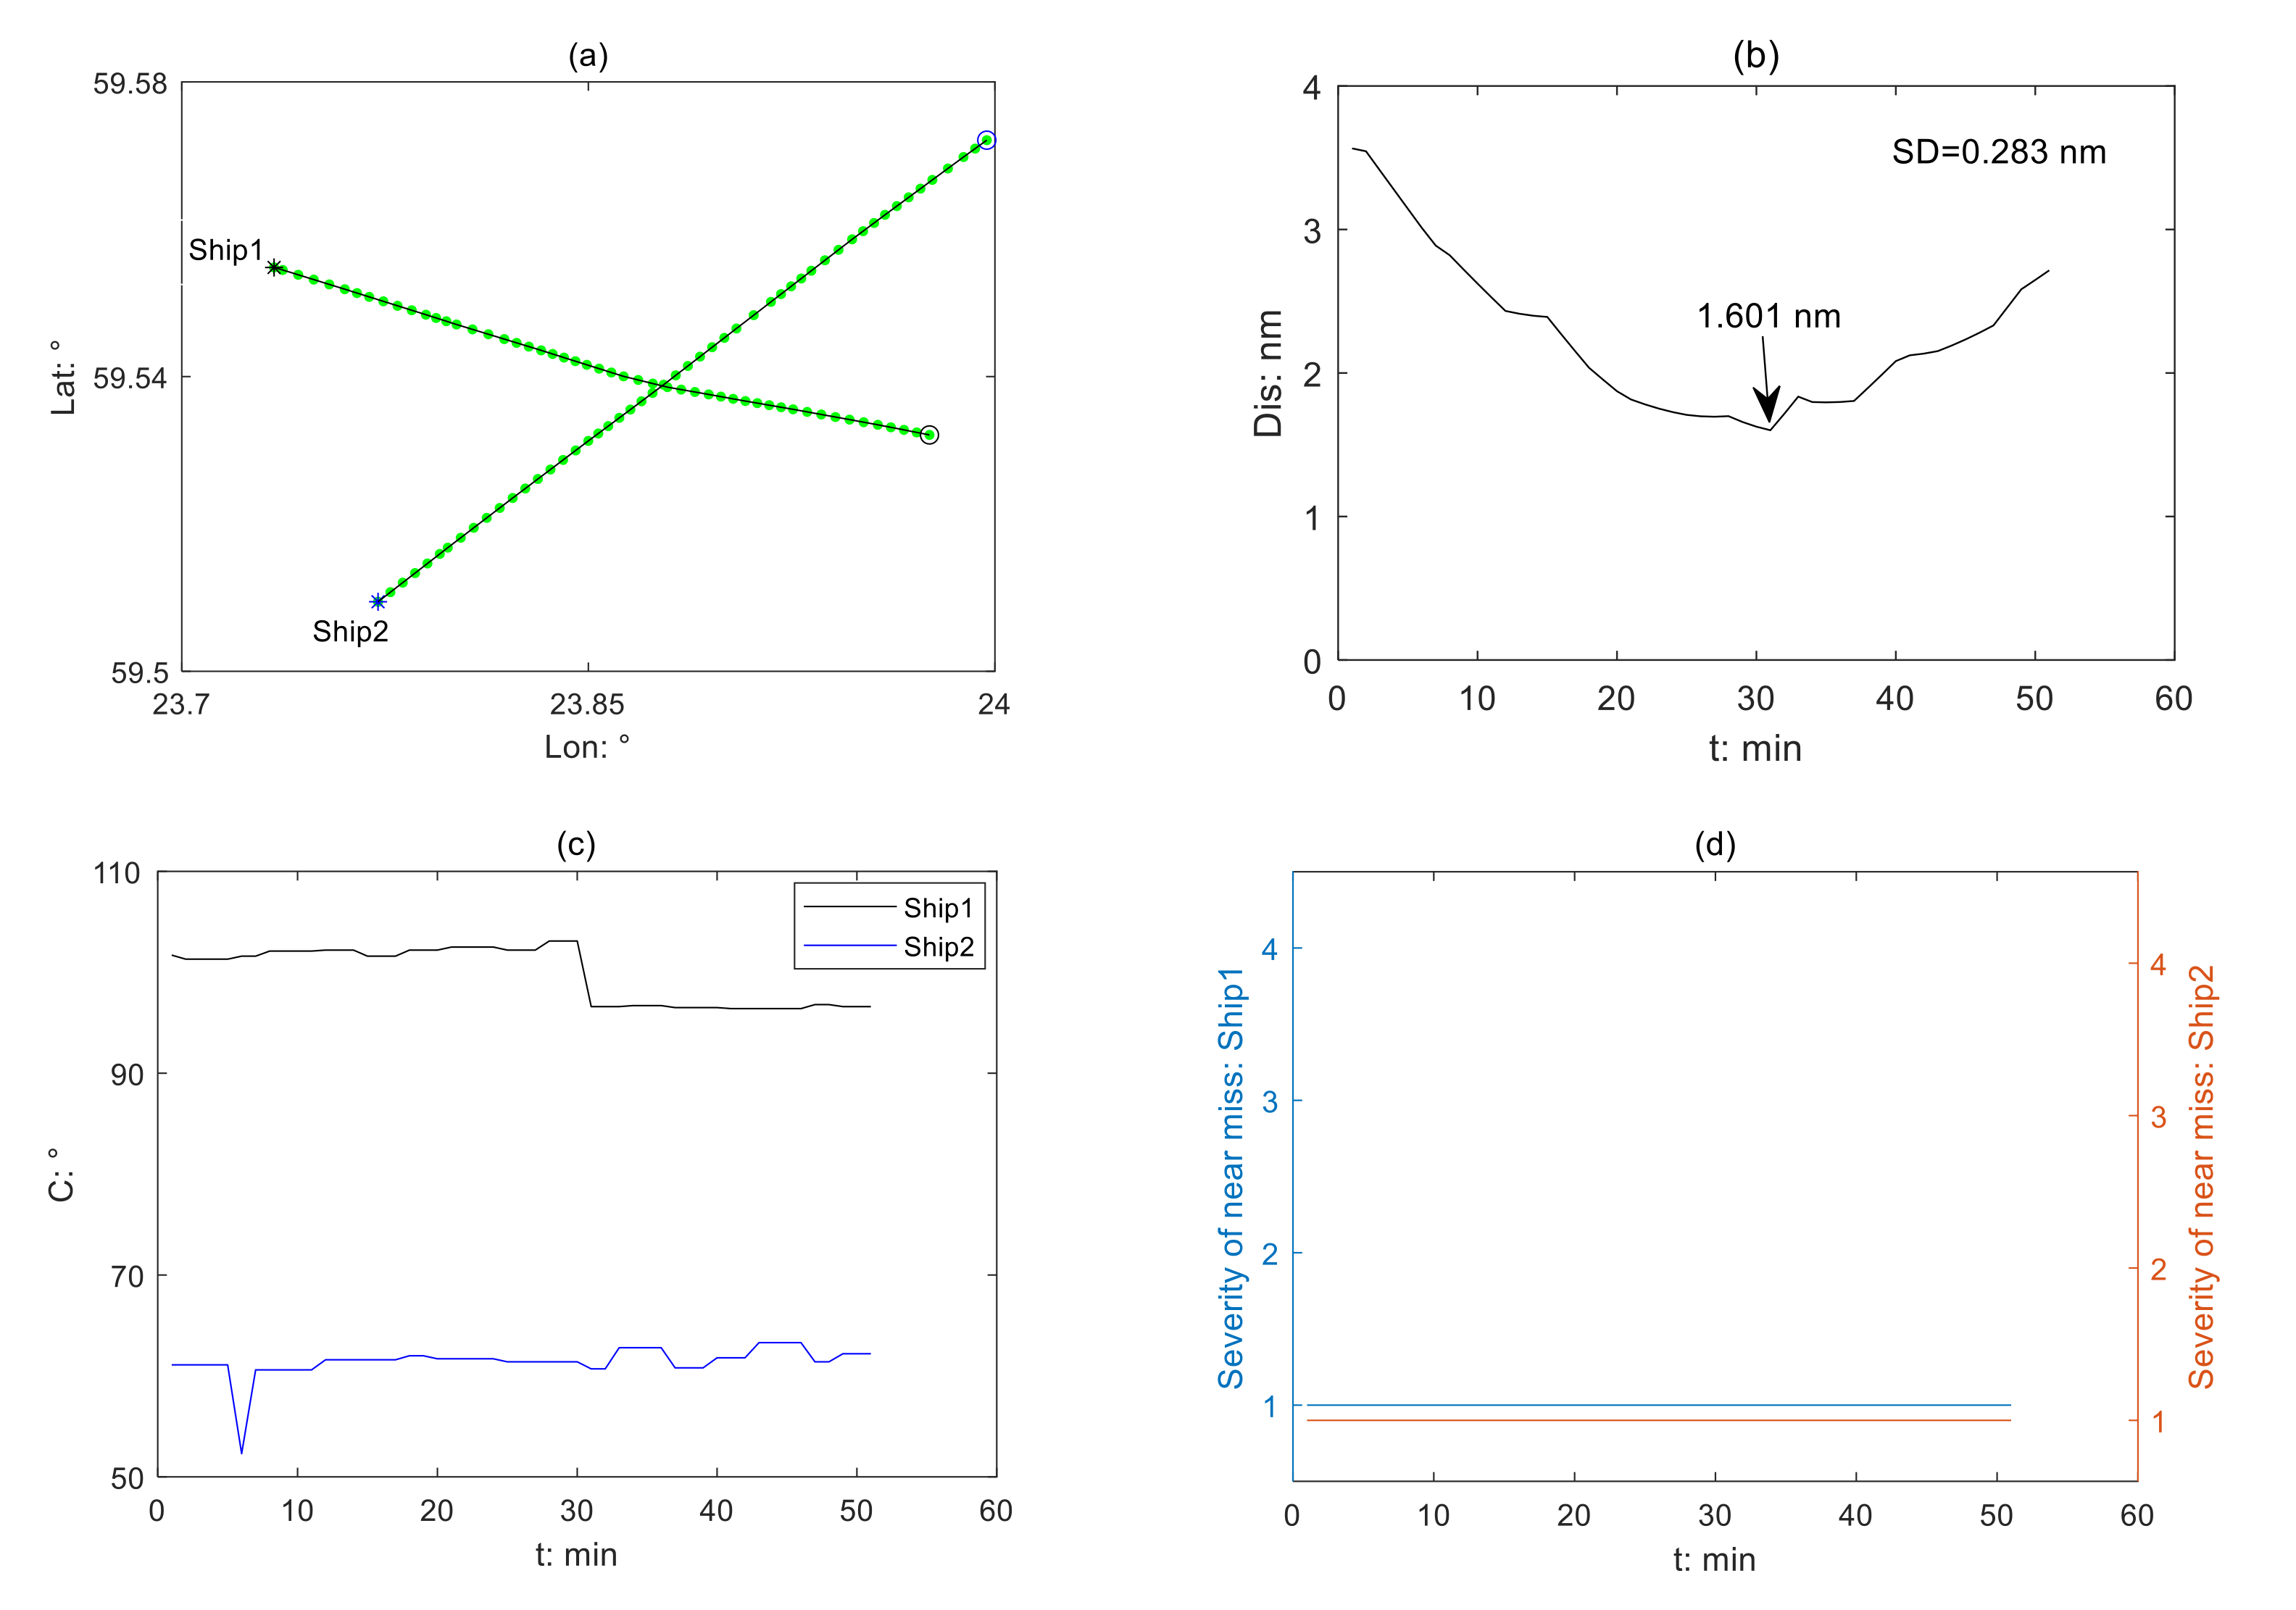
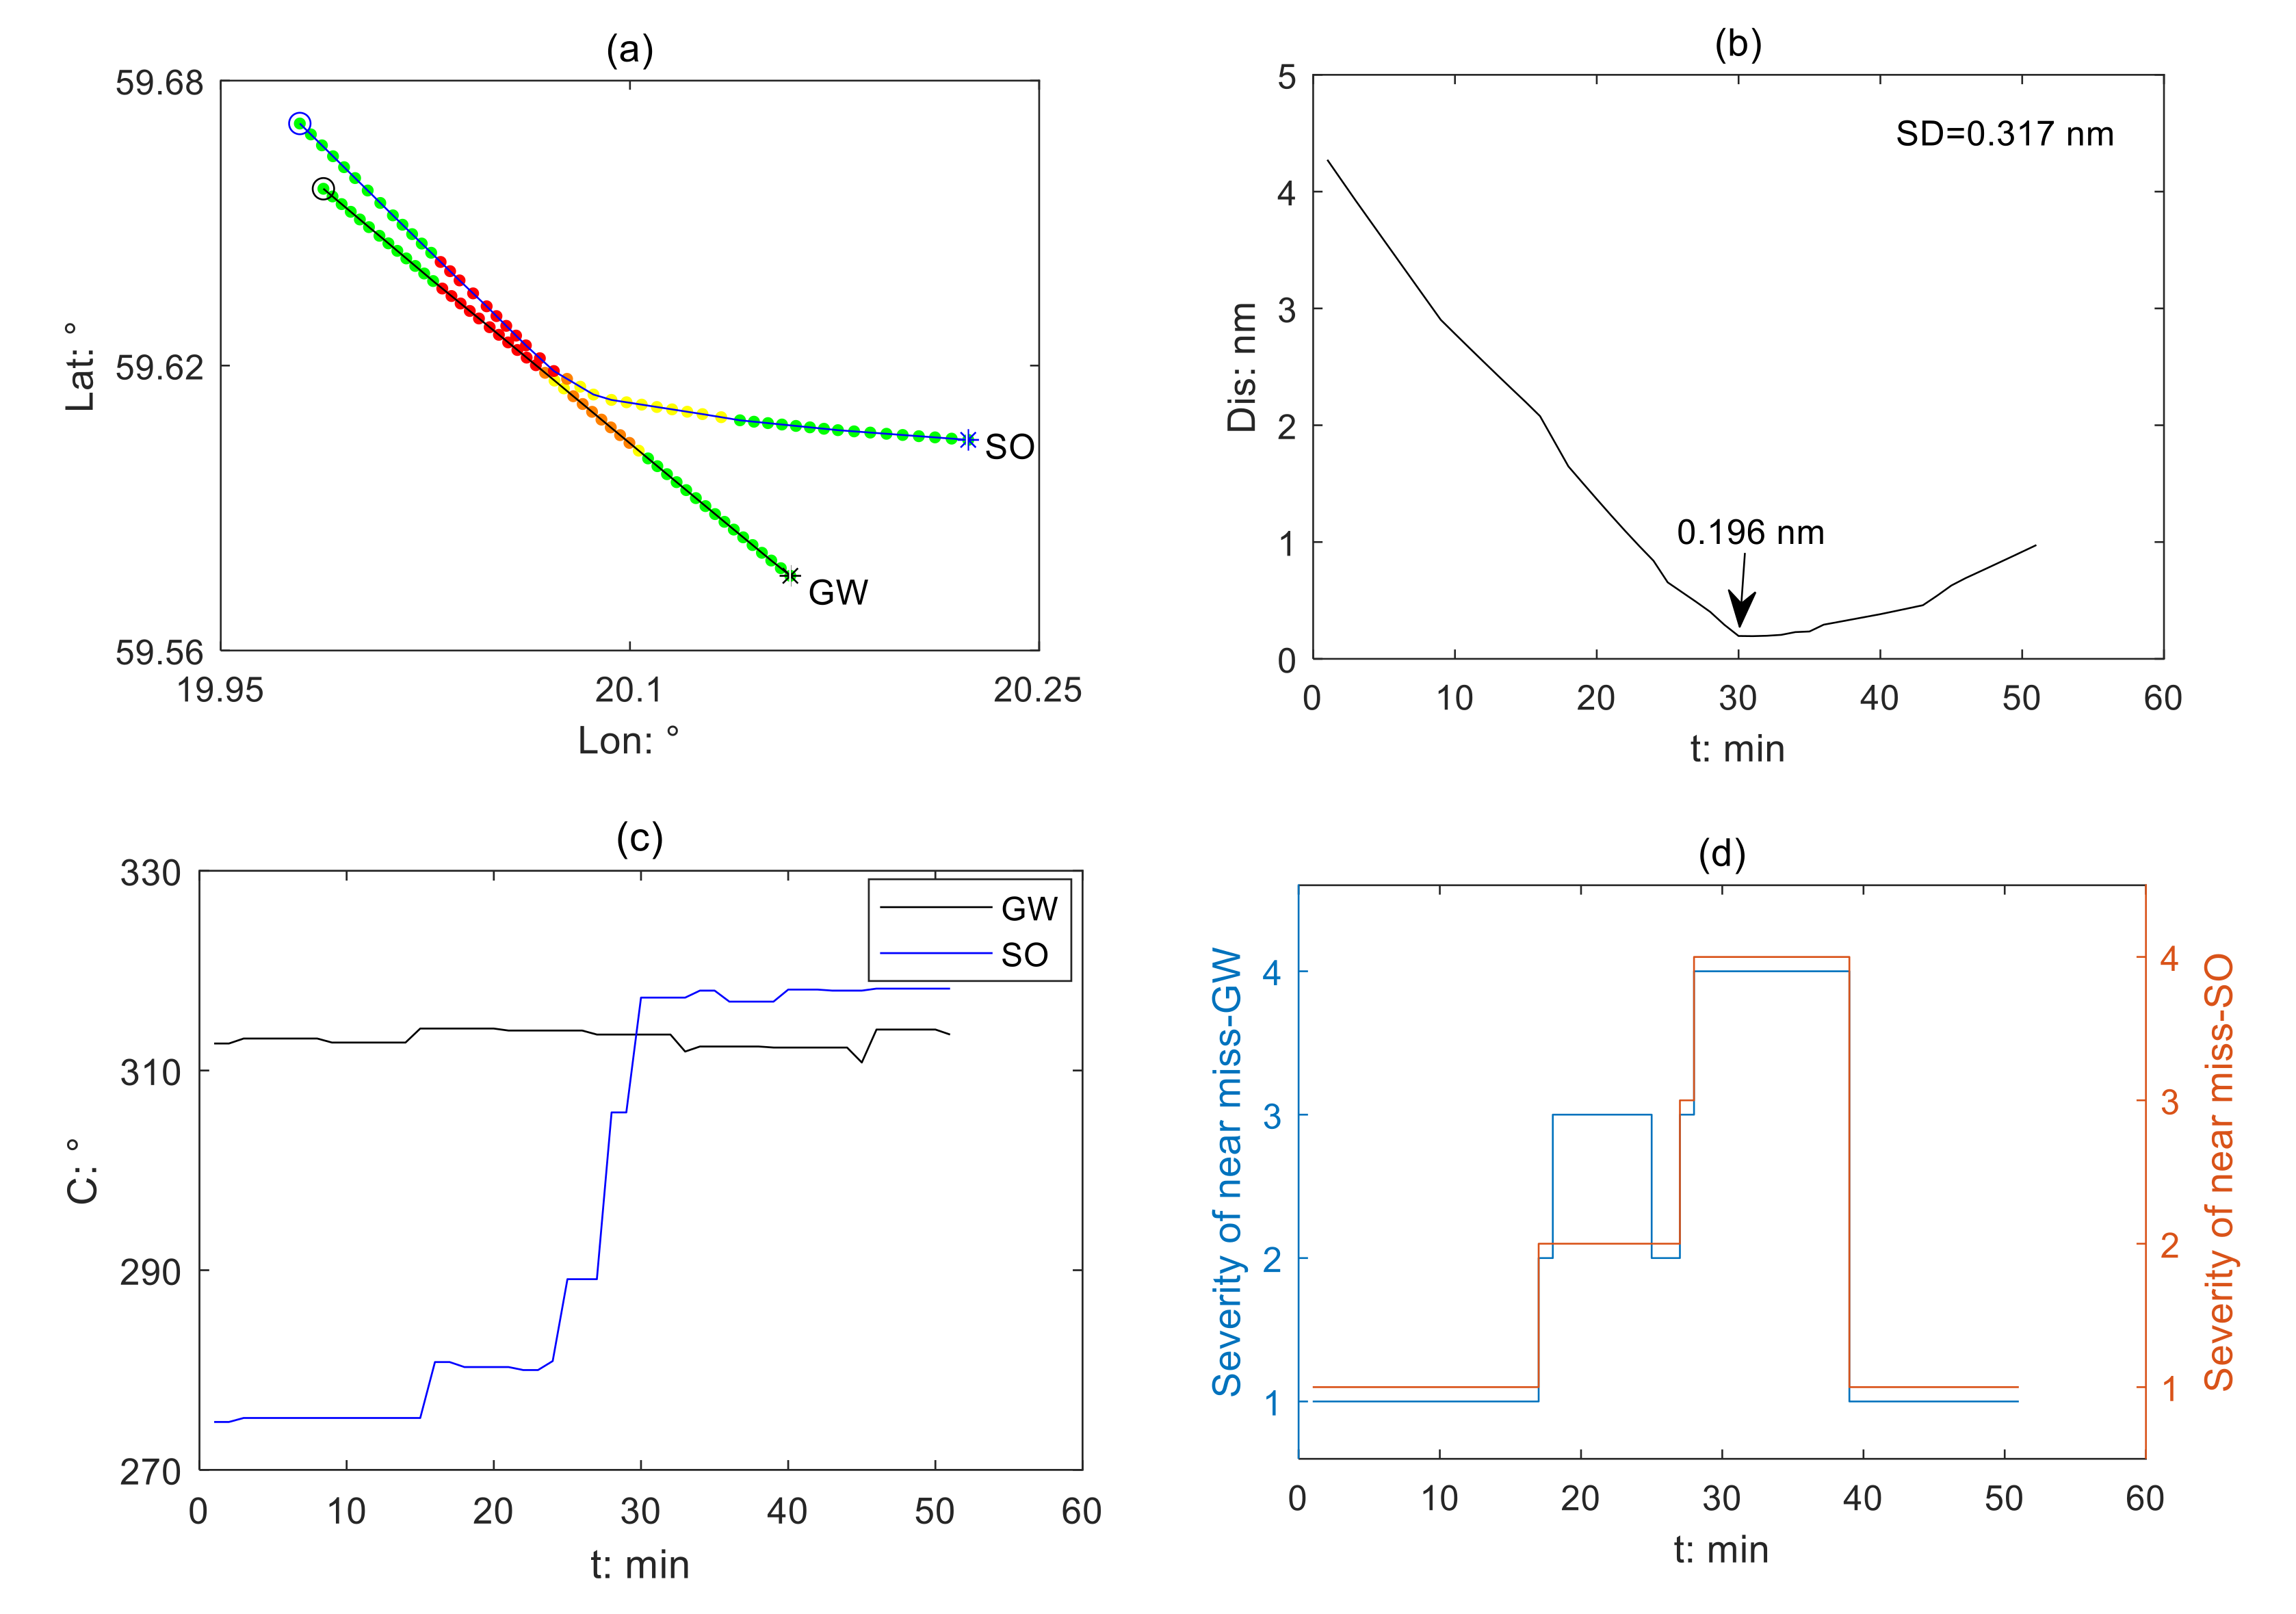
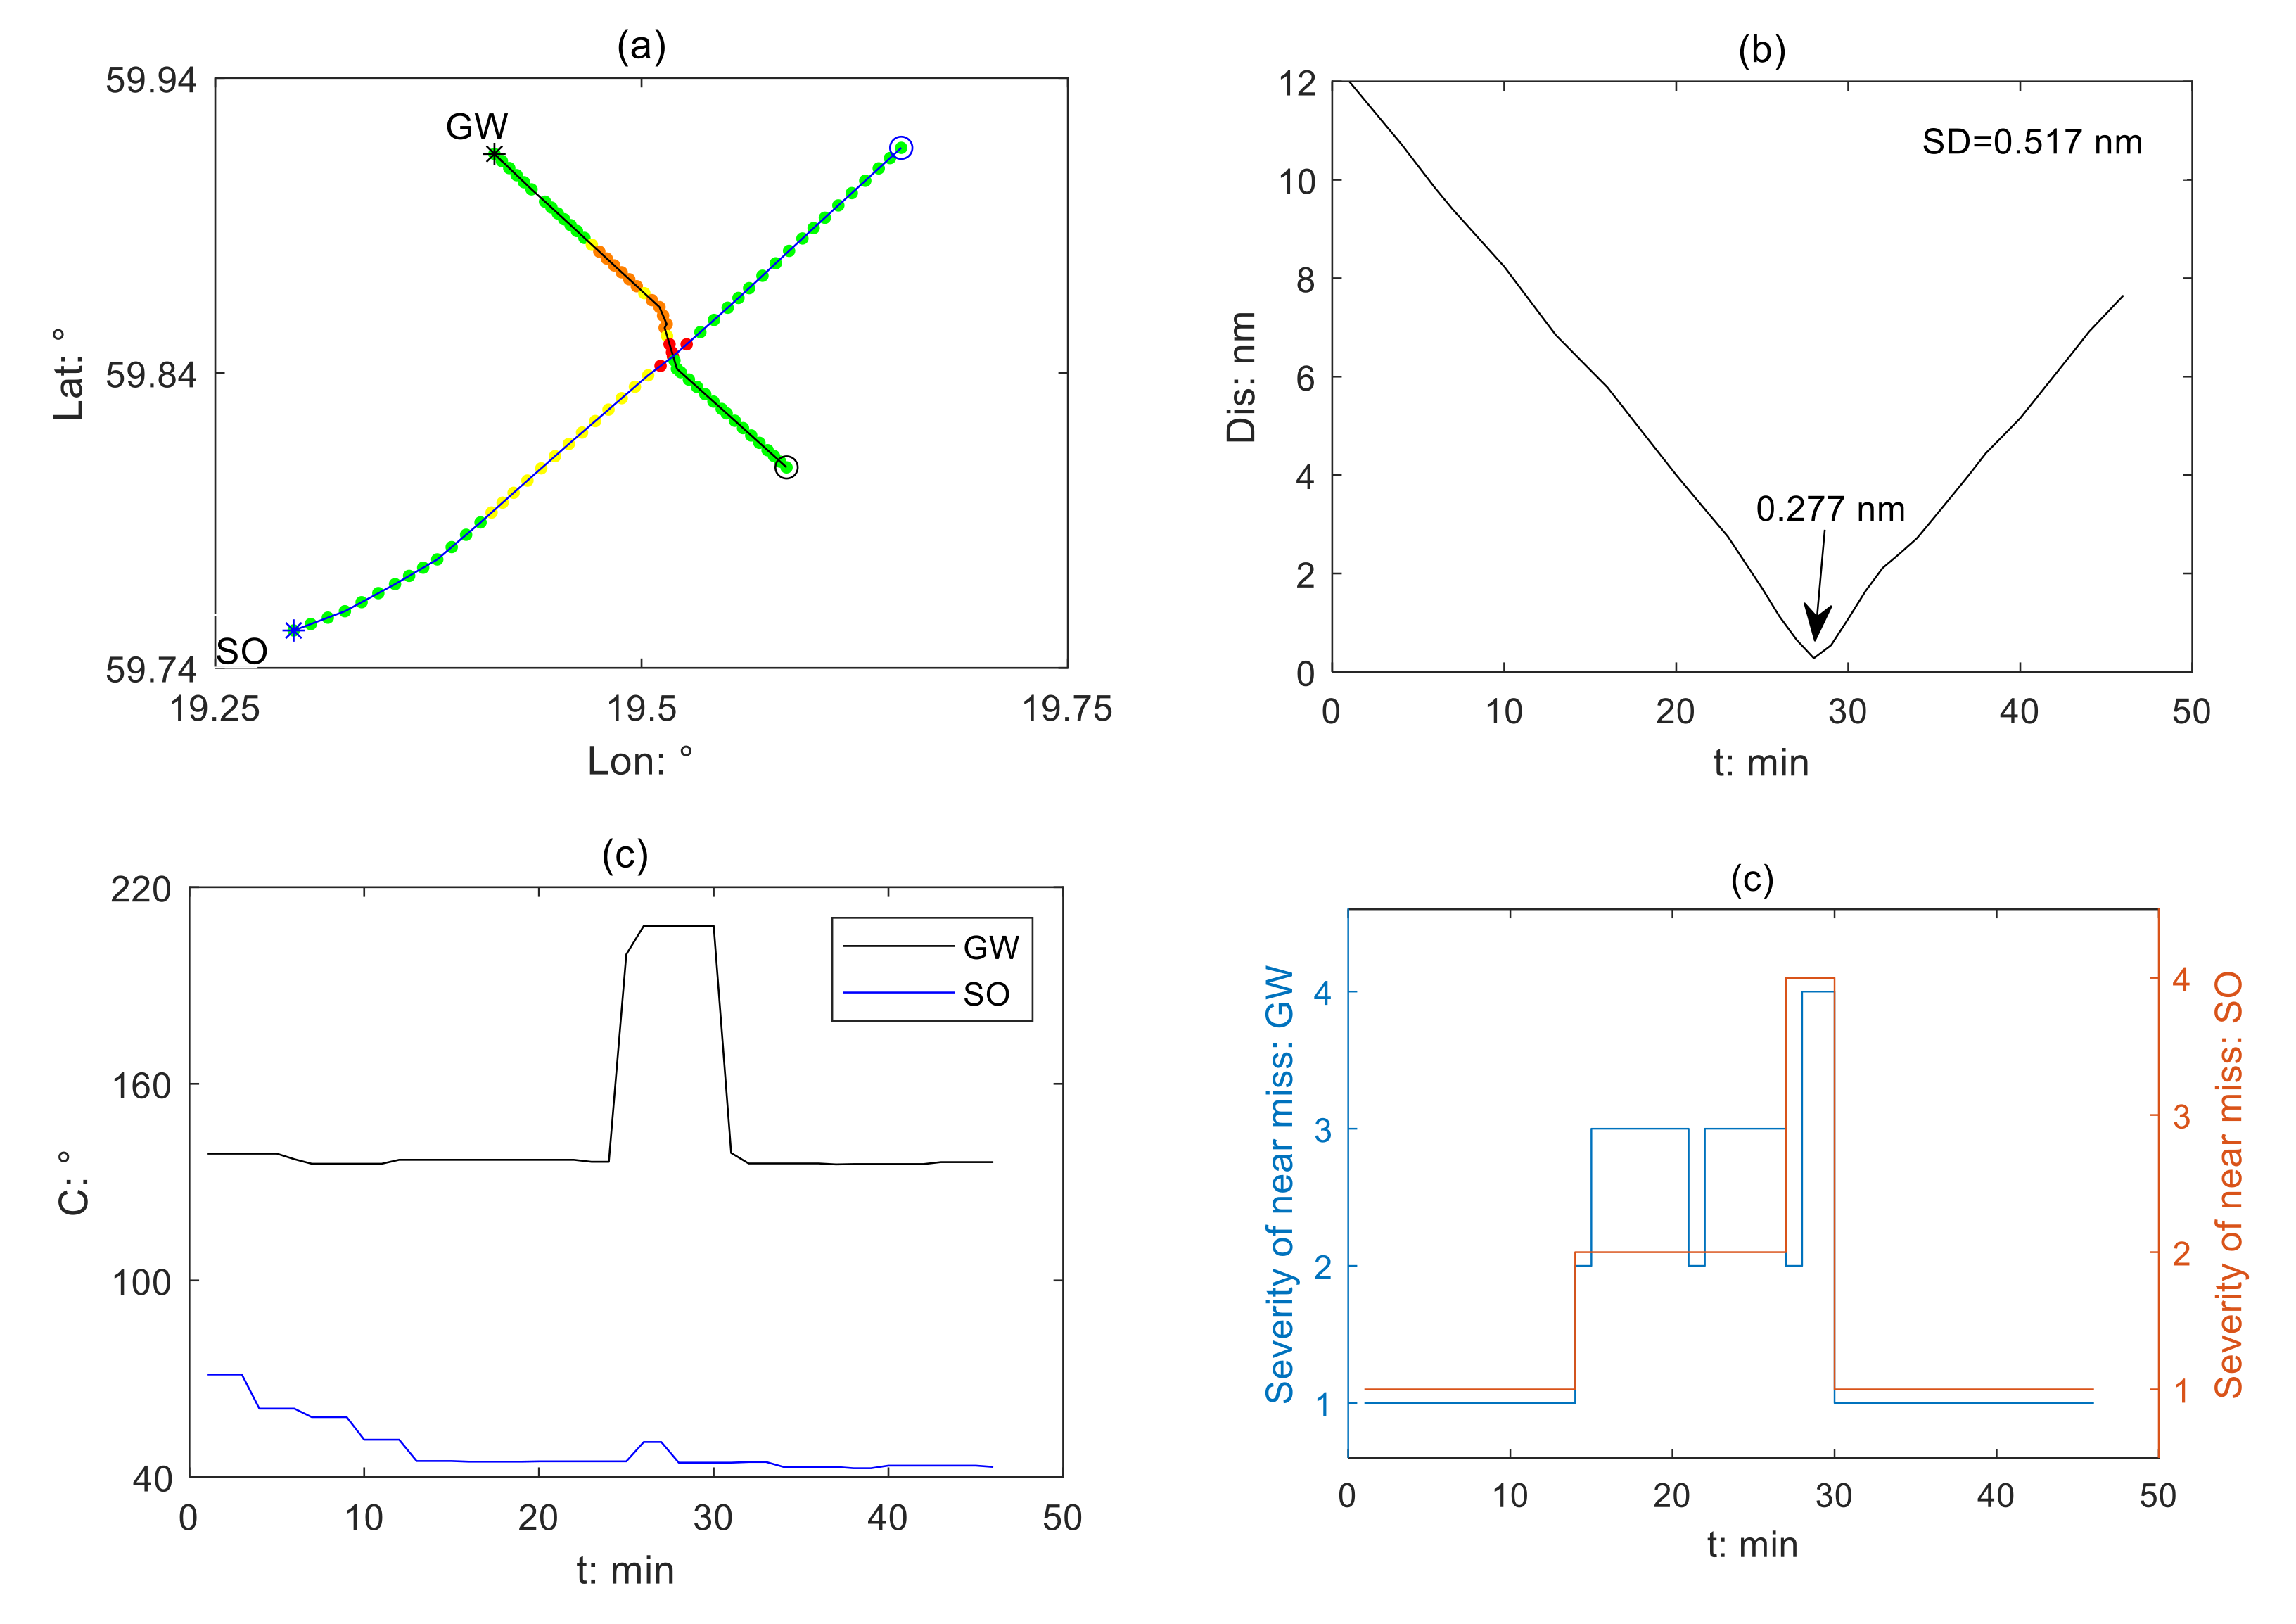
3.2.1. Ship Pair Encounter Scenario

Four typical ship pair encounter scenarios were selected to illustrate how the near miss is detected and how the severity is determined—see Figure 10, Figure 11, Figure 12 and Figure 13. Each scenario contains four pictures to show the details of results. Figure 10a, Figure 11a, Figure 12a and Figure 13a present the ship trajectory and the result of near miss detection and its severity. Different colors mean different risk levels. From green, to yellow, orange, and red, the risk level increases from no risk to low risk, medium risk, and high risk. The color set is consistent with Table 1. The start point of a ship is marked as a star, and its endpoint is a circle. The ship COLREGs identity (GW or SO) was determined based on Section 2.3.1. The trajectories of the GW and SO are the black and blue lines, respectively. Figure 10b, Figure 11b, Figure 12b and Figure 13b regard their relative distance. Figure 10c, Figure 11c, Figure 12c and Figure 13c display the change in ship course. Figure 10d, Figure 11d, Figure 12d and Figure 13d show the severity of the detected near miss. The ship attributes are listed in Table 4. MMSI is Maritime Mobile Service Identity. The related information of these ship pairs for determining the ship COLREGs identity is listed in Table 5. The ship COLREGs identity is determined when the collision risk occurs. The collision risk occurs at t C O L . R B G W and R H G W are the relative bearing and relative heading of the ship pair seen from the perspective of the GW. R B S O and R H S O are the relative bearing and relative heading of the ship pair seen from the perspective of the SO.
Figure 10 presents a crossing encounter scenario without collision risk (Scenario 1). This encounter process takes 51 min (Figure 10a). Ship1 is marked in black, and Ship2 is marked in blue. The relative distance between them gradually decreases with slight fluctuation before it drops to the minimum (1.208 nm) at 31 min, which is higher than the radius of the ship domain (SD; 0.283 nm; Figure 10b). There is no collision risk during the whole encounter process (Figure 10a,d). Ship1 marked in black turns portside at 31 min (Figure 10c); therefore, their relative distance increase afterwards.
Figure 11 presents a dangerous crossing encounter with a relatively close distance. This encounter process takes 51 min (Figure 11a). In the beginning, there is no collision risk. If the sailing states of the two ships remain, the ship marked in blue will pass the other one marked in black by her stern safely. At 16 min, the ship marked in blue turns starboard from 275.2° to 280.8° (Figure 11c), which generates a low collision risk from 17 min onwards (Figure 11d). The ship COLREGs identity is then determined at this moment. The GW is required to take evasive action, but it turns to starboard slightly (Figure 11c), which is not effective to eliminate the danger. As the GW’s AMM decreases, the collision risk of the GW increases to medium risk (Figure 11d). From 24 min, the SO turns starboard several times, causing its course to increase to 305.8° at 28min. During this process, the AMM of the SO drops, so its collision risk increases to medium risk at 27 min and high risk at 28 min. Their relative distance continues to decrease (Figure 11b). The SD is violated at around 29 min. At 30 min, they reach their closest point (0.196nm), which is smaller than the radius of the SD. After 9 min of dangerous sailing at a close range, the two ships depart each other (Figure 11b), and the collision risk disappears (Figure 11d). In summary, the collision risk is initiated by the SO, while it is deteriorated by the GW’s unappreciated evasive action.
Figure 12 presents a dangerous overtaking encounter with a relatively close distance. This encounter process takes 51 min (Figure 12a). There is no collision risk before 17 min (Figure 12d). The ship marked in black in the overtaking position continues to turn starboard (Figure 12c). At 17 min, its course gradually increases from 29° to 31° (Figure 12c), which generates a collision risk (Figure 12d). The ship COLREGs identity is then determined at 17 min. For the GW, it is at a low risk, as its AMM is still high. For the SO, it is in the medium risk due to its medium-level AMM. As the GW’s slight action is not sufficient, the collision risk becomes worse. At 27 min, the AMM of the GW drops to medium, and the GW’s collision risk increases to medium. At 29 min, the GW turns starboard, resulting in the generation of a high collision risk. Their relative distance continues to reduce. Their SD is violated at 29 min. At 31 min, the closest point arrives, and the minimum relative distance is 0.29 nm (Figure 12b). This dangerous state in which their SD is violated remains until 34 min. From 34 min onwards, the two ships separate (Figure 12b). This dangerous overtaking encounter is mainly caused by the GW, as the overtaking ship should keep out of the way of the vessel being overtaken, as specified in Rule 13 in COLREGs.
Figure 13 presents a dangerous crossing encounter between a cargo ship and a passenger ship. The collision risk emerges at 14 min (Figure 13a,d) due to the passenger ship continually turning portside. The cargo ship is a GW and the passenger ship is a SO. The SO’s course drops from 71.3° at the beginning to 44.9° at 14 min (Figure 13c). Due to the decrease in the GW’s AMM, the collision risk increases to medium risk at 15 min. The SO turns slightly starboard at 20 and 27 min, respectively, which increases the GW’s AMM, thereby lowering its collision risk level. The GW turns to starboard significantly at 24 min, and its course increases from 136.2° to 199.5° at 25 min and to 208.2° at 26 min. However, these evasive actions are too late for collision avoidance. Their relative distance continues to decrease. The minimum relative distance is 0.277nm at 28 min, where the limit of SD is violated (Figure 13b). The collision risk of the GW and SO increases to a high level before 28 min. Afterwards, these two ships gradually depart each other (Figure 13b). Two minutes later, the collision risk disappears. In summary, this dangerous crossing encounter is initiated by the SO, but the ineffective collision avoidance strategy of the GW worsens the encounter situation.

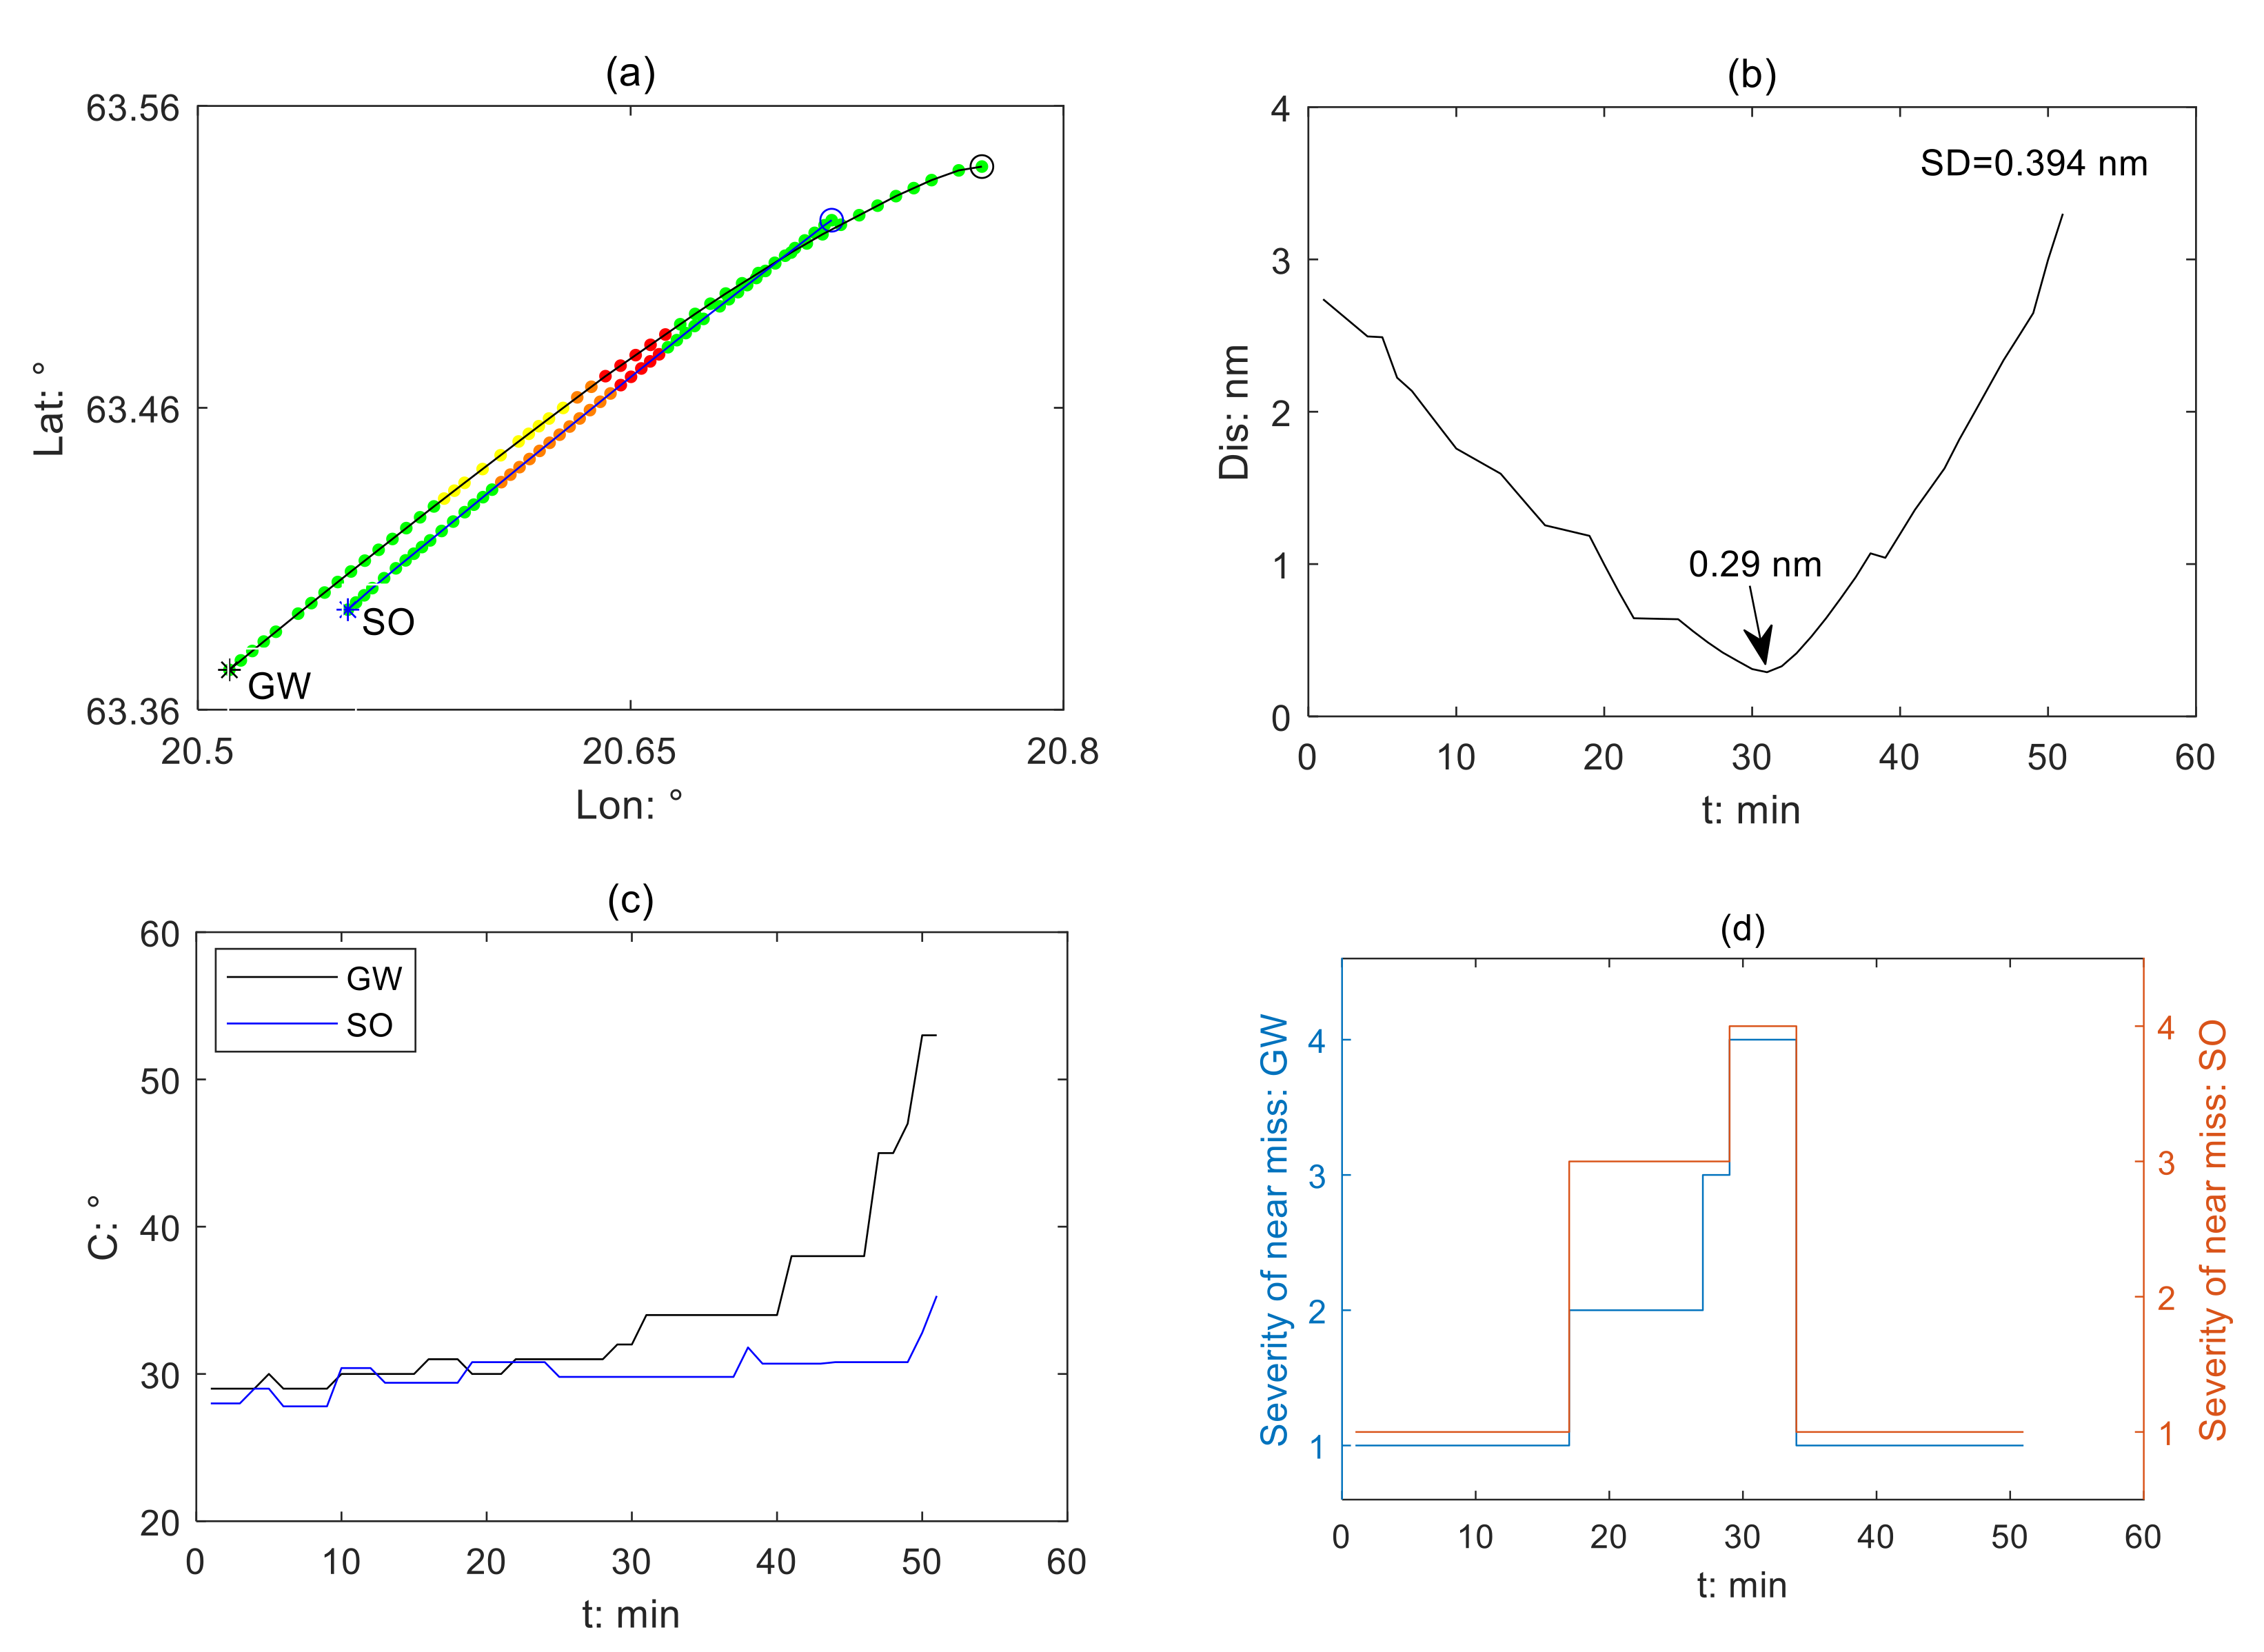
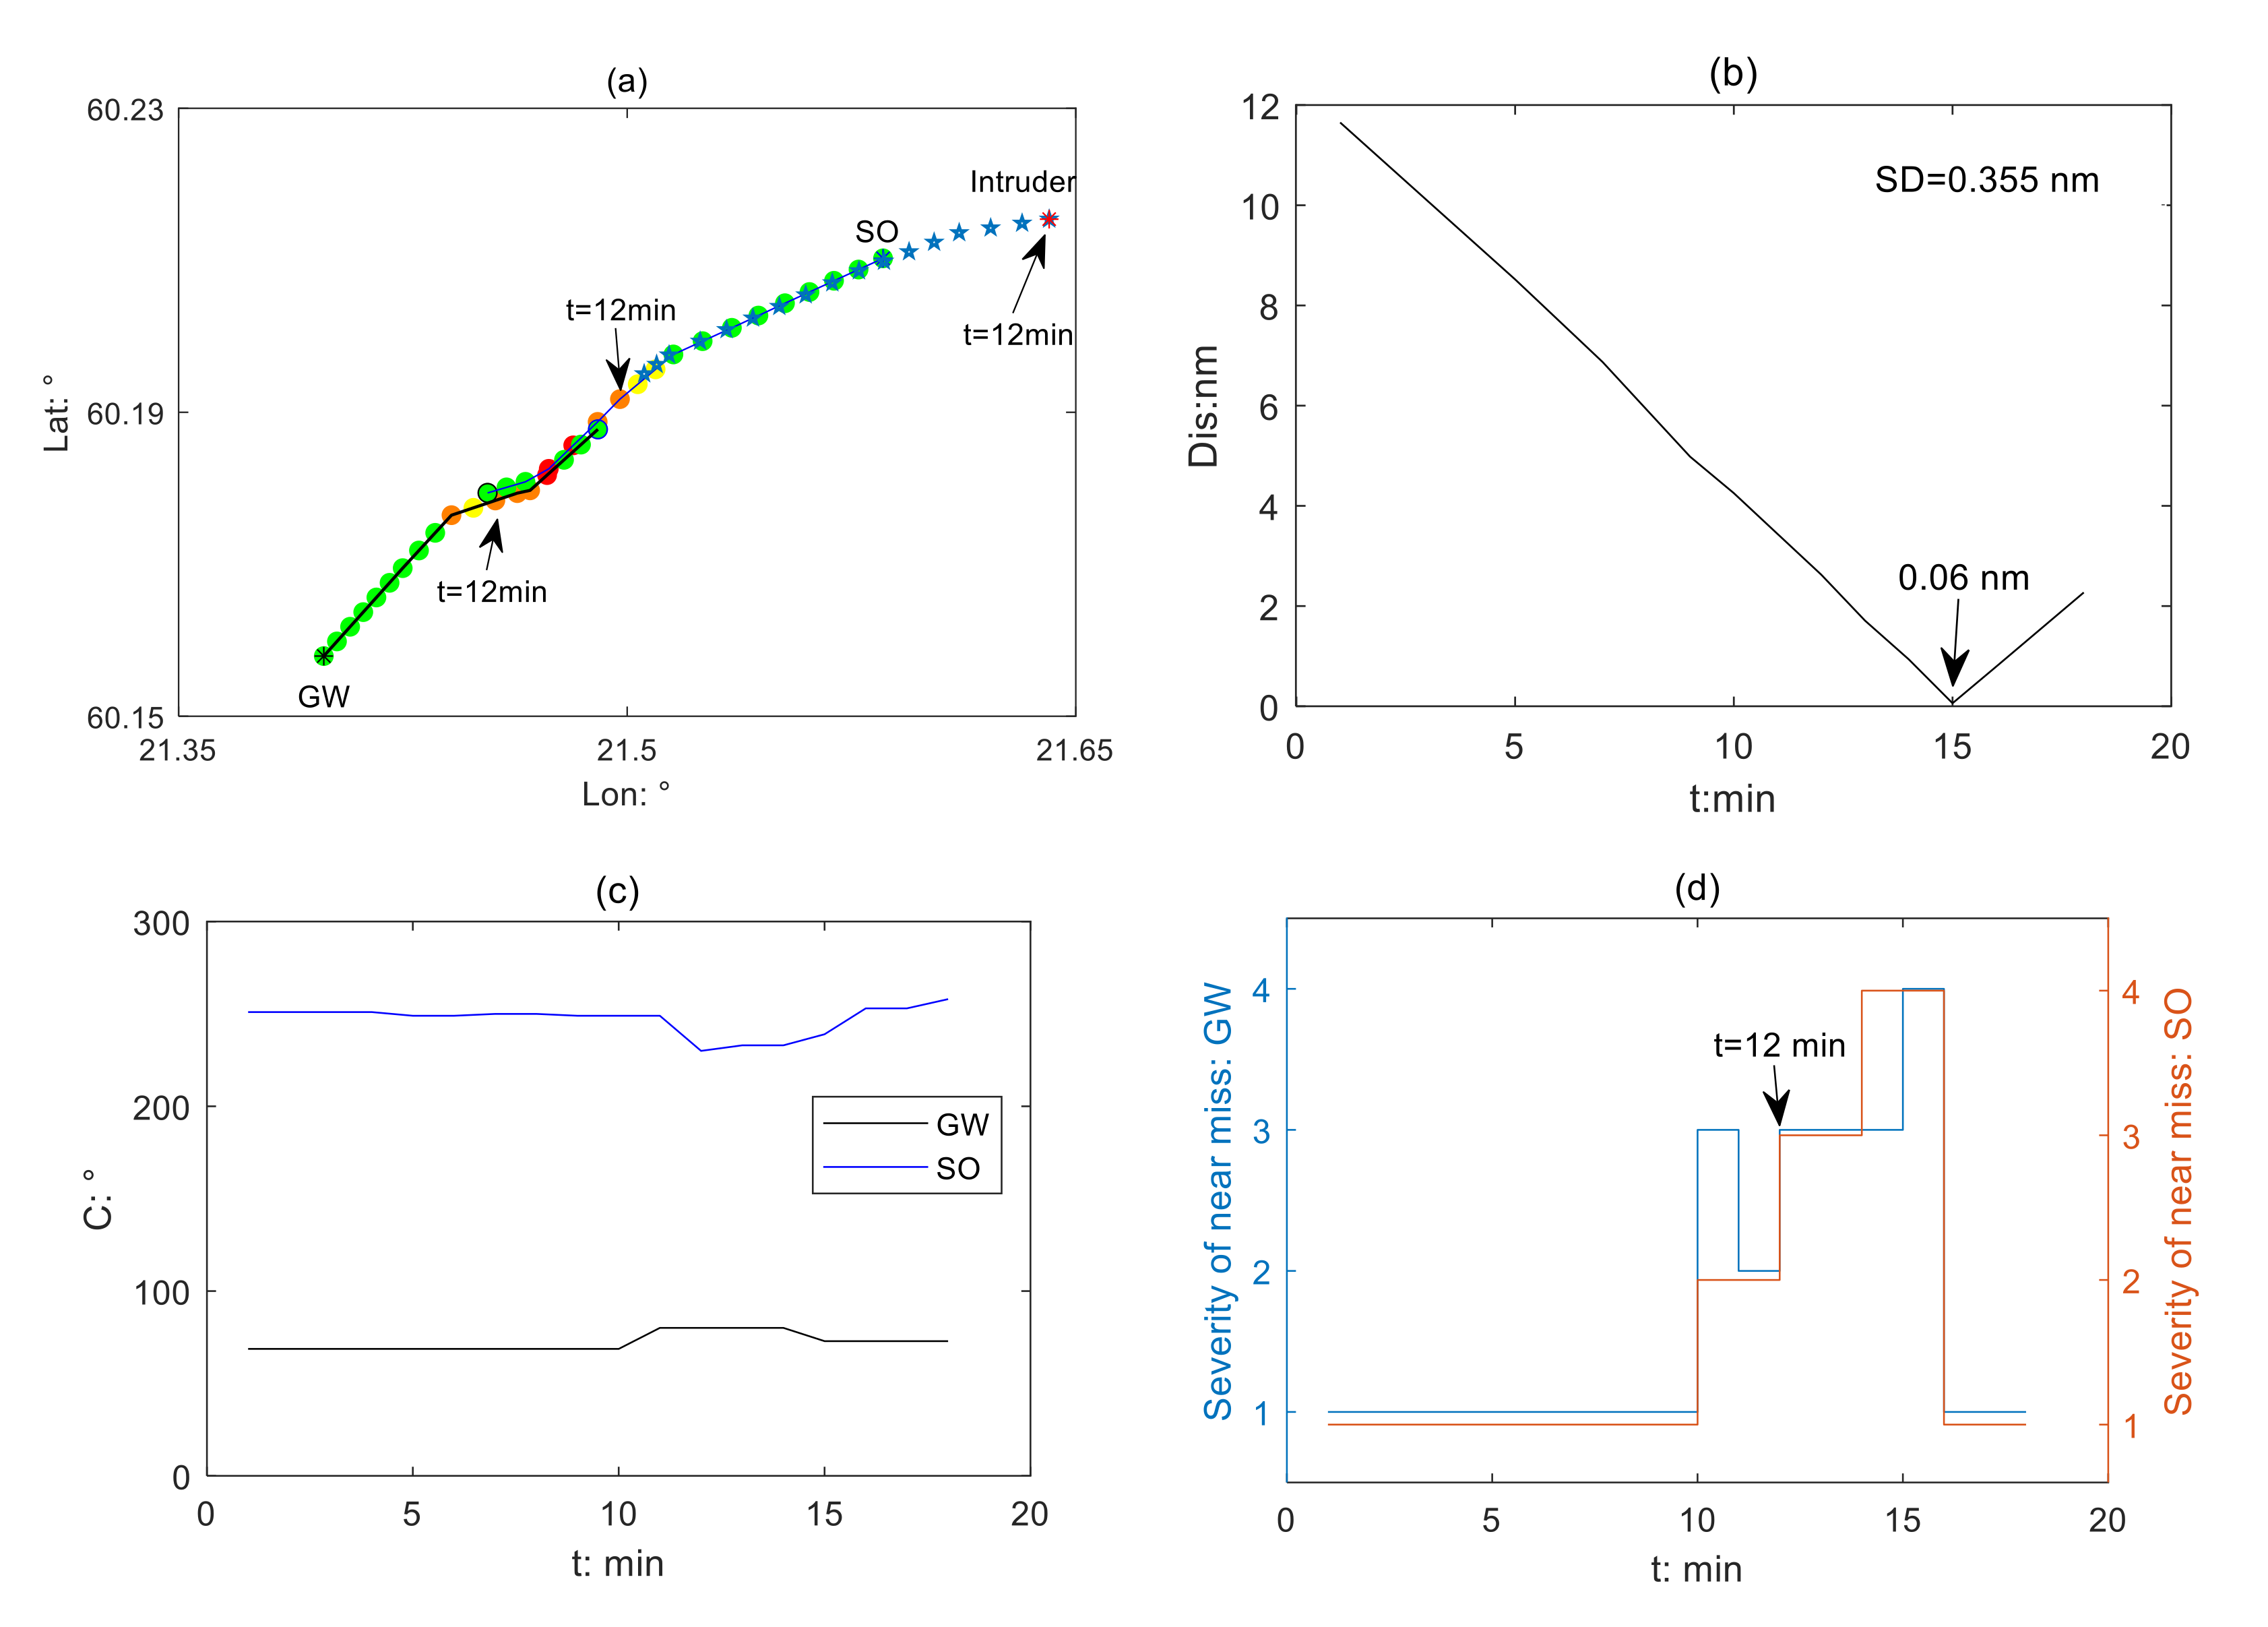
3.2.2. Multi-Vessel Encounter Scenario

One case of the multi-vessel encounter is utilized to demonstrate the process of near miss detection and analysis. This encounter process takes 18 min. There are only two ships at the beginning. The COLREGs identity of this ship pair is determined based on the method in Section 2.3.1. At 12 min, the third ship intrudes; then, this ship pair encounter becomes a multi-vessel encounter. The third ship is called an intruder in this work. The three ships are passenger ships. There is no rule conflict in this multi-vessel encounter. The basic information of these ships is in Table 6, and the result can be seen in Figure 14. Different lines, markers, and colors represent different matters in Figure 14, similar to those in Section 3.2.1.
For the first 9 min of the encounter process, it is a ship pair encounter, and there is no collision risk—see Figure 14a,d. If the motion states of these two ships are maintained, the ship in black will safely pass the ship in blue by her stern. From 10 min onwards, the collision risk emerges due to the ship marked in black continually turning starboard (Figure 14c). The ship COLREGs identity are determined at this moment. Due to the low AMM of the GW, its severity is determined as medium (Figure 14d). From the SO perspective, the risk severity is low. At 11 min, the GW keeps turning starboard, with her course increasing from 68.7° at 10 min to 80.1° at 11 min, which reduces the risk severity of the SO to the low level. At 12 min, the intruder occurs (marked as a five-pointed star in blue), which reduces the AMM of the GW and SO, therefore causing the risk severities of the GW and SO to increase to the medium level (Figure 14d). From 12 min to 14 min, both the GW and SO takes evasive action for collision avoidance (Figure 14c). As the three ships continue to approach each other, the AMM of the GW and SO continuously decreases. At 14 min, the SO’s AMM drops to a low level, so its risk severity increases to a high level (Figure 14d). At 15 min, the relative distance between the GW and SO is smaller than the radius of their SD (Figure 14b). Simultaneously, the risk severity of the GW increases to a high level (Figure 14d). After 15 min, these two ships gradually depart each other. There is no collision risk between the GW and SO from 16 min onwards. In summary, this dangerous crossing encounter is initiated by the SO’s turning to port at 10 min, but the occurrence of the intruder at 12 min increase the traffic complexity, which worsens the encounter situation.

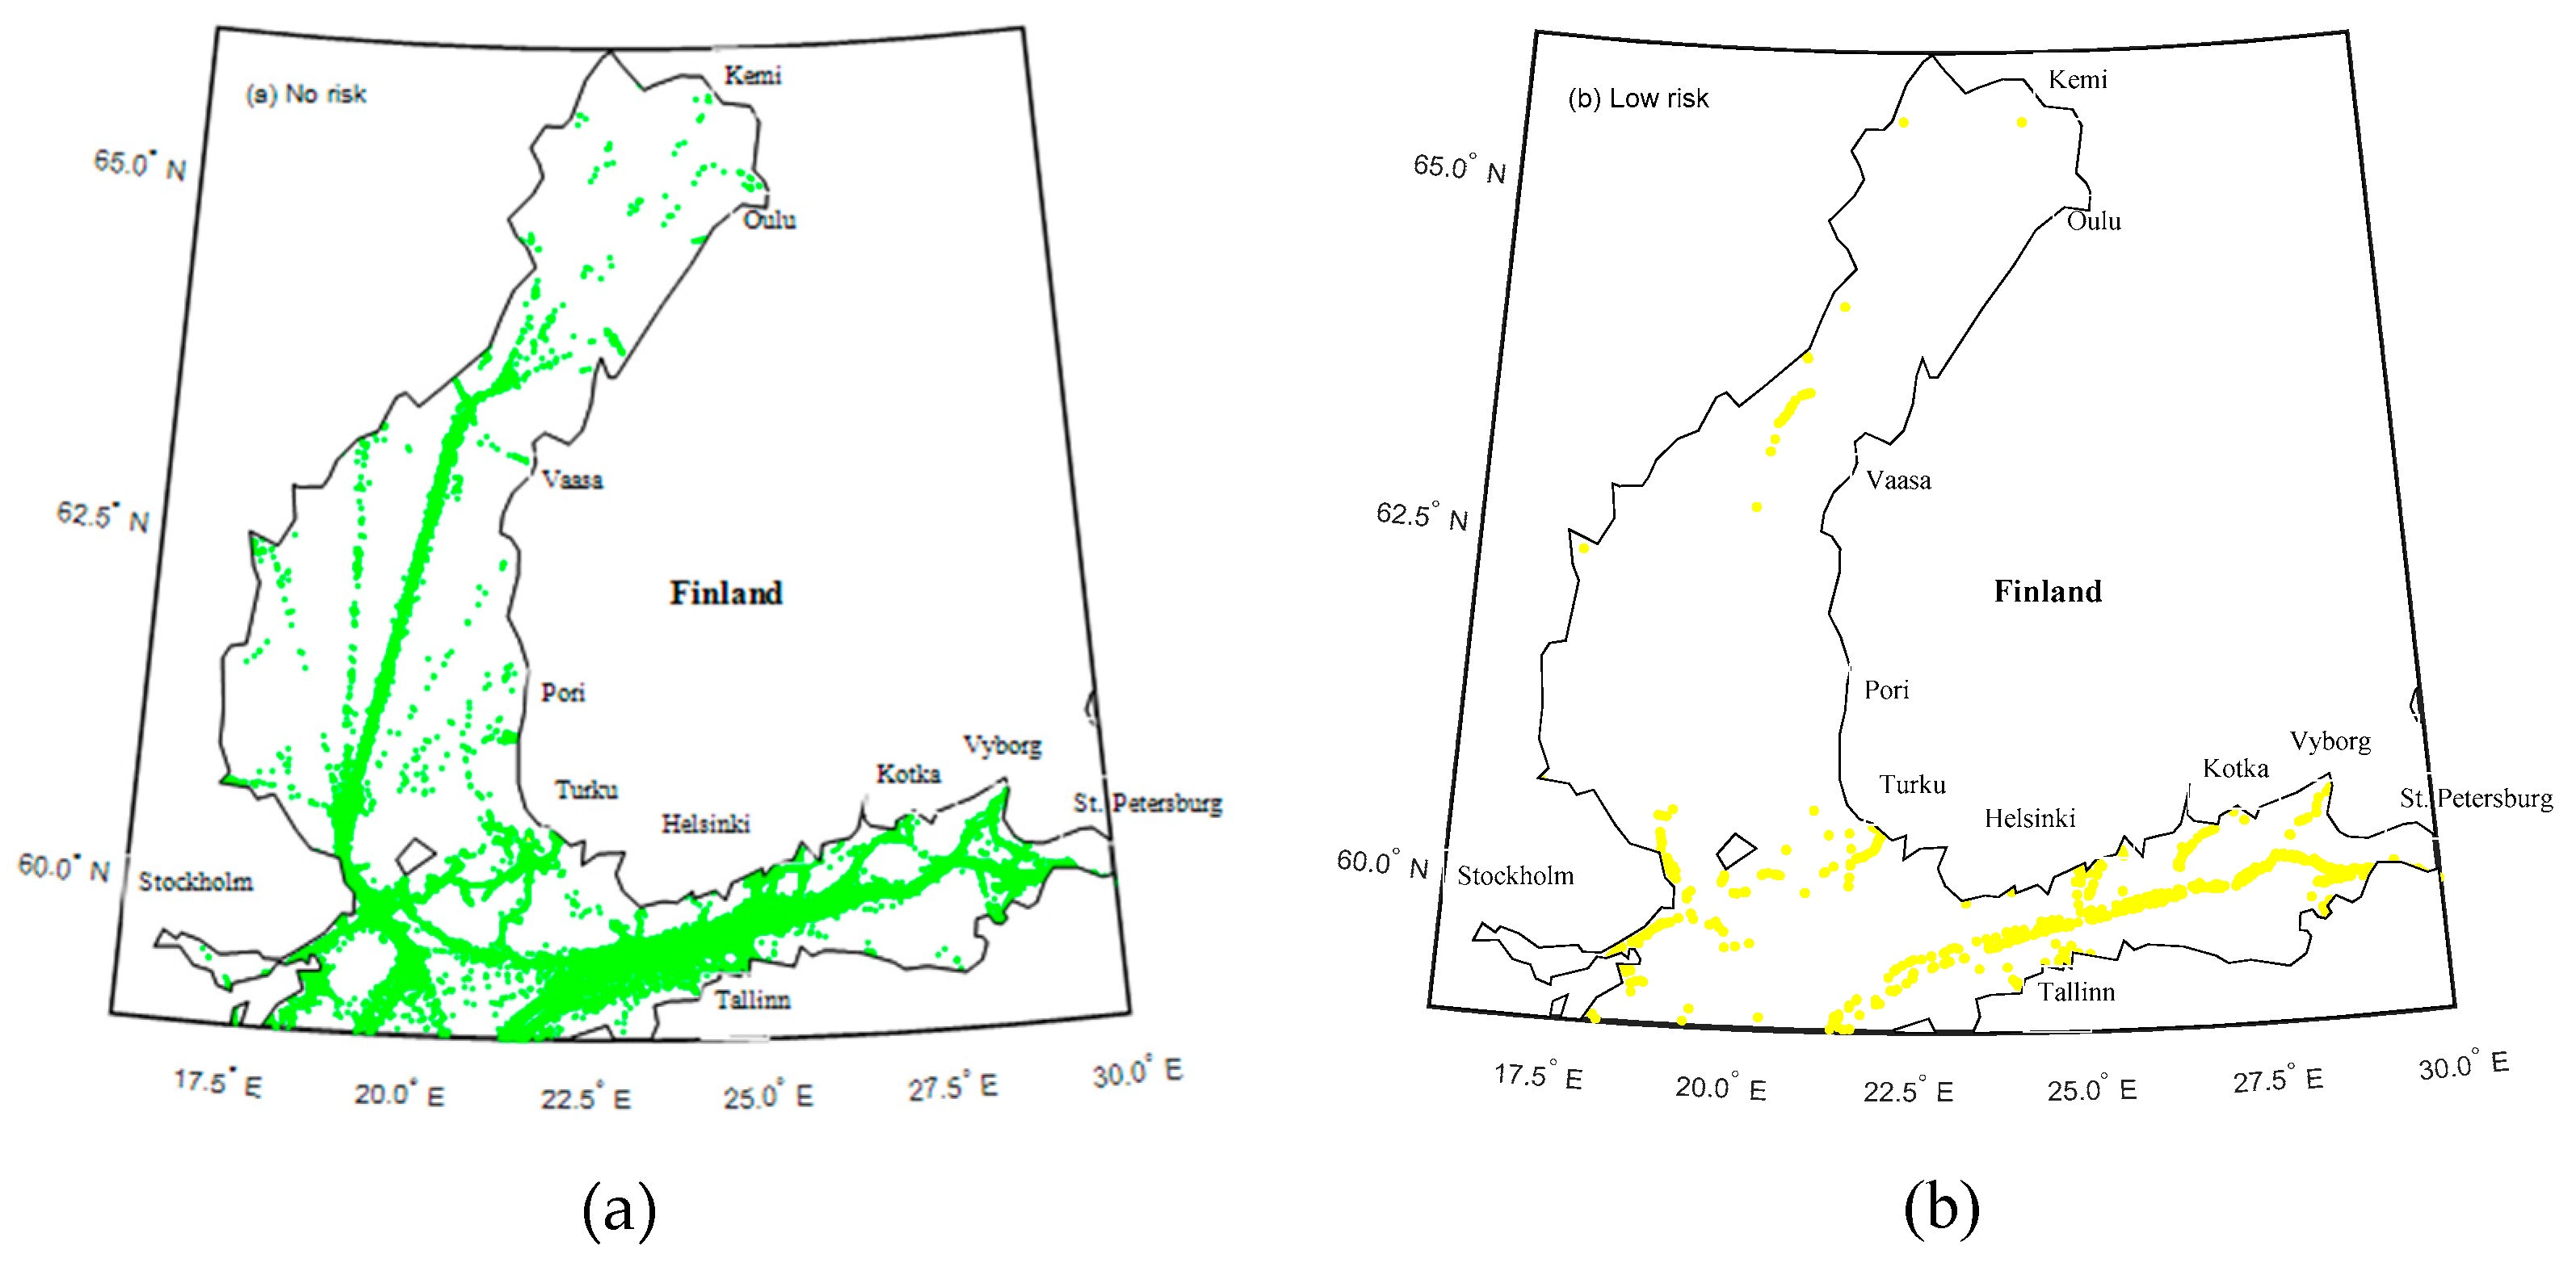
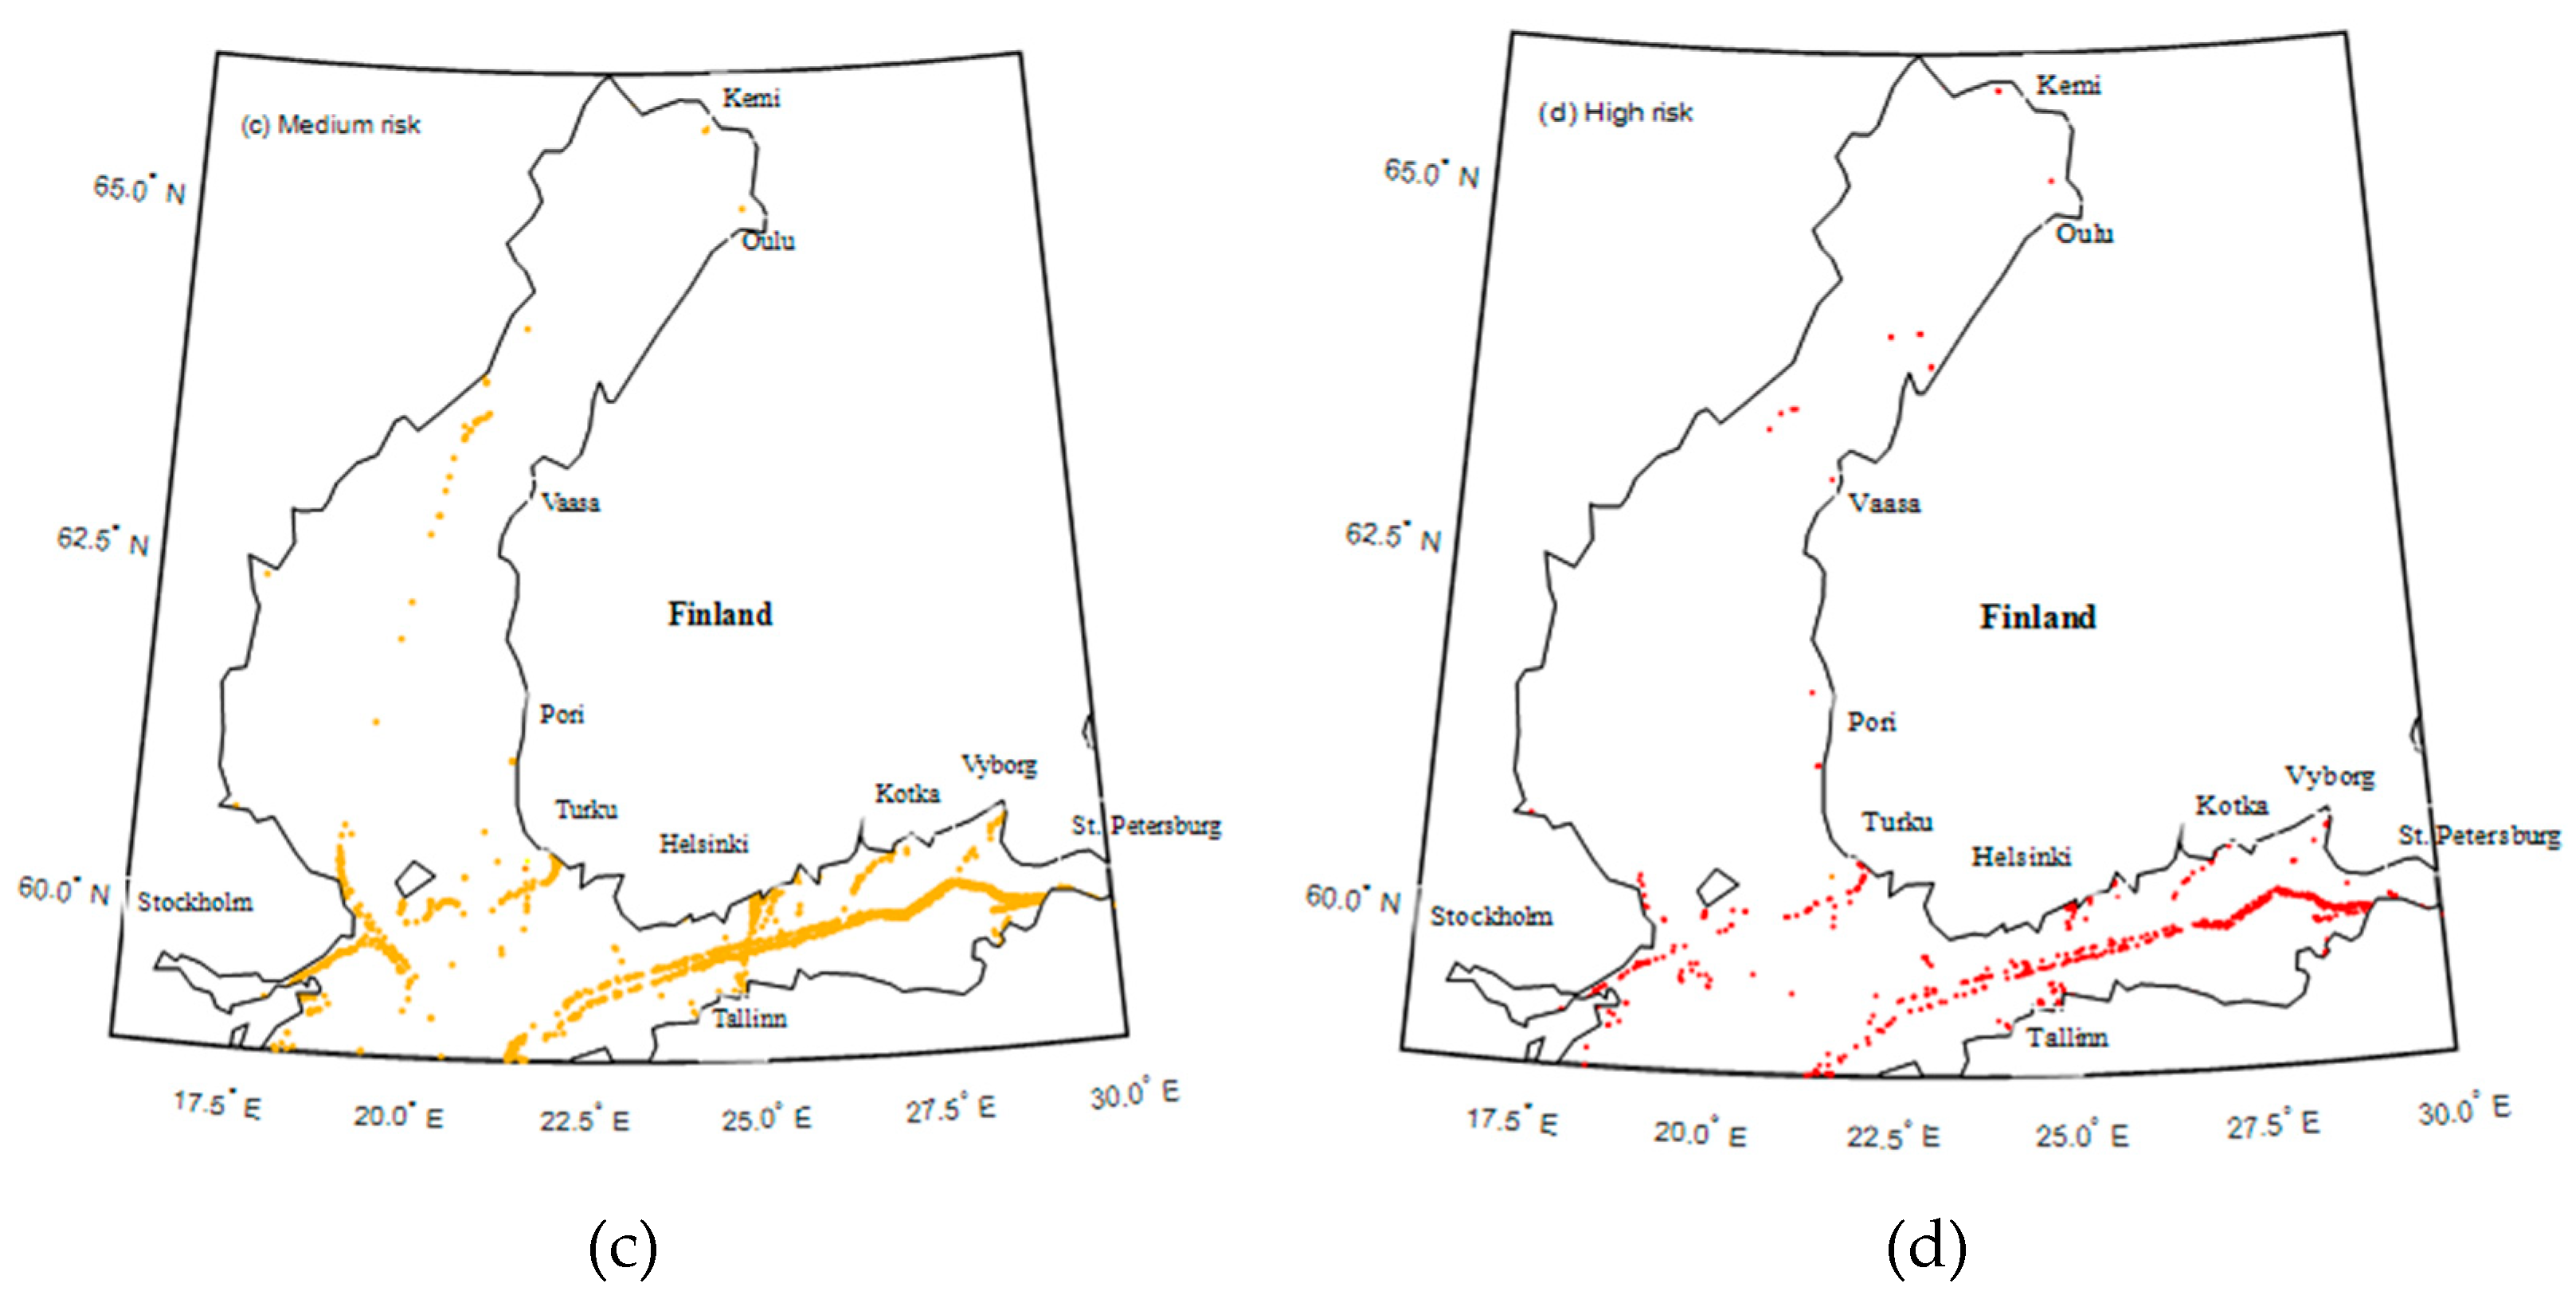
3.3. Near Miss Detection Results

The results of near miss detection for the Northern Baltic Sea are visualized in Figure 15. Different colors represent different risk severities. Consistent with the color set in Table 1, green, yellow, orange, and red represents no risk, low risk, medium risk, and high risk, respectively. Furthermore, the results are compared with another analysis with a similar purpose to demonstrate the plausibility of this proposed method. The studies conducted by COWI [48], and Zhang et al. [12], are employed as references—see Figure 16.
From Figure 15, the occurrence of these detected ship encounters is correlated to the major shipping lanes that lead to the ports. Our findings reveal that more than 91% of these encounters are without collision risk. The locations of encounters without collision risk appear randomly near the main shipping lanes. The locations of encounters with collision risk, including low, medium, and high risk, are mainly concentrated in the following waters: (1) the ship reporting areas in the Gulf of Finland, where the traffic separation schemes and the main east-west shipping lanes linking the Gulf of Finland to the Baltic Sea can be found; (2) the waterway crossing between Helsinki and Tallinn; (3) the sea area off Stockholm; (4) the waterway crossing between Stockholm and Turku; (5) the Northern Quark strait separating the Bothnian Sea and the Gulf of Bothnia, located in the west of Vaasa; (6) the water areas leading to the ports in Kotka, Vyborg, and St, Petersburg. Moreover, several dangerous encounters are also identified near the ports of Kemi, Oulu, Vaasa, Pori, etc. These dangerous encounters happen more frequently in such dense-traffic water areas.
Our results are in good agreement with the results of the ship collision risk analysis conducted in the Baltic Sea [48]—see Figure 16a. In Figure 16a, the bubble represents the predicted location of ship collision, and its size is proportionate to the ship collision probability. The bigger sized bubbles are the locations where ship collision has a high probability to occur, and they are consistent with the locations of detected dangerous encounters in our findings, including low, medium, and high risk. For instance, the reporting area in the Gulf of Finland is a hotpot of potential ship collision.
Zhang et al. [12] proposed a novel method (vessel conflict ranking operator (VCRO)) to detect possible near miss ship collisions in the Northern Baltic Sea (Figure 16b). As in our work, the AIS data of July 2011 in the Northern Baltic Sea are used. Our results are also generally consistent with their experimental results. However, our results describe more dangerous encounters detected, as an encounter is regarded as a process in this work. One is identified in the waterway crossing between Stockholm and Turku and another is near the far-right side of the ship reporting area in the Gulf of Finland leading to Vyborg port.
Based on these comparison analyses, the observed similarities suggest that the proposed method has a reasonable degree of validity.

3.4. Serious Encounter Analysis

The encounters with medium- and high-risk levels are regarded as serious encounters that are closer to ship collision and, therefore, require more focus in this work. Thus, we analyzed encounter situations with different ship sizes, ship types, and traffic conditions, and further calculated the occurrence ratio of serious encounters (Table 7). Ship size was divided into three groups: small, medium and large size, as described in Table 2.
Some findings from Table 7 are presented. First, ship type has a slight impact on the occurrence ratio of serious encounters. For passenger ships, the occurrence ratio of serious encounters is 17.86%, which decreases to 17.41% for tankers and to 13.44% for cargo ships. The possible reason for this is that passenger ships are mainly active in port waters, where traffic complicity is relatively high and multi-vessel encounters frequently occur. For tankers, their maneuverability is relatively low, thus leading to limited risk resolution.
Second, ship size has a negligible impact on the occurrence ratio of serious encounters. For different ship sizes, the ratio of serious encounters is around 6% for the passenger ship, which is around 5.9% for tankers and 4.5% for cargo ships.
Third, traffic complexity is a major contributing factor affecting the occurrence ratio of serious encounters. Specifically, the occurrence ratio of serious encounters increases significantly from the ship pair encounter to the multi-vessel encounter. For multi-ship encounters, the occurrence ratio of serious encounters in the presence of rule conflicts is more than twice that in the absence of rule conflicts. For instance, for the small-sized passenger ship, the occurrence ratio of serious encounters is 0.66% in the ship pair encounter, which increases to 1.54% in the multi-vessel encounter without rule conflict, and to 3.35% in the multi-vessel encounter with rule conflict. Figure 16 further demonstrates the impact of traffic complexity on the serious encounter. The ship number is selected as an indicator for traffic complexity as it is proportionate to it [38]. As can be seen in Figure 17, the occurrence ratio of serious encounters increases with the number of ships.

4. Discussion

4.1. Features and Advantages of the Proposed Method

The proposed method aims to improve the near miss detection by linking ship behavior with collision risk. To accurately understand ship behavior, we considered ship size, type, and maneuverability; the perceived risk of a navigator; traffic complexity; and the COLREGs. Moreover, the dynamic nature of ship behavior was also measured by adopting the concept of SPEE to regard the encounter as a process. The proposed method passed the model evaluation, as the results of near miss detection were consistent with other previous works.
The near miss detection method proposed in this paper incorporates some novelties. First, the impact of ship attributes, including size, type, and maneuverability, on ship behavior was considered. Ships with different types and sizes have different behavioral characteristics [47]. A ship with good maneuverability is more likely to take risky actions, the safe passing distance of which is likely to be shorter [37]. Our findings can attest this—see Table 2 and Table 7.
Second, the perceived risk of a navigator was considered. Many studies have suggested that the perceived risk of a navigator affects a ship’s evasive action [33,49]. In this work, the concept of AMM was utilized as a proxy to measure the perceived collision risk by the navigator. Furthermore, the boundary of the AMM for the division of the perceived risk of a navigator was statistically derived from the actual encounters—see Table 2.
Third, traffic complexity was utilized to measure the collision risk in the multi-vessel encounter by limiting the ship’s risk resolution. The multi-vessel encounter happens frequently in some dense water areas, which is consistent with our finding suggesting that 25,020 of these SPEE have intruders—see Figure 8. Further, Figure 16 reveals that traffic complexity leads to more near misses [38]. From the results illustrated in Section 3.4, the occurrence ratio of serious encounters increased significantly from the ship pair encounter to the multi-vessel encounter. The occurrence ratio of serious encounters in the multi-vessel encounter was 3.5 times that in the ship pair encounter—see Table 7.
Fourth, the COLREGs were explained. Rules 12, 15, 17, and 18 in COLREGs were designed to instruct the ship how to maneuver for safe passing in the ship pair encounter with good visibility. Any violation of the ship behavior may generate danger. In this work, the behavior of the GW that led to passing the SO by her bow was marked as medium risk. Moreover, the multi-vessel encounter situation is not directly included in the COLREGs rules. The decision regarding collision avoidance strategy relies on the knowledge and experience of the navigator in interpreting the situation based on the COLREGs rules for pairwise encounters [50]. Rule conflict was identified in this work. Rule conflict makes it more difficult for a ship to make action decisions, and, therefore, the occurrence ratio of serious encounters happens more frequently in the multi-vessel encounter when rule conflict exists (Table 7 and Figure 16). The occurrence ratio of serious encounters in the multi-vessel encounter was around 3.5 times of that in the ship pair encounter. For multi-ship encounters, the occurrence ratio of serious encounters in the presence of rule conflicts was more than twice that in the absence of rule conflicts.

4.2. Limitations and Future Improvements

Although the results of near miss detection and the model validity test are promising, the following aspects can be further strengthened to improve the accuracy of near miss detection.
First, ship maneuverability is roughly measured based on the Nomoto model, which may diminish the accuracy of the calculation of a ship’s AMM [36]. Although the Nomoto model is widely used because it is effective and relatively simple, it may not be suitable for ships using unconventional steering devices. Other more advanced ship motion models, such as the Maneuvering Modeling Group (MMG) model [51,52], could fix these deficiencies by considering more impact factors. Furthermore, ship maneuverability is affected by many contributing factors, including the load condition, channel condition (shallow water), and wave height, which are, however, not taken into consideration. This can be improved with expert judgement involvement.
Second, there is an assumption that a ship only alters its course for collision avoidance. Although this is consistent with many statistical works as course alternation is the most effective way for collision avoidance [26], it is quite a stringent simplification of the real processes of collision avoidance. Especially for those critical situations, such as at the last second before the collision, a ship will simultaneously change her course and speed for collision avoidance. In this work, the Douglas–Peucker algorithm was employed to identify ship behavior, so changes in ship speed were not detected.
Third, rule conflict is measured in a simple way. Rule conflict commonly occurs in multi-vessel encounter scenarios. To alert the navigator to act timely, the maximum value of the collision risk level of this ship being as a GW and a SO is determined as the final risk. Measuring the collision risk of this ship being as a GW and a SO separately and then combining the analysis results, instead of observing their collision risks as a whole, may underestimate the contextual risks. Some advanced system theories, including system-theoretic accident model processes, can help to measure this complex dynamic process [53,54,55]. In addition, the existence of rule conflicts for a longer time will be more likely to produce greater risks, which also requires future improvement.
Fourth, the circular-shaped ship domain is selected to simplify computations. However, ship domains specifically for open water [56] and restricted water [57] are different. In our work, more serious encounters were identified in the busy water area, such as the ship reporting area in the Gulf of Finland. This finding is consistent with [18], who suggested that more complicated traffic is more likely to generate more near misses. However, the simplicity of the sizes and shapes of ship domains may undermine the accuracy of near miss detection. For instance, some encounters with a close relative distance are normal operational practices and can be considered safe. Therefore, the choice of different SD for different channel characteristics can help overcome this limitation.
Moreover, ship visibility is not considered. Rules 12, 15, 17, and 18 in COLREGs are employed to determine the risk level of near miss. These regulations are designed to instruct a ship how to act for collision avoidance in good visibility. The AIS of July 2011 in the Northern Baltic Sea is used. Therefore, it is acceptable to assume that the visibility in the summertime in the Northern Baltic Sea is good, which is consistent with [1,41].

5. Conclusions

The presence of collision risk usually alerts a ship to be prepared to maneuver for collision avoidance. However, the relationship between ship behavior and collision risk is not fully clarified. Therefore, a novel method for improving the near miss detection from AIS data is presented in this paper by linking ship behavior to collision risk. This work focuses on obtaining insight in ship behavior characteristics during the process of collision avoidance. The impacts of ship attributes (e.g., ship size, ship type, and ship maneuverability), perceived risk of a navigator, traffic complexity, and traffic rules on ship behavior are considered. The collision risk is detected based on the NLVO algorithm. The ship action is identified by adopting the DP algorithm. The concept of AMM is utilized as a proxy to measure the perception of a navigator. Traffic complexity is employed to measure the ship traffic situation. The COLREGs are also explained, and any violation of the COLREGs is regarded as a potential danger. The risk severity of the detected near miss is further quantified into four levels in accordance with the alert management in [43]. Finally, this proposed method is validated by the following two steps: first, several demonstrations are presented to evaluate whether this proposed method can differentiate scenarios with different risk levels; second, this method is applied to the Northern Baltic Sea. The results of near miss detection are compared with the work conducted by COWI [48], and Zhang et al. [12]. The validity evaluation of this proposed method yields reasonably positive results.
The findings of the application of the proposed framework provide useful information to support the development of preventive measures to enhance navigational safety, such as setting precautionary areas in the hotspot areas. One main finding is the identification of hotspot areas. These hotspot areas are the water areas with dense traffic, including the ship reporting areas in the Gulf of Finland, the channel leading to the ports, and the water areas near the port. Another main finding is that traffic complexity is among the major contributing factors leading to a serious encounter. The occurrence ratio of serious encounters in multi-vessel encounters is around 3.5 times of that in ship pair encounters. For multi-ship encounters, the occurrence ratio of serious encounters in the presence of rule conflicts is more than twice that in the absence of rule conflicts. Moreover, ship type has a slight impact on the occurrence ratio of serious encounters. The passenger ship is the most dangerous ship type because it is mainly active in port waters, where the traffic complicity is relatively high.
Nonetheless, several aspects that can be further strengthened to improve the accuracy of near miss detection are also highlighted. First, the utilization of a more advanced model to measure ship maneuverability contributes to the more accurate calculation of the AMM., changes in ship speed to avoid collisions need to be considered when identifying Second the ship evasive action. Third, rule conflict is simplified in our work. Because this frequently occurring phenomenon is very complicated, future effort is needed to further our understanding of it. Moreover, the choice of proper SD for different channel characteristics provides assistance in improving the accuracy and reliability of near miss detection.

Author Contributions

Conceptualization, Methodology, Data curation, Writing—original draft preparation, Writing—review & editing, Visualization, Formal analysis, L.D.; Supervision, Writing—review & editing, Investigation, O.A.V.B., Writing—review & editing, Supervision, Investigation, F.G.; Supervision, Funding acquisition, Project administration, P.K.; Data curation, Validation, W.Z. All authors have read and agreed to the published version of the manuscript.

Funding

This work was funded by the China Scholarship Council (Grant Number: 201606951009) and Marine Technology research group in Aalto University (9170094). The contributions by the third author were supported by funding from the Canada First Research Excellence Fund through the Ocean Frontier Institute.

Institutional Review Board Statement

Not applicable.

Informed Consent Statement

Not applicable.

Data Availability Statement

Data sharing not applicable.

Conflicts of Interest

The authors declare that they have no known competing financial interests or personal relationships that could have appeared to influence the work reported in this paper.

Abbreviations

Abbreviations
AISautomatic identification systemMMSIMaritime Mobile Service Identity
AMMavailable maneuvering marginNLVOnon-linear VO
COLREGsConvention on the International Regulations for Preventing Collisions at SeaOSown ship
CPACloset point of approach RBrelative bearing
CR-GWmcollision risk module for a GW in the multi-vessel encounter scenarioRHrelative heading
CR-GWpcollision risk module for a GW in the ship pair encounter scenarioROTrate of turn
CR-RCmcollision risk module for a ship in the multi-vessel encounter scenario with rule conflictSCship count
CR-SOmcollision risk module for a SO in the multi-vessel encounter scenarioSDship domain
CR-SOpcollision risk module for a SO in the ship pair encounter scenarioSOstand-on ship
DP algorithmDouglas–Peucker algorithmSPEEship pair encounter event
GWgive-way shipTStarget ship
IMOInternational Maritime Organization TCPAtime to CPA
MMGManeuvering Modeling GroupVCROvessel conflict ranking operator
Notations
A M M value of calculated AMM L a t latitude
A M M 1 upper limit of AMM L o n longitude
A M M 2 lower limit of AMM RV reachable ship velocity
A Q ship action quality index S N L _ V O velocity obstacle zone in TS’s velocity space
ColCOLREGs scrutiny index t o b observation time
C ship course t min D i s moment of closet point of approach
C R S P E E collision risk of each ship of SPEE t S P E E time period of SPEE
D i s L i m i t distance limit δ a total available rudder angle
H ship heading δ s adopted rudder angle that can eliminate the existing collision risk
I C conflict index S N L _ V O ( t ) union of S N L _ V O of all the surrounding ships
Intship action intention index V ship speed
L A M M level of AMM

References

  1. Kujala, P.; Hänninen, M.; Arola, T.; Ylitalo, J. Analysis of the marine traffic safety in the Gulf of Finland. Reliab. Eng. Syst. Saf. 2009, 94, 1349–1357. [Google Scholar] [CrossRef]
  2. Valdez Banda, O.A.; Goerlandt, F.; Montewka, J.; Kujala, P. A risk analysis of winter navigation in Finnish sea areas. Accid. Anal. Prev. 2015, 79, 100–116. [Google Scholar] [CrossRef] [PubMed]
  3. Lu, L.; Goerlandt, F.; Banda OA, V.; Kujala, P.; Höglund, A.; Arneborg, L. A Bayesian Network risk model for assessing oil spill recovery effectiveness in the ice-covered Northern Baltic Sea. Mar. Pollut. Bull. 2019, 139, 440–458. [Google Scholar] [CrossRef] [PubMed]
  4. Zhang, W.; Zou, Z.; Wang, J.; Du, L. Multi-ship following operation in ice-covered waters with consideration of inter-ship communication. Ocean Eng. 2020, 210, 107545. [Google Scholar] [CrossRef]
  5. HELCOM. Annual Report on Shipping Accidents in the Baltic Sea in 2013. 2014. Available online: https://helcom.fi/media/publications/Annual-report-on-shipping-accidents-in-the-Baltic-Sea-area-during-2013.pdf (accessed on 9 February 2021).
  6. HELCOM. Report on Shipping Accidents in the Baltic Sea from 2014 to 2017. 2018. Available online: http://www.helcom.fi/Lists/Publications/Report%20on%20shipping%20accidents%20in%20the%20Baltic%20Sea%20from%202014%20to%202017.pdf (accessed on 9 February 2021).
  7. Chen, X.; Xu, X.; Yang, Y.; Wu, H.; Tang, J.; Zhao, J. Augmented ship tracking under occlusion conditions from maritime surveillance videos. IEEE Access 2020, 8, 42884–42897. [Google Scholar] [CrossRef]
  8. Wang, L.; Li, Y.; Wan, Z.; Yang, Z.; Wang, T.; Guan, K.; Fu, L. Use of AIS data for performance evaluation of ship traffic with speed control. Ocean Eng. 2020, 204, 107259. [Google Scholar] [CrossRef]
  9. Zhang, M.; Zhang, D.; Fu, S.; Yan, X.; Goncharov, V. Safety distance modeling for ship escort operations in Arctic ice-covered waters. Ocean Eng. 2017, 146, 202–216. [Google Scholar] [CrossRef]
  10. Zhang, M.; Zhang, D.; Yao, H.; Zhang, K. A probabilistic model of human error assessment for autonomous cargo ships focusing on human–autonomy collaboration. Saf. Sci. 2020, 130, 104838. [Google Scholar] [CrossRef]
  11. Debnath, A.K.; Chin, H.C. Navigational traffic conflict technique: A proactive approach to quantitative measurement of collision risks in port waters. J. Navig. 2010, 63, 137–152. [Google Scholar] [CrossRef] [Green Version]
  12. Zhang, W.; Goerlandt, F.; Montewka, J.; Kujala, P. A method for detecting possible near miss ship collisions from AIS data. Ocean Eng. 2015, 107, 60–69. [Google Scholar] [CrossRef]
  13. Zhang, L.; Meng, Q.; Xiao, Z.; Fu, X. A novel ship trajectory reconstruction approach using AIS data. Ocean Eng. 2018, 159, 165–174. [Google Scholar] [CrossRef]
  14. Du, L.; Goerlandt, F.; Kujala, P. Review and analysis of methods for assessing maritime waterway risk based on non-accident critical events detected from AIS data. Reliab. Eng. Syst. Saf. 2020, 200, 106933. [Google Scholar] [CrossRef]
  15. Qu, X.; Meng, Q.; Suyi, L. Ship collision risk assessment for the Singapore Strait. Accid. Anal. Prev. 2011, 43, 2030–2036. [Google Scholar] [CrossRef] [PubMed] [Green Version]
  16. Goerlandt, F.; Montewka, J.; Lammi, H.; Kujala, P. Analysis of near collisions in the Gulf of Finland. In Advances in Safety, Reliability and Risk Management; Taylor & Francis Group: London, UK, 2012; pp. 2880–2886. [Google Scholar]
  17. Weng, J.; Xue, S. Ship collision frequency estimation in port fairways: A case study. J. Navig. 2015, 68, 602–618. [Google Scholar] [CrossRef] [Green Version]
  18. van Iperen, W.H. Classifying ship encounters to monitor traffic safety on the North Sea from AIS data. Transnav Int. J. Mar. Navig. Saf. Sea Transp. 2015, 9, 51–58. [Google Scholar] [CrossRef] [Green Version]
  19. Zhang, W.; Goerlandt, F.; Kujala, P.; Wang, Y. An advanced method for detecting possible near miss ship collisions from AIS data. Ocean Eng. 2016, 124, 141–156. [Google Scholar] [CrossRef]
  20. Zhang, W.; Kopca, C.; Tang, J.; Ma, D.; Wang, Y. A Systematic Approach for Collision Risk Analysis based on AIS Data. J. Navig. 2017, 70, 1117–1132. [Google Scholar] [CrossRef]
  21. Szłapczyński, R.; Niksa-Rynkiewicz, T. A framework of a ship domain-based near-miss detection method using mamdani neuro-fuzzy classification. Pol. Marit. Res. 2018, 25, 14–21. [Google Scholar] [CrossRef] [Green Version]
  22. Hörteborn, A.; Ringsberg, J.W.; Svanberg, M. A comparison of two definitions of ship domain for analysing near ship–ship collisions. In Developments in the Collision and Grounding of Ships and Offshore Structures: Proceedings of the 8th International Conference on Collision and Grounding of Ships and Offshore Structures (ICCGS 2019), Lisbon, Portugal, 21–23 October 2019; CRC Press: Boca Raton, FL, USA, 2019; p. 308. [Google Scholar]
  23. Wu, X.; Mehta, A.L.; Zaloom, V.A.; Craig, B.N. Analysis of waterway transportation in Southeast Texas waterway based on AIS data. Ocean Eng. 2016, 121, 196–209. [Google Scholar] [CrossRef]
  24. Chen, P.; Huang, Y.; Mou, J.; van Gelder, P.H.A.J.M. Ship collision candidate detection method: A velocity obstacle approach. Ocean Eng. 2018, 170, 186–198. [Google Scholar] [CrossRef]
  25. Du, L.; Banda, O.V.; Kujala, P. An intelligent method for real-time ship collision risk assessment and visualization. In Developments in the Collision and Grounding of Ships and Offshore Structures: Proceedings of the 8th International Conference on Collision and Grounding of Ships and Offshore Structures (ICCGS 2019), Lisbon, Portugal, 21–23 October 2019; CRC Press: Boca Raton, FL, USA, 2019; p. 293. [Google Scholar]
  26. Baldauf, M.; Mehdi, R.; Fischer, S.; Gluch, M. A Perfect Warning to avoid collisions at sea? Sci. J. Marit. Univ. Szczec. 2017, 49, 53–64. [Google Scholar]
  27. Mestl, T.; Tallakstad, K.T.; Castberg, R. Identifying and analyzing safety critical maneuvers from high resolution AIS data. Transnav Int. J. Mar. Navig. Saf. Sea Transp. 2016, 10, 69–77. [Google Scholar] [CrossRef] [Green Version]
  28. Baldauf, M.; Mehdi, R.; Deeb, H.; Schröder-Hinrichs, J.U.; Benedict, K.; Krüger, C.; Fischer, S.; Gluch, M. Manoeuvring areas to adapt ACAS for the maritime domain. Zesz. Nauk. Akad. Mor. Szczec. 2015, 43, 39–47. [Google Scholar]
  29. Montewka, J.; Hinz, T.; Kujala, P.; Matusiak, J. Probability modelling of vessel collisions. Reliab. Eng. Syst. Saf. 2010, 95, 573–589. [Google Scholar] [CrossRef]
  30. Zhuo, Y.; Tang, T. An intelligent decision support system to ship anti-collision in multi-ship encounter. In Proceedings of the 2008 7th World Congress on Intelligent Control and Automation, Chongqing, China, 25–27 June 2008; pp. 1066–1071. [Google Scholar]
  31. Du, L.; Goerlandt, F.; Valdez Banda, O.A.; Huang, Y.; Wen, Y.; Kujala, P. Improving stand-on ship’s situational awareness by estimating the intention of the give-way ship. Ocean Eng. 2020, 201, 107110. [Google Scholar] [CrossRef]
  32. COLREGs-Conventions on the International Regulations for Preventing Collision at Sea; International Maritime Organization (IMO): London, UK, 1972.
  33. Chauvin, C.; Lardjane, S. Decision making and strategies in an interaction situation: Collision avoidance at sea. Transp. Res. Part F Traffic Psychol. Behav. 2008, 11, 259–269. [Google Scholar] [CrossRef]
  34. Du, L.; Valdez Banda, O.A.; Goerlandt, F.; Huang, Y.; Kujala, P. A COLREG-compliant ship collision alert system for stand-on vessels. Ocean Eng. 2020, 218, 107866. [Google Scholar] [CrossRef]
  35. Huang, Y.; van Gelder, P.H.A.J.M. Collision risk measure for triggering evasive actions of maritime autonomous surface ships. Saf. Sci. 2020, 127, 104708. [Google Scholar] [CrossRef]
  36. Du, L.; Valdez Banda, O.A.; Huang, Y.; Goerlandt, F.; Kujala, P.; Zhang, W. An empirical ship domain based on evasive maneuver and perceived collision risk. Reliab. Eng. Syst. Saf. 2020. under review. [Google Scholar]
  37. Goerlandt, F.; Montewka, J.; Kuzmin, V.; Kujala, P. A risk-informed ship collision alert system: Framework and application. Saf. Sci. 2015, 77, 182–204. [Google Scholar] [CrossRef] [Green Version]
  38. van Westrenen, F.; Ellerbroek, J. The effect of traffic complexity on the development of near misses on the North Sea. IEEE Trans. Syst. Manand Cybern. Syst. 2015, 47, 432–440. [Google Scholar] [CrossRef] [Green Version]
  39. Tam, C.; Bucknall, R. Collision risk assessment for ships. J. Mar. Sci. Technol. 2010, 15, 257–270. [Google Scholar] [CrossRef]
  40. Juszkiewicz, W. Verification of the accuracy requirements for relative course and closest point of approach. Zesz. Nauk. Akad. Morska Szczec. 2016, 45, 108–113. [Google Scholar]
  41. Asmi, E.; Kivekäs, N.; Kerminen, V.M.; Komppula, M.; Hyvärinen, A.P.; Hatakka, J.; Viisanen, Y.; Lihavainen, H. Secondary new particle formation in Northern Finland Pallas site between the years 2000 and 2010. Atmos. Chem. Phys. Discuss. 2011, 11, 12959–12972. [Google Scholar] [CrossRef] [Green Version]
  42. Huang, Y.; van Gelder, P.H.A.J.M. Non-linear velocity obstacles with applications to the maritime domain. In Proceedings of the 7th International Congress on Maritime Transportation and Harvesting of Sea Resources, Lisbon, Portugal, 9–11 October 2017. [Google Scholar]
  43. IMO. Adoption of the Revised Performance Standards for Integrated Navigation Systems (INS); Resolution MSC 83/23/Add.3-ANNEX 30; IMO: London, UK, 2007. [Google Scholar]
  44. Douglas, D.H.; Peucker, T.K. Algorithms for the reduction of the number of points required to represent a digitized line or its caricature. Cartogr. Int. J. Geogr. Inf. Geovis. 1973, 10, 112–122. [Google Scholar] [CrossRef] [Green Version]
  45. d’Engelbronner, J.G.; Borst, C.; Ellerbroek, J.; Van Paassen, M.M.; Mulder, M. Solution-space–based analysis of dynamic air traffic controller workload. J. Aircr. 2015, 52, 1146–1160. [Google Scholar] [CrossRef]
  46. HELCOM. HELCOM Recommendation 33/1—Unified Interpretation in Relation to Access to and Use of HELCOM AIS; Helsinki Commission, Baltic Marine Environment Protection Commission: Helsinki, Finland, 2012. [Google Scholar]
  47. Zhou, Y.; Daamen, W.; Vellinga, T.; Hoogendoorn, S.P. Ship classification based on ship behavior clustering from AIS data. Ocean Eng. 2019, 175, 176–187. [Google Scholar] [CrossRef]
  48. COWI. BRISK—Sub-Regional Risk of Spill of Oil and Haardous Substances in the Baltic Sea; COWI: Copenhagen, Denmark, 2012. [Google Scholar]
  49. Kim, D.H. Human factors influencing the ship operator’s perceived risk in the last moment of collision encounter. Reliab. Eng. Syst. Saf. 2020, 203, 107078. [Google Scholar] [CrossRef]
  50. Brcko, T. Determining the most immediate danger during a multi-vessel encounter. In Proceedings of the 18th International Conference on Transport Science (ICTS 2018), Portrož, Slovenia, 14–15 June 2018; pp. 57–64. [Google Scholar]
  51. Tao, J.; Du, L.; Dehmer, M.; Wen, Y.; Xie, G.; Zhou, Q. Path following control for towing system of cylindrical drilling platform in presence of disturbances and uncertainties. ISA Trans. 2019, 95, 185–193. [Google Scholar] [CrossRef] [PubMed]
  52. Taimuri, G.; Matusiak, J.; Mikkola, T.; Kujala, P.; Hirdaris, S. A 6-DoF maneuvering model for the rapid estimation of hydrodynamic actions in deep and shallow waters. Ocean Eng. 2020, 218, 108103. [Google Scholar] [CrossRef]
  53. Valdez Banda, O.A.; Goerlandt, F. A STAMP-based approach for designing maritime safety management systems. Saf. Sci. 2018, 109, 109–129. [Google Scholar] [CrossRef]
  54. Valdez Banda, O.A.; Kannos, S.; Goerlandt, F.; van Gelder, P.H.; Bergström, M.; Kujala, P. A systemic hazard analysis and management process for the concept design phase of an autonomous vessel. Reliab. Eng. Syst. Saf. 2019, 191, 106584. [Google Scholar] [CrossRef]
  55. Chaal, M.; Banda OA, V.; Glomsrud, J.A.; Basnet, S.; Hirdaris, S.; Kujala, P. 2020. A framework to model the STPA hierarchical control structure of an autonomous ship. Saf. Sci. 2020, 132, 104939. [Google Scholar] [CrossRef]
  56. Pietrzykowski, Z.; Uriasz, J. The ship domain–a criterion of navigational safety assessment in an open sea area. J. Navig. 2009, 62, 93–108. [Google Scholar] [CrossRef]
  57. Wang, Y.; Chin, H.C. An empirically-calibrated ship domain as a safety criterion for navigation in confined waters. J. Navig. 2016, 69, 257–276. [Google Scholar] [CrossRef] [Green Version]
Figure 1. Conceptual diagram of how to link ship behavior to collision risk.
Jmse 09 00180 g001
Figure 2. The designed algorithm for near miss detection by analyzing ship behavior characteristic during the encounter process.
Jmse 09 00180 g002
Figure 3. Determining the near miss severity of a GW in the ship pair encounter scenario—see the CR-GWp module in Step III in Figure 2.
Jmse 09 00180 g003
Figure 4. Determining the near miss severity of a SO in the ship pair encounter scenario—see CR-SOp module in Step III in Figure 2.
Jmse 09 00180 g004
Figure 5. Ship’s resolution space decreases in the multi-vessel encounter scenario: (a) in geographical space; (b) in velocity space.
Jmse 09 00180 g005
Figure 6. Determining the near miss severity of a GW in the multi-vessel encounter scenario when there is no rule conflict—see the CR-GWm module in Step III in Figure 2.
Jmse 09 00180 g006
Figure 7. Determining the near miss severity of a SO in the multi-vessel encounter scenario when there is no rule conflict—see the CR-SOm module in Step III in Figure 2.
Jmse 09 00180 g007
Figure 8. Determining the near miss severity of a ship in the multi-vessel encounter scenario when rule conflict exists—see the CR-RCm module in Step III in Figure 2.
Jmse 09 00180 g008
Figure 9. Statistical histogram of ship numbers for each SPEE at every time step.
Jmse 09 00180 g009
Figure 10. Illustration of the near miss detection and analysis in the ship pair encounter in Scenario 1: (a) ship trajectory; (b) ship relative distance; (c) ship course; (d) risk severity.
Jmse 09 00180 g010
Figure 11. Illustration of the near miss detection and analysis in the ship pair encounter in Scenario 2: (a) ship trajectory; (b) ship relative distance; (c) ship course; (d) risk severity.
Jmse 09 00180 g011
Figure 12. Illustration of the near miss detection and analysis in the ship pair encounter in Scenario 3: (a) ship trajectory; (b) ship relative distance; (c) ship course; (d) risk severity.
Jmse 09 00180 g012
Figure 13. Illustration of the near miss detection and analysis in the ship pair encounter in Scenario 4: (a) ship trajectory; (b) ship relative distance; (c) ship course; (d) risk severity.
Jmse 09 00180 g013
Figure 14. Illustration of the near miss detection and analysis in the multi-vessel encounter scenario: (a) ship trajectory; (b) ship relative distance; (c) ship course; (d) risk severity.
Jmse 09 00180 g014
Figure 15. Visualization of the near miss detection for the Northern Baltic Sea: (a) No risk; (b) Low risk; (c) Medium risk; (d) High risk.
Jmse 09 00180 g015aJmse 09 00180 g015b
Figure 16. Two existing work of collision risk analysis for the Northern Baltic Sea: (a) COWI [48]; (b) Zhang et al. [12].
Jmse 09 00180 g016
Figure 17. Ratio of serious encounters varies with ship number.
Jmse 09 00180 g017
Table 1. Division of the severity of near miss into four levels.
Near Miss SeverityCriteria
GWSO
No risk IC = 0(1) IC = 0
Low riskIC = 1; LAMM = H(1) IC = 1; Int = 1; AQ = 1; Col = 1
(2) IC = 1; Int = 1; AQ = −1; LAMM =H; Col = 1
Medium riskIC = 1; LAMM = M(1) IC = 1; Int = 1; AQ = 1; Col = 0
(2) IC = 1; Int = 1; AQ = −1; LAMM =M; Col = 1
(3) IC = 1; Int = 0; AQ = −1; LAMM =H; Col = 0
(4) IC = 1; Int = 0; AQ = −1; LAMM =M; Col = 0
High riskIC = 1; LAMM = L(1) IC = 1; Int = 1; AQ = −1; LAMM =L; Col = 0
(2) IC = 1; Int = 0; AQ = −1; LAMM =L; Col = 0
Note: L A M M presents the level of AMM; IC is the conflict index. IC = 0 means no conflict, and IC = 1 means existing conflict; Int is ship action intention index. Int = 1 means that the GW takes evasive action, and Int = 0 means no evasive action from the GW; AQ is ship action quality index. AQ = 1 means the existing conflict can be eliminated by the GW’s evasive action alone, while AQ = −1 means that the GW’s evasive action is not efficient; Col is COLREGs scrutiny index. Col =1 means that the GW obeys the COLREGs, while Col = 0 means that the GW violates the COLREGs.
Table 2. AMM thresholds derived from the actual encounters in AIS data based on the method proposed by Du et al. [36].
Ship TypeCOLREGs Identity AMM   Threshold   ( A M M 1 / A M M 2 )
Small SizeMedium SizeLarge Size
Passenger ShipGW0.986/0.5860.914/0.4860.814/0.343
SO0.943/0.4430.786/0.3140.729/0.229
TankerGW0.871/0.4710.829/0.3140.8/0.229
SO0.857/0.3710.629/0.2140.486/0.186
Cargo ShipGW0.9/0.40.886/0.3430.871/0.257
SO0.729/0.3140.5/0.2430.486/0.157
Table 3. Counts of GW and SO with different ship types and ship size in all SPEEs under collision threat [36].
Ship SizePassenger ShipsTankersCargo Ships
GWSO GWSOGWSO
Small120111459193493560
Medium80168953352611681049
Large472396997010077
Table 4. Ship attributes in four typical ship pair encounter scenarios.
Ship AttributesCOLREGs IdentityMMSITypeLength (m)Width (m)Initial State
PositionCourseSpeed(kn)
Scenario
1
/21047XXXXCargo Ship871359.5548°N
23.7341°E
101.7°9.2
/30432XXXXCargo Ship881359.5094°N
23.7724°E
61.1°9.2667
Scenario
2
GW20941XXXXCargo Ship1081559.5757°N
20.1588°E
312.7°8.5667
SO21023XXXXCargo Ship901359.6044°N
20.224°E
274.8°10.8
Scenario
3
GW21024XXXXCargo Ship1462063.3732°N
20.5109°E
29°14.7
SO24613XXXXCargo Ship1001363.3931°N
20.552°E
28°10.84
Scenario
4
GW21043XXXXCargo Ship1201659.9142°N
19.4137°E
138.7°11.383
SO26500XXXXPassenger Ship2033259.7527°N
19.296°E
71.3°19.4
Table 5. Ship COLREGs identity determination in four typical ship pair encounter scenarios.
Encounter Scenarios t C O L R B G W R H G W R B S O R H S O
Scenario 1/////
Scenario 217 min122.8°326.4°336.2°33.6°
Scenario 317 min43.63°358.14°225.23°1.6°
Scenario 414 min76.15°268.1°348.04°91.9°
Table 6. Ship attributes in the multi-vessel encounter scenario.
COLREGs IdentityMMSITypeLengthWidthInitial State
(m)(m)PositionCourseSpeed(kn)
GW23099XXXXPassenger Ship481060.1579°N
21.3986°E
49.2°12.2
SO23015XXXXPassenger Ship1712860.2103°N
21.5856°E
251°16.3
Intruder26512XXXXPassenger Ship1552260.2154°N
21.6411°E
260.7°17.3
Table 7. Impact of ship attributes and traffic complexity on the occurrence of serious encounters.
Ship TypeShip SizeOccurrence Ratio
Ship Pair EncounterMulti-Vessel Encounter Without Rule ConflictMulti-Vessel Encounter with Rule ConflictTotal
Passenger shipSmall0.66%1.54%3.35%5.55%
Medium1.32%1.61%3.21%6.14%
Large1.21%1.57%3.39%6.17%
TankerSmall1.64%1.4%3.02%6.06%
Medium0.94%1.74%3.24%5.92%
Large1.51%1.04%2.88%5.43%
Cargo shipSmall1.12%1.19%2.25%4.56%
Medium1.12%1.18%2.42%4.72%
Large1.25%0.67%2.24%4.16%
Publisher’s Note: MDPI stays neutral with regard to jurisdictional claims in published maps and institutional affiliations.

