
Constitutive Modeling of Physical Properties of Coastal Sand during Tunneling Construction Disturbance

Abstract
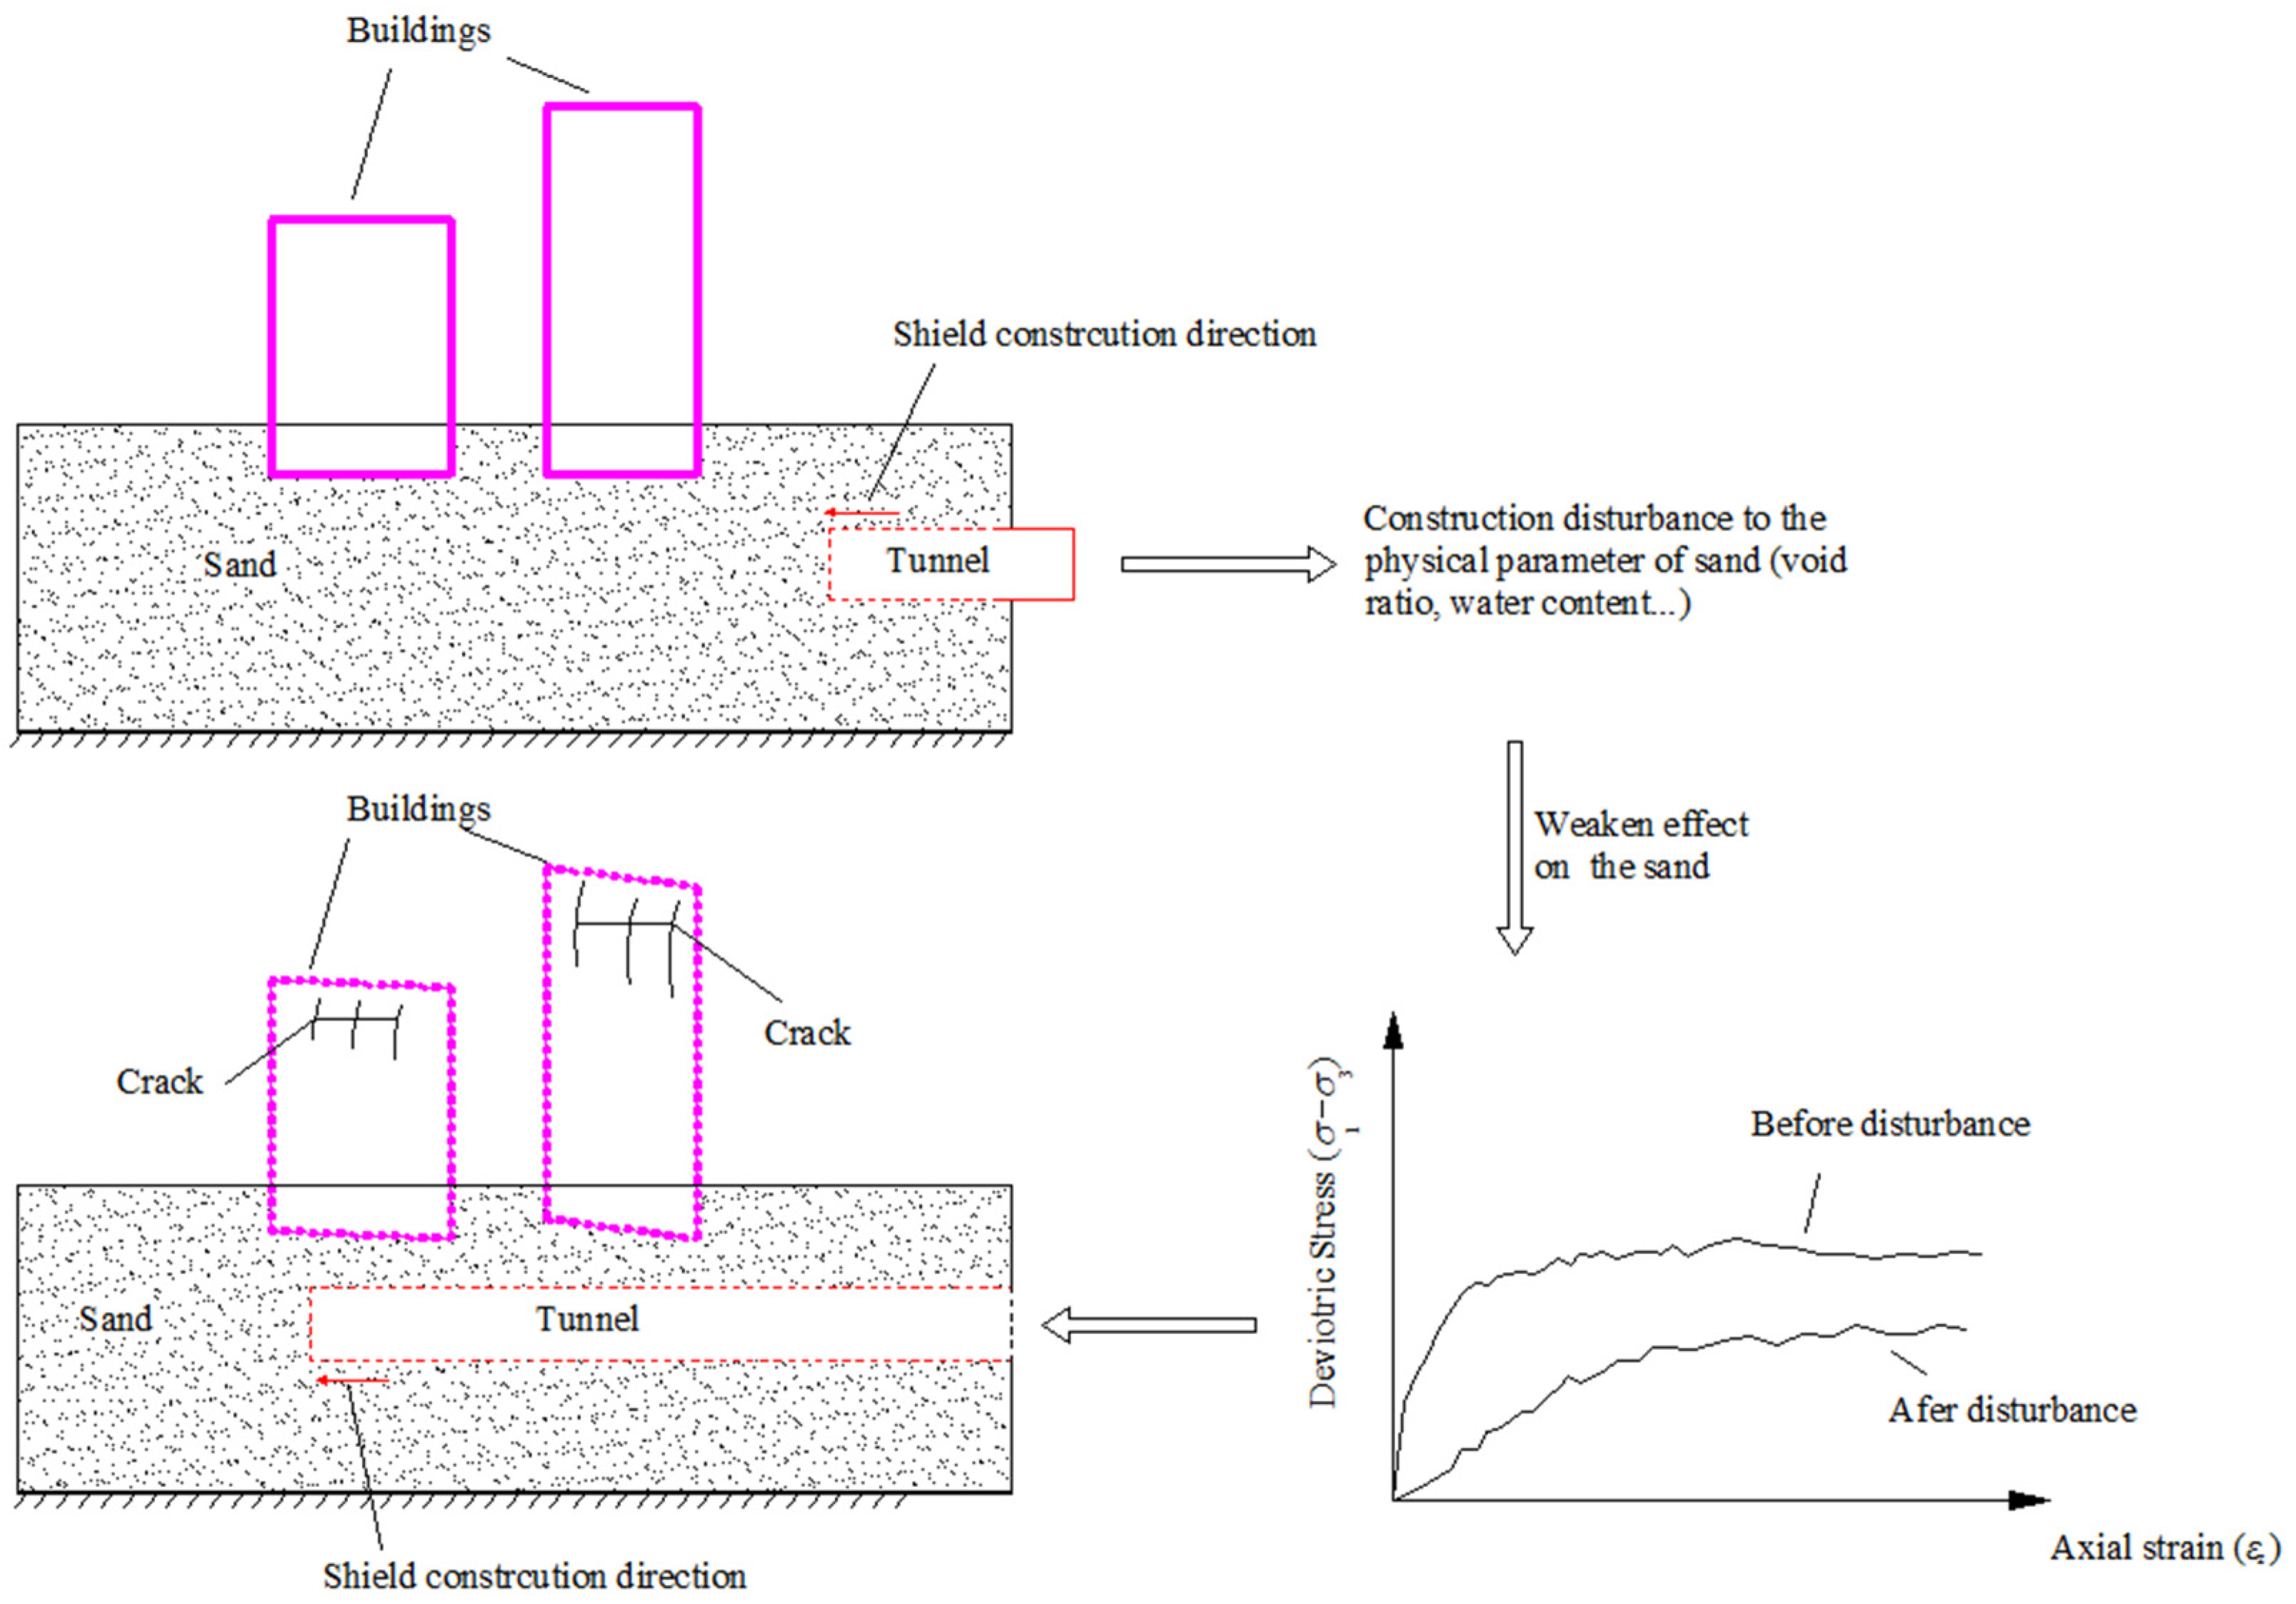
:1. Introduction
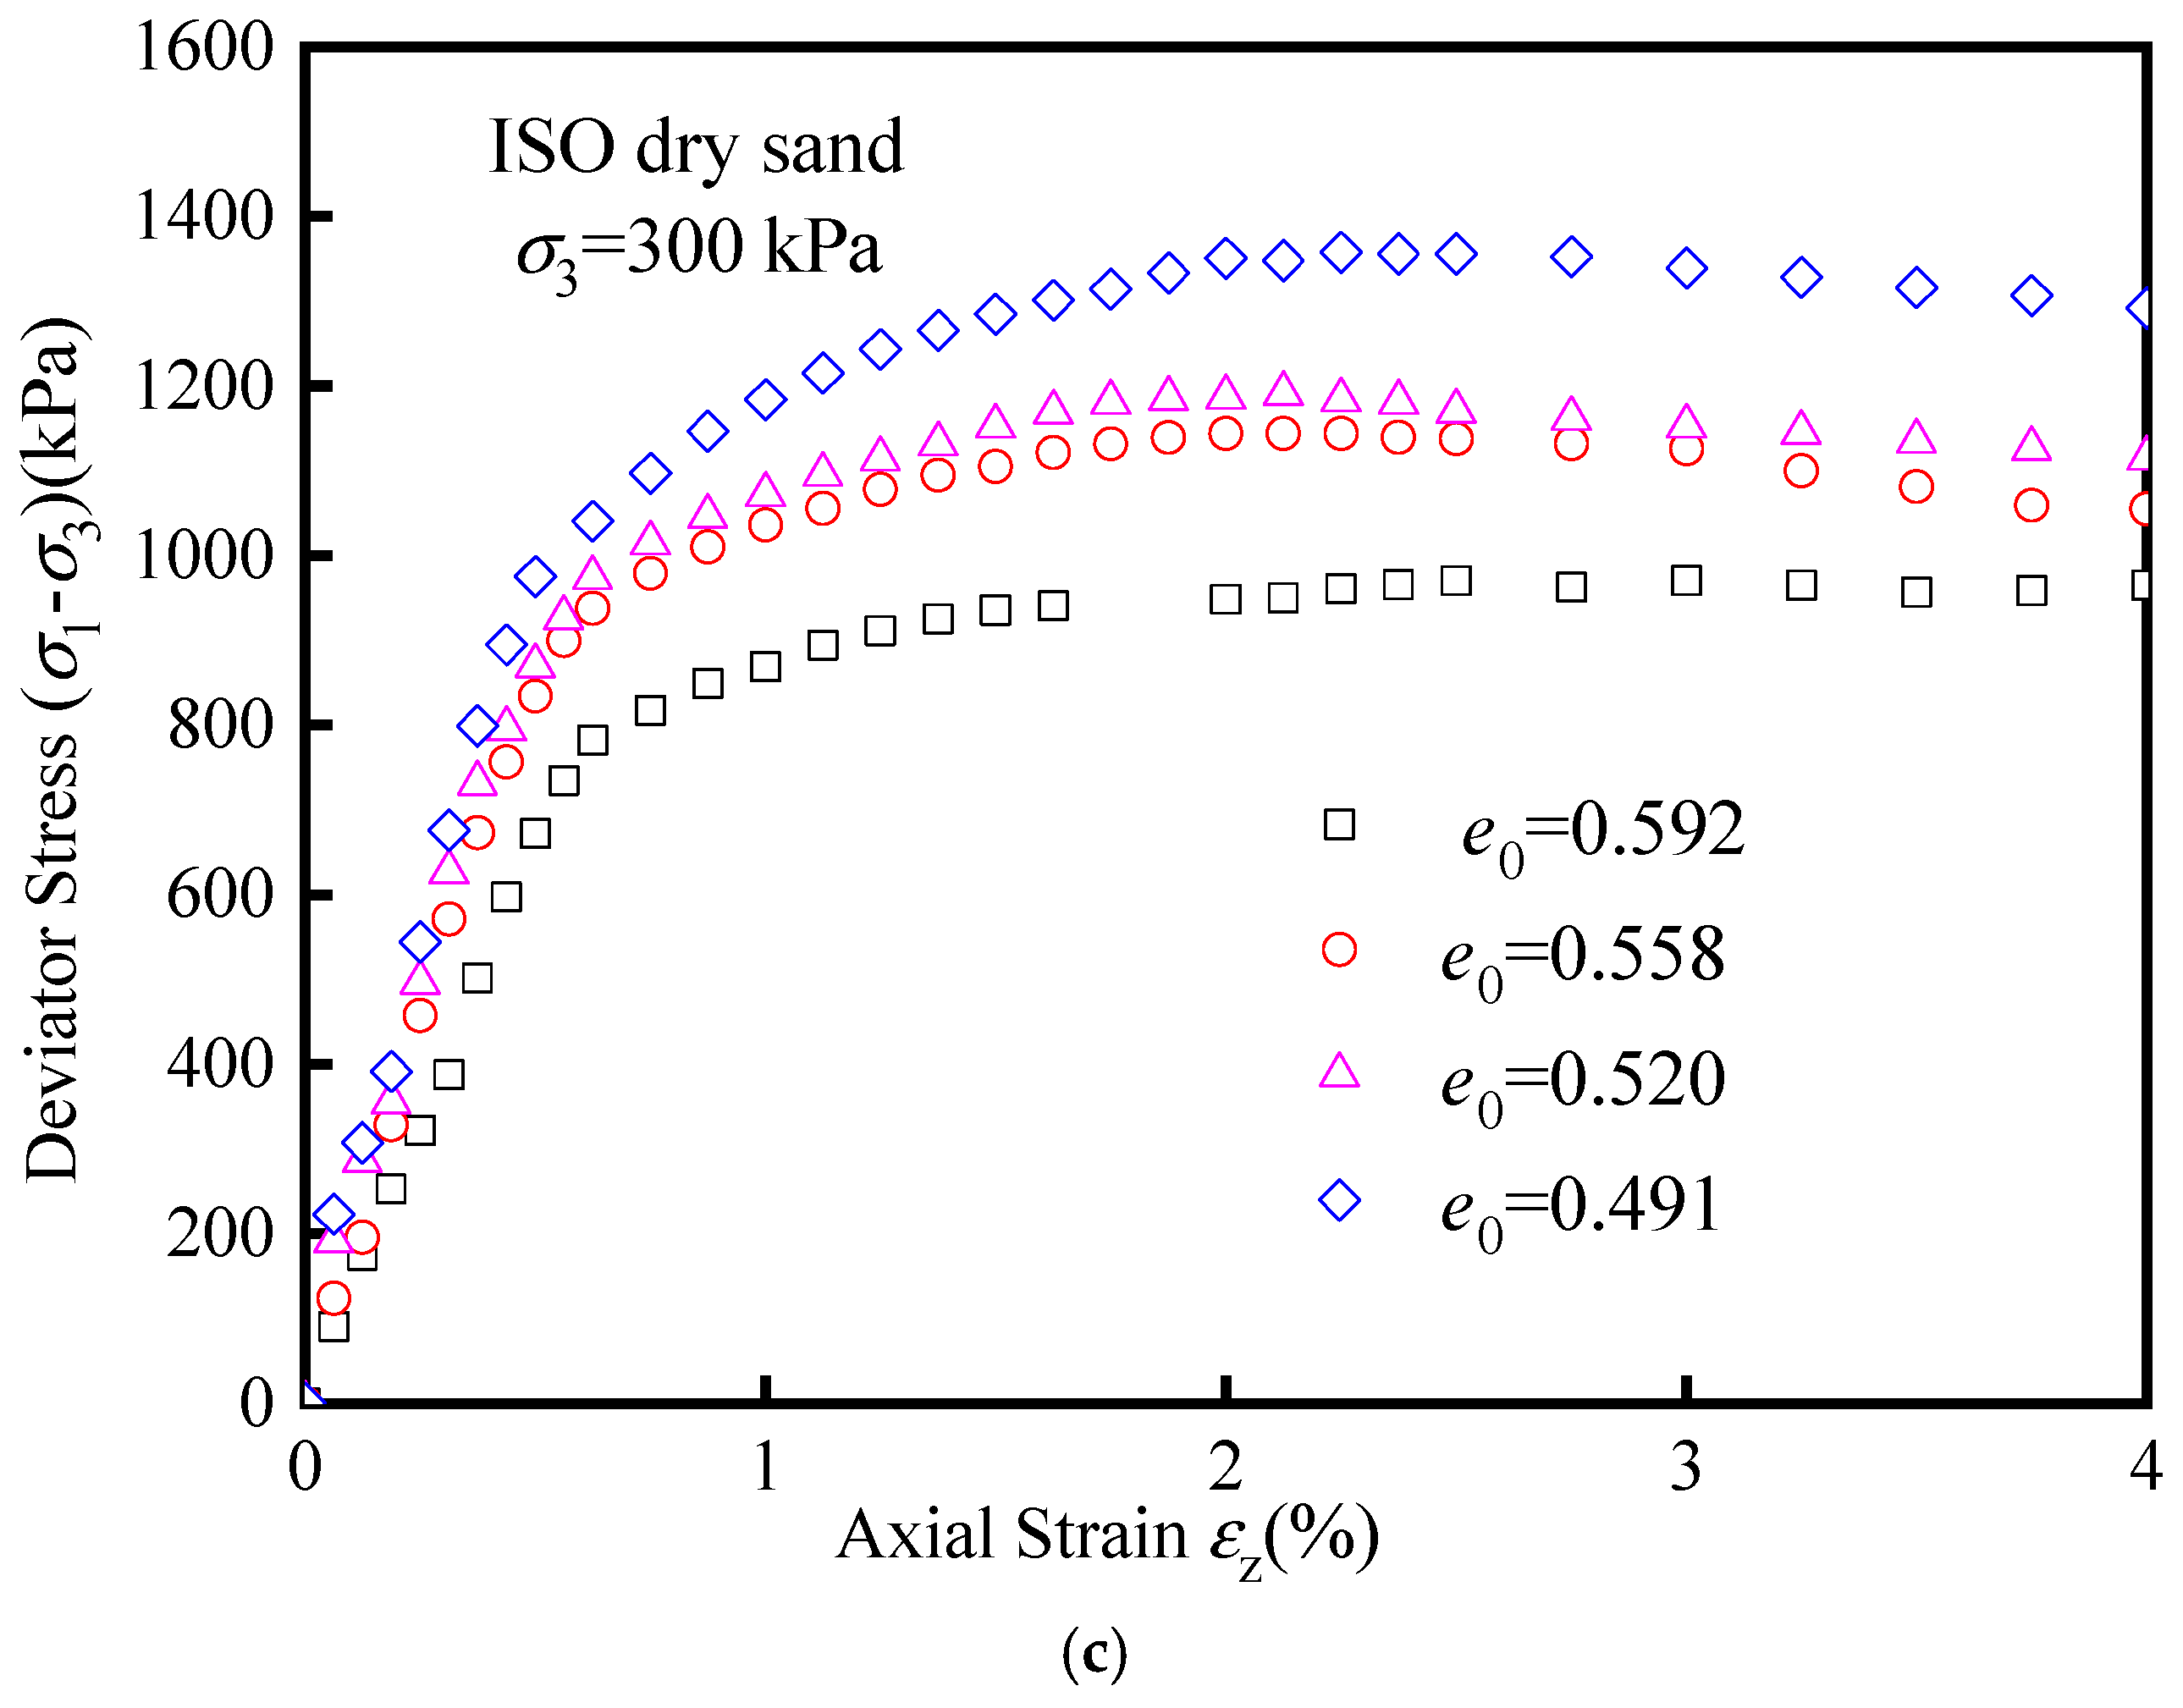
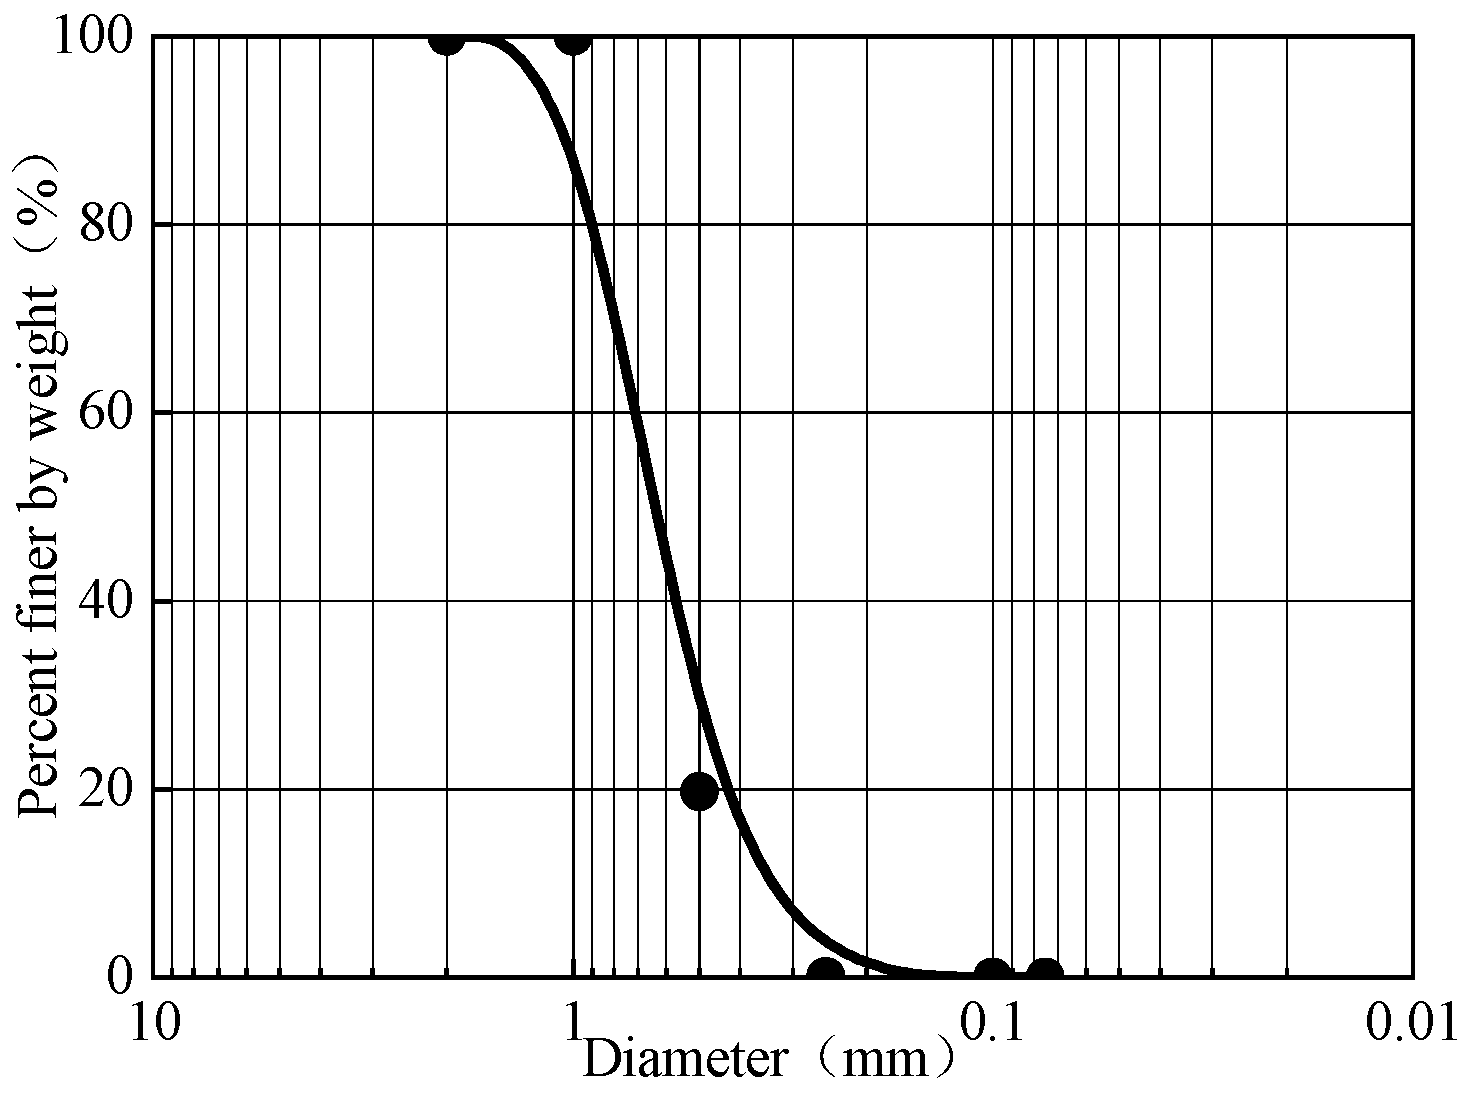
2. Laboratory Test
3. A Simplified Constitutive Model Considering Disturbance
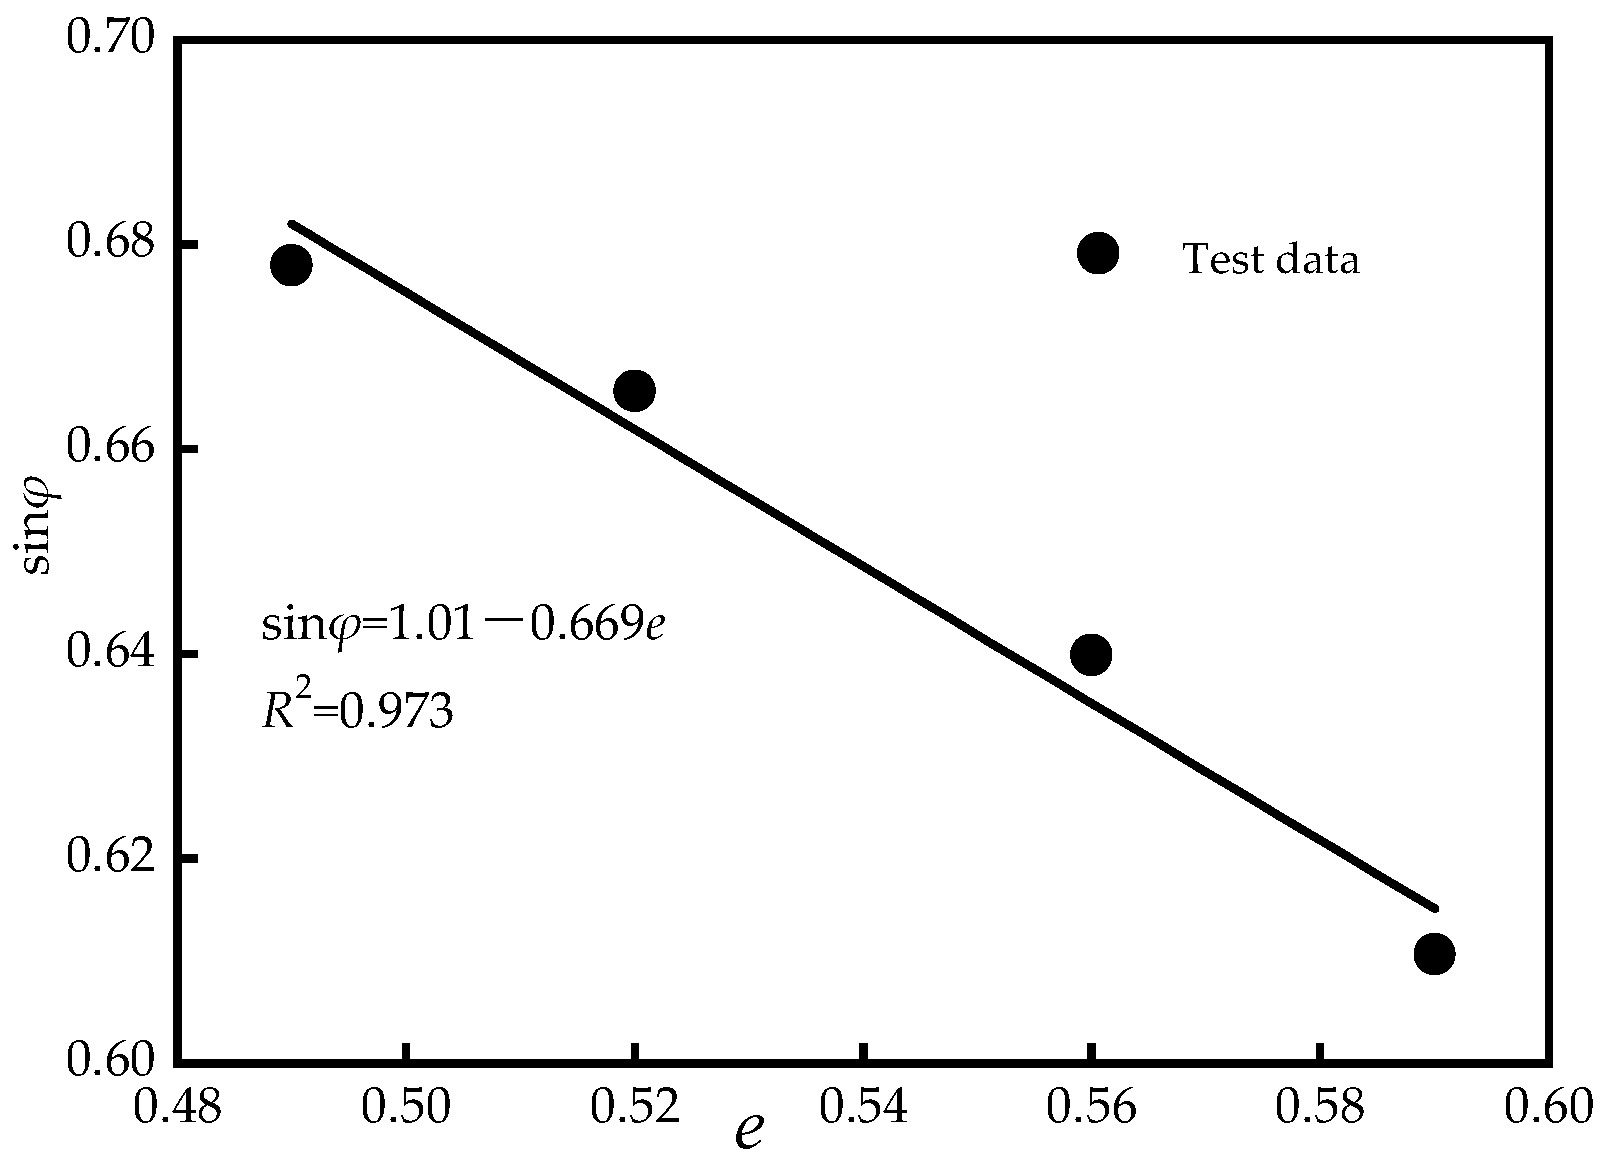
3.1. Initial Tangent Modulus and Internal Friction Angle for Different Void Ratios
3.2. Unified Disturbance Function
- (1)
- For “positive disturbance” (e ≤ e0)
- (2)
- For “negative disturbance” (e > e0)
3.3. Simplified Constitutive Model Considering Disturbance
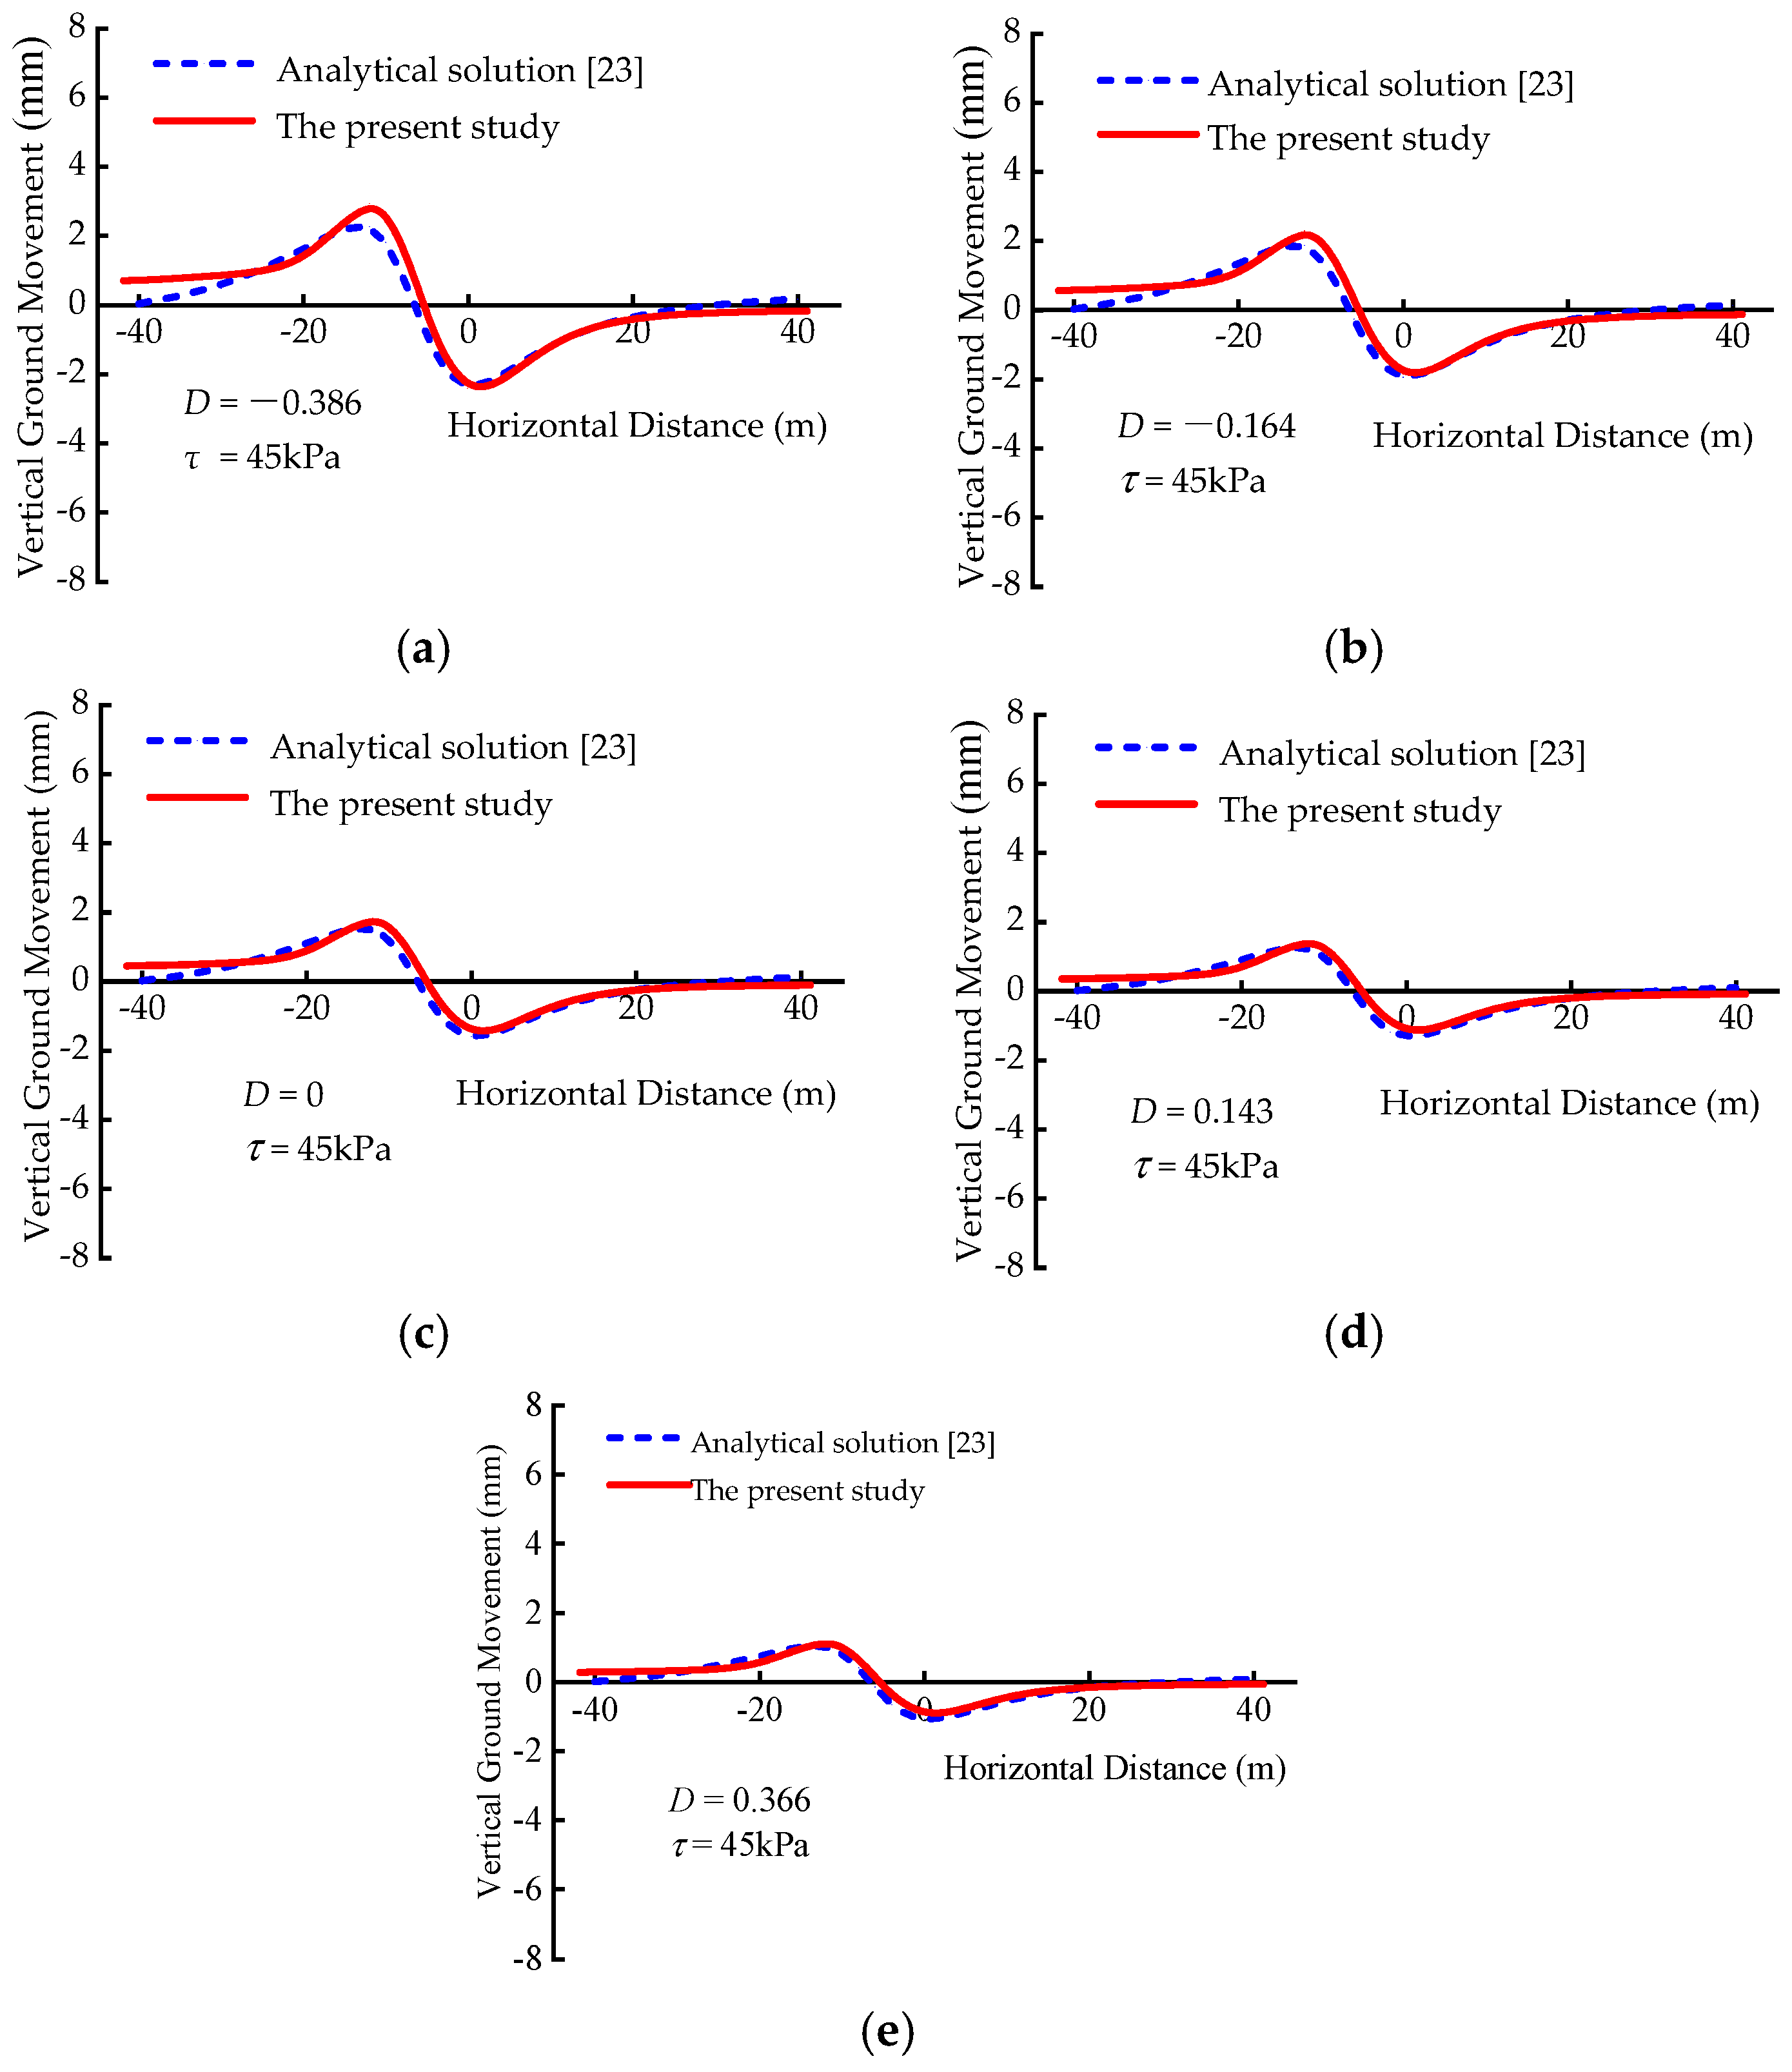
4. Verification
5. Application
6. Conclusions
Author Contributions
Funding
Institutional Review Board Statement
Informed Consent Statement
Data Availability Statement
Conflicts of Interest
References
- Chen, R.P.; Meng, F.Y.; Ye, Y.H.; Liu, Y. Numerical simulation of the uplift behavior of shield tunnel during construction stage. Soils Found. 2018, 58, 370–381. [Google Scholar] [CrossRef]
- Hong, Y.; Soomro, M.A.; Ng, C.W.W. Settlement and load transfer mechanism of pile group due to side-by-side twin tunneling. Comput. Geotech. 2015, 64, 105–119. [Google Scholar] [CrossRef]
- Lin, C.G.; Wu, S.M.; Xia, T.D. Design of shield tunnel lining taking fluctuations of river stage into account. Tunn. Undergr. Space Technol. 2014, 45, 107–127. [Google Scholar] [CrossRef]
- Lin, C.G.; Huang, M.S. Tunnelling-induced response of a jointed pipeline and its equivalence to a continuous structure. Soils Found. 2019, 59, 828–839. [Google Scholar] [CrossRef]
- Lin, C.G.; Zhang, Z.M.; Wu, S.M.; Yu, F. Key techniques and important issues for slurry shield under-passing embankments, a case study of Hangzhou Qiantang River Tunnel. Tunn. Undergr. Space Technol. 2013, 38, 306–325. [Google Scholar] [CrossRef]
- Zhou, W.J.; Guo, Z.; Wang, L.Z.; Li, J.H.; Rui, S.J. Sand-steel interface behaviour under large-displacement and cyclic shear. Soil Dyn. Earthq. Eng. 2020, 138, 106352. [Google Scholar] [CrossRef]
- Rodríguez-Roa, F. Ground subsidence due to a shallow tunnel in dense sandy gravel. J. Geotech. Geoenviron. 2002, 128, 426–434. [Google Scholar] [CrossRef]
- Chakeri, H.; Ozcelik, Y.; Unver, B. Effects of important factors on surface settlement prediction for metro tunnel excavated by EPB. Tunn. Undergr. Space Technol. 2013, 36, 14–23. [Google Scholar] [CrossRef]
- Rui, S.J.; Wang, L.Z.; Guo, Z.; Zhou, W.J.; Li, Y.J. Cyclic Behavior of Interface shear between carbonate sand and steel. Acta Geotech. 2021, 16, 189–209. [Google Scholar] [CrossRef]
- Shi, C.H.; Cao, C.Y.; Peng, L.M.; Lei, M.F.; Ai, H.J. Effects of lateral unloading on the mechanical and deformation performance of shield tunnel segment joints. Tunn. Undergr. Space Technol. 2016, 51, 175–188. [Google Scholar] [CrossRef]
- Hejazi, Y.; Dias, D.; Kastner, R. Impact of constitutive models on the numerical analysis of underground constructions. Acta Geotech. 2008, 3, 251–258. [Google Scholar] [CrossRef]
- Addenbrooke, T.I.; Potts, D.M.; Puzrin, A.M. The influence of pre-failure soil stiffness on the numerical analysis of twin tunnel construction. Géotechnique 1997, 47, 693–712. [Google Scholar] [CrossRef]
- Zhang, M.J.; Song, E.X.; Chen, Z.Y. Ground movement analysis of soil nailing construction by three-dimensional (3-D) finite element modeling (FEM). Comput. Geotech. 1999, 25, 191–204. [Google Scholar] [CrossRef]
- Mroueh, H.; Shahrour, I. A full 3-D finite element analysis of tunnelin-adjacent structures interaction. Comput. Geotech. 2003, 30, 245–253. [Google Scholar] [CrossRef]
- Karakus, M.; Fowell, R.J. Effects of different tunnel face advance excavation on the settlement by FEM. Tunn. Undergr. Space Technol. 2003, 18, 513–523. [Google Scholar] [CrossRef]
- Franzius, J.N.; Potts, D.M.; Burland, J.B. The influence of soil anisotropy and K0 on ground surface movements resulting from tunnel excavation. Géotechnique 2005, 55, 189–199. [Google Scholar] [CrossRef]
- Rui, S.J.; Wang, L.Z.; Guo, Z.; Cheng, X.M.; Wu, B. Monotonic behavior of interface shear between carbonate sand and steel. Acta Geotech. 2021, 16, 167–187. [Google Scholar] [CrossRef]
- Liu, M.D.; Carter, J.P.; Desai, C.S. Modeling compression behaviour of structured geomaterials. Int. J. Geomech. 2003, 3, 191–204. [Google Scholar] [CrossRef]
- Desai, C.S.; EI-Hoseiny, K.E. Prediction of field behaviour of reinforced soil wall using advanced constitutive model. J. Geotech. Geoenviron. 2005, 131, 729–739. [Google Scholar] [CrossRef]
- Fan, R.D.; Liu, M.; Du, Y.J.; Horpibulsuk, S. Estimating the compression behaviour of metal-rich clays via a Disturbed State Concept (DSC) model. Appl. Clay Sci. 2016, 132, 50–58. [Google Scholar] [CrossRef]
- Zhu, J.F.; Xu, R.Q.; Li, X.R.; Chen, Y.K. Calculation of earth pressure based on disturbed state concept theory. J. Cent. South Univ. Technol. 2011, 18, 1240–1247. [Google Scholar] [CrossRef]
- Pradhan, S.K.; Desai, C.S. DSC model for soil and interface including liquefaction and prediction of centrifuge test. J. Geotech. Geoenviron. 2006, 132, 214–222. [Google Scholar] [CrossRef]
- Zhu, J.F.; Xu, R.Q.; Liu, G.B. Analytical prediction for tunnelling-induced ground movements in sands considering disturbance. Tunn. Undergr. Space Technol. 2014, 41, 165–175. [Google Scholar] [CrossRef]
- Desai, C.S. Constitutive modeling of materials and contacts using the disturbed state concept: Part 1—Background and analysis. Comput. Struct. 2015, 146, 214–233. [Google Scholar] [CrossRef]
- Desai, C.S. Constitutive modeling of materials and contacts using the disturbed state concept: Part 2—Validations at specimen and boundary value problem levels. Comput. Struct. 2015, 146, 234–251. [Google Scholar] [CrossRef]
- Duncan, J.M.; Chang, C.Y. Nonlinear analysis of stress and strain in soils. J. Soil Mech. Found. Div. 1970, 96, 1629–1653. [Google Scholar]
- The Professional Standards Compilation Group of People’s Republic of China. SL237-1999; Specification of Soil Test; Water Power Press: Beijing, China, 1999. (In Chinese) [Google Scholar]
- Kondner, R.L.; Zelasko, J.S. A hyperbolic stress-strain formulation for sands. In Proceedings of the 2nd Pan-American Conference on Soil Mechanics and Foundation Engineering, Recife, Brazil, October 1963; Volume 1, pp. 289–324. [Google Scholar]
- Kondner, R.L.; Horner, J.M. Triaxial compression of a cohesive soil with effective octahedral stress control. Can. Geotech. J. 1965, 2, 40–52. [Google Scholar] [CrossRef]
- Janbu, N. Soil compressibility as determined by oedometer and triaxial tests. In Proceedings of the European Conference Soil Mechanics & Foundations Engineering, Wiesbaden, Germany, 15–18 October 1963; Volume 1, pp. 19–25. [Google Scholar]
- Zhu, J.F.; Zhao, H.Y.; Luo, Z.Y.; Liu, H.X. Investigation of the mechanical behavior of soft clay under combined shield construction and ocean waves. Ocean Eng. 2020, 107250. [Google Scholar] [CrossRef]
- Wang, Z.; Zhang, K.W.; Wei, G.; Li, B.; Li, Q.; Yao, W.J. Field measurement analysis of the influence of double shield tunnel construction on reinforced bridge. Tunn. Undergr. Space Technol. 2018, 81, 252–264. [Google Scholar] [CrossRef]
- Pattanasak, C.; Pornkasem, J. 3D response analysis of a shield tunnel segmental lining during construction and a parametric study using the ground-spring model. Tunn. Undergr. Space Technol. 2019, 90, 369–382. [Google Scholar]
- Lin, C.G.; Huang, M.S.; Nadim, F.; Liu, Z.Q. Tunnelling-induced response of buried pipelines and their effects on ground settlements. Tunn. Undergr. Space Technol. 2020, 96, 103193. [Google Scholar] [CrossRef]


| Sand | w/% | Gs | emax | emim | Cu | Cc |
|---|---|---|---|---|---|---|
| ISO | 0.046 | 2.681 | 0.723 | 0.382 | 2.267 | 1.408 |
| e0 | m/g | |
|---|---|---|
| 0.59 | 161.790 | 32.358 |
| 0.56 | 166.785 | 33.357 |
| 0.52 | 168.957 | 33.791 |
| 0.49 | 174.550 | 34.910 |
| σ3 /MPa | e0 | (σ1 − σ3)f /MPa | a /MPa−1 (×10−3) | Ei /MPa | (σ1 − σ3)ult /MPa | b/ MPa−1 | Rfi |
|---|---|---|---|---|---|---|---|
| 0.1 | 0.591 | 0.319 | 11.223 | 89.100 | 0.392 | 2.553 | 0.814 |
| 0.557 | 0.419 | 8.029 | 124.553 | 0.526 | 1.900 | 0.797 | |
| 0.522 | 0.450 | 7.119 | 140.471 | 0.547 | 1.827 | 0.823 | |
| 0.487 | 0.492 | 6.264 | 159.651 | 0.598 | 1.671 | 0.823 | |
| 0.2 | 0.590 | 0.598 | 6.290 | 158.995 | 0.762 | 1.313 | 0.785 |
| 0.560 | 0.792 | 4.160 | 240.401 | 1.014 | 0.986 | 0.7815 | |
| 0.521 | 0.835 | 3.801 | 263.118 | 1.000 | 1.000 | 0.835 | |
| 0.489 | 0.936 | 2.844 | 351.644 | 1.086 | 0.921 | 0.862 | |
| 0.3 | 0.592 | 0.970 | 3.152 | 317.219 | 1.176 | 0.851 | 0.825 |
| 0.558 | 1.144 | 2.428 | 411.843 | 1.359 | 0.736 | 0.842 | |
| 0.520 | 1.191 | 2.251 | 444.191 | 1.389 | 0.720 | 0.857 | |
| 0.491 | 1.358 | 2.017 | 495.719 | 1.581 | 0.633 | 0.859 |
| e0 | σ3 /MPa | φi /(°) | φ /(°) | Rf | K | n |
|---|---|---|---|---|---|---|
| 0.1 | 37.927 | |||||
| 0.59 | 0.2 | 36.818 | 37.636 | 0.808 | 952.094 | 0.919 |
| 0.3 | 38.163 | |||||
| 0.1 | 39.868 | |||||
| 0.56 | 0.2 | 40.022 | 39.785 | 0.807 | 1342.054 | 0.907 |
| 0.3 | 39.465 | |||||
| 0.1 | 42.585 | |||||
| 0.52 | 0.2 | 41.637 | 41.737 | 0.838 | 1495.099 | 0.886 |
| 0.3 | 40.989 | |||||
| 0.1 | 43.829 | |||||
| 0.49 | 0.2 | 42.546 | 42.685 | 0.848 | 1776.847 | 0.891 |
| 0.3 | 41.681 |
| Sand | w /% | Gs | emax | emim | Cu | Cc |
|---|---|---|---|---|---|---|
| FJ | 0.045 | 2.697 | 0.926 | 0.645 | 1.442 | 0.923 |
| e0 | K0 | n0 | φ0 /(°) | σ3 / kPa | d | f | g | h | |
|---|---|---|---|---|---|---|---|---|---|
| 0.76 | 0.826 | - | 0.881 | - | 100 | 200 | 300 | 12.311 | −6.956 |
| e | D |
|---|---|
| 0.79 | −0.138 |
| 0.76 | 0.000 |
| 0.73 | 0.216 |
| 0.70 | 0.528 |
| R /m | H /m | L /m |
|---|---|---|
| 3.195 | 11.848 | 9.00 |
| ν | ES0 /kPa | Dr0 | Drmin | Drmax | d | p /kPa | τ /kPa |
|---|---|---|---|---|---|---|---|
| 0.30 | 17,000.00 | 0.50 | 0.00 | 1.00 | 1.933 | 20.00 | 45.00 |
| γ /kN/m3 | ν | e0 | emin | emax | n0 | d | f | g | h | |
|---|---|---|---|---|---|---|---|---|---|---|
| 19 | 0.3 | 0.502 | 0.362 | 0.646 | 0.806 | 0.9 | 1.933 | 5.846 | 4.947 | −8.4 |
| e | Dr | D |
|---|---|---|
| 0.561 | 0.3 | −0.386 |
| 0.532 | 0.4 | −0.164 |
| 0.502 | 0.5 | 0.000 |
| 0.476 | 0.6 | 0.143 |
| 0.447 | 0.7 | 0.366 |
Publisher’s Note: MDPI stays neutral with regard to jurisdictional claims in published maps and institutional affiliations. |
© 2021 by the authors. Licensee MDPI, Basel, Switzerland. This article is an open access article distributed under the terms and conditions of the Creative Commons Attribution (CC BY) license (http://creativecommons.org/licenses/by/4.0/).
Share and Cite
Zhu, J.-F.; Zhao, H.-Y.; Xu, R.-Q.; Luo, Z.-Y.; Jeng, D.-S. Constitutive Modeling of Physical Properties of Coastal Sand during Tunneling Construction Disturbance. J. Mar. Sci. Eng. 2021, 9, 167. https://doi.org/10.3390/jmse9020167
Zhu J-F, Zhao H-Y, Xu R-Q, Luo Z-Y, Jeng D-S. Constitutive Modeling of Physical Properties of Coastal Sand during Tunneling Construction Disturbance. Journal of Marine Science and Engineering. 2021; 9(2):167. https://doi.org/10.3390/jmse9020167
Chicago/Turabian StyleZhu, Jian-Feng, Hong-Yi Zhao, Ri-Qing Xu, Zhan-You Luo, and Dong-Sheng Jeng. 2021. "Constitutive Modeling of Physical Properties of Coastal Sand during Tunneling Construction Disturbance" Journal of Marine Science and Engineering 9, no. 2: 167. https://doi.org/10.3390/jmse9020167