Article

Optimal Design of Slit Impeller for Low Specific Speed Centrifugal Pump Based on Orthogonal Test

1
National Research Center of Pumps, Jiangsu University, Zhenjiang 212013, China
2
Jiangsu Shentong Valve Co., Ltd., Nantong 226232, China
3
Department of Mechanical Engineering, Texas Tech University, Lubbock, TX 79411, USA
*
Author to whom correspondence should be addressed.
J. Mar. Sci. Eng. 2021, 9(2), 121; https://doi.org/10.3390/jmse9020121
Submission received: 5 January 2021 / Revised: 20 January 2021 / Accepted: 23 January 2021 / Published: 26 January 2021
(This article belongs to the Special Issue Experiments and Numerical Analysis of Flow)

Abstract

:
Marine centrifugal pumps are mostly used on board ship, for transferring liquid from one point to another. Based on the combination of orthogonal testing and numerical simulation, this paper optimizes the structure of a drainage trough for a typical low-specific speed centrifugal pump, determines the priority of the various geometric factors of the drainage trough on the pump performance, and obtains the optimal impeller drainage trough scheme. The influence of drainage tank structure on the internal flow of a low-specific speed centrifugal pump is also analyzed. First, based on the experimental validation of the initial model, it is determined that the numerical simulation method used in this paper is highly accurate in predicting the performance of low-specific speed centrifugal pumps. Secondly, based on the three factors and four levels of the impeller drainage trough in the orthogonal test, the orthogonal test plan is determined and the orthogonal test results are analyzed. This work found that slit diameter and slit width have a large impact on the performance of low-specific speed centrifugal pumps, while long and short vane lap lengths have less impact. Finally, we compared the internal flow distribution between the initial model and the optimized model, and found that the slit structure could effectively reduce the pressure difference between the suction side and the pressure side of the blade. By weakening the large-scale vortex in the flow path and reducing the hydraulic losses, the drainage trough impellers obtained based on orthogonal tests can significantly improve the hydraulic efficiency of low-specific speed centrifugal pumps.

1. Introduction

The low specific speed centrifugal pump is a kind of equipment that can greatly improve the head of a medium in small flow conditions, and has irreplaceable importance in marine and other fields [1,2,3]. However, its low flow and high head characteristics dictate a narrow impeller width and large impeller outer diameter, which leads to a longer trajectory of the medium in its flow path, inevitable flow separation and increased hydraulic losses in the pump [4,5,6]. As a result, the hydraulic efficiency of existing low-specific speed centrifugal pumps is generally low, and traditional hydraulic optimization methods are ineffective in improving their hydraulic performance. Existing studies have clarified the importance of enhancing the performance of centrifugal pumps. Based on the energy efficiency analysis of pump systems in a ship, Durmusoglu Y et al. [7] illustrated that small changes in the performance of centrifugal pumps can result in considerable energy savings. Su et al. [8] proposed an energy-savings evaluation method for shipboard cooling systems under variable operating conditions, in which the core component is the centrifugal pump. Therefore, how to adjust the geometry of the low specific speed centrifugal pump, and thus improve its hydraulic performance, has been a hotspot in the research of low-specific speed centrifugal pumps [9,10]. Yuan et al. [11] proposed blocking part of the flow path of the low-specific speed centrifugal impeller to weaken the secondary flow and curb the generation of large-scale vortices, thereby improving its hydraulic efficiency. By increasing the design flow rate of the low specific speed centrifugal pump, Ni et al. [12] determined the efficiency curve of the low-specific speed centrifugal pump float as a whole and achieved the purpose of improving its operating efficiency. These methods are useful for improving the performance of low-specific speed centrifugal pumps, but the former will reduce the range of pumps’ flow rates, while the latter will increase the pumps’ maximum shaft power. Therefore, some scholars, based on the application of blade slit in the compressor field [13,14,15], began to try the blade slit structure within the low specific speed centrifugal pump. Zhu et al. [16] developed an impeller for a slit-flow centrifugal pump and found that the impeller could indeed improve the performance of the pump and broaden its operating range. Ye et al. [17] conducted a comparative test on a low specific speed centrifugal pump impeller in a drainage trough and non-drainage trough structure, and found that the low-specific speed impeller with a drainage trough structure is significantly more efficient. Wang et al. [18] found that under different flow conditions, the geometry of the drainage trough has a significant impact on the centrifugal pump performance improvement results. Although the above studies have provided some ideas for the design of drainage trough impellers, there is still no universal method for the design of a drainage trough within low specific-speed centrifugal pumps.
Orthogonal test design is a mature design method that studies multiple factors and levels. It is a highly efficient design method that selects some representative points from a comprehensive test based on orthogonality [19,20,21]. The method has been more widely used in the field of pump design. Long et al. [22] extracted the geometric factors of the guide vane of a centrifugal pump and obtained a geometric solution to improve its performance on the basis of orthogonal tests. Based on the orthogonal test, Zhang et al. [23] analyzed the factors affecting the performance of an axial pump, and determined the least and most influential indexes affecting the performance of the axial pump as the distance between the guide vane and the blade and the hub ratio respectively, which successfully improved the performance of the axial pump. Also based on the orthogonal test, Quan et al. [24] improved the performance of the vortex pump over the full range of flow conditions by numerical calculations instead of performance tests.
Reviewing the existing research, it can be found that the hydraulic design of centrifugal pumps is a complex design involving multiple parameters and multiple levels, for which the orthogonal test method is highly applicable. Therefore, this paper will use the method of combing orthogonal tests and numerical simulations to determine the degree of influence of each geometric parameter of the drainage trough on the performance of a low-specific speed centrifugal pump, and attempts to obtain a low specific speed centrifugal pump to improve the efficiency of the impeller drainage trough indicators. This paper also analyzes the structure of the impeller drainage trough on the impact of a low specific speed centrifugal pump flow field within the impeller. The aim is to provide a certain theoretical basis for the hydraulic performance improvement of low specific speed centrifugal pumps.

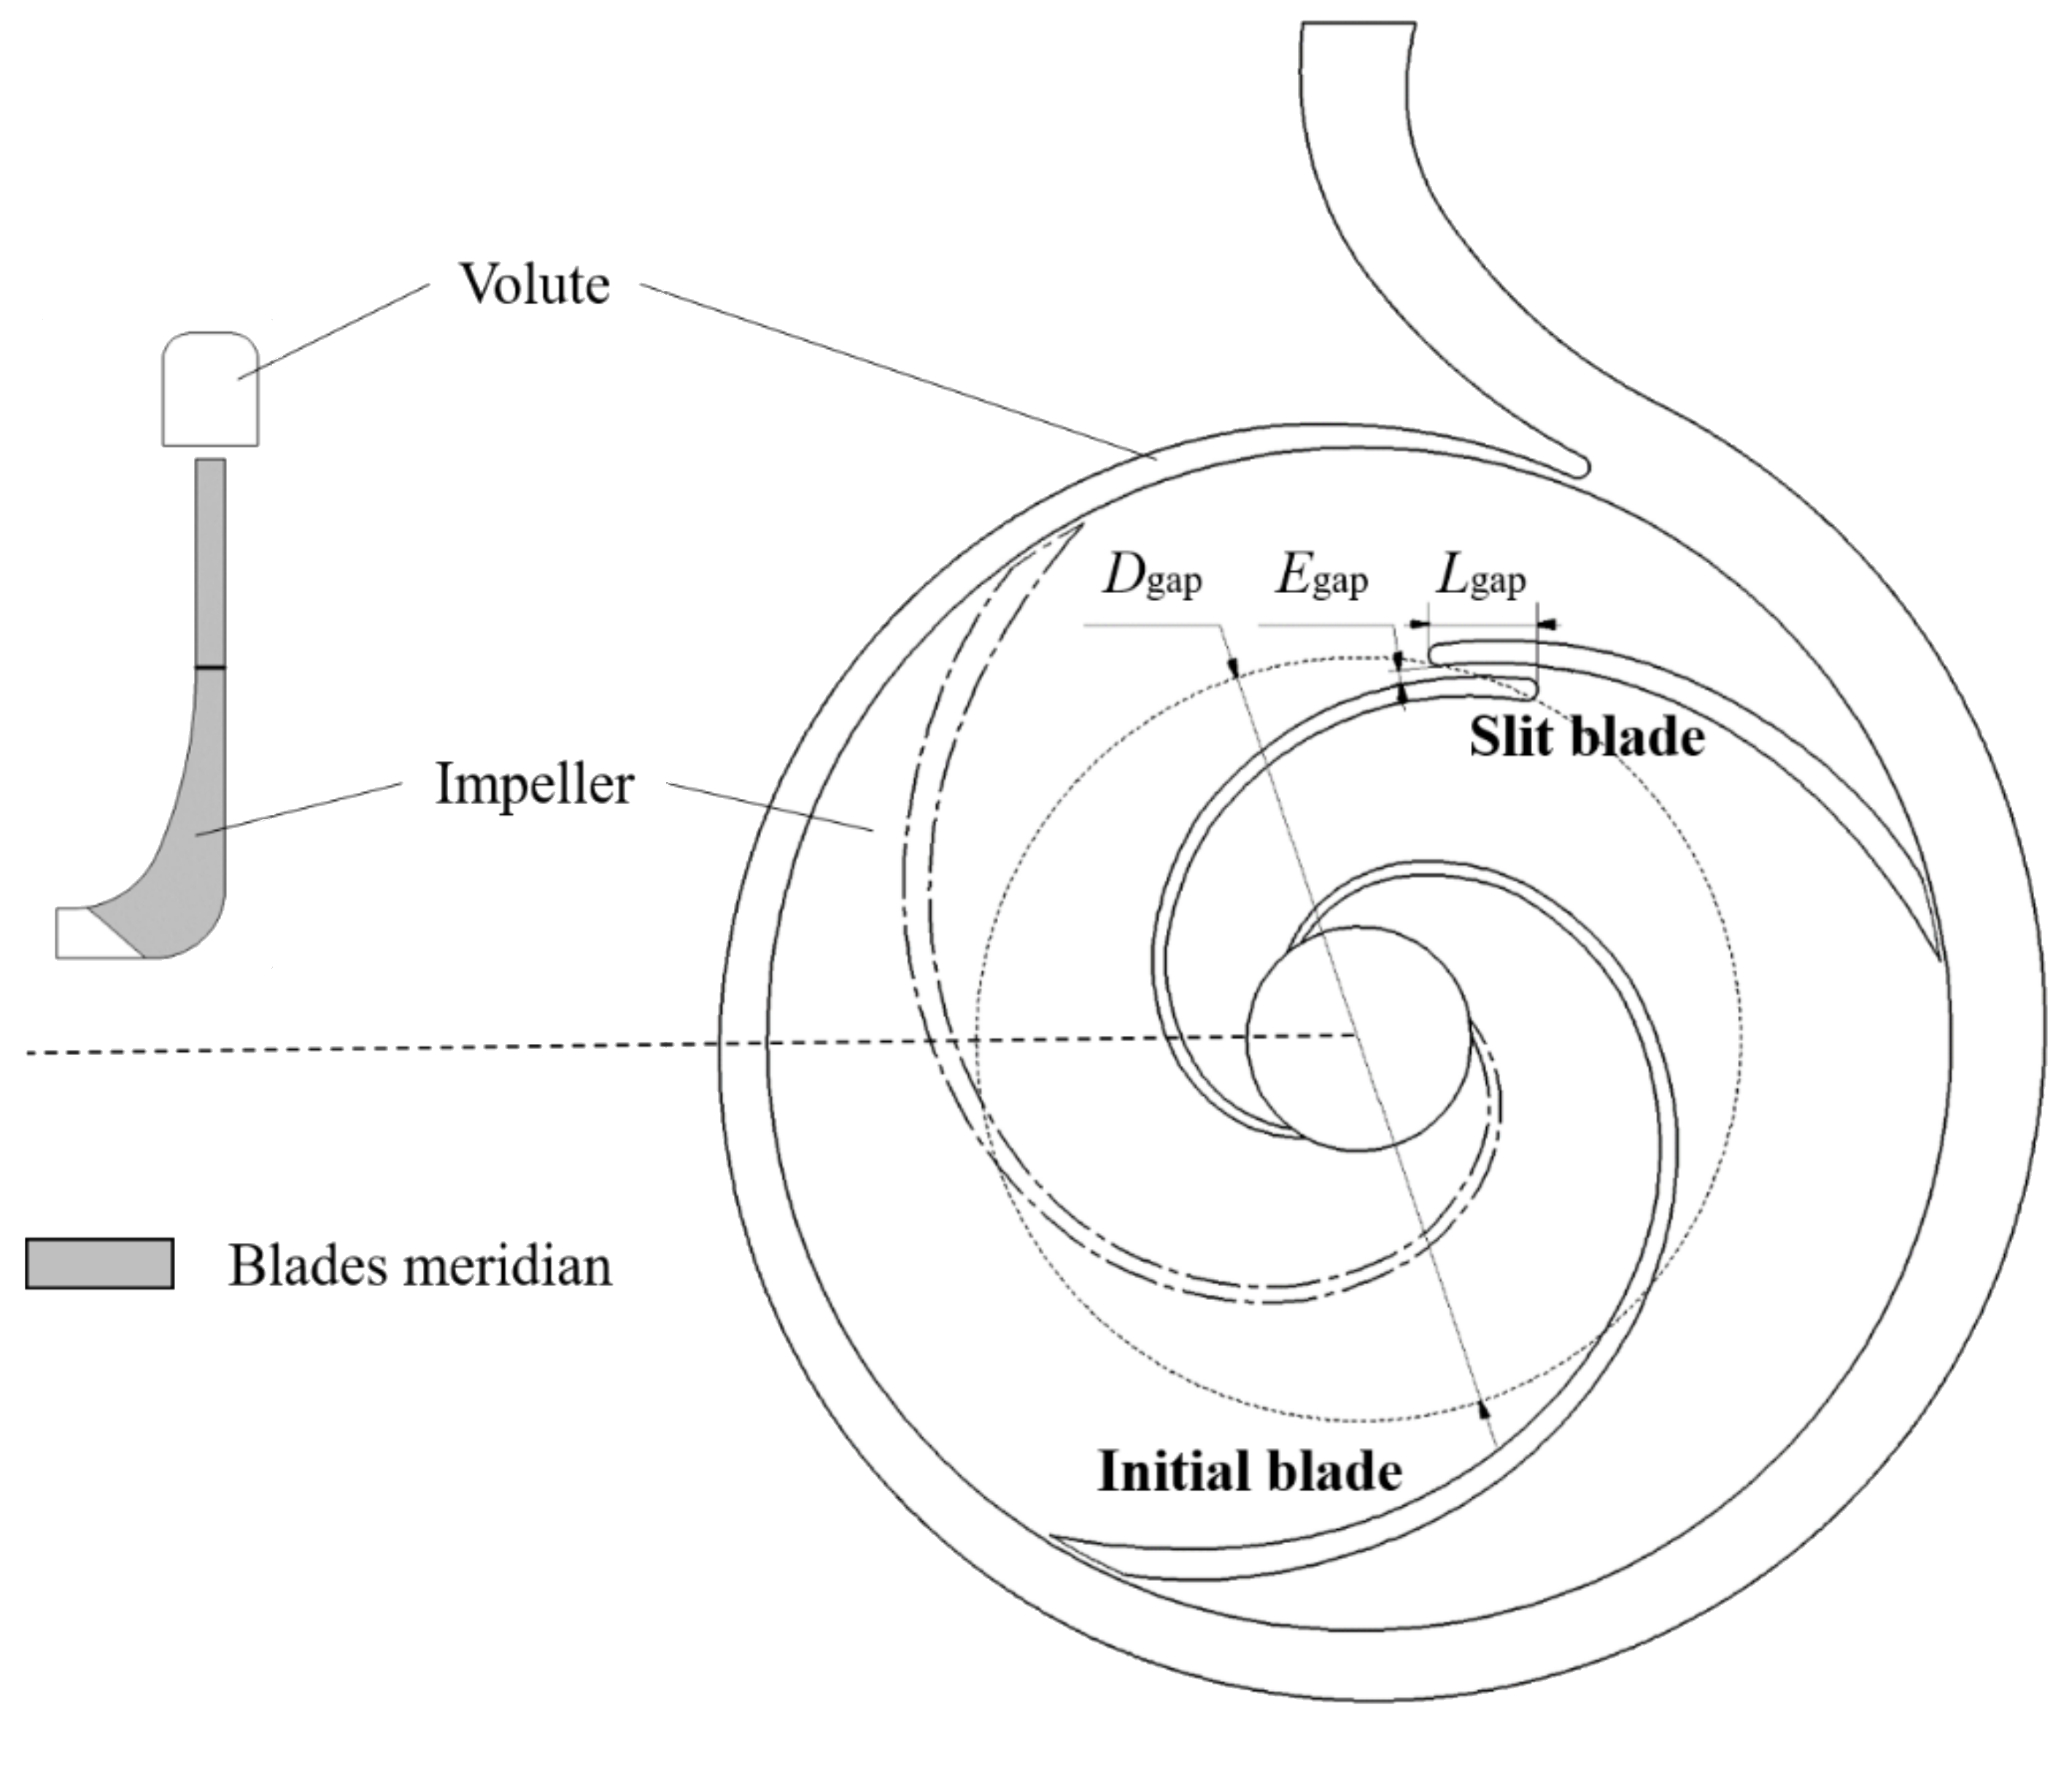
2. Geometry and Parameters

In this paper, a ZA20-250 centrifugal pump with low-specific speed is selected as the research object. The impeller is a typical low specific speed centrifugal impeller with a large outer diameter and long and narrow flow path. The design flow rate of the pump is Qdes = 10 m3/h, the design head is Hdes = 80 m, and the design speed is ndes = 2900 rpm. Therefore, the specific speed of the model is:
n s = 3.65 n Q H 3 / 4 = 21
The main hydraulic components of this hydraulic model are the impeller and the volute. The main role of the impeller is to convert mechanical energy into internal energy of the transport medium. The function of the volute is to convert part of the kinetic energy of the impeller outlet flow into potential energy. Figure 1 shows the two-dimensional hydraulic assembly of the impeller and volute. It can be found that the impeller blade number is 3, and the blade angle of the envelope is greater than 180 degrees. When the impeller adopts the initial blade, the path of each flow channel within the impeller is quite long, which will provide sufficient development space for the secondary flow. However, when the slit blade is used, the slit structure allows the high-pressure medium near the pressure side to leak to the suction side, thus reducing the pressure difference between the pressure side and the suction side, which is the reason for the secondary flow. A three-factor, four-level orthogonal test was conducted in this article. The three factors include slit diameter, slit width, and long and short blade lap length.
(1)
The slit diameter D, i.e., the position of the slit on the blade, is selected at a level every 30 mm from 35% to 70% of the impeller diameter, i.e., 90 mm, 120 mm, 150 mm, and 180 mm.
(2)
The slit width E, the slit width affects the flow of liquid through the slit, with four levels chosen: 1.5 mm, 3.0 mm, 4.5 mm, and 6.0 mm.
(3)
The long and short blade lap length L, a factor that determines the start of the action of the deflector blade on the fluid, is selected at four levels: 5 mm, 10 mm, 15 mm, and 20 mm.

3. Numerical Modeling

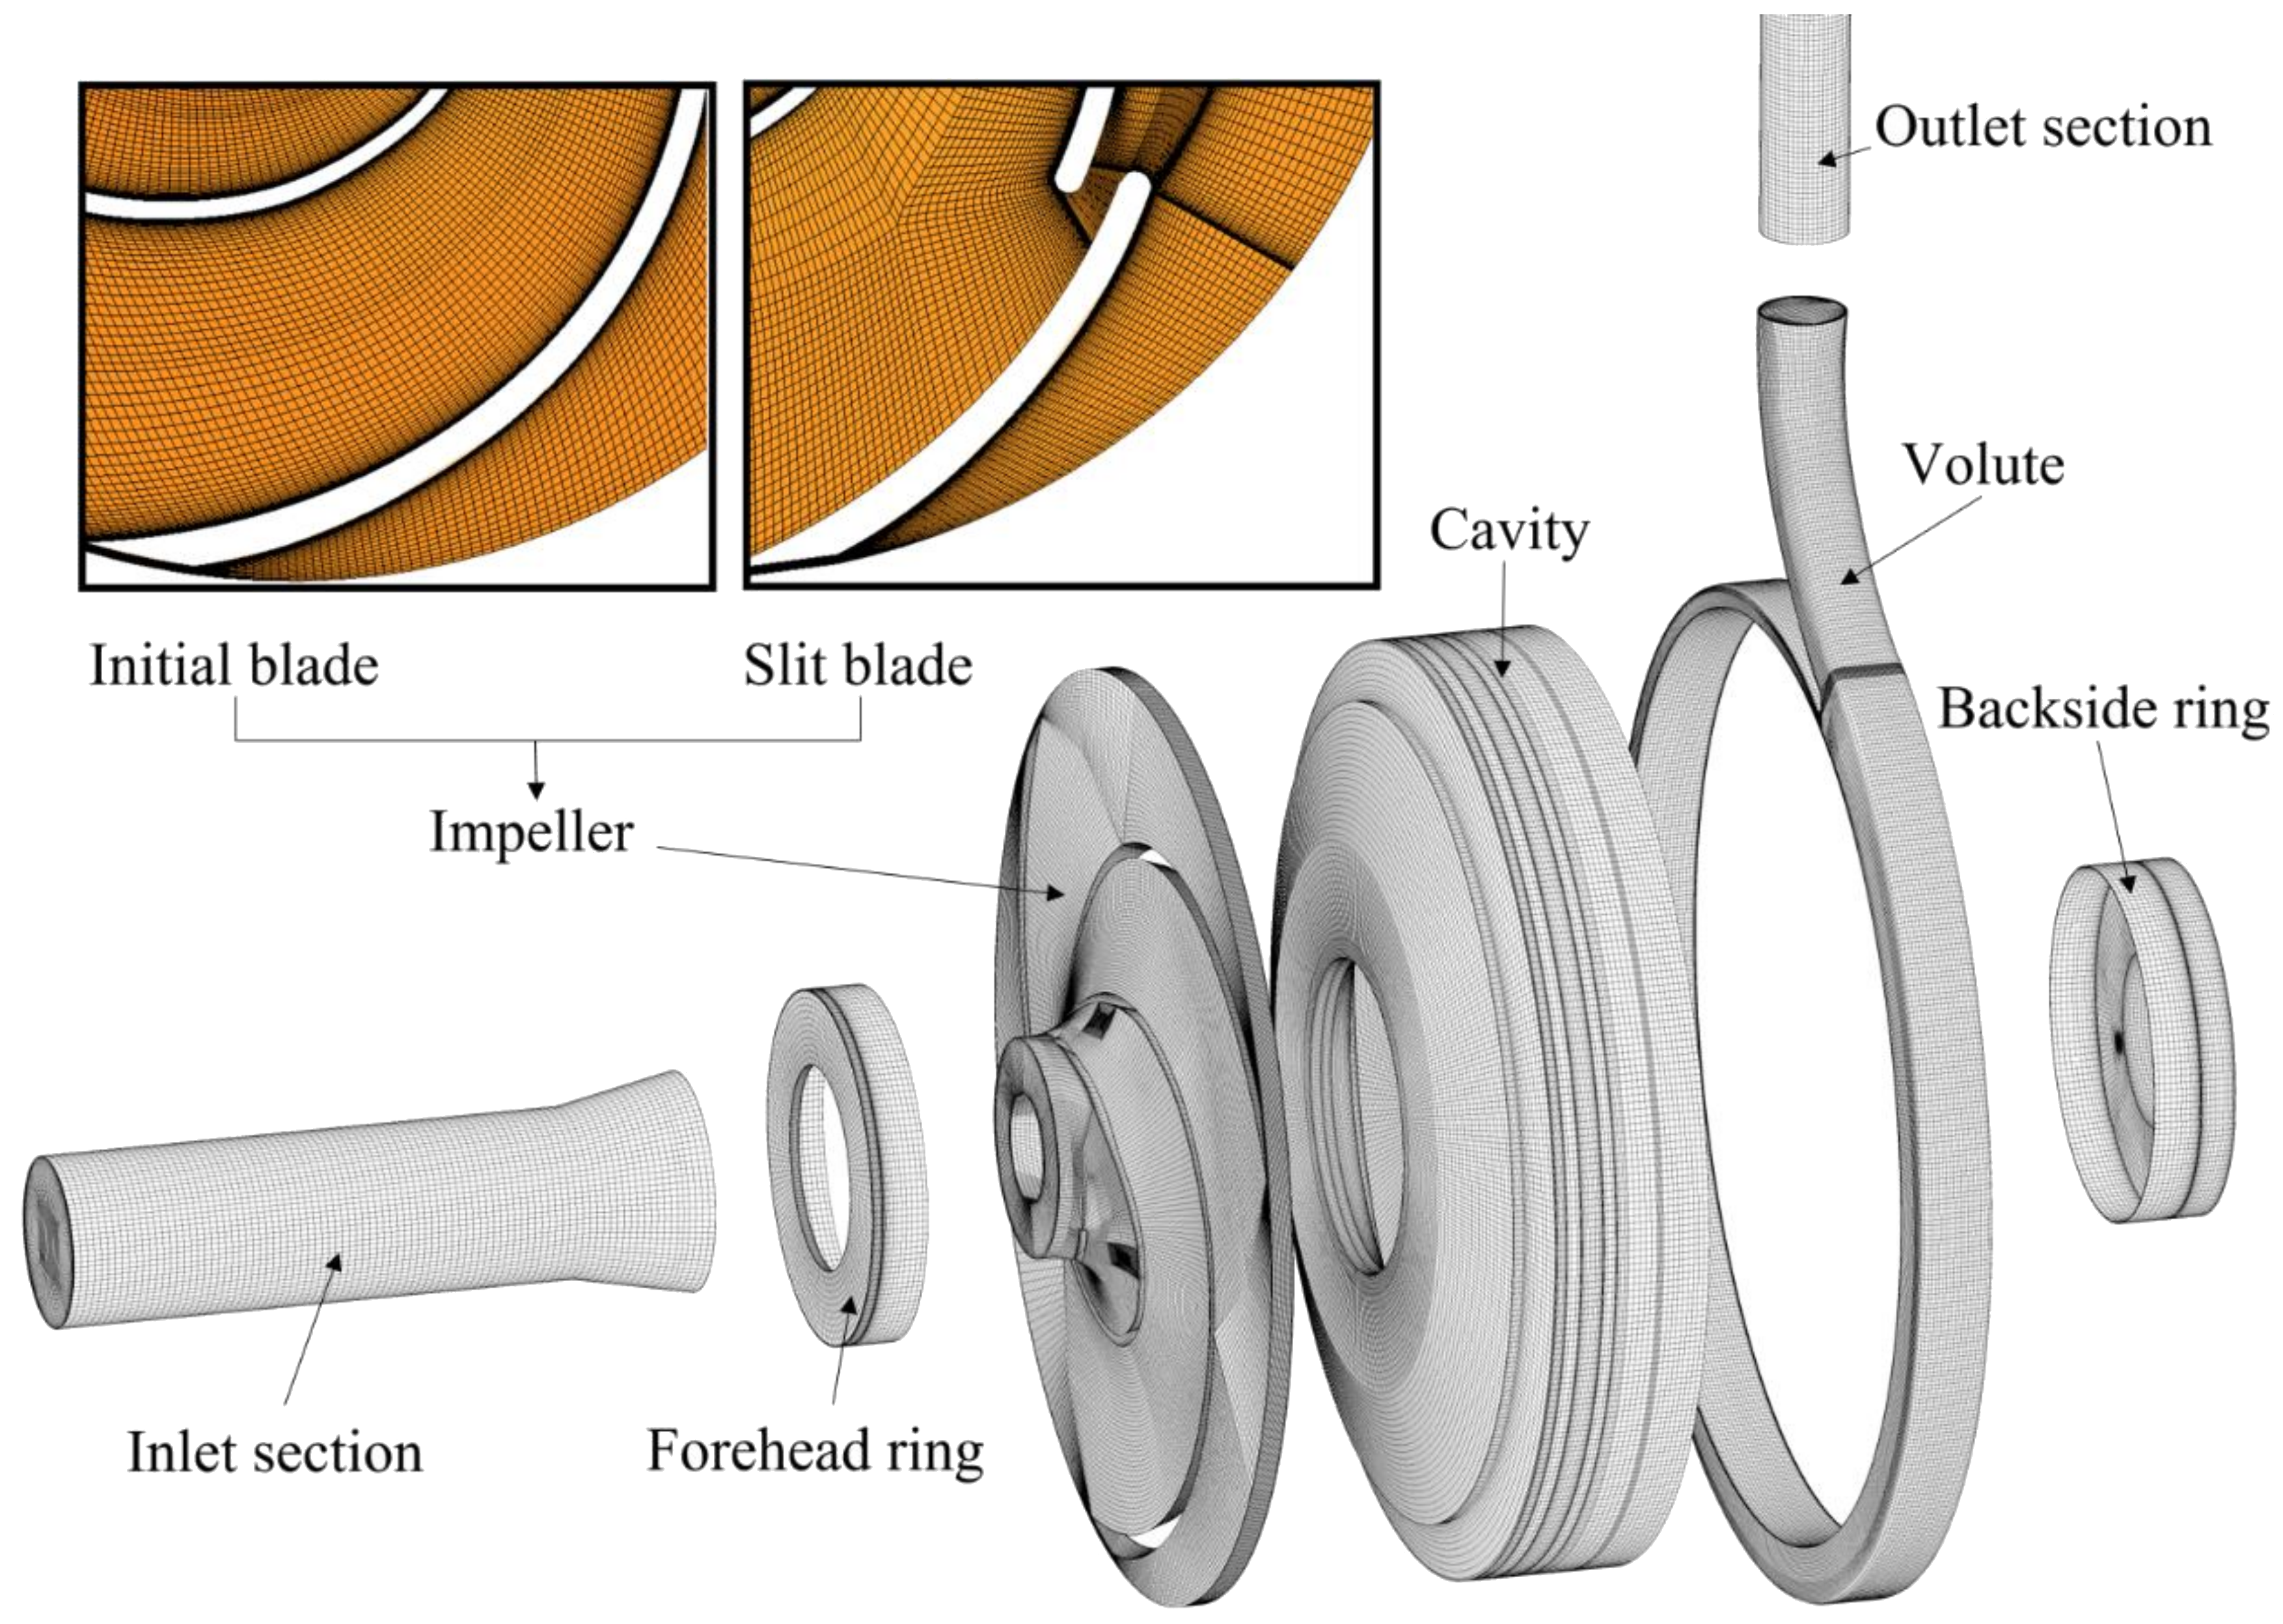
3.1. Three-Dimensional Model
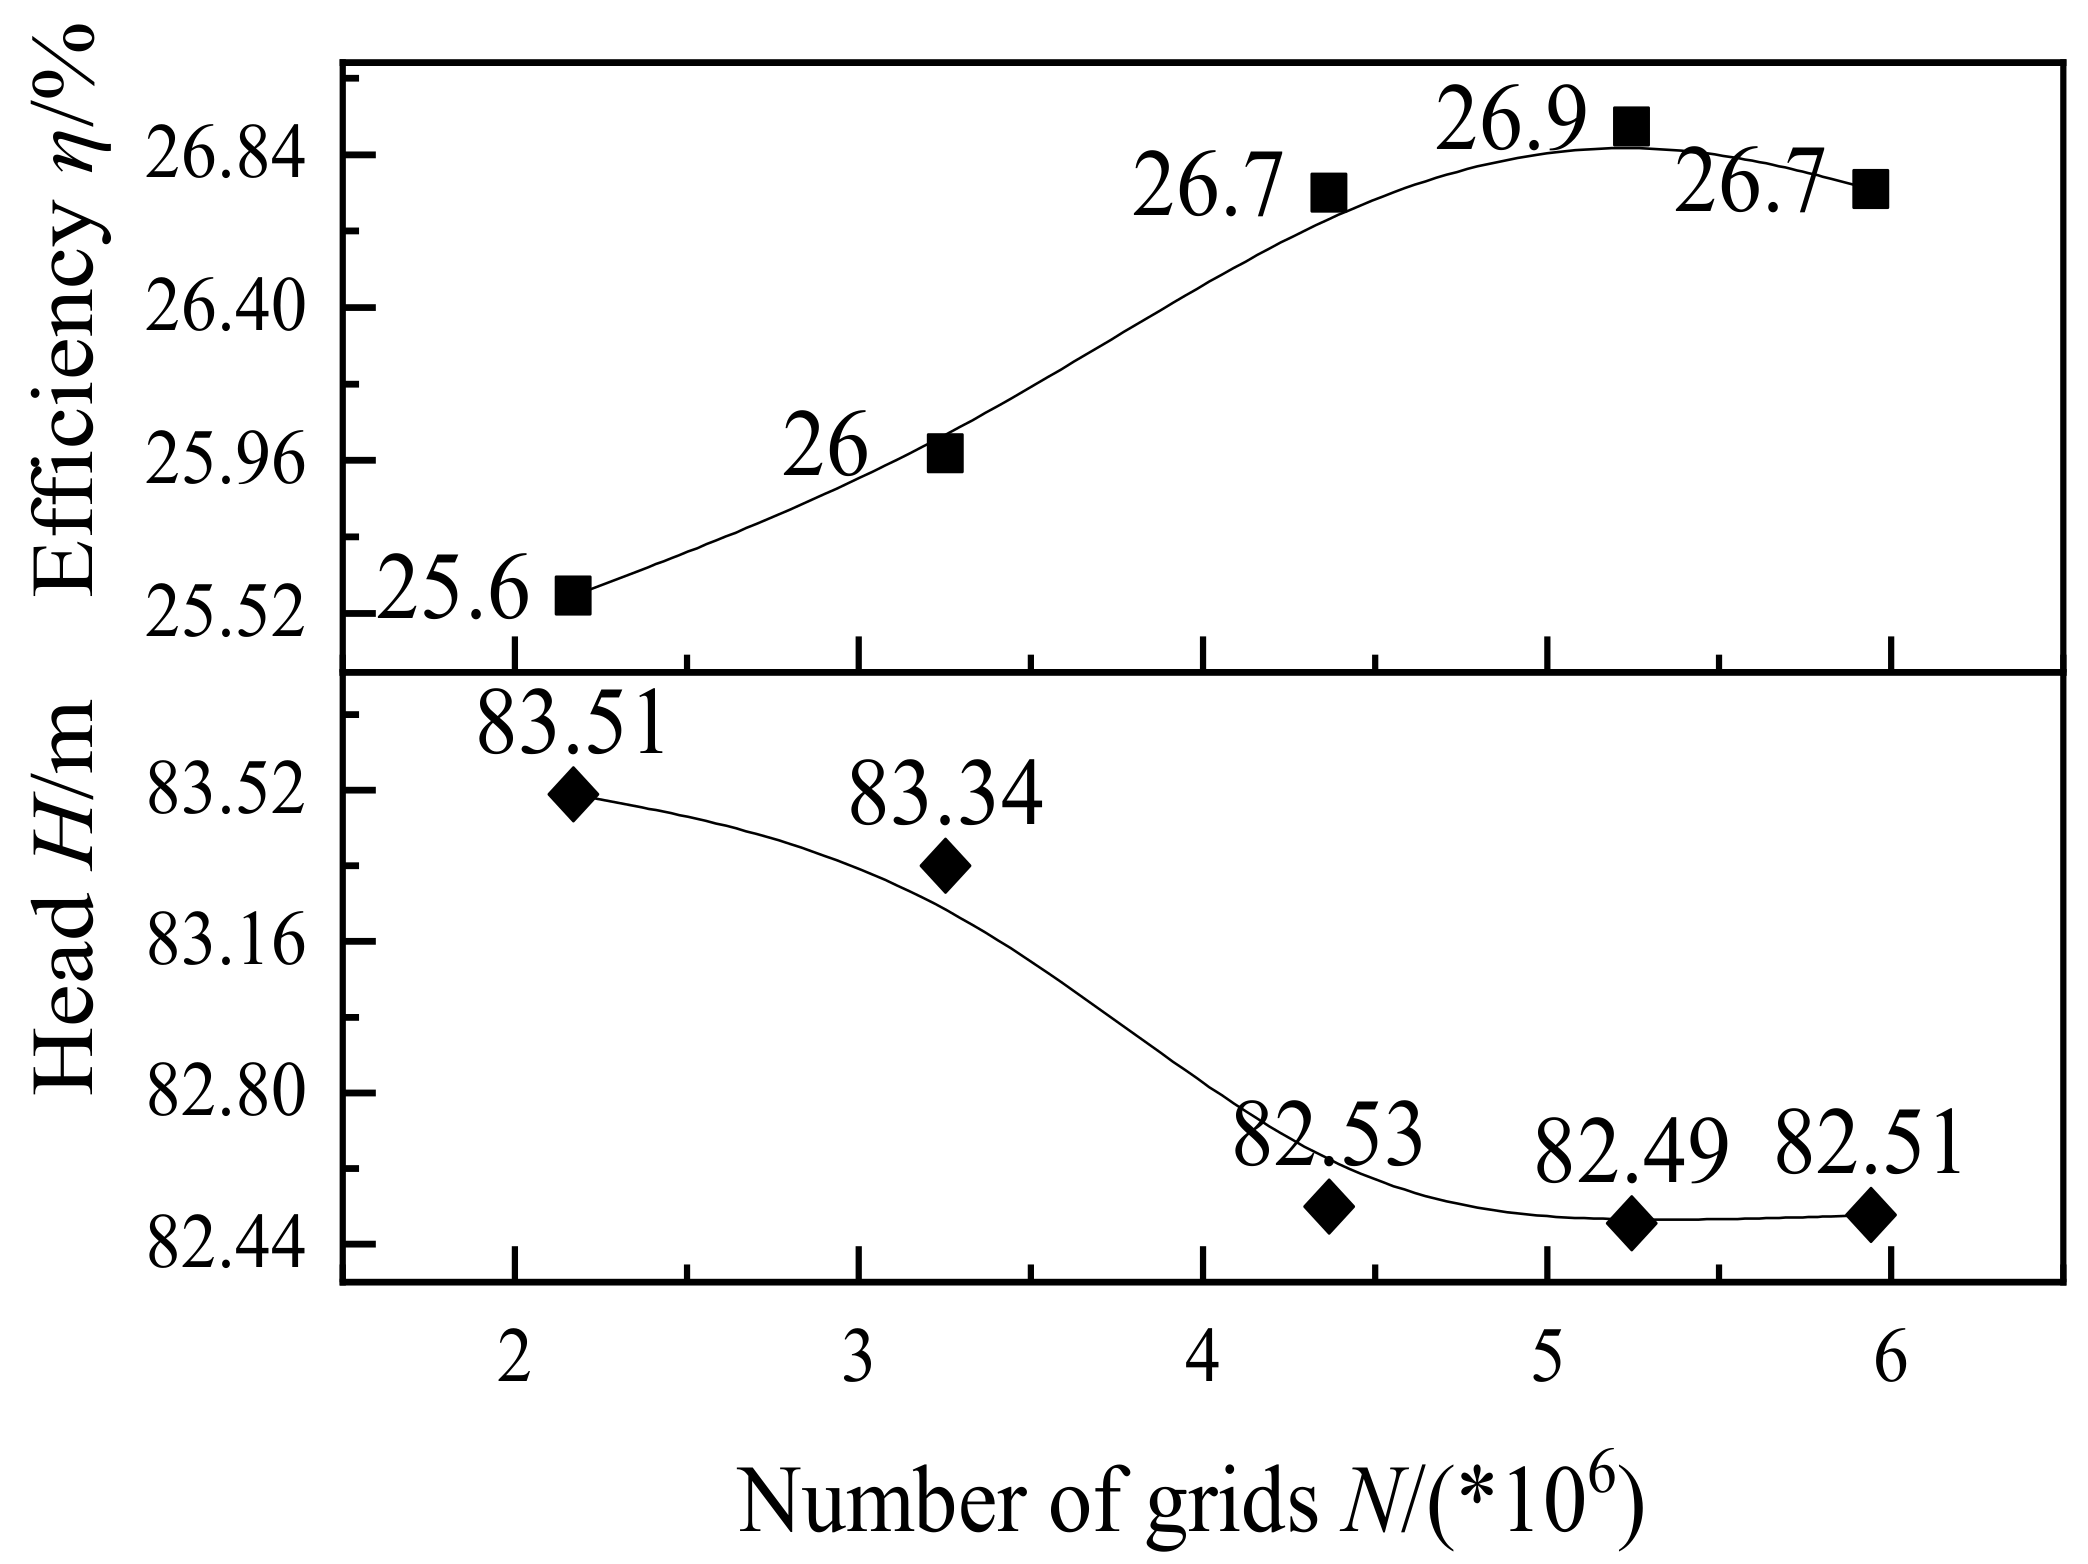
In order to improve the accuracy of the numerical calculations, a three-dimensional full-flow model is used in this paper. The components of the calculation field include the inlet section, the forehead ring, the impeller, the pump cavity, the suction side ring, the volute and the outlet section. The components are shown in Figure 2.

3.2. Grids

Compared to tetrahedral meshes, hexahedral meshes are more convenient for data transfer during numerical calculations, which not only improves the accuracy of numerical results, but also greatly reduces the calculation time. Therefore, the grids used in the numerical calculations in this paper are all hexahedral grids delimited by ANSYS-ICEM software. Figure 2 shows in detail the grid diagrams for each computational subdomain and shows the differences between initial blade and slit blade in different numerical schemes. The near-wall grids are encrypted during the gridding process to improve the prediction accuracy of the flow separation during numerical calculations.
In order to eliminate the influence of mesh number on the numerical results, the performances of the initial model with different mesh numbers were numerical predicted. Numerical predictions of the head and efficiency of the initial model are made using five scenarios with different grid numbers, and it is specified that the final selected scenario must meet the following conditions:
H i + 1 H i H i + 1 < 0.01
η i + 1 η i η i + 1 < 0.01
where i = 1~5, five grid schemes represent different numbers of grids.
Figure 3 shows the performance prediction results of the initial model for five grid scenarios. It can be found that as the number of grids increases, the prediction of head and efficiency tends to smooth out when the number of grids is greater than 4 × 10⁶. When i ≥ 3, the numerical predictions have fulfilled the above requirements. Therefore, the mesh size control scheme in the third group of grids is chosen for all numerical calculations in this paper.

3.3. Boundary Conditions

The mesh assembly and solution calculations in this paper are performed in ANSYS CFX. The inlet and outlet boundary conditions are set by “inlet total pressure and outlet mass flow rate”, which is convenient for the convergence of rotating machinery simulation, and the solution accuracy is set to 10−4. The impeller subdomain is set as the rotational domain, and the other subdomains are all static domains. Set interface between each subdomain, general connection between stationary subdomains, and frozen rotor between static and dynamic subdomains. The numerical calculations in this paper are based on the most commonly used two-equation k-omega turbulence model, which attempts to predict turbulence by two partial differential equations as two variables, k and ω, where k determines the energy in the turbulence and ω is the variable that determines the scale of the turbulence.

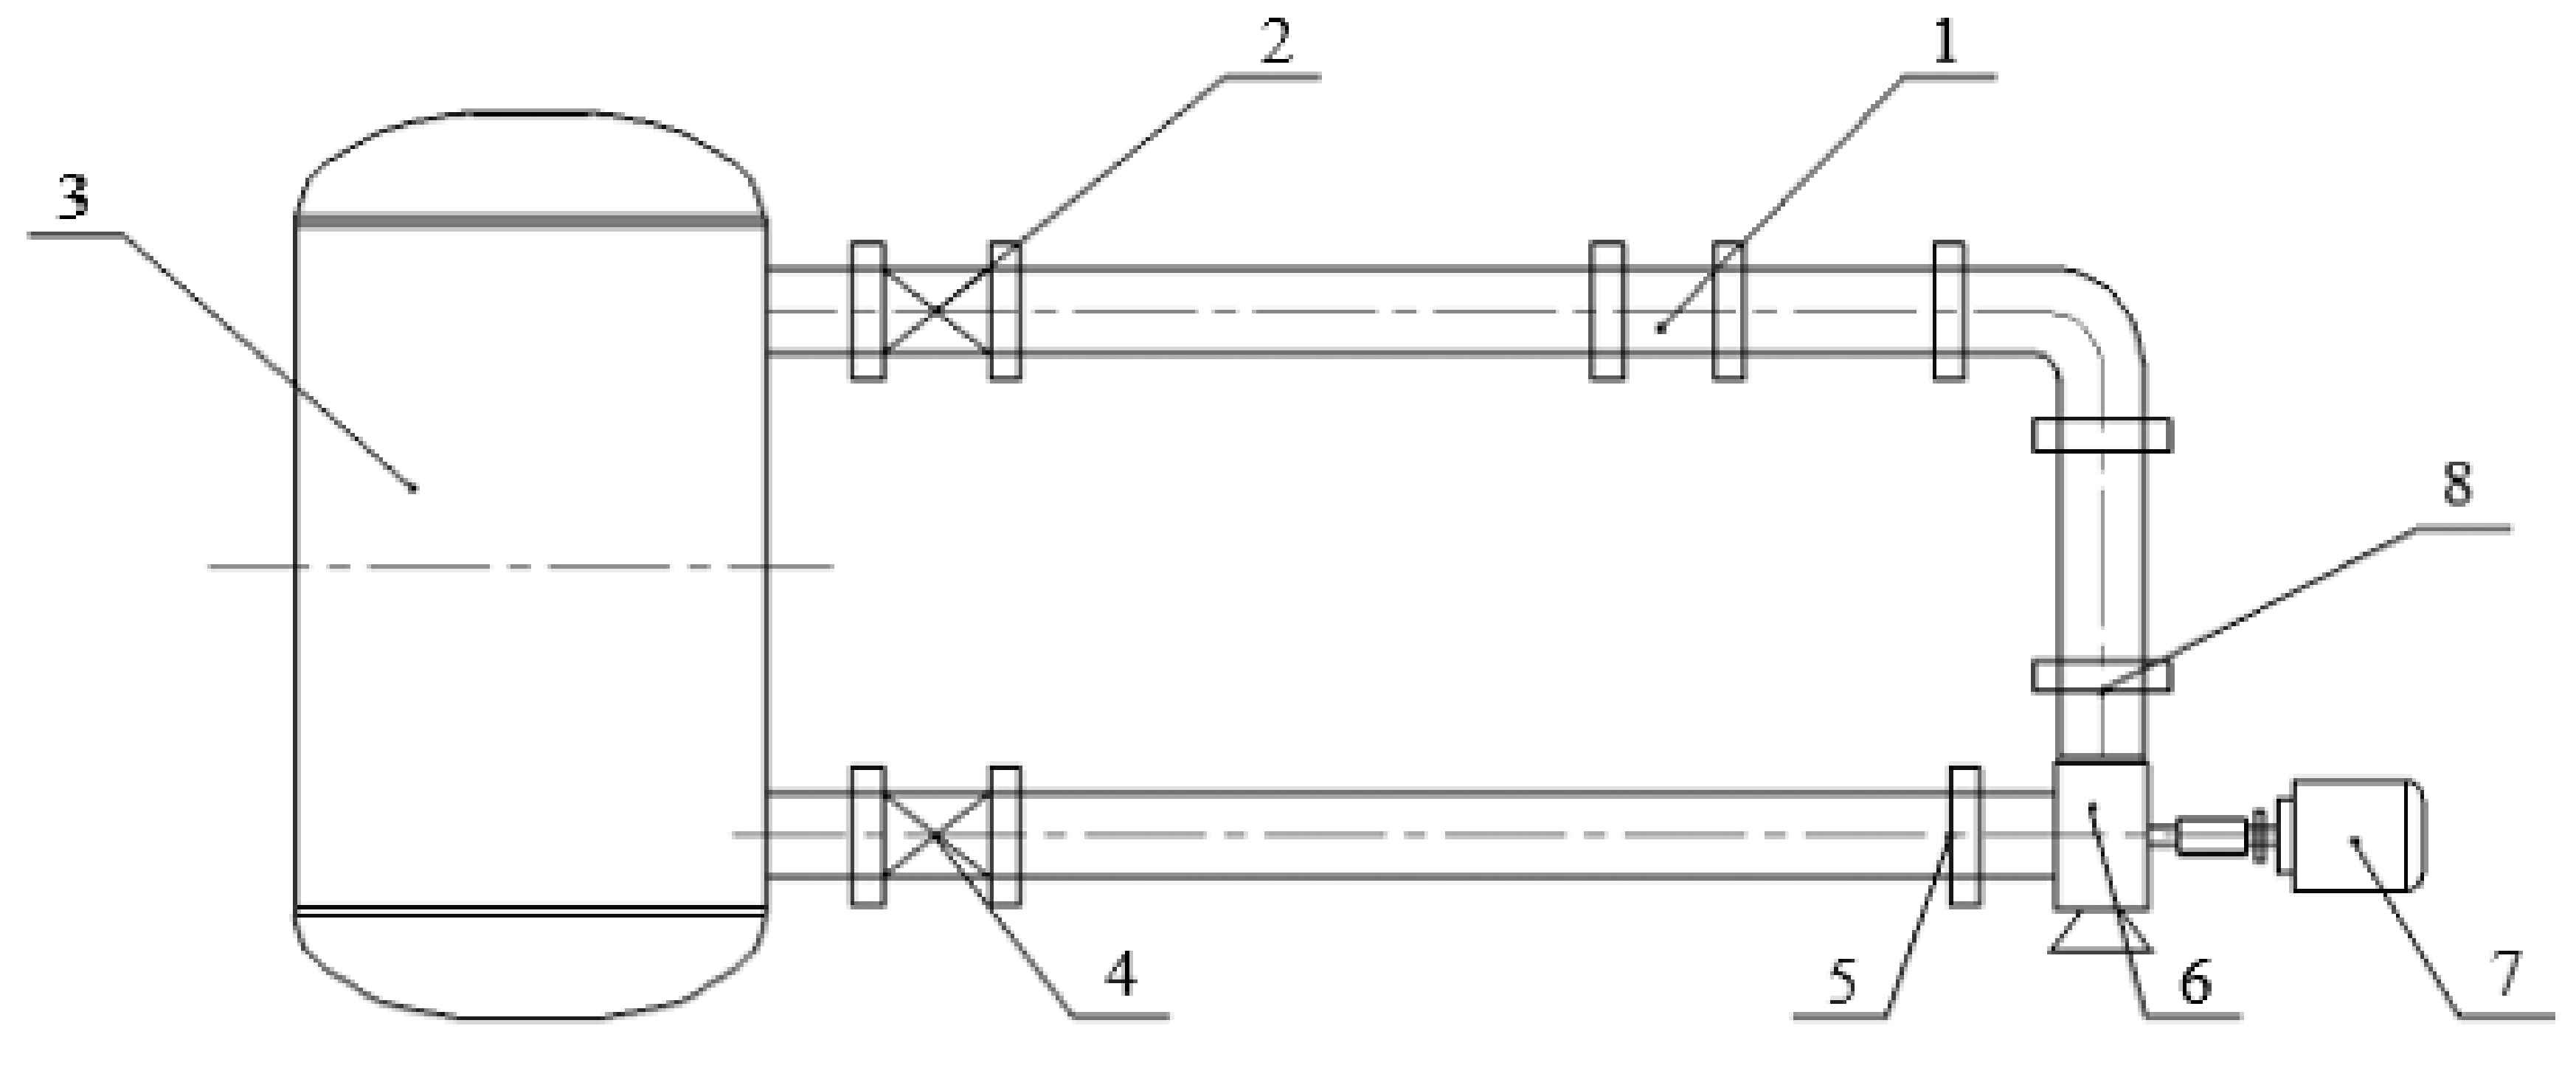
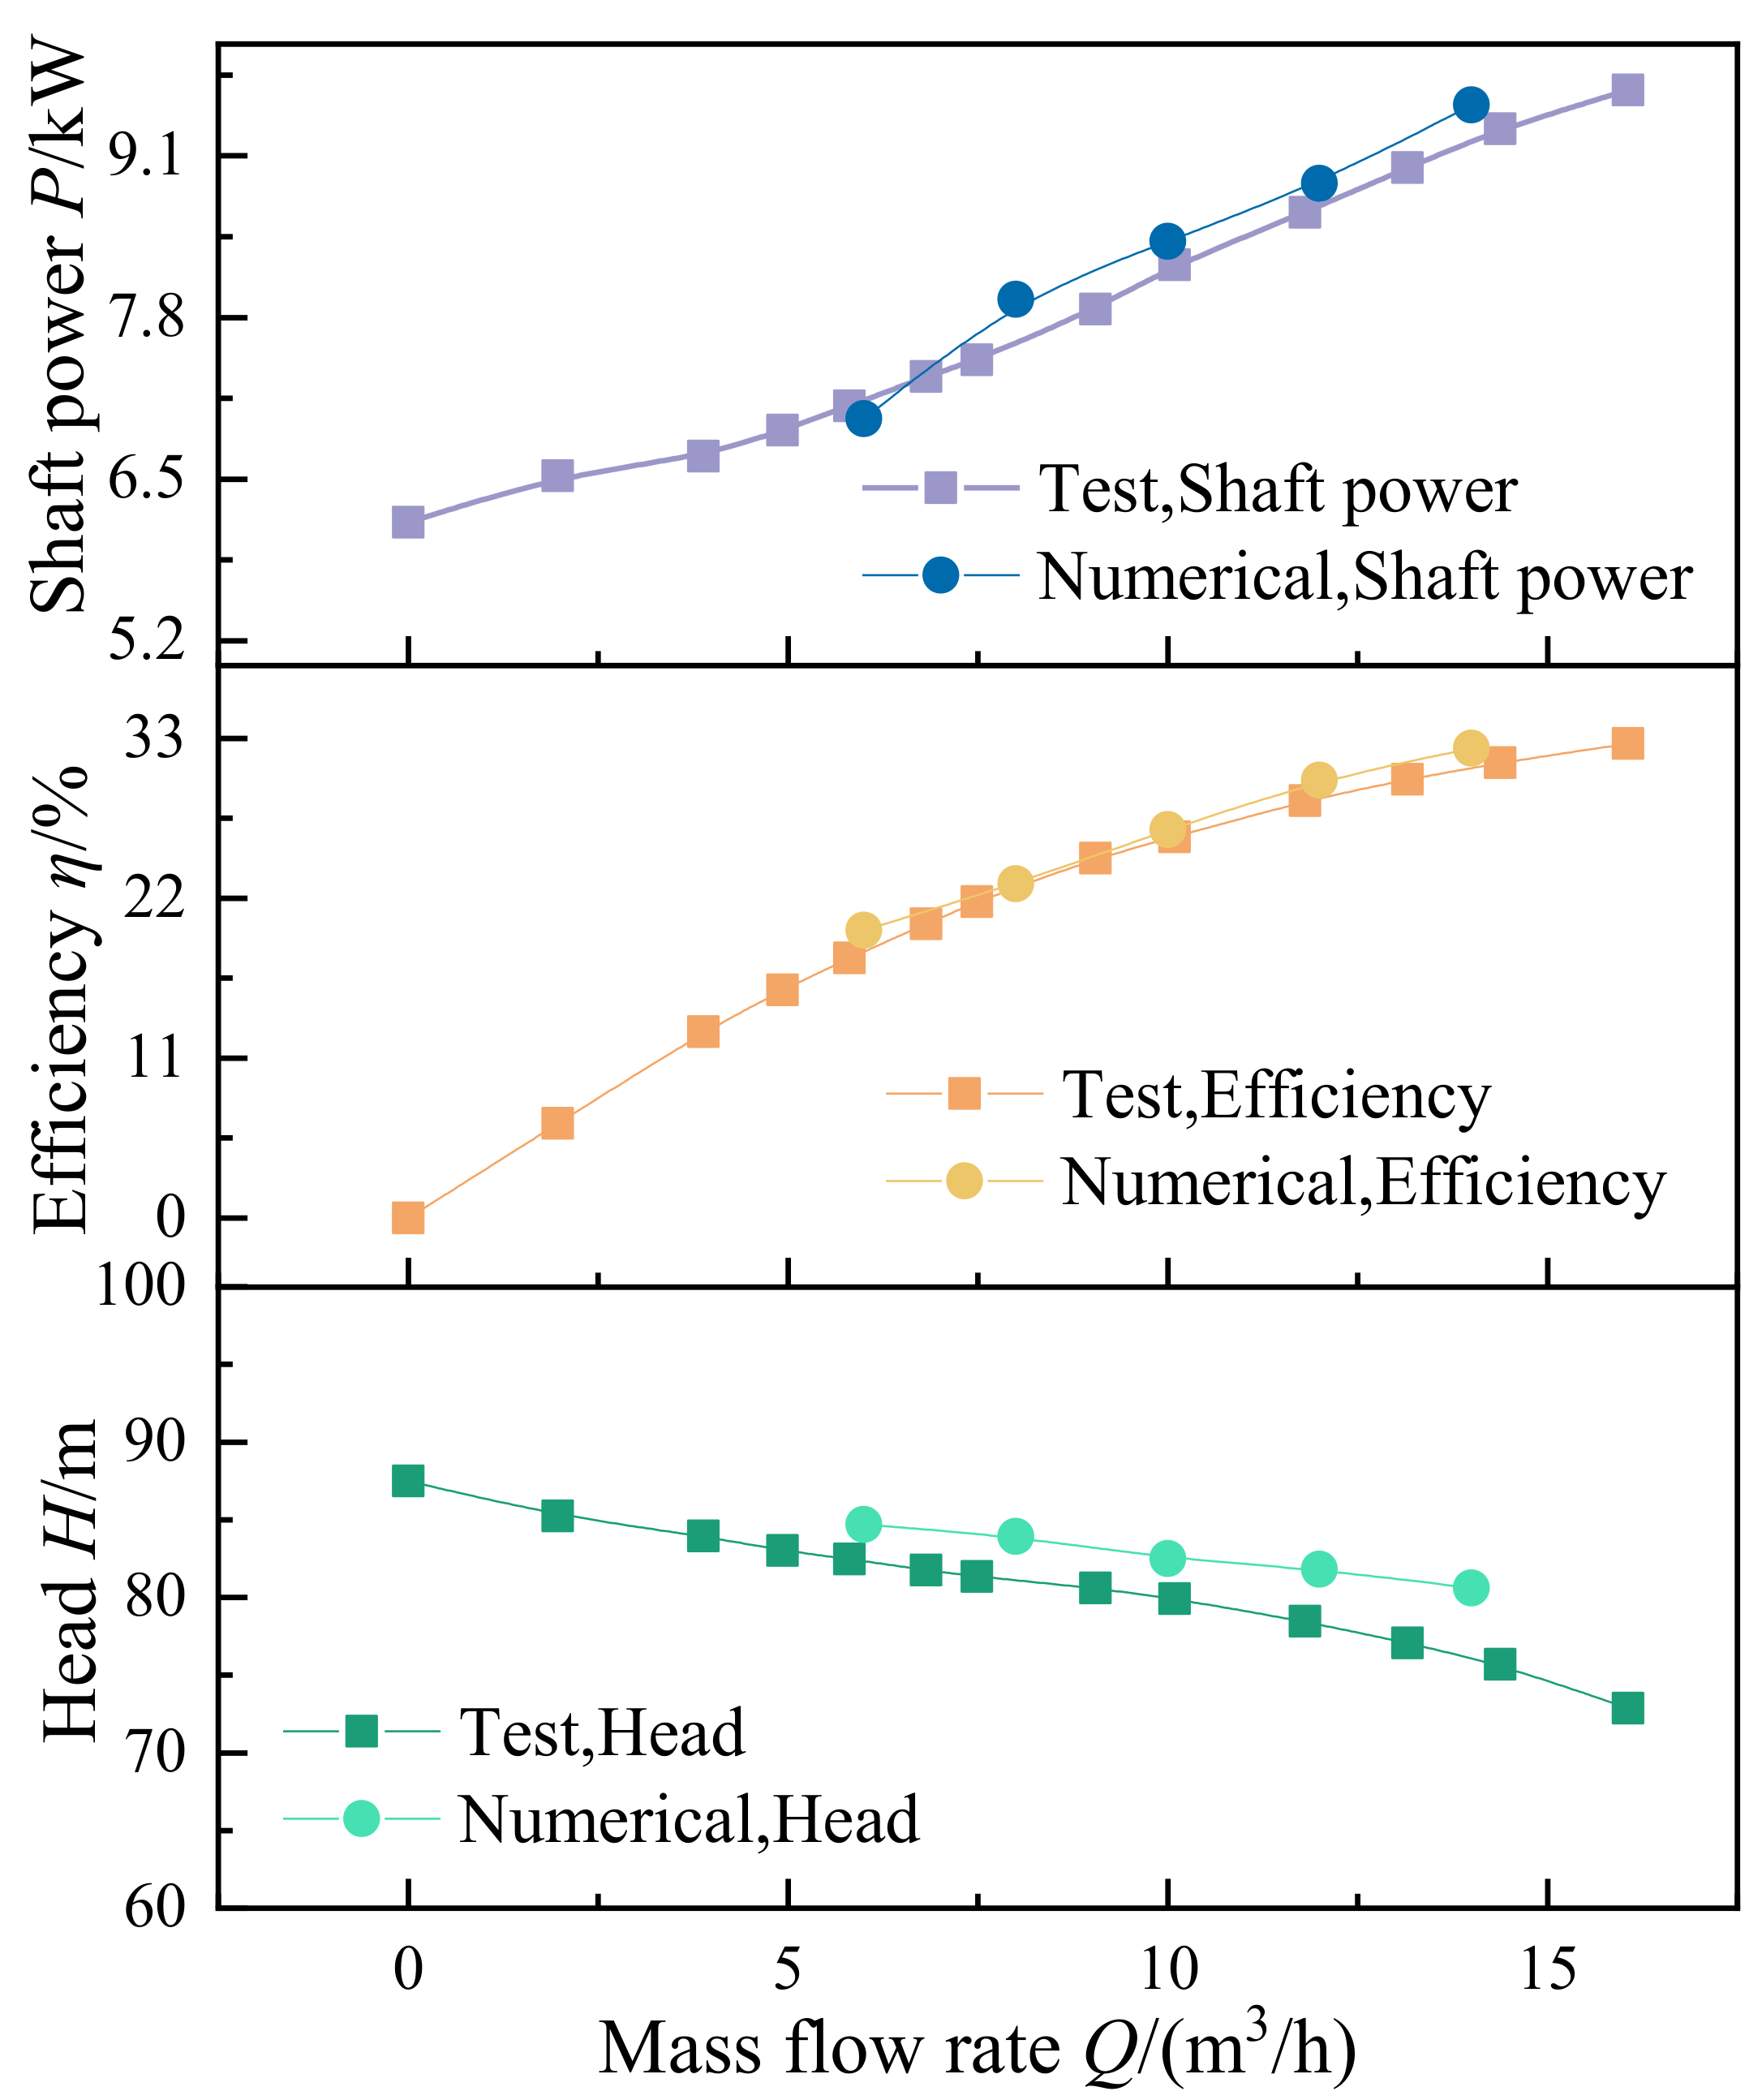
4. Pump Performance Validation

In order to verify the accuracy of the numerical calculations, the performance test of the initial model was carried out. Figure 4 shows the diagram of the test system and the important components of the system. The test system components marked with serial numbers in the figure correspond to the following: 1. Electromagnetic flowmeter, 2. Outlet valve, 3. Water tank, 4. Inlet valve, 5. Inlet pressure gauge, 6. Centrifugal pump, 7. Electric motor, 8. Outlet pressure gauge. Electromagnetic flowmeter can obtain the instantaneous flow of the test system, and the import and export pipeline manometer can measure the pressure of the import and export medium, and then obtain the pump head. The shaft power of the pump is monitored by an electrical control unit equipped with the test system.
Figure 5 shows the comparison between the test results and numerical prediction results of the initial model of the low specific speed centrifugal pump. Under the rated flow condition, the numerical prediction of head is 3.11% higher than the test result, the numerical prediction of efficiency is 1.79% higher than the test result, and the numerical prediction of shaft power is 2.24% higher than the test result. Therefore, the numerical method in this article has certain accuracy in predicting the rated performance. At the same time, under full flow conditions, the curve changes of head, efficiency and shaft power maintain a high level of consistency with the test results. The deviation of the head and efficiency prediction results is less than 5% under full flow conditions. Therefore, the numerical methods in this paper are effective in obtaining the performance of hydraulic models of low specific speed centrifugal pumps.

5. Orthogonal Test and Results

5.1. Determination of Orthogonal Test Schemes

According to the selected three factors and four levels of selection of L16 (43) orthogonal table, the centrifugal pump hydraulic efficiency and head are used as the measure of centrifugal pump performance indicators. The factor level table is shown in Table 1.
Based on the chosen orthogonal table, a three-factor, four-level test table is shown in Table 2.

5.2. Summary of Orthogonal Test Results

Table 3, Table 4 and Table 5 show the numerical results of the 16 orthogonal schemes for 0.6Qdes, 1.0Qdes, and 1.4Qdes flow conditions, respectively.

5.3. Analysis of Orthogonal Test Results

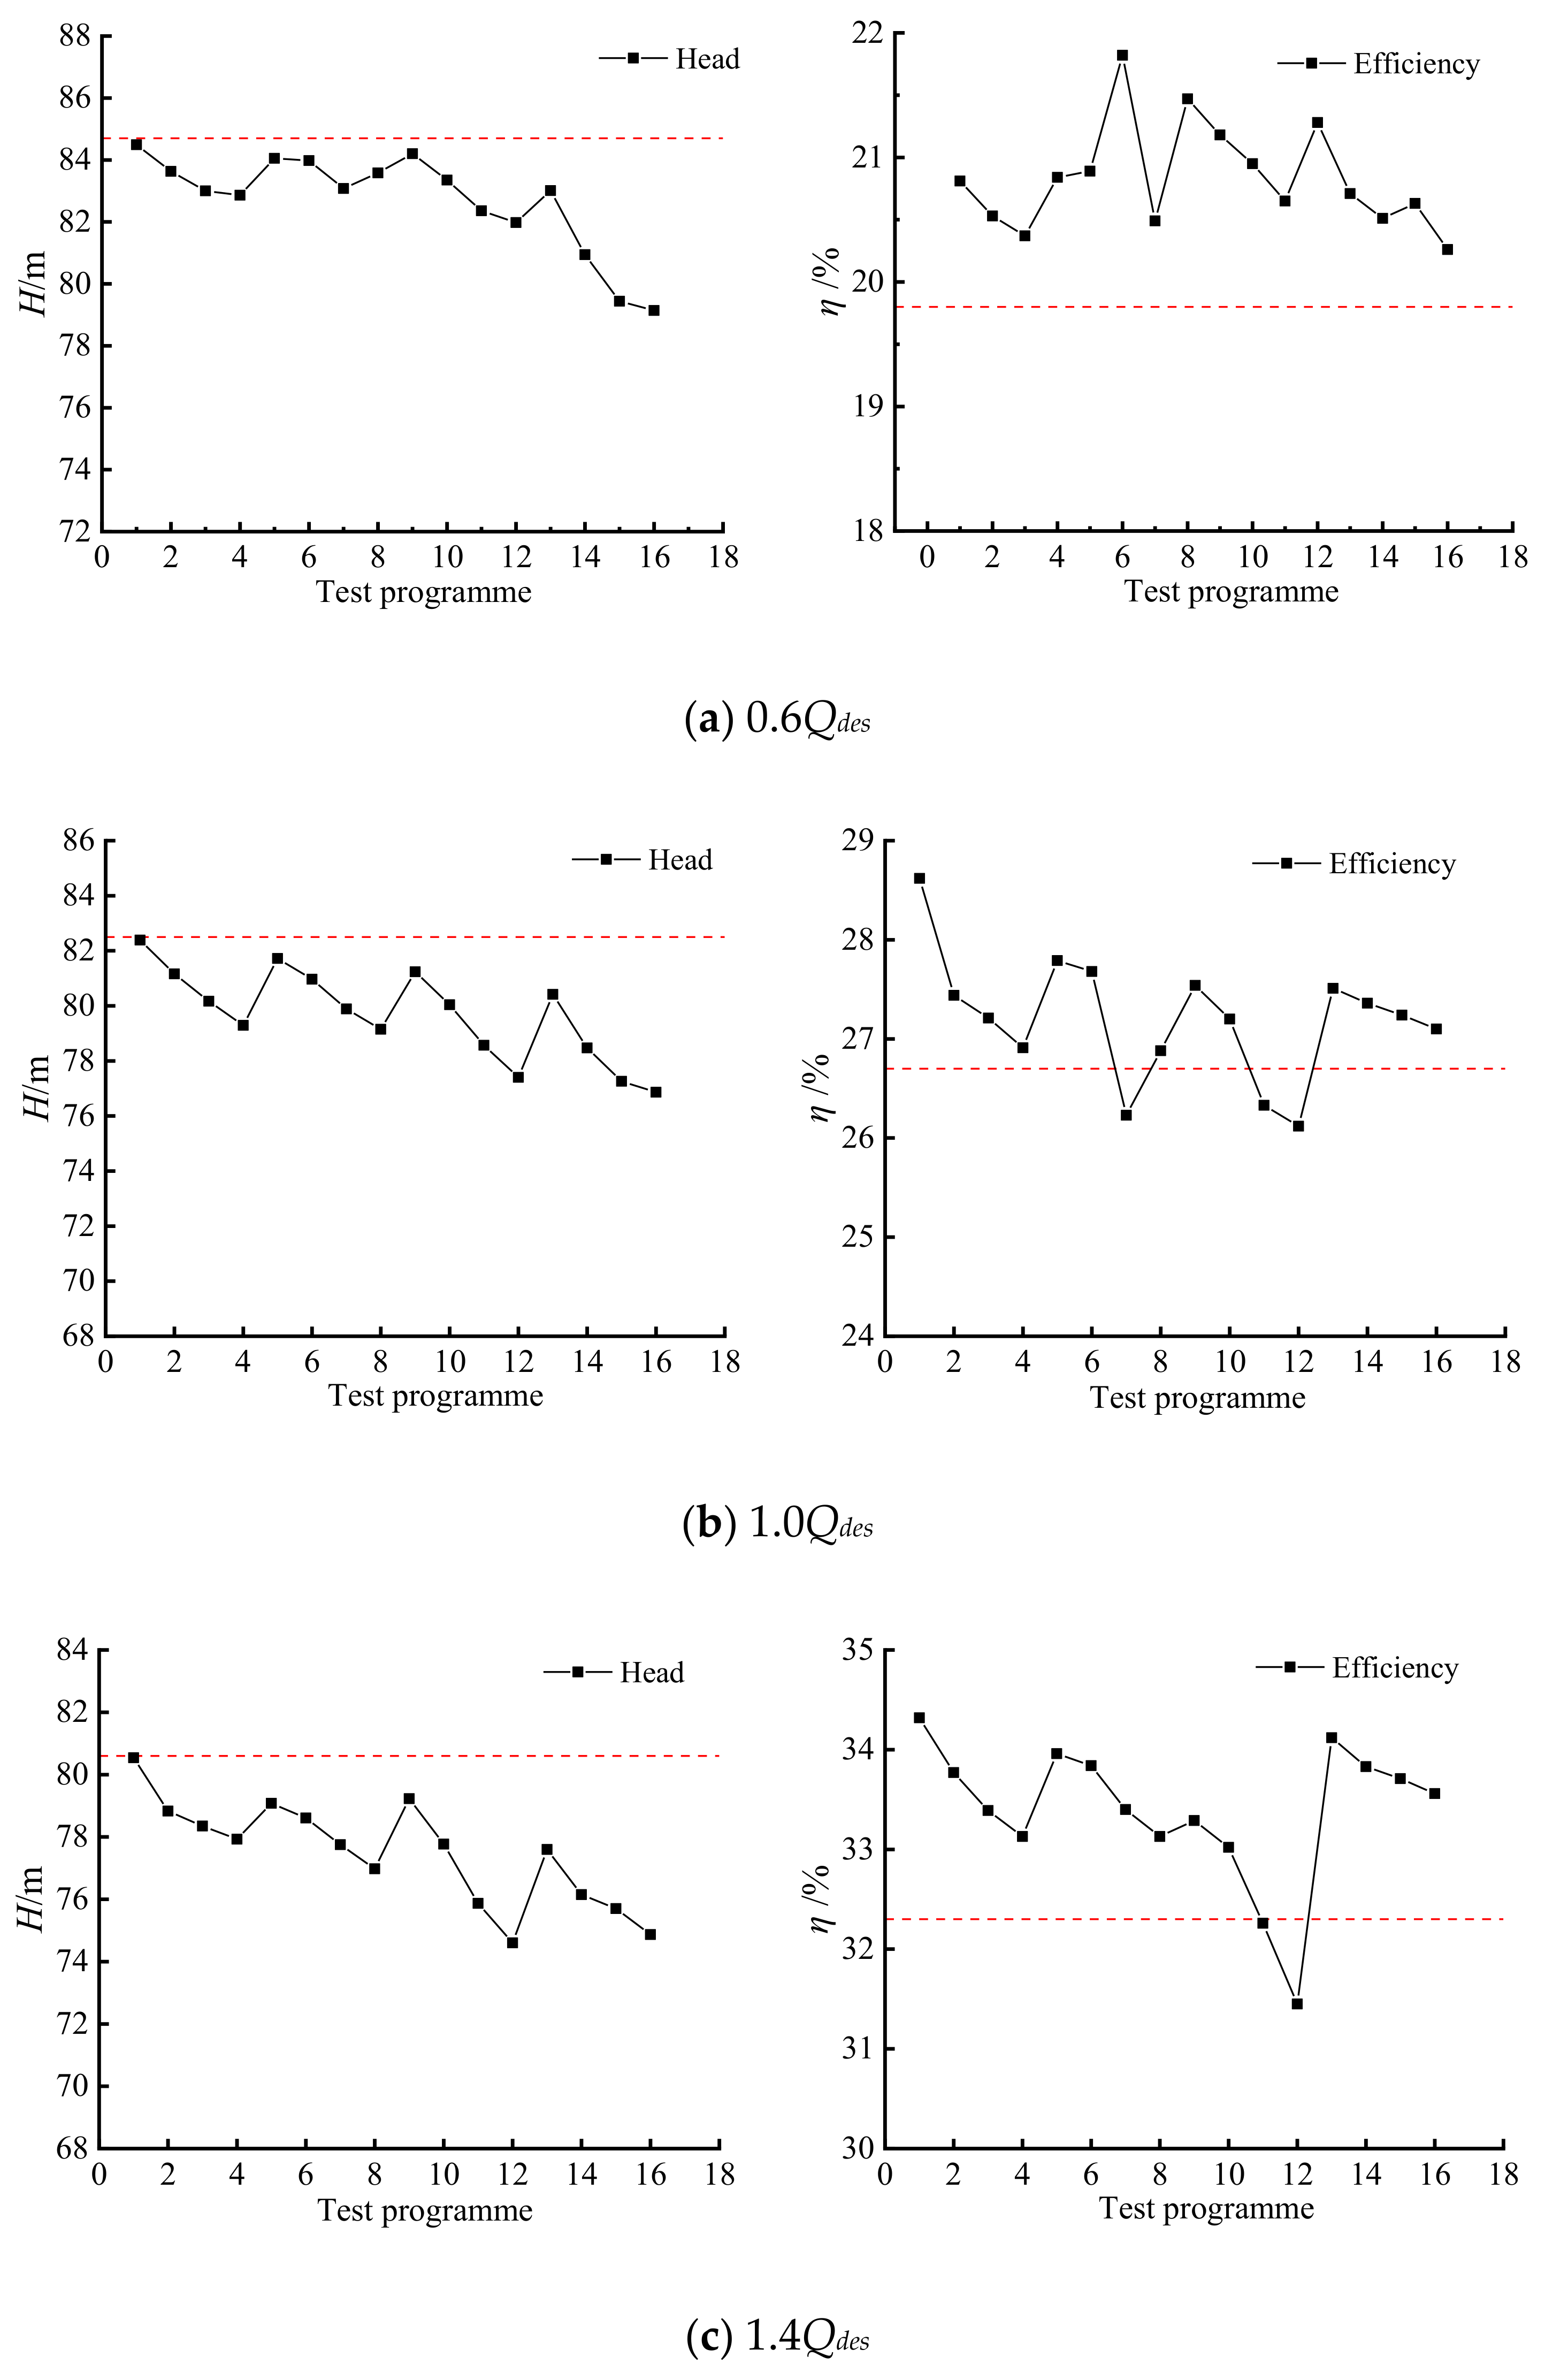
5.3.1. Direct Analysis of Test Results

Figure 6 shows a line graph of the 16 orthogonal test results, with the red dashed line indicating the performance of the original model under current conditions. On the whole, the drainage tough impeller has a more obvious impact on the performance of the low speed centrifugal pump, while the impact of different parameter combinations on the pump performance varies. The 16 orthogonal solutions have lower head at 0.6Qdes, 1.0Qdes, and 1.4Qdes than the original model, but most of them are more efficient than the original model. For the purpose of analysis, four schemes with the same slit diameter are referred to as a group, and it can be found that the slit diameter is kept constant within the same group, with a linear progressive increase in slit width and a disorderly distribution of the lap lengths of short and long blades. However, the centrifugal pump head within the same group also shows a linear downward trend, with only a local increase at 0.6Qdes in orthogonal scheme 8. Therefore, to some extent, it can be considered that the same opening slit diameter and gap width are the main factors affecting the pump head, and the pump head is negatively correlated with the length of the blade lap length on the head is not a big influence. Pump efficiency shows a similar trend to head at 1.0Qdes and 1.4Qdes, with a linear downward trend within the same group. However, it does not show a regular trend at 0.6Qdes, which indicates that the influence of long and short vane lap length on pump efficiency is enhanced at 0.6Qdes, and the interaction between slit diameter, gap width and long and short vane lap length is enhanced.
It was also found that the head and efficiency were lower than the original model in the third group of schemes 9~12, indicating that a slit in the middle of the blade would cause a significant reduction in pump performance and should be avoided. The fourth group of scheme 13~16 has a significantly lower head than the other groups, while the scheme 13~16 slit diameter is 180 mm, indicating that the closer the slit position is to the trailing edge of the blade, the more significant the effect on the head. At the same time, it was found that there are individual solutions whose heads are similar to the original model, but the efficiency is significantly improved. For example, at 0.6Qdes, 1.0Qdes, and 1.4Qdes, the head of scheme 1 is similar to the original model, and the efficiency is respectively increased by 1.01%, 1.92%, and 2.02%, indicating that the application of this kind of slit priming impeller in low specific speed centrifugal pumps is feasible.

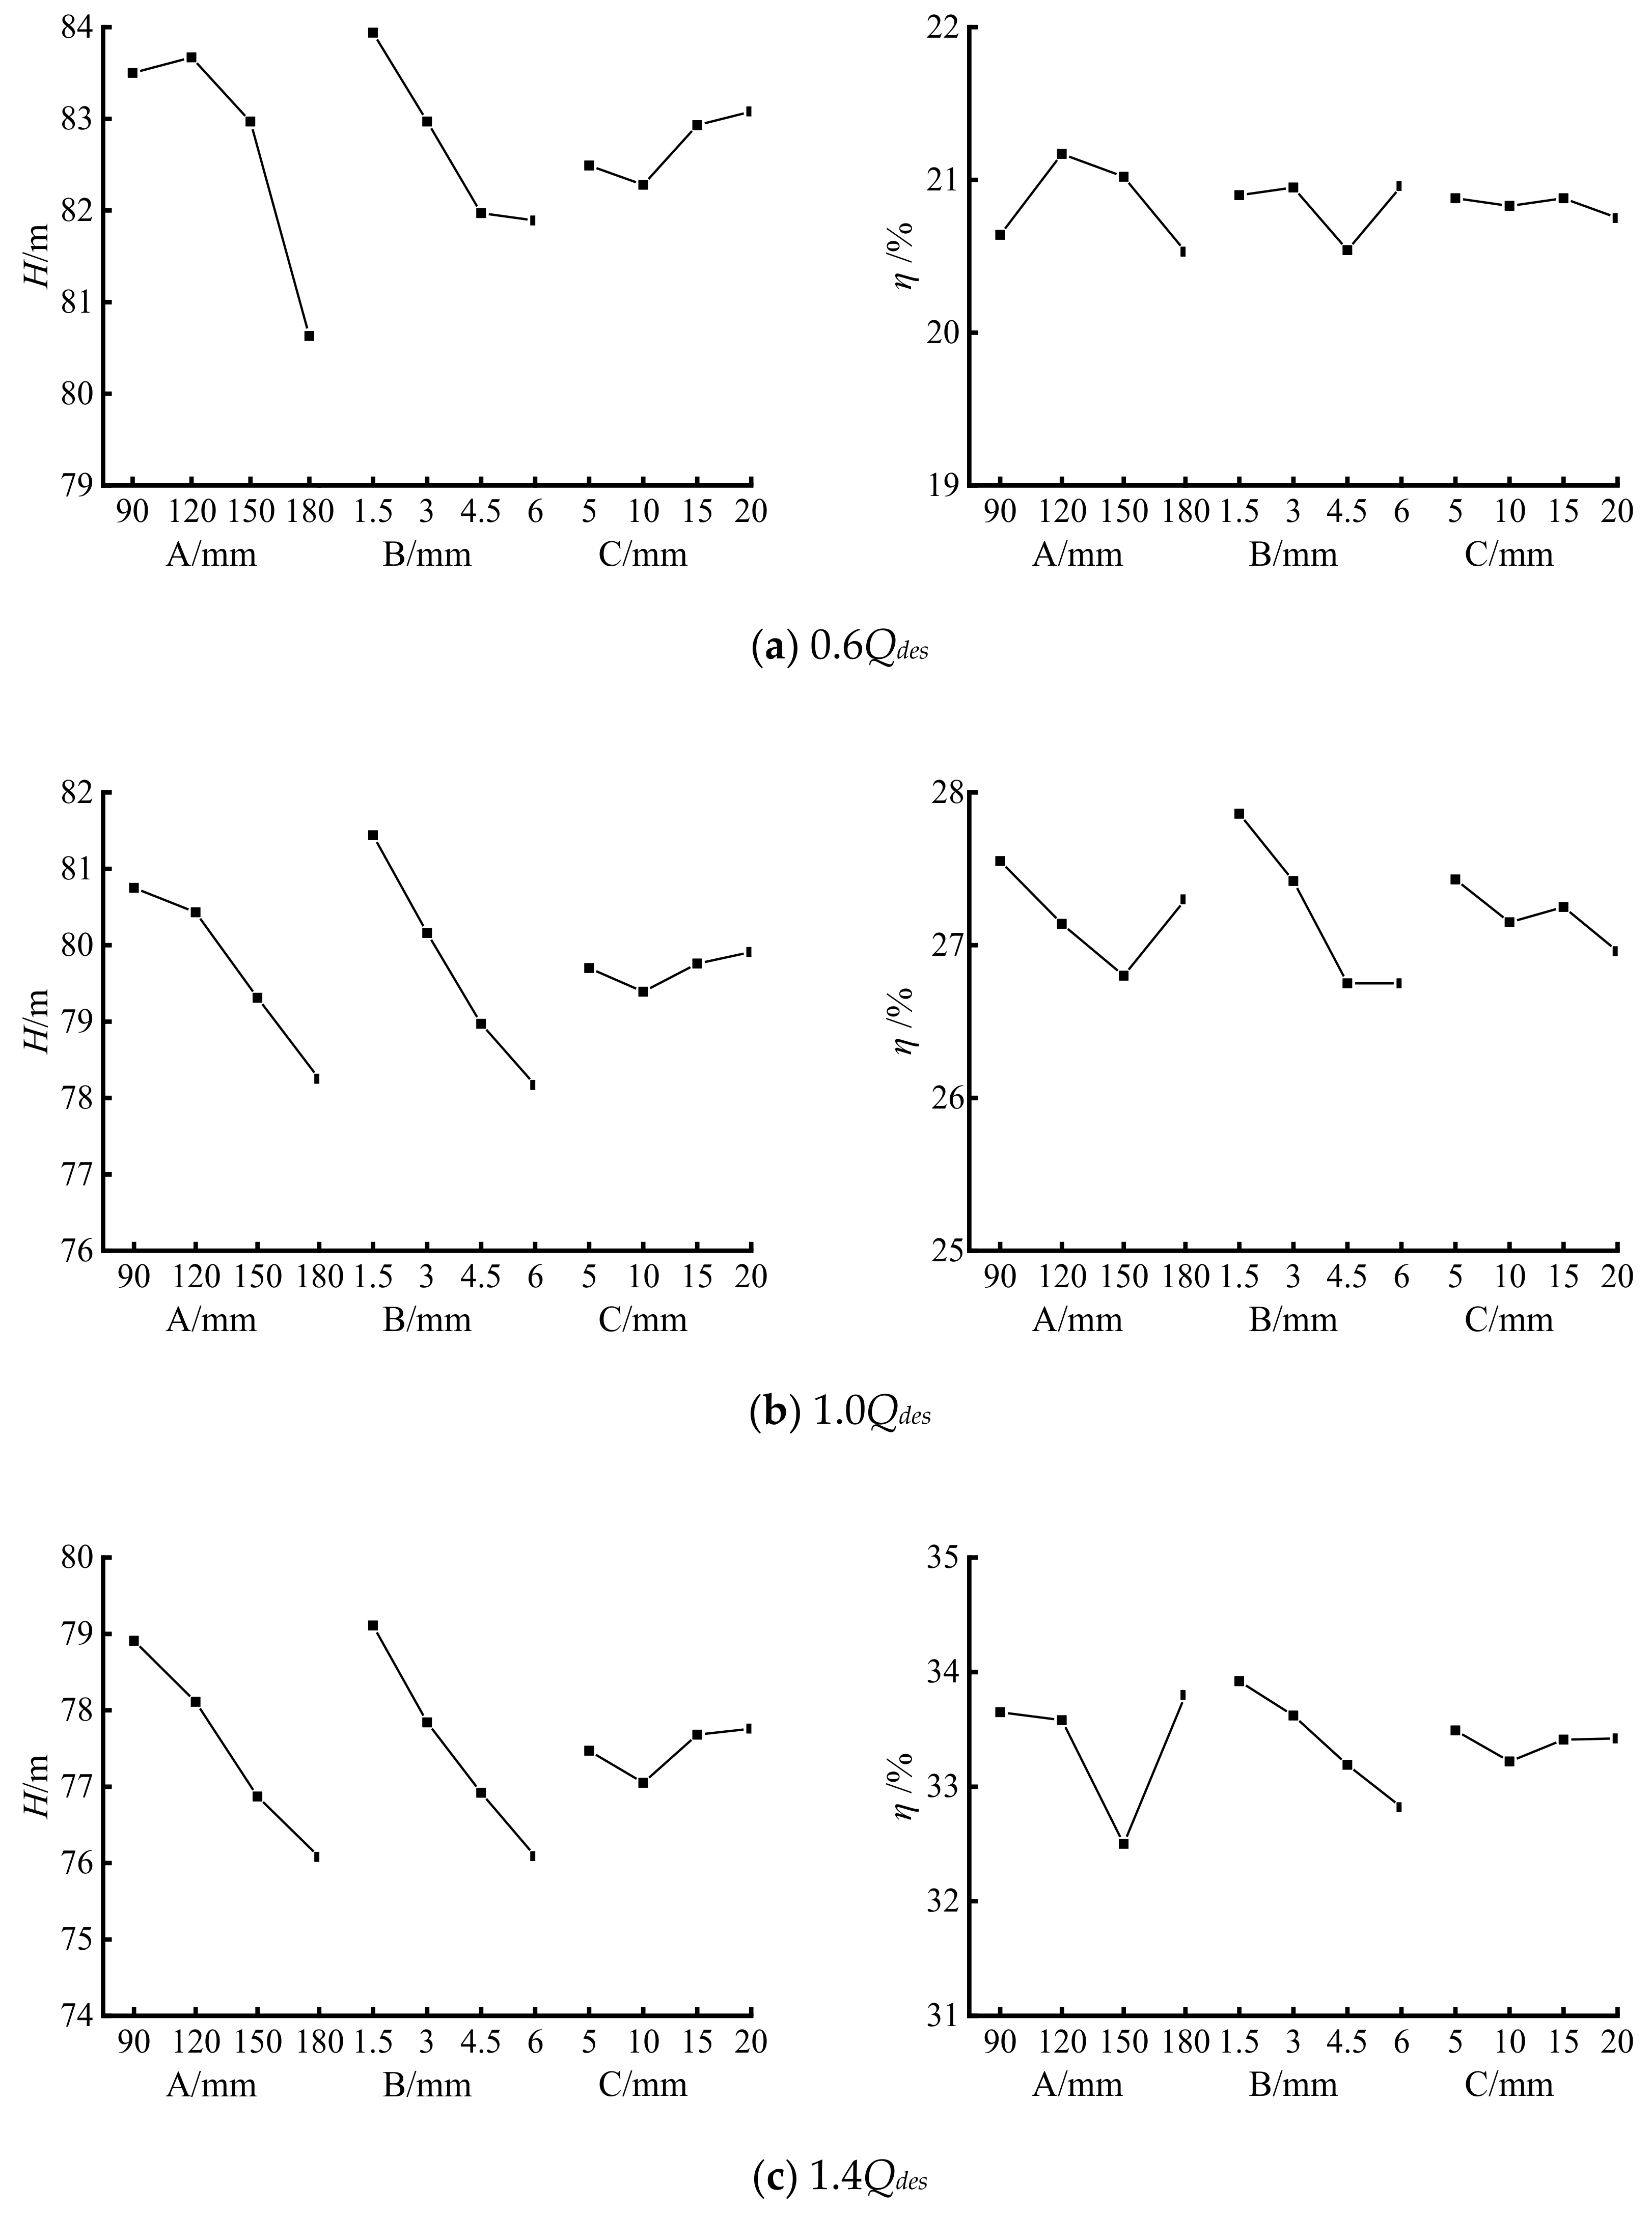
5.3.2. Analysis of Extreme Variance of Test Results

In this orthogonal test, the efficiency is considered as the first requirement and the head is second. In order to study the main factors influencing the performance of the gap induced impeller, the selected levels of each factor were analyzed using the extreme difference analysis method at three different conditions: 0.6Qdes, 1.0Qdes, and 1.4Qdes, respectively. The greater the extreme difference, the more significant the effect of the corresponding factor on the test indicator. In the table, Kj (j = 1, 2, 3, 4) denotes the sum of the values of the jth level of each factor, Kj is the mean of the jth level of each factor, and R is the extreme difference.
k j = 1 n K j   ( n   is   the   number   of   occurrences   at   the   same   level )  
R = max k 1 , k 2 , , k j min k 1 , k 2 , , k j
According to Table 6, the significant degree of influence of each factor on the head and efficiency of the low specific speed centrifugal pump at 0.6Qdes working condition is shown in Table 7.
According to Table 8, the significant degree of influence of each factor on the head and efficiency of the low specific speed centrifugal pump at 1.0Qdes working condition is shown in Table 9.
According to Table 10, the significant degree of influence of each factor on the head and efficiency of the low specific speed centrifugal pump at 1.4Qdes working condition is shown in Table 11.
Combining the statistical information in Table 6, Table 7, Table 8, Table 9, Table 10 and Table 11, we can find that at 0.6Qdes, factor A is the main factor influencing the head, factor B is second, and factor C has the least influence. At 1.0Qdes and 1.4Qdes, factor B is the main factor influencing the head, factor A is second, and factor C has the least influence. Factor A was found to be the main factor affecting efficiency at 0.6Qdes and 1.4Qdes, followed by Factor B, and Factor C had the least effect at 0.6Qdes and 1.4Qdes; at 1.0Qdes, factor B is the main factor affecting efficiency, followed by factor A, and factor C has the least impact.
It can be seen from Figure 7, except for 0.6Qdes when factor A is 120 mm, that there is a rise in head, and the overall trend of head change is the same. As factor A increases, the head decreases, as factor B increases the head decreases, and as factor C increases the head first decreases and then increases. The slope of the curve represents the significance of the influence of the factors on the indicator, and can also be seen from Figure 7 that the main factors influencing lift are factors A and B, which is consistent with the results from the extreme difference analysis. There is no obvious regularity in the effect of each factor on efficiency, with factor A increasing and then decreasing at 0.6Qdes and decreasing and then increasing at 1.0Qdes and 1.4Qdes; The efficiency of factor B decreases and then increases at 0.6Qdes during the increase, and gradually decreases at 1.0Qdes and 1.4Qdes; factor C increases at 0.6Qdes, 1.0Qdes, 1.4Qdes when the efficiency gradually decreased, but the decline was more stable. It can be seen that the effect of factors A, B and C on efficiency is not dominated by a single factor but is influenced by multiple factors. However, factors A and B are still the main influencing factors judging from their slopes. In summary, slit diameter and slit width are the main factors affecting the performance of the drainage tough impeller. From the orthogonal results, the slit at the front of the blade is better than the slit at the trailing edge, and the small slit is better than the large slit.
Briefly, the selection of the optimal combination of parameters based on the results of the orthogonal test leads to Table 12. The optimal combination of parameters is A1B1C1, the slit diameter is 90 mm, the slit width is 1.5 mm, and the lap length of the long and short blades is 5 mm. The optimal combination of parameters happens to be the orthogonal of scheme 1. Therefore the numerical calculation of scheme 1 under multiple working conditions is carried out to compare the differences in the external characteristics between scheme 1 and the original model, and the results are shown in Figure 8.
It can be seen from Figure 8 that, the head of scheme 1 is basically the same as the original model, but a certain degree of efficiency improvement occurs. Specifically, the efficiency improves respectively by 1.01%, 1.92%, and 2.02% at 0.6Qdes, 1.0Qdes, and 1.4Qdes. Therefore, scheme 1 was chosen as the result of this round of orthogonal optimization.

5.4. Flow Field Analysis

Figure 9 shows the distribution of velocity swirling strength on each span b of the initial and optimized model impellers. Velocity swirling strength is the imaginary part of the complex eigenvalues of the velocity gradient tensor, and its value represents the strength of the swirling motion around the local center [25].The value of velocity swirling strength is closely related to the energy loss strength of each local position in the impeller runner. Comparing the velocity swirling strength clouds before and after optimization on 0.2 span, we can find that the velocity swirling strength distribution before and after optimization on 0.2 span (near the hub of the impeller) is not very different in all positions, but the velocity swirling strength inside the impeller after optimization is smaller than that before optimization. On the 0.5 span (mid-section of the runner) and 0.8 span (near the shroud of the impeller), the velocity swirling strength in the optimized impeller was significantly reduced. On the 0.5 span, a vortex region due to blockage of the blade inlet and thus a larger velocity swirling strength region appears in the front part of the impeller runner before optimization. At the rear of this region, the pressure difference between the pressure side and the suction side of the blade provides the energy for the vortex to evolve and spread toward the middle of the flow path, as shown in the elliptical region [26,27]. In the optimized split impeller, the grooves in the blade effectively reduce the pressure difference between the pressure side and the suction side of the blade. This weakens the secondary flow’s help to the vortex evolution, and successfully eliminates the high velocity swirling strength region in the middle of the flow path which is due to the vortex diffusion. At 0.8 span, the vortex in the initial impeller, which is caused by the deviation between the blade inlet angle and the incoming flow angle, moves continuously in the direction of the red arrow due to the combined effect of the main flow and the secondary flow. Furthermore, a high velocity swirling strength area is formed in the oval area at the end of the arrow. In the optimized impeller, the slit on the blades weaken the secondary flow and at the same time have a certain impact on the vortex structure, which greatly reduces the velocity swirling strength in the elliptical region.
Figure 10 shows the pressure and flow line distribution at 0.5 span of the initial model and the optimized model impeller. Under different flow conditions, the blade drainage troughs have a positive impact on weakening of vortices within flow channel, which reduces the energy loss in the impeller runner and improves the hydraulic efficiency of the low specific speed centrifugal pump. This is consistent with the analysis of orthogonal test results.

6. Conclusions

This study set out to optimize the performance of a low-specific speed centrifugal pump based on the combination of orthogonal test and numerical simulations. The accuracy of numerical simulations is ensured. The procedure and results of orthogonal test are discussed. The performance and internal flow pattern of the models before and after optimization are compared. The findings of this study are as follows:
(1)
Numerical calculations of the initial model head and efficiency are slightly higher than the test results at the rated flow condition. In the range of 0.6Qdes to 1.4Qdes, the error between the numerical prediction of head and efficiency and the test results is less than 5%. This shows that the numerical calculation method used in this paper has good accuracy in predicting the performance of low-specific speed centrifugal pumps.
(2)
The slit diameter and slit width in the range of 0.6Qdes~1.4Qdes have a high influence on the head and efficiency of the low-specific speed centrifugal pump, while the lap length has the least influence on the head and efficiency of the low specific speed centrifugal pump. In the orthogonal tests of this study, the hydraulic model of scheme 1 (90 mm slit diameter, 1.5 mm slit width and 5 mm lap length of long and short blade) has the best performance.
(3)
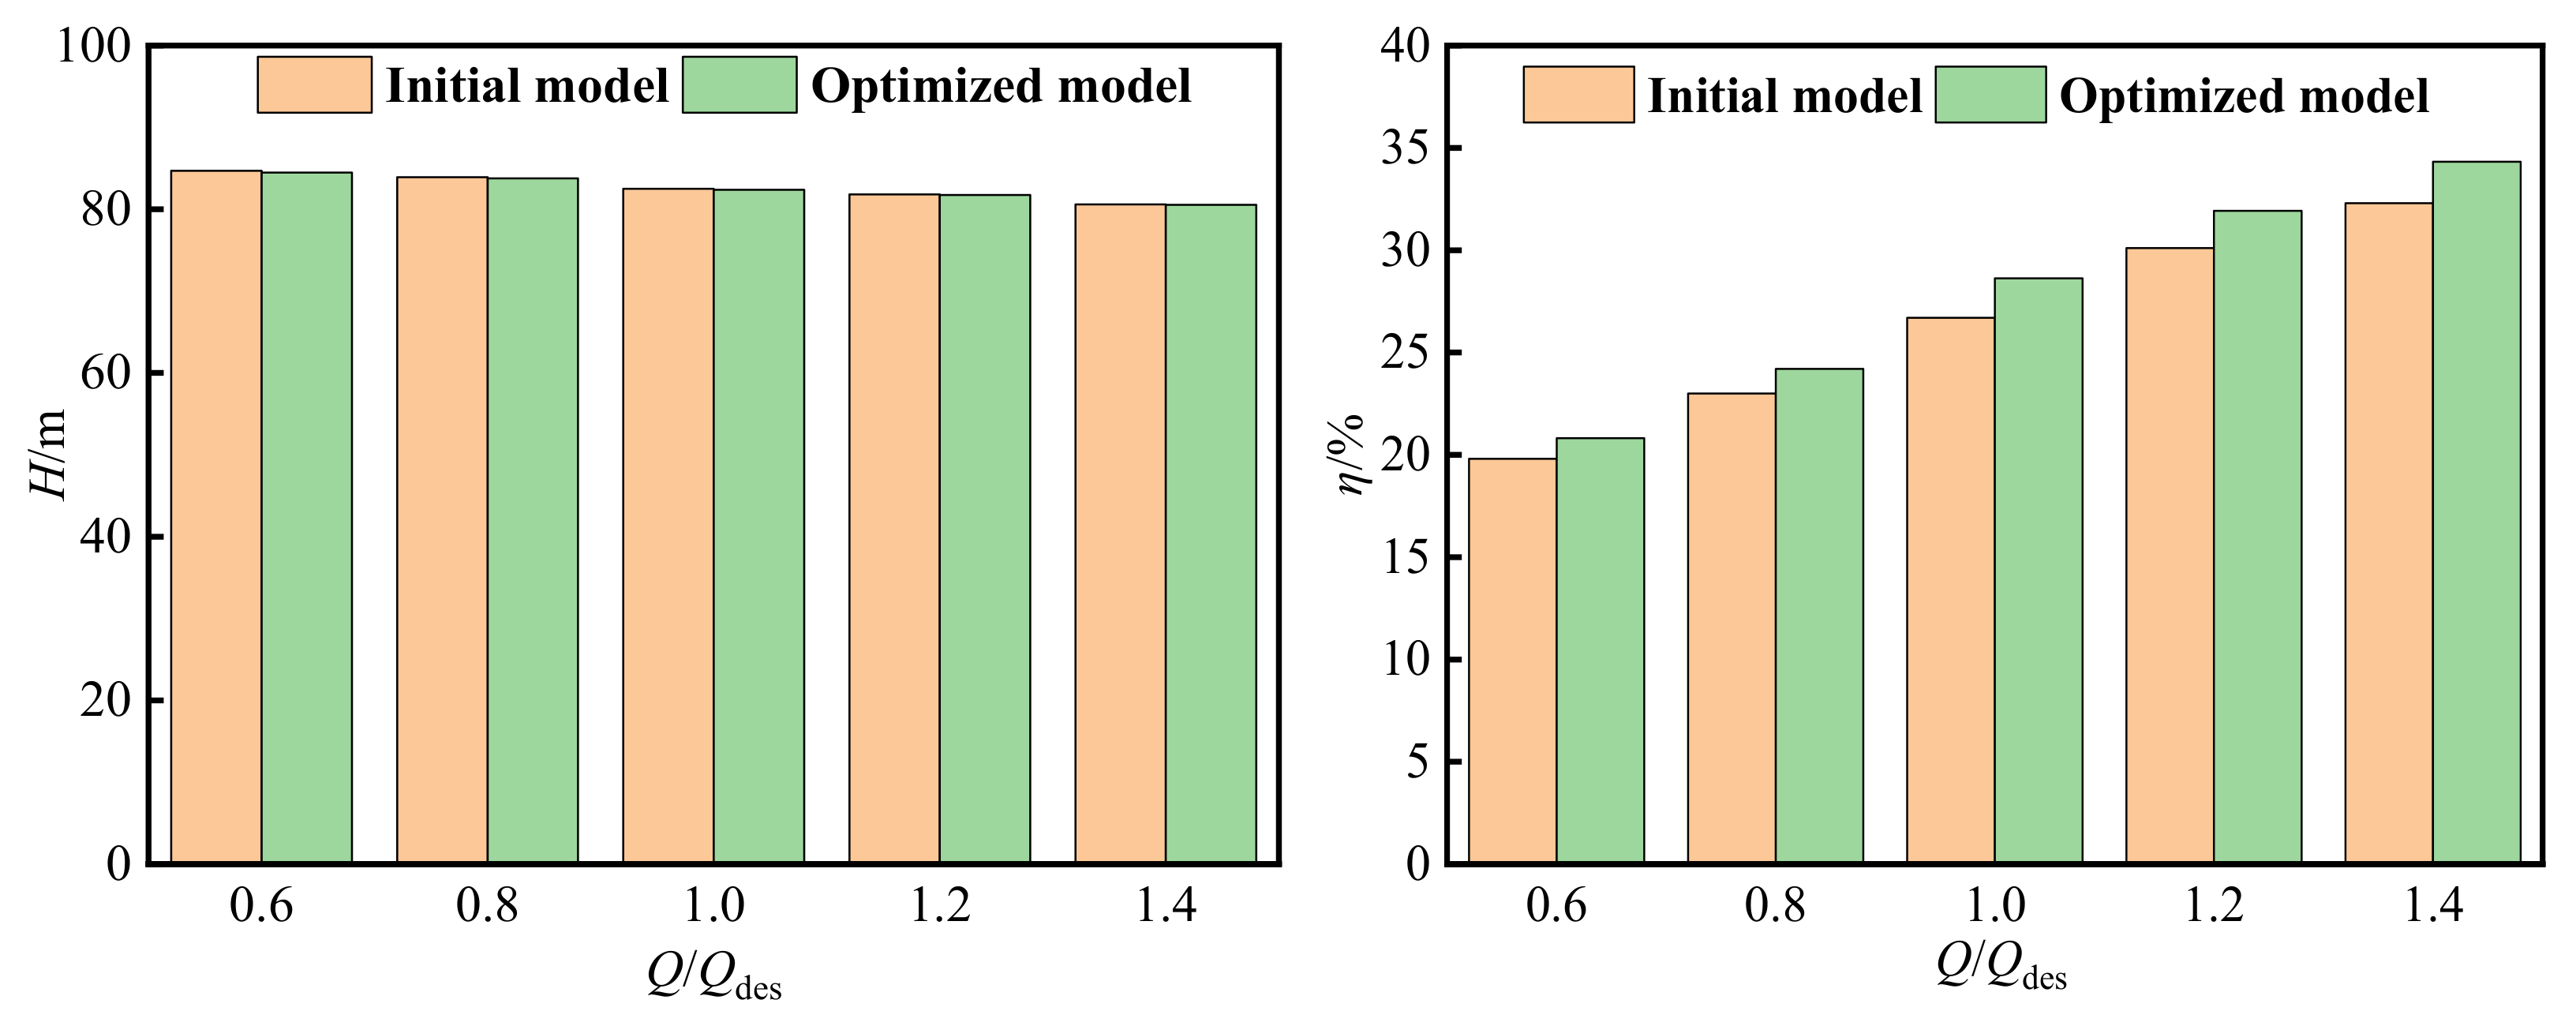
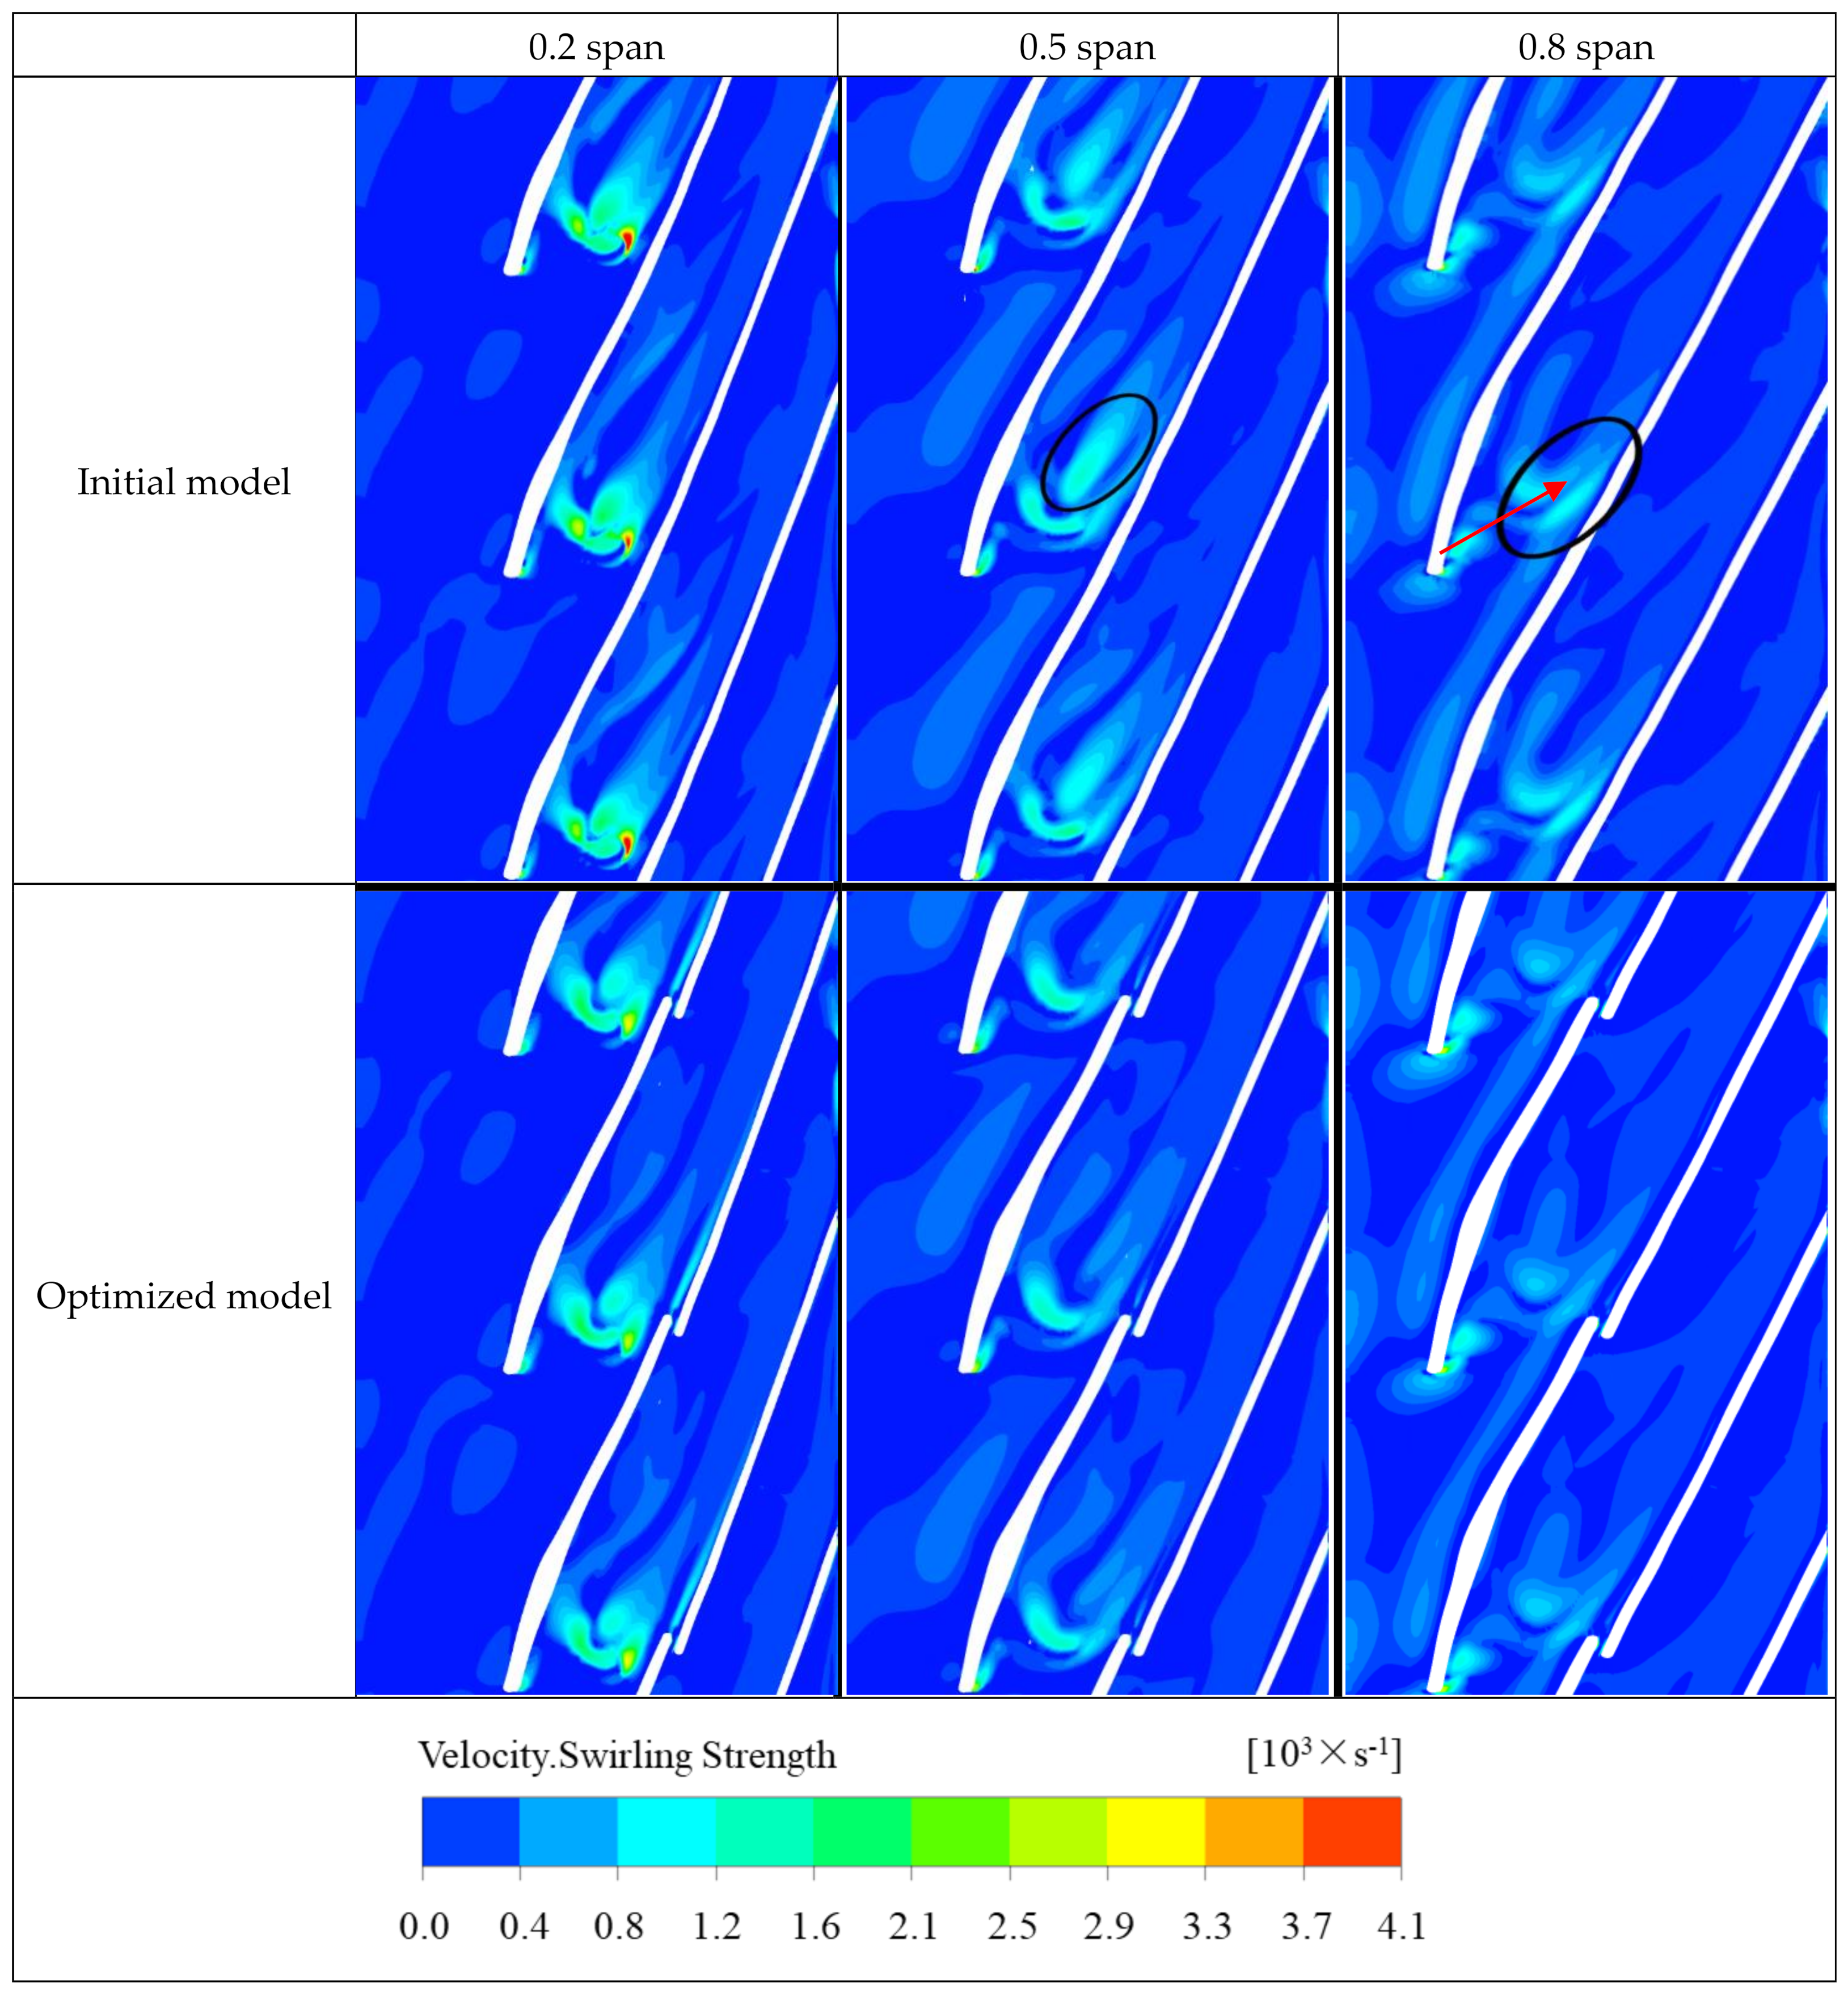
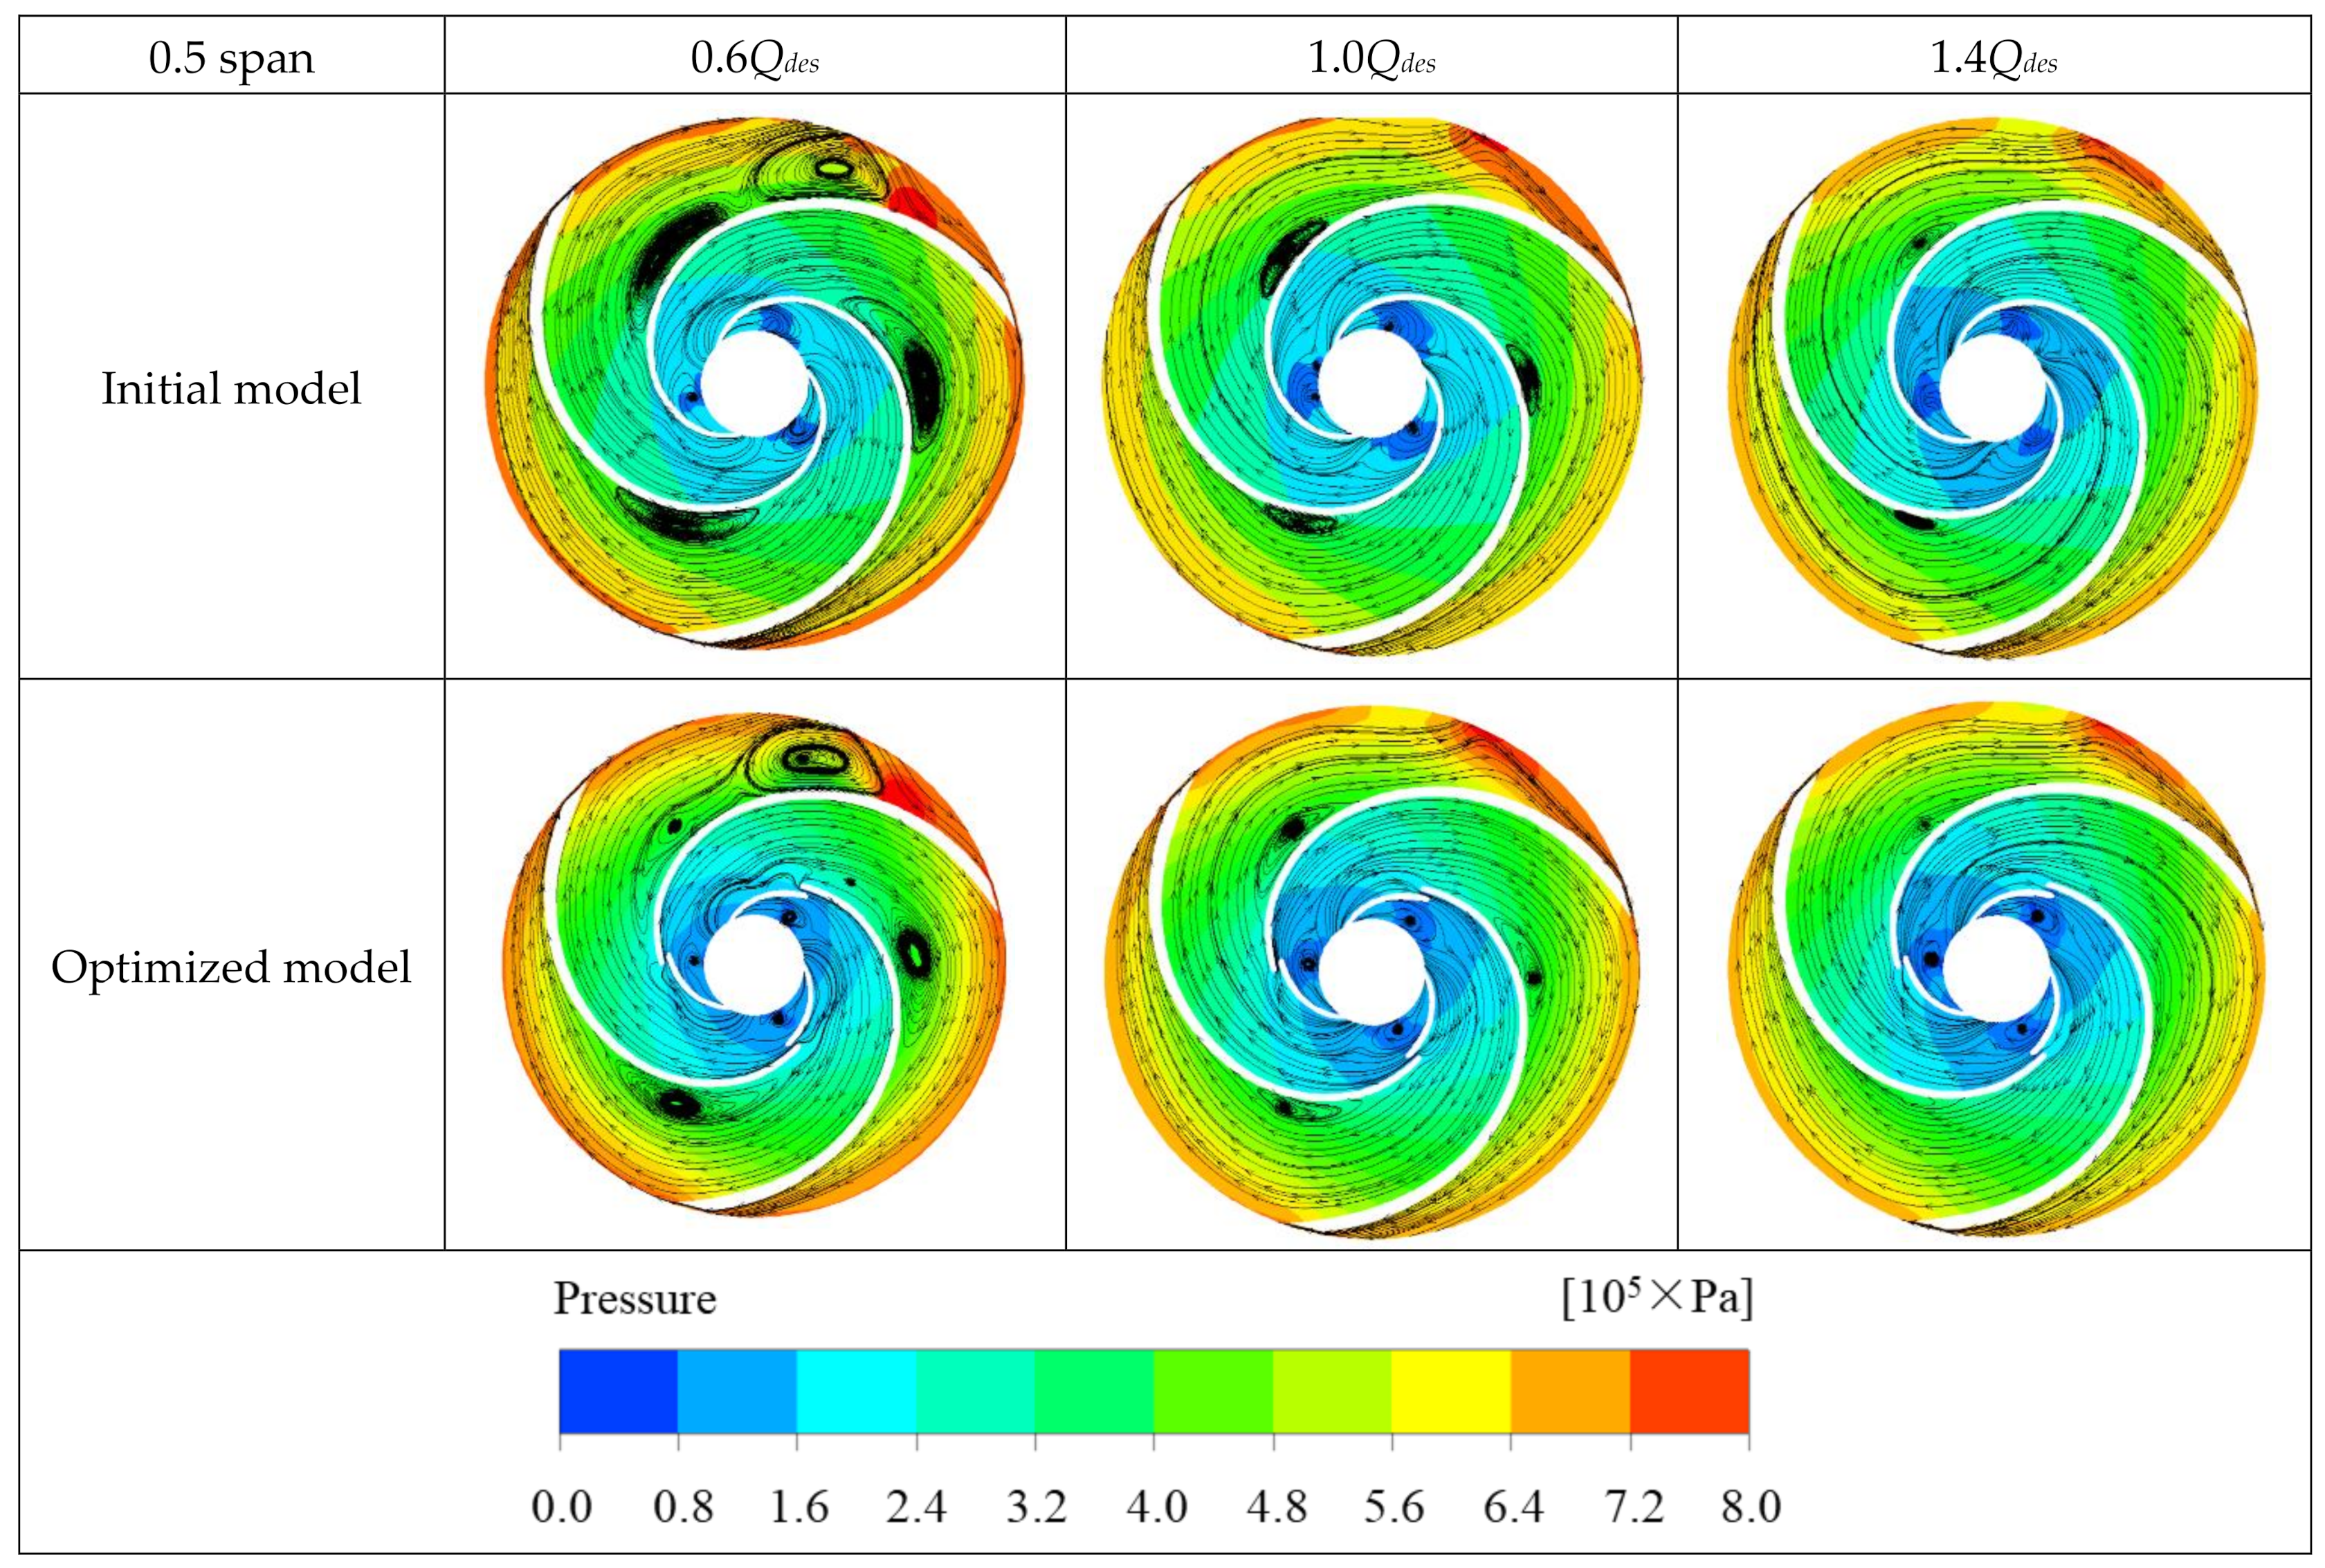
The impeller slit can effectively reduce the vortex intensity in the middle of the impeller runner and reduce the energy loss in the runner. In the range of 0.6Qdes~1.4Qdes, the head of the optimized model is almost the same as that of the initial model, but the efficiency is significantly improved. Therefore, the combination of orthogonal testing and numerical prediction can effectively improve the performance of low specific speed centrifugal pumps.

Author Contributions

Conceptualization, Y.Y. and L.Z.; methodology, Y.Y. and L.Z.; software, H.Z.; W.L.; formal analysis, J.W.; writing—original draft preparation, Y.Y.; writing—review and editing, L.Z. and W.S.; supervision, W.S. and Z.H. All authors have read and agreed to the published version of the manuscript.

Funding

This work was supported by the National Natural Science Foundation of China (Grant Nos. 52079058, 51979138), Nature Science Foundation for Excellent Young Scholars of Jiangsu Province (Grant No. BK20190101), China Postdoctoral Science Foundation (Grant No. 2020M681520), Jiangsu Planned Projects for Postdoctoral Research Funds (Grant No. 2020Z031), and Postgraduate Research & Practice Innovation Program of Jiangsu Province (Grant No. KYCX18_2238).

Institutional Review Board Statement

Not applicable.

Informed Consent Statement

Not applicable.

Data Availability Statement

Not applicable.

Conflicts of Interest

The authors declare no conflict of interest.

References

  1. Choi, Y.D.; Kurokawa, J.; Matsui, J. Performance and internal flow characteristics of a very low specific speed centrifugal pump. ASME J. Fluids Eng. 2006, 128, 341–349. [Google Scholar] [CrossRef]
  2. Bai, L.; Zhou, L.; Jiang, X.; Pang, Q.; Ye, D. Vibration in a multistage centrifugal pump under varied conditions. Shock Vib. 2019, 2019, 2057031. [Google Scholar] [CrossRef]
  3. Pei, J.; Wang, W.; Yuan, S. Statistical analysis of pressure fluctuations during unsteady flow for low-specific-speed centrifugal pumps. J. Cent. South Univ. 2014, 21, 1017–1024. [Google Scholar] [CrossRef]
  4. Yang, Y.; Zhou, L.; Shi, W.; He, Z.; Han, Y.; Xiao, Y. Interstage difference of pressure pulsation in a three-stage electrical submersible pump. J. Pet. Sci. Eng. 2020, 196, 107653. [Google Scholar]
  5. Kelder, J.D.H.; Dijkers, R.J.H.; Van Esch, B.; Kruyt, N.P. Experimental and theoretical study of the flow in the volute of a low specific-speed pump. Fluid Dyn. Res. 2001, 28, 267. [Google Scholar] [CrossRef]
  6. Peng, G.; Fan, F.; Zhou, L.; Huang, X.; Ma, J. Optimal Hydraulic Design to Minimize Erosive Wear in a Centrifugal Slurry Pump Impeller. Eng. Fail. Anal. 2021, 120, 105105. [Google Scholar] [CrossRef]
  7. Durmusoglu, Y.; Kocak, G.; Deniz, C.; Zincir, B. Energy efficiency analysis of pump systems in a ship power plant and a case study of a container ship. In Proceedings of the 16th IAMU Annual General Assembly, Opatija, Croatia,, 7–10 October 2015. [Google Scholar]
  8. Su, C.L.; Chung, W.L.; Yu, K.T. An energy-savings evaluation method for variable-frequency-drive applications on ship central cooling systems. IEEE Trans. Ind. Appl. 2013, 50, 1286–1294. [Google Scholar] [CrossRef]
  9. Baoling, C.; Zuchao, Z.; Zhang, J.; Ying, C. The flow simulation and experimental study of low-specific-speed high-speed complex centrifugal impellers. Chin. J. Chem. Eng. 2006, 14, 435–441. [Google Scholar]
  10. Jafarzadeh, B.; Hajari, A.; Alishahi, M.; Akbari, M. The flow simulation of a low-specific-speed high-speed centrifugal pump. Appl. Math. Model. 2011, 35, 242–249. [Google Scholar] [CrossRef]
  11. Yuan, S.; Cao, W.; Li, S. Theory and design method of non-overload centrifugal pumps. Chin. J. Mech. Eng. 1992, 5, 252–260. [Google Scholar]
  12. Ni, Y.Y.; Yuan, S.Q.; Yuan, J.P.; Zhang, J.F. Model of enlarged flow design for low specific speed centrifugal pump. Drain. Irrig. Mach. 2008, 26, 21–24. [Google Scholar]
  13. Liu, Z.; Xu, H.; Lu, W.; Chen, T. Influence of diameter of rear sealing ring on axial force characteristics of centrifugal pump. J. Drain. Irrig. Mach. Eng. 2020, 38, 115–120. [Google Scholar]
  14. Culley, D.E.; Bright, M.M.; Prahst, P.S.; Strazisar, A.J. Active flow separation control of a stator vane using embedded injection in a multistage compressor experiment. J. Turbomach. 2004, 126, 24–34. [Google Scholar] [CrossRef]
  15. Gupta, A.; Alsultan, A.; Amano, R.S.; Kumar, S.; Welsh, A.D. Design and analysis of wind turbine blades: Winglet, tubercle, and slotted. In Proceedings of the ASME Turbo Expo 2013: Turbine Technical Conference and Exposition, San Antonio, TX, USA, 3–7 June 2013. [Google Scholar]
  16. Zhu, B.; Chen, H. Cavitating suppression of low specific speed centrifugal pump with gap drainage blades. J. Hydrodyn. 2012, 24, 729–736. [Google Scholar] [CrossRef]
  17. Ye, D.; Li, H.; Wang, Y. Hydraulic performance of a low specific speed centrifugal pump with Spanwise-Slotted Blades. IOP Conf. Ser. Mater. Sci. Eng. 2013, 52, 022009. [Google Scholar] [CrossRef] [Green Version]
  18. Wang, H.; Long, B.; Wang, C.; Han, C.; Li, L. Effects of the Impeller Blade with a Slot Structure on the Centrifugal Pump Performance. Energies 2020, 13, 1628. [Google Scholar]
  19. Yang, Y.; Zhou, L.; Hang, J.; Du, D.; Shi, W.; He, Z. Energy characteristics and optimal design of diffuser meridian in an electrical submersible pump. Renew. Energy 2021, 167, 718–727. [Google Scholar] [CrossRef]
  20. Shi, W.; Hou, Y.; Zhou, L.; Li, Y.; Xue, S. Numerical simulation and test of performance of deep-well centrifugal pumps with different stages. J. Drain. Irrig. Mach. Eng. 2019, 37, 562–567. [Google Scholar]
  21. Zhou, L.; Han, C.; Bai, L.; Li, W.; El-Emam, M.; Shi, W. CFD-DEM bidirectional coupling simulation and experimental investigation of particle ejections and energy conversion in a spouted bed. Energy 2020, 211, 118672. [Google Scholar] [CrossRef]
  22. Yun, L.; Rongsheng, Z.; Wang, D.-Z.; Junlian, Y.; Tianbin, L. Numerical and experimental investigation on the diffuser optimization of a reactor coolant pump with orthogonal test approach. J. Mech. Sci. Technol. 2016, 30, 4941–4948. [Google Scholar] [CrossRef]
  23. Zhang, Y.; Xu, Y.; Zheng, Y.; Fernandez-Rodriguez, E.; Sun, A.; Yang, C.; Wang, J. Multiobjective optimization design and experimental investigation on the axial flow pump with orthogonal test approach. Complexity 2019, 2019, 1467565. [Google Scholar] [CrossRef] [Green Version]
  24. Quan, H.; Guo, Y.; Li, R.; Su, Q.; Chai, Y. Optimization design and experimental study of vortex pump based on orthogonal test. Sci. Prog. 2020, 103. [Google Scholar] [CrossRef] [PubMed] [Green Version]
  25. Pang, Q.; Jiang, X.; Zhu, J.; Wu, G.; Wang, X.; Wang, L. Influences of radial clearance between impeller and diffuser on flow field in side chambers of multistage centrifugal pump. J. Drain. Irrig. Mach. Eng. 2019, 37, 580–586. [Google Scholar]
  26. Zhou, L.; Deshpande, K.; Zhang, X.; Agarwal, R. Process simulation of Chemical Looping Combustion using ASPEN Plus for a mixture of biomass and coal with various oxygen carriers. Energy 2020, 195, 116955. [Google Scholar] [CrossRef]
  27. Peng, G.; Huang, X.; Zhou, L.; Zhou, G.; Zhou, H. Solid-liquid two-phase flow and wear analysis in a large-scale centrifugal slurry pump. Eng. Fail. Anal. 2020, 114, 104602. [Google Scholar] [CrossRef]
Figure 1. Two-dimensional hydraulic assembly sketch.
Jmse 09 00121 g001
Figure 2. Calculated domain and grid details.
Jmse 09 00121 g002
Figure 3. Grid independence analysis.
Jmse 09 00121 g003
Figure 4. Schematic diagram of test facility.
Jmse 09 00121 g004
Figure 5. Comparison between simulation results and test results.
Jmse 09 00121 g005
Figure 6. Performance of orthogonal test.
Jmse 09 00121 g006
Figure 7. Trend chart of pump performance.
Jmse 09 00121 g007
Figure 8. Performance of the optimal solution compared to the original model.
Jmse 09 00121 g008
Figure 9. Distribution of velocity. Swirling strength within the initial and optimized impellers.
Jmse 09 00121 g009
Figure 10. Distribution of static pressure and streamline within initial and optimized impellers.
Jmse 09 00121 g010
Table 1. Factor level table.
FactorsA(D/mm)B(E/mm)C(L/mm)
Levels
1901.55
21203.010
31504.515
41806.020
Table 2. Orthogonal test table.
Test SchemesFactor LetterFactor Value
ABCABC
1A1B1C1901.55
2A1B2C2903.010
3A1B3C3904.515
4A1B4C4906.020
5A2B1C21201.510
6A2B2C11203.05
7A2B3C41204.520
8A2B4C31206.015
9A3B1C31501.520
10A3B2C41503.05
11A3B3C11504.510
12A3B4C21506.015
13A4B1C41801.520
14A4B2C31803.015
15A4B3C21804.510
16A4B4C11806.05
Table 3. Numerical simulation results at 0.6Qdes.
Schemes12345678
H/m84.4983.638382.8684.0583.9883.0883.58
η/%20.8120.5320.3720.8420.8921.8220.4921.47
P/kW6.63 6.65 6.66 6.49 6.57 6.29 6.62 6.36
Schemes910111213141516
H/m84.283.3582.3681.9883.0180.9479.4479.14
η/%21.1820.9520.6521.2820.7120.5120.6320.26
P/kW6.49 6.50 6.51 6.29 6.55 6.45 6.29 6.38
Table 4. Numerical simulation results at 1.0Qdes.
Schemes12345678
H/m82.3981.1680.1779.2981.7280.9779.8979.15
η/%28.6227.4427.2126.9127.7927.6826.2326.88
P/kW7.84 8.05 8.02 8.02 8.01 7.96 8.29 8.02
Schemes910111213141516
H/m81.2480.0478.5777.480.4278.4777.2676.86
η/%27.5427.226.3326.1227.5127.3627.2427.1
P/kW8.03 8.01 8.12 8.07 7.96 7.81 7.72 7.72
Table 5. Numerical simulation results at 1.4Qdes.
Schemes12345678
H/m80.5478.8378.3577.9379.0878.6177.7576.98
η/%34.3233.7733.3933.1333.9633.8433.433.13
P/kW8.94 8.90 8.94 8.96 8.87 8.85 8.87 8.86
Schemes910111213141516
H/m79.2377.7775.8774.677.676.1575.774.87
η/%33.2933.0232.2631.4534.1233.8333.7133.56
P/kW9.07 8.98 8.96 9.04 8.67 8.58 8.56 8.50
Table 6. Range analysis of the head and efficiency at 0.6Qdes.
H/mη/%
ABCABC
K1334335.76329.9682.5683.683.52
K2334.68331.88329.1284.6883.883.32
K3331.88327.88331.7284.0882.1683.52
K4322.52327.56332.3282.1283.8483
k183.583.9482.4920.6420.920.88
k283.6782.9782.2821.1720.9520.83
k382.9781.9782.9321.0220.5420.88
k480.6381.8983.0820.5320.9620.75
R3.042.050.80.640.430.14
Orderliness123123
Table 7. The order of influence of the factors on pump performance at 0.6Qdes.
Key Factor Jmse 09 00121 i001 Secondary Factor
H/mABC
η/%ABC
Table 8. Range analysis of the head and efficiency at 1.0Qdes.
H/mη/%
ABCABC
K1323325.76318.8110.2111.44109.72
K2321.72320.64317.56108.56109.68108.6
K3317.24315.88319.04107.2107109
K4313312.68319.64109.2107107.84
k180.7581.4479.727.5527.8627.43
k280.4380.1679.3927.1427.4227.15
k379.3178.9779.7626.826.7527.25
k478.2578.1779.9127.326.7526.96
R2.53.270.530.751.110.47
Orderliness213213
Table 9. The order of influence of the factors on pump performance at 1.0Qdes.
Key Factor Jmse 09 00121 i001 Secondary Factor
H/mBAC
η/%BAC
Table 10. Range analysis of the head and efficiency at 1.4Qdes.
H/mη/%
ABCABC
K1315.64316.44309.88134.6135.68133.96
K2312.44311.36308.2134.32134.48132.88
K3307.48307.68310.72130132.76133.64
K4304.32304.36311.04135.2131.28133.68
k178.9179.1177.4733.6533.9233.49
k278.1177.8477.0533.5833.6233.22
k376.8776.9277.6832.533.1933.41
k476.0876.0977.7633.832.8233.42
R2.833.020.711.31.10.27
Orderliness213123
Table 11. The order of influence of the factors on pump performance at 1.4Qdes.
Key Factor Jmse 09 00121 i001 Secondary Factor
H/mBAC
η/%ABC
Table 12. Optimal parameter selection.
TargetFlow RatesABC
H/m0.6QdesA2B1C4
1.0QdesA1B1C4
1.4QdesA1B1C4
η/%0.6QdesA2B2C1
1.0QdesA1B1C1
1.4QdesA4B1C1
CombinationA1B1C1
Publisher’s Note: MDPI stays neutral with regard to jurisdictional claims in published maps and institutional affiliations.

