1. Introduction
The emissions from ships can be a significant source of air pollution in coastal areas and port cities and can have negative impact on human health and climate [
1,
2,
3]. Therefore, the International Maritime Organization (IMO) has implemented regulations to reduce emissions from ships. So far, these regulations concentrate mainly on emissions of nitrogen oxides (NO
x) and sulfur oxides (SO
x). To answer these requirements emission reduction technologies are needed, namely fuel technologies, combustion technologies and/or exhaust gas after-treatment technologies (see e.g., [
4]). One solution is to use natural gas (NG) as a fuel.
Liquefied natural gas (LNG) use as marine fuel is increasing and more and more gas engines, mainly dual fuel, are being installed in ships. With LNG both SO
x and NO
x regulations of IMO can be achieved without any need for after-treatment, since NG is nearly sulfur free resulting in very minor/no SO
x emissions while lower NO
x levels (compared to diesel) can be achieved due to low combustion temperature of natural gas (in lean-burn conditions). In addition, particle emissions from natural gas combustion are low and only minor black carbon is formed from NG combustion [
5,
6,
7]. Moreover, CO
2 emission is lower with NG use compared to diesel fuels, which is because NG is mainly composed of methane with a higher H/C ratio compared to diesel. The hydrocarbon emissions, on the other hand, are higher with NG compared to diesel fuels [
8,
9,
10,
11]. Because natural gas is mainly methane, most of the hydrocarbon emissions is also methane. Since methane is a strong greenhouse gas, its emissions should be minimized.
Three different gas engine groups are used for marine applications, namely lean-burn spark-ignited engines, low pressure dual fuel engines and high pressure dual fuel engines [
12]. For dual fuel engines, the natural gas and air mix is ignited with a small diesel pilot injection. In addition, the diesel can be used as the main fuel (back-up fuel) if LNG is not available, making this dual fuel concept the most popular one in marine applications.
According to Sharafian et al. [
13] LNG use in high pressure dual fuel (HPDF) engines, which are used only for large low-speed oceangoing vessels, can reduce greenhouse gas (GHG) emissions by 10% compared to their heavy fuel oil (HFO)-fueled counterparts. However, the current deployment of medium speed low pressure dual fuel (LPDF) cannot reliably reduce GHG emissions. This is primarily due to the high levels of methane slip from these engines. The methane slip from HPDF engines is reported to be significantly lower compared to LPDF engines [
13] but the LPDF is the most popular LNG engine technology with at least 350 ships (e.g., LNG carriers, car/passenger ferries, cruise ships) while HPDF is used in less than 100 ships (e.g., LNG carriers, container ships) [
14].
Peng et al. [
6] studied the impacts of switching a marine vessel from diesel fuel to natural gas. They showed that the GHG impact of NG compared to diesel is higher especially on lower engine load cases while at higher loads (>75%) the GHG impact is comparable to diesel. The test vessel in their study operated with medium speed dual fuel engines.
ICCT’s (The International Council on Clean Transportation) working paper on “The climate implications of using LNG as a marine fuel” also concludes that there is no climate benefit from using LNG, when using a 20-year global warming potential, including upstream emissions, combustion emissions and unburned methane [
14]. However, over the 100-year time frame, a life cycle GHG benefit of LNG is reported to be 15% compared to diesel, but this is only for ships with HPDF engines. A life cycle GHG emission study on the use of LNG prepared by Sphera reports GHG emission reductions with LNG operation (compared to HFO fueled ships) 14–21% for 2-stroke slow speed and also 7–15% for 4-stroke medium speed [
15].
One key issue in the current and future LNG ships is the control of methane slip. Methane emissions from engines are being reduced, e.g., by better fuel mixing conditions, improvements in combustion chamber design, and by reducing crevices [
16,
17]. One option is the use of oxidation catalyst. To oxidize methane, a highly efficient catalyst is needed. Although catalysts based on platinum are commonly used for non-methane hydrocarbon and CO oxidation, palladium catalysts have shown good activity for methane oxidation (e.g., [
18,
19]). Challenge in the development of MOC is the catalyst deactivation since palladium-based catalysts are very sensitive to sulfur poisoning and as little as 1 ppm SO
2 present in the exhaust has already been found to inhibit the oxidation of methane [
20,
21].
Simplified, when palladium-based MOC is to be used the SO2 in the exhaust should be minimized and/or a regeneration procedure to recover the catalyst activity is needed.
There are few scientific studies published about the regeneration of sulfur-poisoned methane oxidation catalysts. Arosio et al. [
22] studied the regeneration by short CH
4 pulses. Honkanen et al. [
23] also used CH
4 conditions to regenerate sulfur-poisoned Pd-based catalyst. According to Kinnunen et al. [
24] a sulfur-poisoned catalyst can be regenerated under low-oxygen conditions and Lott et al. [
25] also favor rich conditions to achieve efficient regeneration. In addition, H
2 usage has been studied to recover the catalyst activity [
26,
27]. Most of these regeneration studies are conducted in laboratories with synthetic gases.
To minimize SO
x in the exhaust, the sulfur in the fuel and lubricating oil is to be minimized. However, in the case of natural gas, the sulfur level is already very low (a few ppm). In dual fuel engines, obviously, also the pilot diesel fuel sulfur level is to be minimized, although the pilot fuel use is only one to a few percent of the natural gas use. In this study, we also add a sulfur trap as one choice. A sulfur trap, also called the SO
x trap, is an adsorber catalyst, specifically designed to store sulfur. They have earlier been studied and developed to protect NO
x adsorbers that can adsorb and store NO
x under lean conditions and release it under rich operation but are however poisoned by SO
x present in the exhaust gas [
28]. In the present study, the SO
x traps are connected to MOC for the first time (to authors’ knowledge).
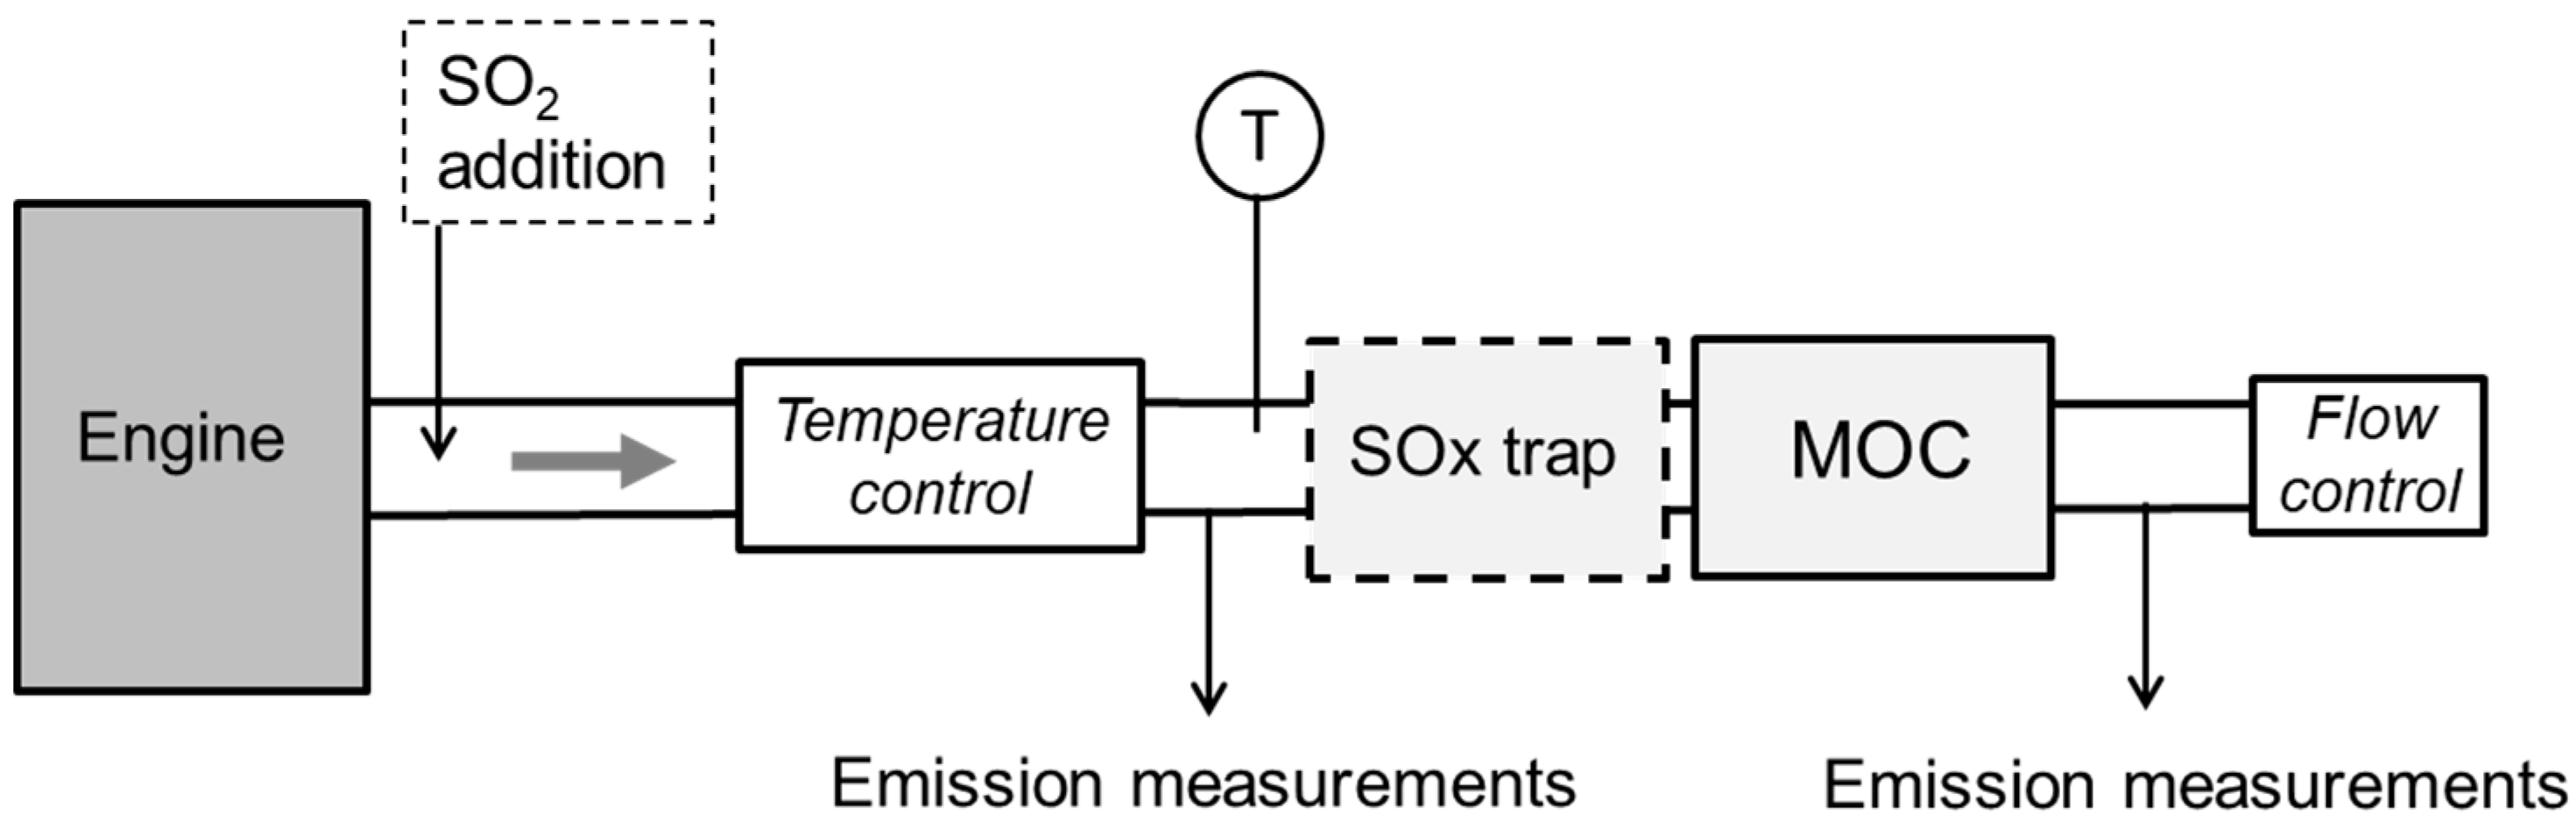
In this study, the performance and regeneration of one methane oxidation catalyst (MOC) is studied in engine exhaust. Catalyst performance studies with an engine under lean conditions are done by emission measurements upstream and downstream of the catalyst while the regeneration is done by switching on engine-driving mode to stoichiometric for couple of minutes time. In addition to MOC only, we study the effect of a SOx trap, using it upstream the MOC, to see how it protects the MOC against sulfur poisoning.
2. Methods
The research facility included a passenger car engine that was modified to run with natural gas. The engine with the test facility was presented in detail in Murtonen et al. [
29]. The engine was operated with a lean air-to-fuel mixture. For the present study, only one engine-driving mode was used. The exhaust gas flow and temperature (measured upstream of the catalysts) were adjusted independently, and therefore, it was possible e.g., to keep the exhaust gas composition and flow constant while changing only the temperature. In the present study, most of the tests were conducted with exhaust temperature adjusted to 550 °C and exhaust flow to 60 kg/h while initial performance studies were also conducted at lower exhaust temperatures and with different exhaust flows.
The NG was from Nord Stream and was high in CH4 content (>95%). The sulfur content of the gas was below 1.5 ppm. The lubricating oil used for medium speed LNG engines was selected and used in this smaller test engine also. The lubricating oil sulfur content was 2100 mg/kg, density was 0.85 kg/dm3 and viscosity at 100 °C was 13.4 mm2/s.
MOC used platinum-palladium (1:4) as active metals on a tailored coating developed for lean NG applications and supported on a metallic substrate. The volume of MOC was 0.75 dm
3. This means a space velocity (1/h) of 61,500 with exhaust flow of 60 kg/h. In addition to MOC only, similar studies were done with a SO
x trap installed in front of the MOC. The SO
x trap has a property to absorb and release SO
x in controlled conditions and had a volume of 0.75 dm
3. The catalyst set-up is presented in
Figure 1.
Emission measurements were done upstream and downstream of the catalyst system (see
Figure 1). This included a Horiba PG-250 analyzer used to measure NO
x, CO, CO
2, and O
2. CO and CO
2 were measured by non-dispersive infrared, NO
x by chemiluminescence, and O
2 by a paramagnetic measurement cell. Exhaust gas was dried with gas-cooler before it was measured by Horiba.
Online SO2 emissions were determined by a Rowaco 2030 1 Hz Fourier transfer infra-red (FTIR) Spectrometer equipped with an Automated MEGA-1 (miniMEGA) sampling system. The detection limit for SO2 was 2.5 ppm. This device was used mainly only during the regeneration periods to observe the SO2 release.
An agilent 490 MicroGC (Gas Chromatography) was used to measure the hydrocarbons and hydrogen (H2). The detection limits for ethane (C2H6), ethylene (C2H4), and propane were approximately 2 ppm, for methane (CH4) 10 ppm, and 100 ppm for H2.
Multiple gaseous components were measured continuously by two Gasmet DX-4000 Fourier transformation infrared (FTIR) spectrometers simultaneously upstream and downstream of the catalyst system.
Test Program
The experiments were conducted over a 190 h’ ageing at the selected driving mode. The driving mode selection was based on the exhaust gas composition with an aim to produce as similar exhaust gas as possible that would be emitted from LNG engine. The engine out exhaust gas composition on the selected driving mode is presented in
Table 1 and shows that the NO
x level was approx. 225 ppm and CO 550 ppm, while hydrocarbons constituted of methane with near 1000 ppm level, ethane 15 ppm, and ethylene 30 ppm. In addition, formaldehyde (HCHO) was found in the exhaust with a level of approx. 55 ppm. For comparison and as a reference we have added the exhaust gas composition measured form one medium speed dual fuel marine engine run with NG to
Table 2. These were earlier presented in g/kWh [
5] and now in concentrations at two engine loads of 85% and 40%. Comparing these values to the values of the present study’s selected driving mode (
Table 1 “Ageing”) we see that these are in the same order of magnitude.
To ensure that the starting point for the experiments was as similar to possible for all catalyst reactors, they were preconditioned by ageing for 48 h in the selected driving mode with an exhaust gas temperature of 550 °C and exhaust flow of 60 kg/h. After the preconditioning, the initial performance of the MOC was studied by emission measurements. The same driving mode was used. The methane level in this driving mode was near 1000 ppm (
Table 1) and in addition, one higher methane level was included in the initial performance studies to see if the methane level influences the performance. This approx. 1500 ppm methane level was achieved in the same driving mode by adding methane to the exhaust prior to the catalyst.
After the initial performance studies, the ageing tests were conducted. Additional SO
2 was fed into the exhaust (see
Figure 1) in part of the ageing tests, while one test was also conducted without any additional SO
2. The added SO
2 contributed to a 1 ppm increase in the exhaust gas while any sulfur from the natural gas and lubricating oil, led to a SO
2 level of approximately 0.5 ppm in the exhaust gas. This means SO
2 level of 0.5 ppm without any additional SO
2 and SO
2 level of 1.5 ppm with the added SO
2 in the exhaust. The SO
2 level of 1.5 ppm was confirmed by sampling exhaust gas to a sample bag and analyzing by gas chromatography prior to the ageing tests. In the following ageing tests, the SO
2 feed was then kept constant.
Altogether, three similar experimental campaigns were conducted. Two ageing tests were done with MOC only, meaning one ageing test with additional SO2 and the other one without SO2 addition. The third ageing test was conducted with SOx trap installed in front of the MOC (including the additional SO2 in the exhaust gas).
During the ageing test, the engine was running without stops and once a day regeneration was done by turning the engine to stoichiometric condition for 5 min time. In
Table 1, also the engine out emissions at the regeneration mode are presented. This shows that in addition to the targeted O
2 decrease, other emission components’ levels changed as well. The NO
x increased to 2400 ppm and CO to above 9000 ppm in the stoichiometric mode while methane level decreased to 860 ppm. In addition, H
2 with a level of 0.6% was found in the exhaust when running on the nearly stoichiometric mode.
3. Results
3.1. MOC Initial Performance
To oxidize methane, in addition to the effective catalyst, high temperature is required. This was found to be true in the present study also. After preconditioning the catalyst for 48 h in the engine exhaust, the initial performance was defined by measurements upstream and downstream of the catalyst.
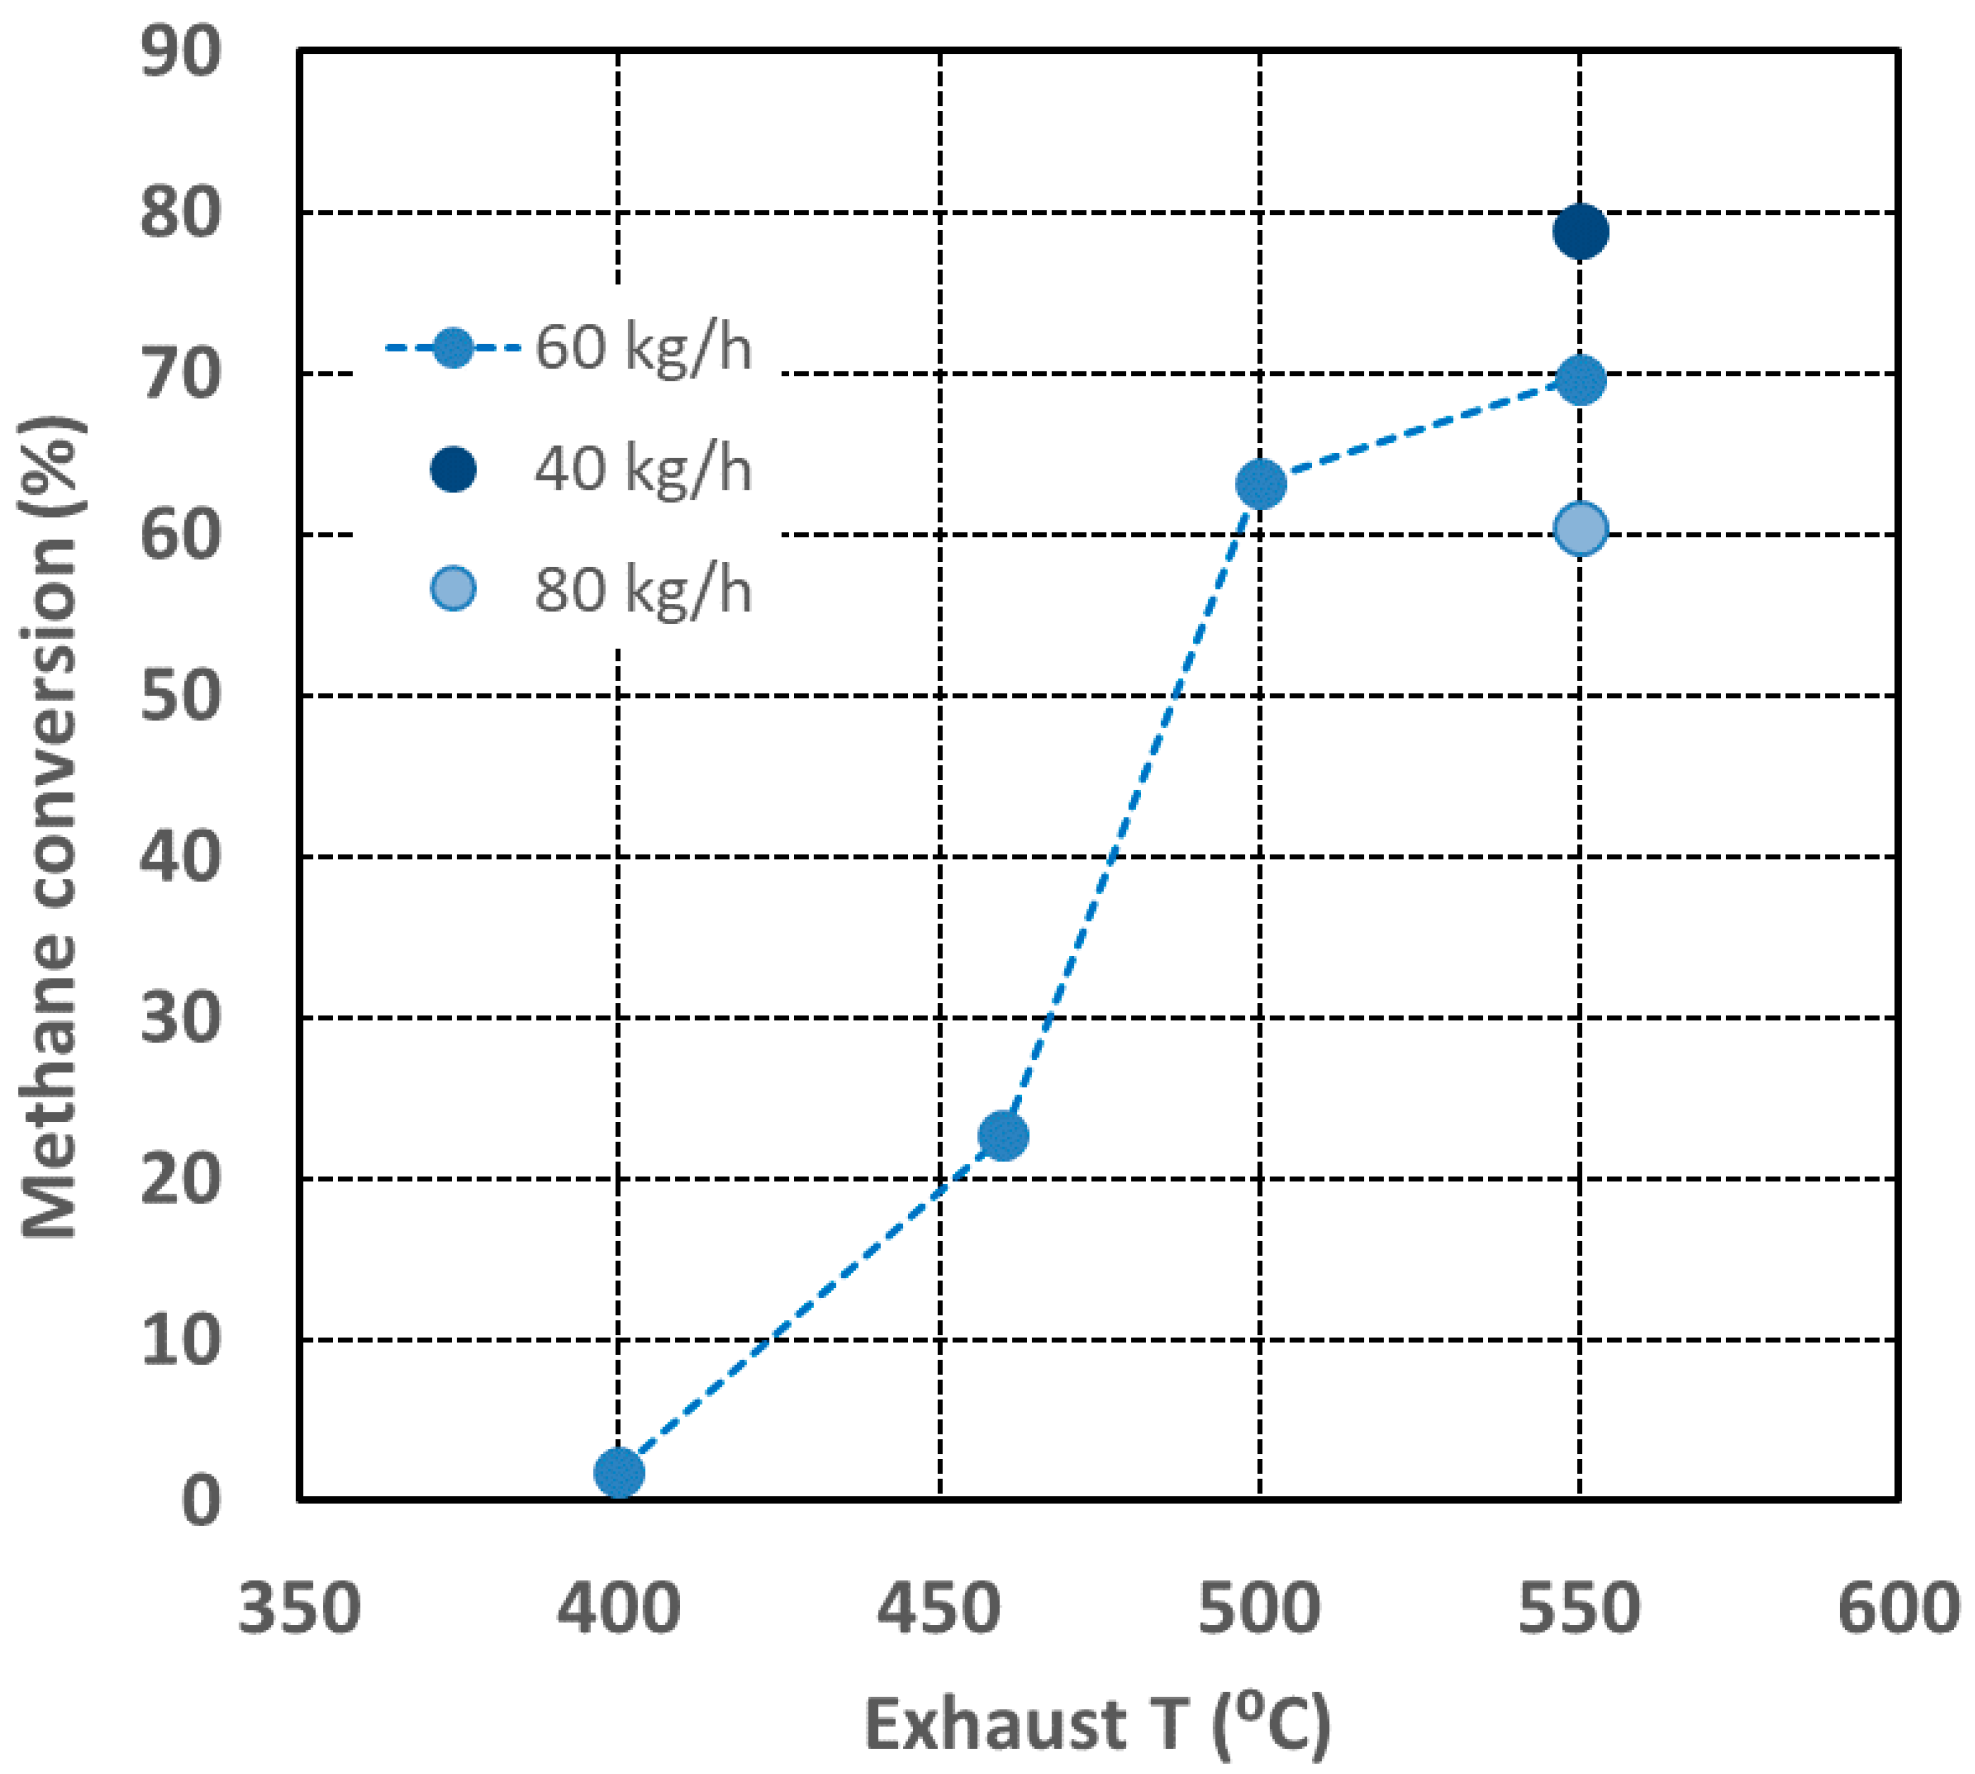
Figure 2 presents the initial methane conversion as a function of exhaust temperature and at three different exhaust flows. At exhaust temperature of 400 °C, the methane conversion was found to be negligible (only 2%). However, when increasing the temperature, the methane conversion sharply increases, being above 20% at exhaust temperature of 460 °C, above 60% at exhaust temperature of 500 °C and at the highest temperature of 550 °C the methane conversion is approx. 70%. Furthermore, the lower exhaust flow (40 kg/h) studied at 550 °C increased the methane conversion to near 80% which is reasonable since the lower exhaust flows means more time for the catalytic reactions to occur. Roughly, changing the exhaust flow from 80 kg/h to 40 kg/h means similar effect on the performance that could be expected with doubling the catalyst size. In this case, the methane conversion increased from 60% (with 80 kg/h) to 80% (with 40 kg/h).
In practice, the engine out methane level of 1500 ppm compared to 1000 ppm had no effect on the MOC performance and the difference in methane conversions within these two cases was found to be less than 4%.
The ethane conversion was measured to be approx. 30% at exhaust T of 400 °C while at exhaust T of 460 °C and higher no ethane was found in the exhaust downstream of the MOC meaning near 100% conversion. Ethylene found in the engine out exhaust (see
Table 1), was not found in the exhaust downstream of MOC in any of the test conditions meaning near 100% conversion for ethylene already at 400 °C. In addition, CO was in the level of only a few ppm downstream MOC, confirming nearly total CO conversion. From the FTIR measurements also formaldehyde was analyzed and was found to be below 2 ppm downstream of MOC in all test conditions (while the engine out level was approx. 55 ppm) confirming nearly total HCHO conversion as well. The NO
x level was not affected by the MOC, as expected.
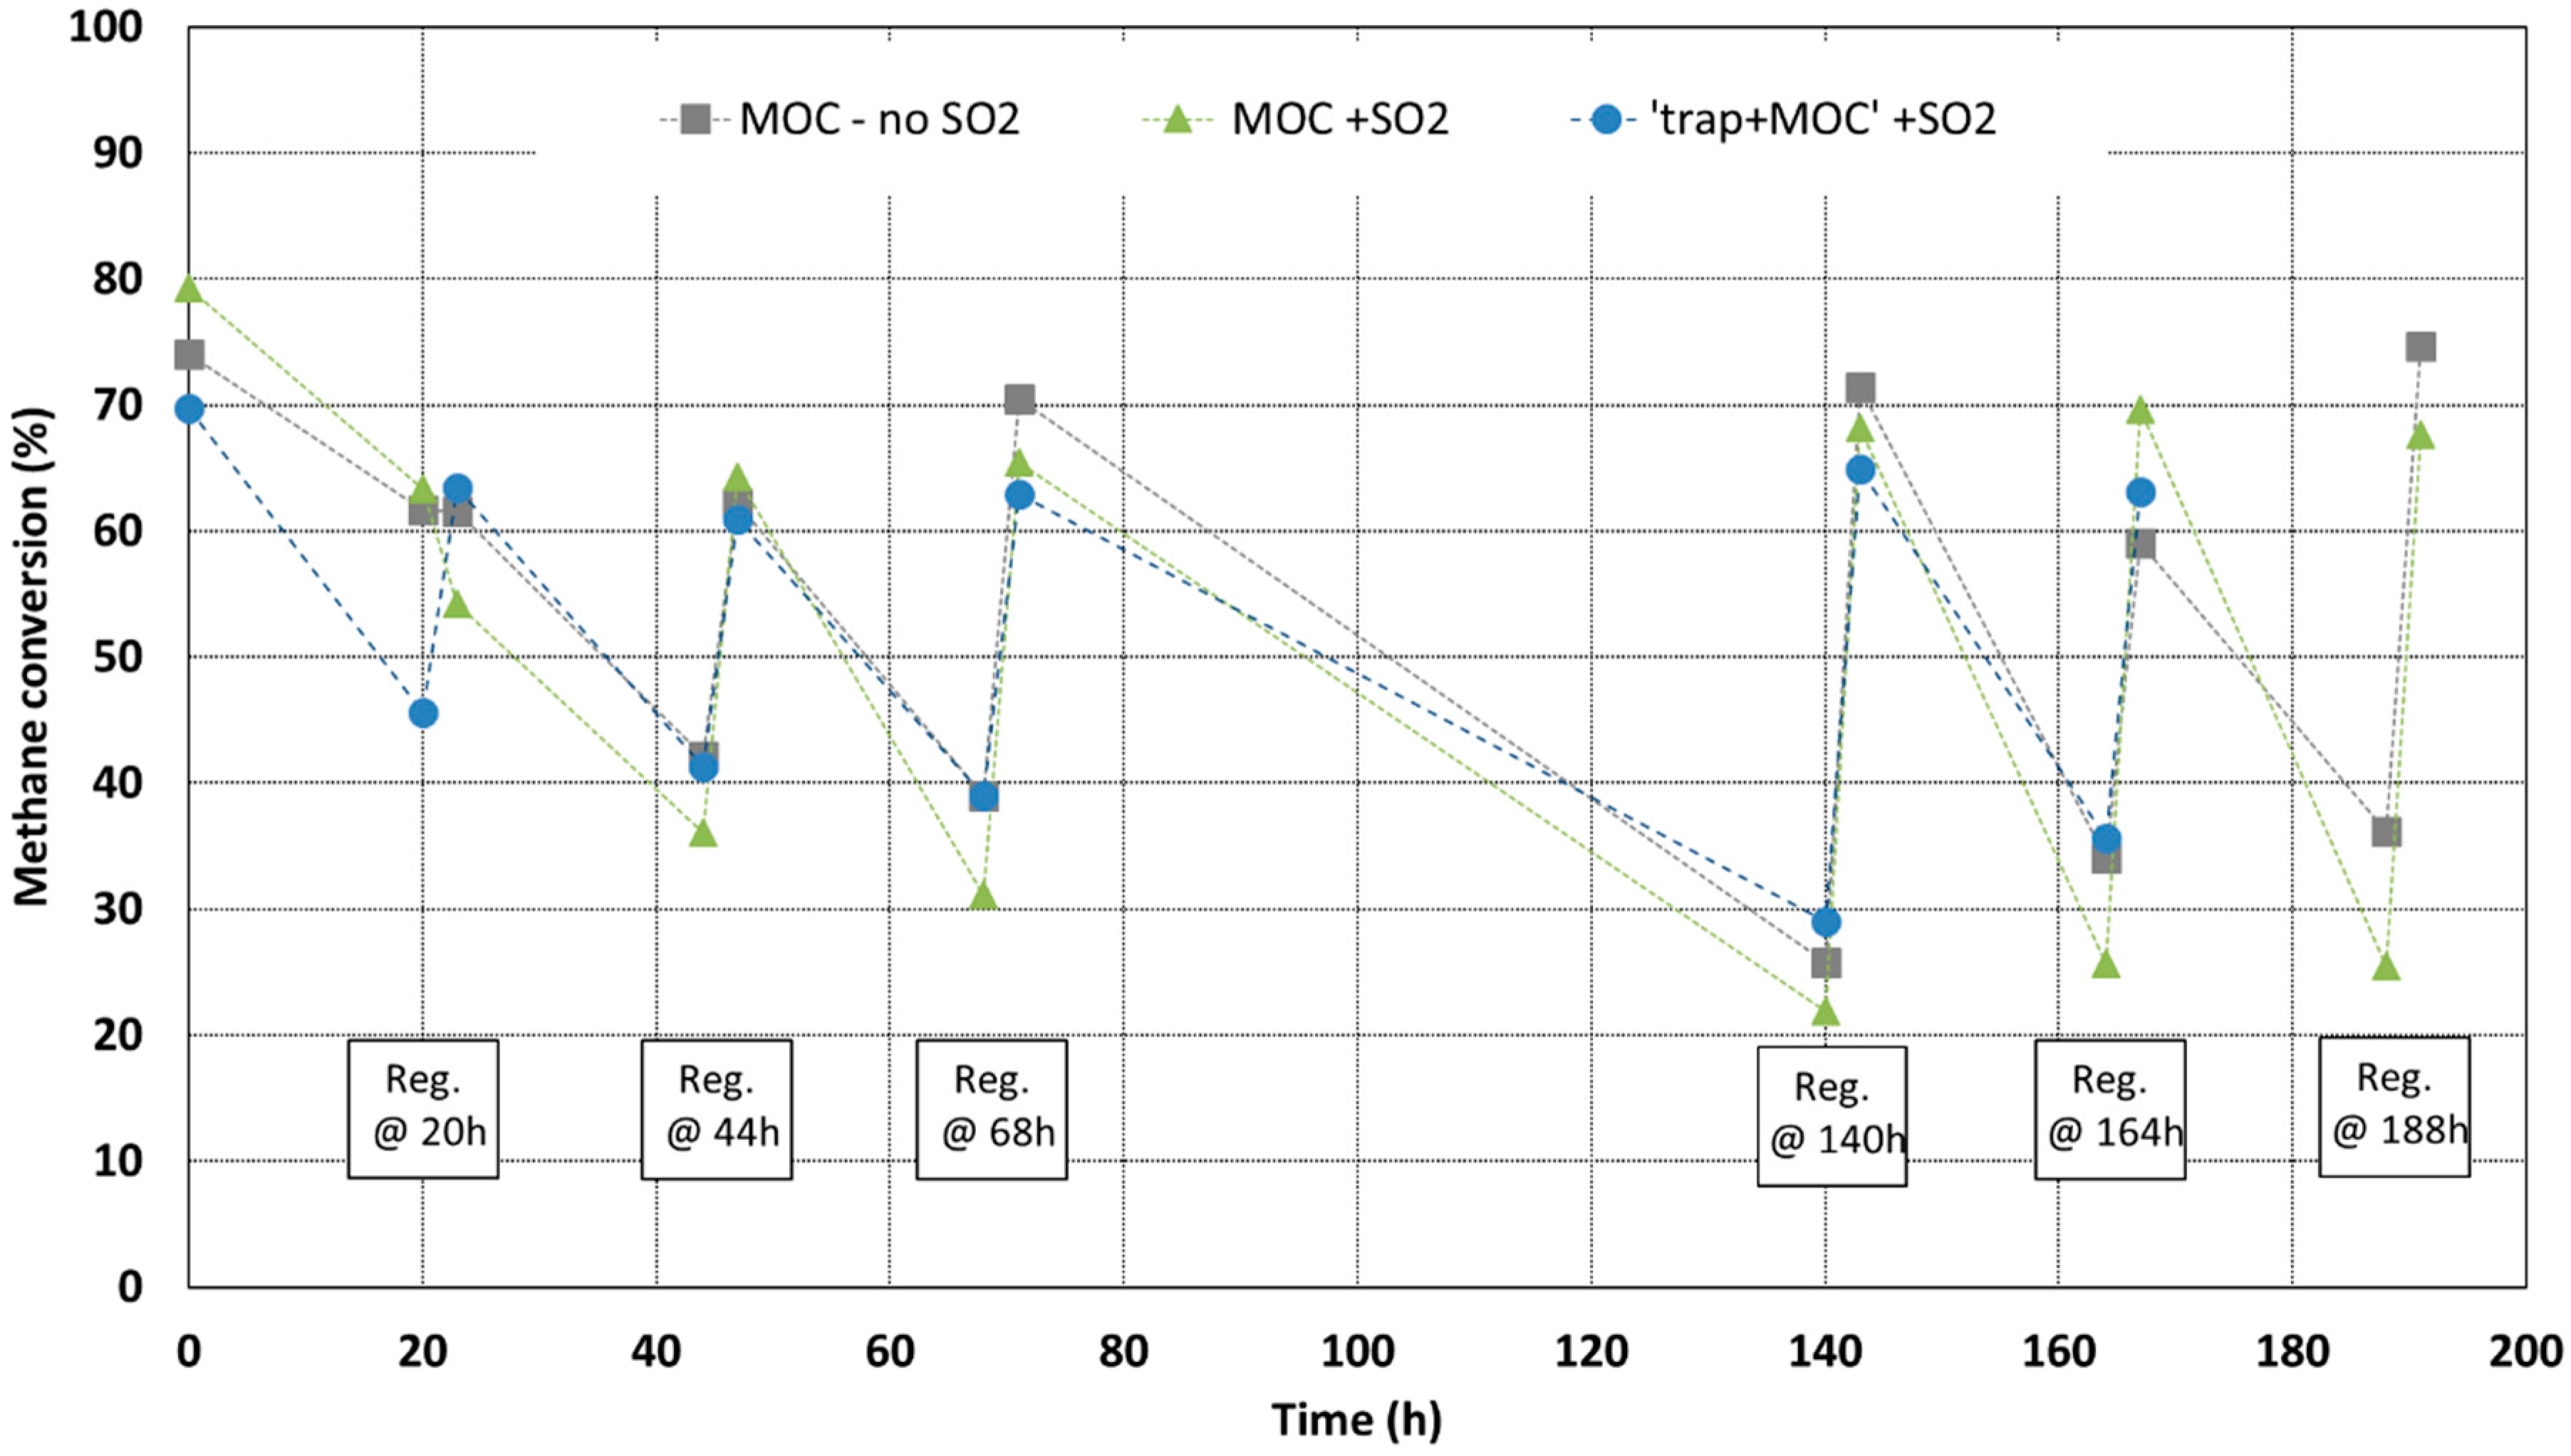
3.2. MOC Performance in Ageing
The methane conversion of the MOC was found to decrease rather quickly over time. The conversions calculated form the GC measurement results are presented as a function of time in
Figure 3. The GC measurement was done just before the regeneration and then again 3 h after the regeneration.
The conversion was found to decrease by approx. 20 percentage units during the first 20 h of driving (see
Figure 3). However, the regeneration, done once a day, was found to recover the methane efficiency of the catalyst. For example, in the case of “SO
x trap + MOC” the methane conversion in the beginning was approx. 70%, after 20 h it decreased below 50%, but after the regeneration the conversion was found to be near 65%. During the following day (20–44 h) the conversion decreased again, now approx. to 40%; however, after the regeneration the conversion increased back to above 60% (see
Figure 3, 44 h). Next, the third day was very similar to the second day’s performance. After this, the next 2 days were conducted without regenerations (68–140 h), and the regeneration was done on the third day. The conversion decreased, without the daily regenerations, to 30%, but again, after the 5 min regeneration period, the conversion was back to above 60% (see
Figure 3, 140 h).
The exhaust SO
2 level had a clear influence on the methane catalyst efficiency. When MOC was aged with 1 ppm extra SO
2 added to the exhaust, the methane conversion after each 24 h of driving was lower compared to the case where MOC was aged without any extra SO
2 in the exhaust (see
Figure 3 cases “MOC-no SO
2” and “MOC + SO
2”). The SO
x trap was found to protect the MOC since when the same ageing was conducted with trap installed upstream of the MOC the methane efficiency was similar to the case with no SO
2 added to the exhaust (
Figure 3, cases “trap + MOC + SO
2” and “MOC-no SO
2”).
Note. All three MOCs of the tests were similar and were preconditioned for 48 h prior to the actual ageing tests start. However, the methane conversion in the start of the ageing test varied between 70–80% with the MOCs. In addition, for some reason, the first regeneration in the cases of “MOC-no SO2” and “MOC + SO2” was not successful, as it seemed not to recover the catalyst efficiency. For this, we do not have any clear explanation. Turning engine to stoichiometric mode was done manually and due to human factors, this might not have been done exactly similarly in all cases. In the case of “trap + MOC” the engine, unintended, faced changes in operation between 68–140 h, which we observed as an increased methane slip, while other emission components were not significantly changed. The methane slip in this case was near 2000 ppm at 140 h and forward. This was also the reason, why this test was ended at 164 h.
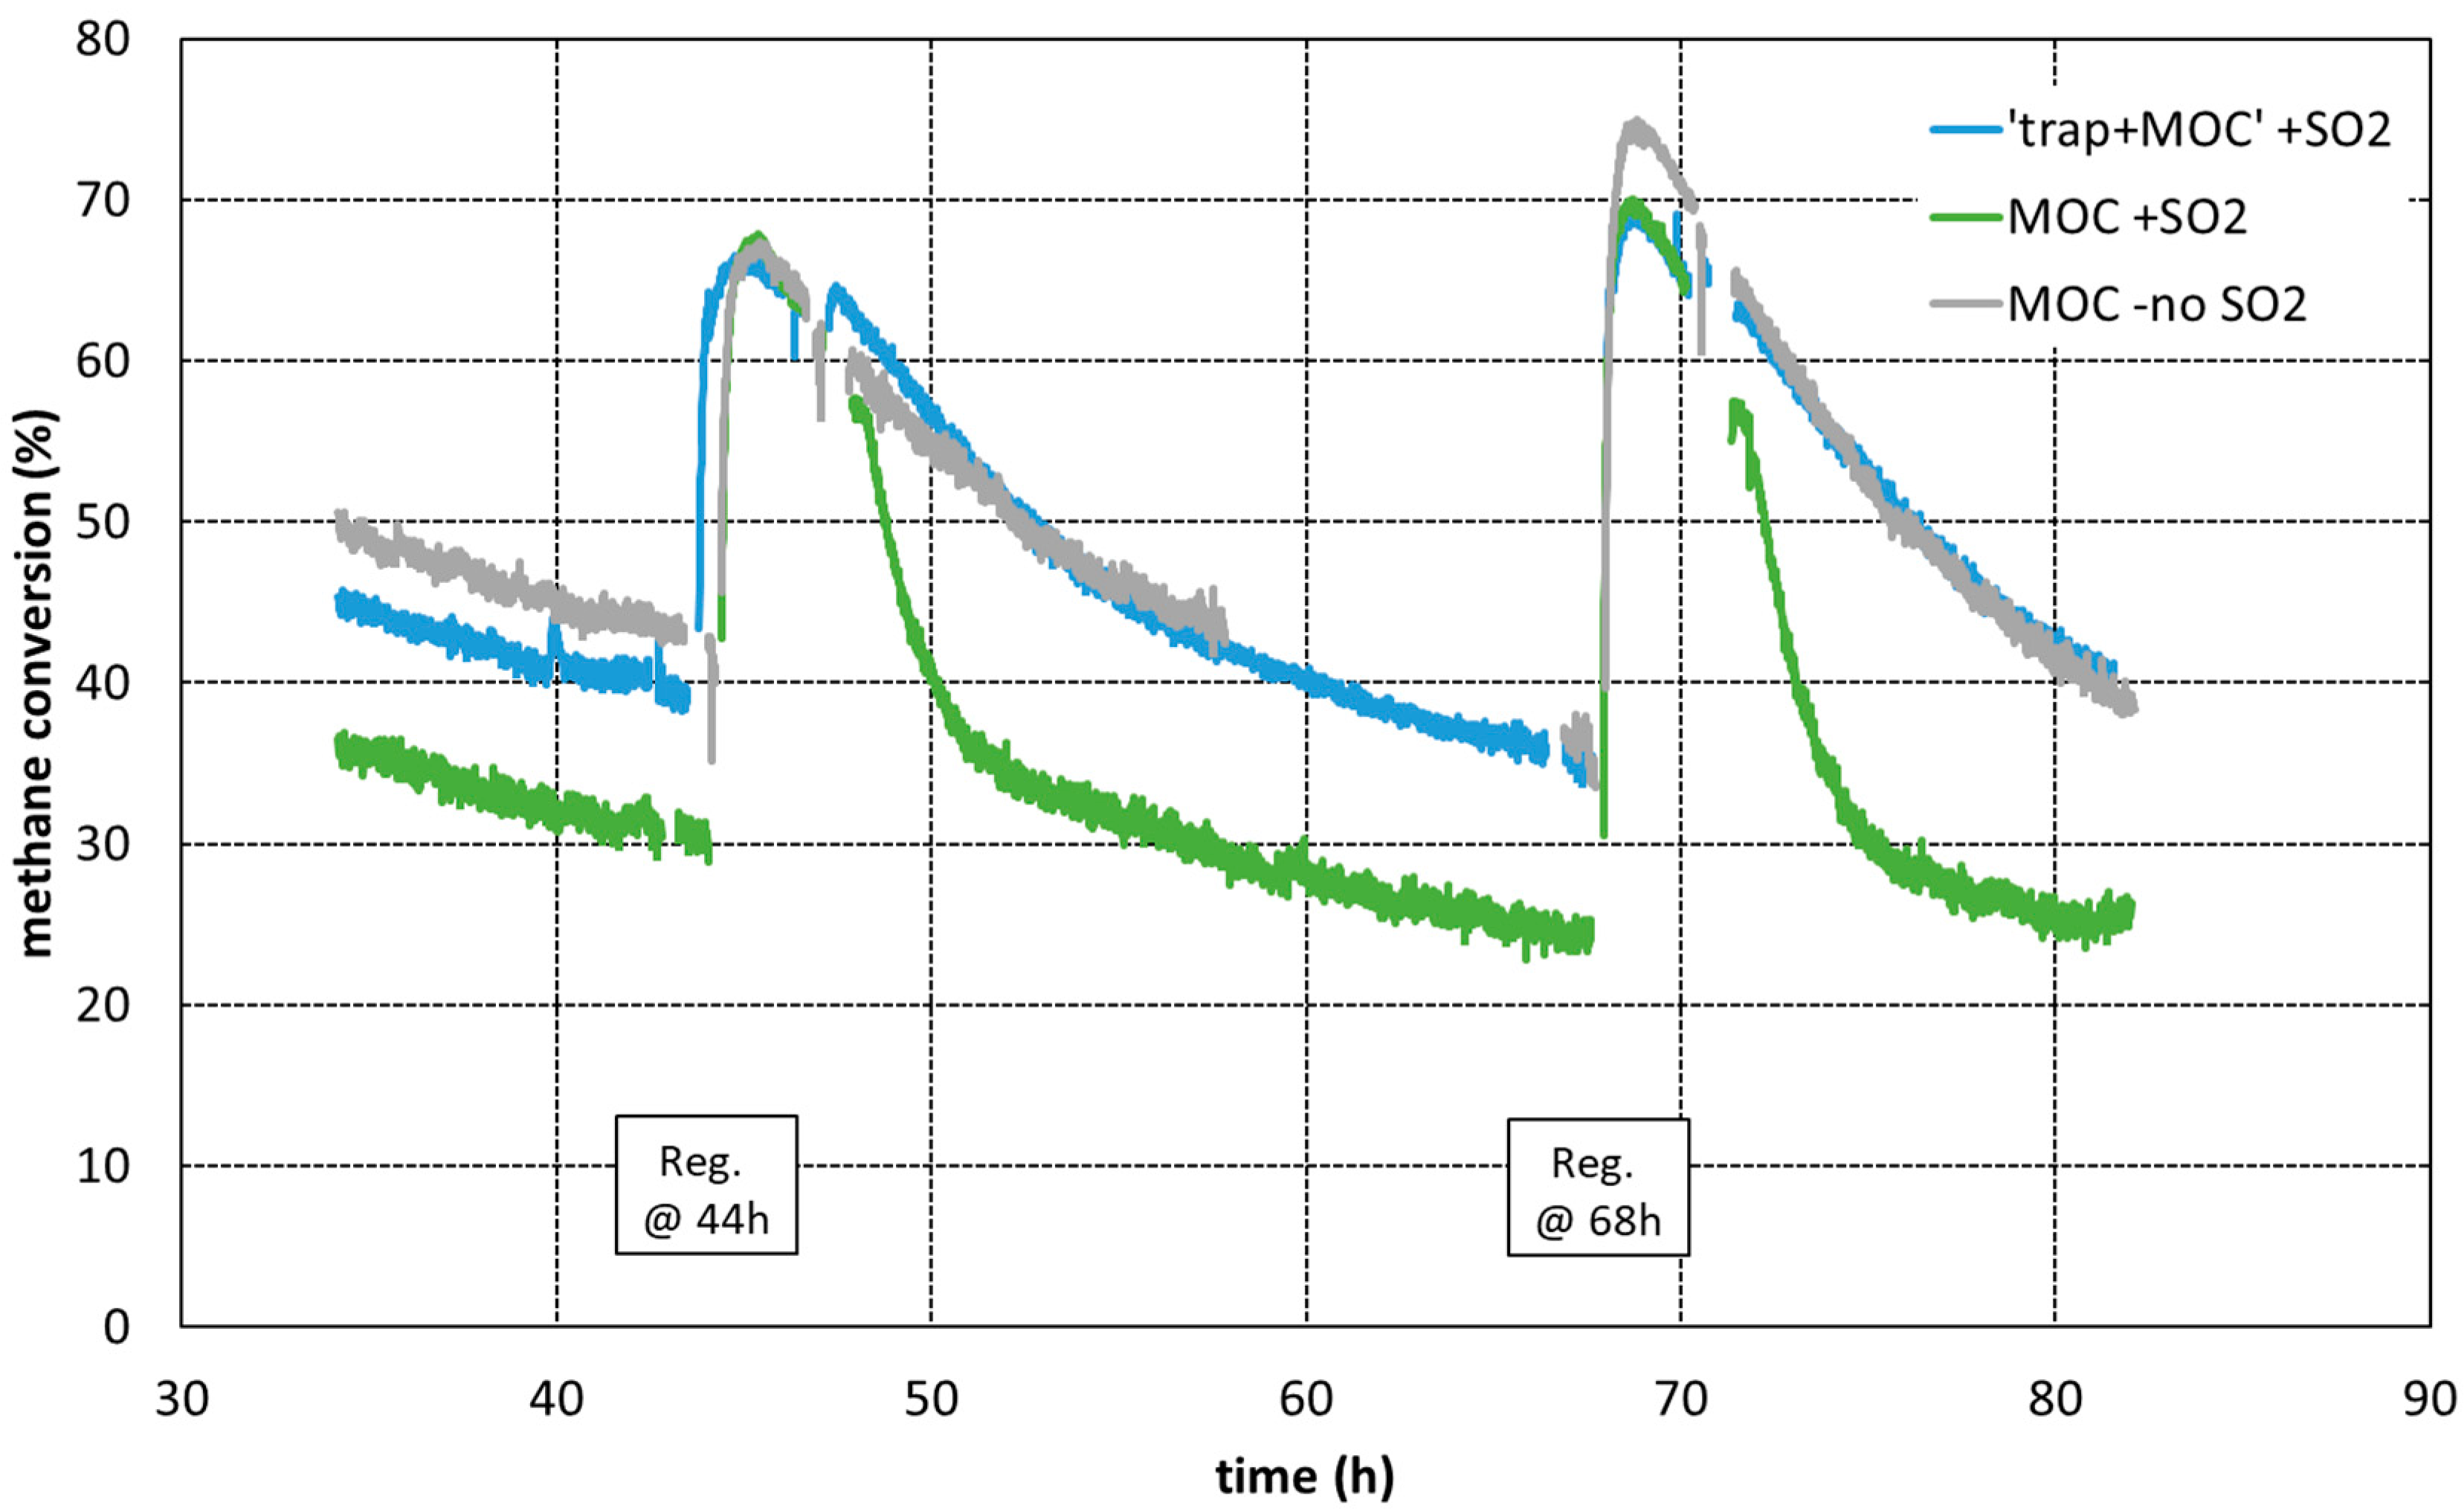
To have a closer look at the MOC performance from hour to hour, the methane conversion calculated from the simultaneously measuring FTIR devices’ methane results are presented in the
Figure 4 roughly for two days period. We started the period to examine only after the first day (due to the unsuccessful first regenerations discussed above). After the second regeneration, i.e., at the 44 h point, all the catalysts resulted in similar methane conversions. The conversion after the regeneration decreases more quickly in the case of “MOC + SO
2” than for the two other cases (“MOC-no SO
2” and “trap + MOC”) that seem to behave very similarly. Again, after the regeneration the conversion is recovered, in all cases, and similarly to earlier day, the conversion after the regeneration (68 h) decreases more quickly in the case of “MOC + SO
2” than for the two other cases. The methane conversion is approx. 10–15% units higher when the trap is placed upstream the MOC, meaning there are more active sites for methane to convert in the MOC downstream the trap. This indicates the SO
2 level inside the MOC is lower when trap is involved compared to the MOC only case.
Although the methane conversion was significantly decreased within time, we saw, in practice, no change in the performance regarding the other emission components. The ethane and ethylene levels downstream of MOC stayed close to zero (below the detection limit) throughout the ageing test. CO level was only a few ppm downstream MOC and formaldehyde level stayed also in the level of 2 ppm (or below) throughout the ageing test.
3.3. MOC Performance in Regeneration
The regeneration, recovering the catalyst efficiency for methane oxidation, already indicates SO
2 is most probably released from the catalyst during the regeneration and the SO
2 measurement confirms this. In each case, during the 5 min regeneration a release of SO
2 was detected with the FTIR downstream of the catalyst. The total SO
2 amounts released over the 5 min regeneration periods are collected to
Table 3. The lowest SO
2 amounts were released in regeneration of MOC, which was tested without any additional SO
2 in the exhaust. In the second case (“MOC + SO
2”) where more SO
2 was present in the exhaust, also more SO
2 was found to be released from the MOC during the regenerations indicating that more SO
2 is collected to MOC also. If we look at for example the third regenerations (
Table 3) we see that in the case of “MOC-no SO
2”, 0.33 g SO
2 was released while in the case of “MOC + SO
2” 0.54 g SO
2 was released. In the case of “trap + MOC” the SO
2 released during the regeneration was 1.52 g (see
Table 2), indicating roughly that the “trap” is contributing to the release with SO
2 amount of 0.98 g. This means that the trap is collecting at least the same amount of SO
2. In addition, this SO
2 release indicates that the trap itself is regenerating at the same time as the MOC. Also, since the methane oxidation efficiency is recovered (
Figure 3 and
Figure 4), no significant amount of the SO
2 released form trap during the regeneration period is expected to be collected in MOC but only flowing through the MOC.
When the extra SO2 was added to exhaust, the total SO2 available during 24 h of driving was 4.10 g. Therefore, in the case of “MOC + SO2” the released SO2 amount was 13% of the amount available, while in the case of “trap + MOC” the released amount was 37% of the amount available. Since the “trap + MOC” released significantly more SO2 compared to MOC only, the “trap + MOC” must also be collecting more SO2. This is what we saw in the catalyst performance and ageing tests, since the methane conversion of “trap + MOC” was higher than in the case of MOC only indicating the poisoning effect of SO2 was less in the case of “trap + MOC”.
The results in
Table 3 also show that in the case of “trap + MOC” when regeneration is done after a longer time period (4th regeneration) some more SO
2 is released during the regeneration. One should note that in this case (of “trap + MOC”) the engine-driving mode was changed between third and fourth regenerations, meaning that the methane slip increased to near 2000 ppm level in ageing mode (discussed above). The actual regenerations were repeated as similarly as manually possible and now significant changes were observed in the regeneration mode engine out emission levels.
Regarding the regenerations conducted during the first tests (the case of “MOC-no SO2”) the adjustment to stoichiometric mode was not always realized similarly. In the cases of the 5th and the 6th regenerations, changing the driving mode to stoichiometric did not happen as smoothly as for the other cases (therefore we marked those in italic to the table).
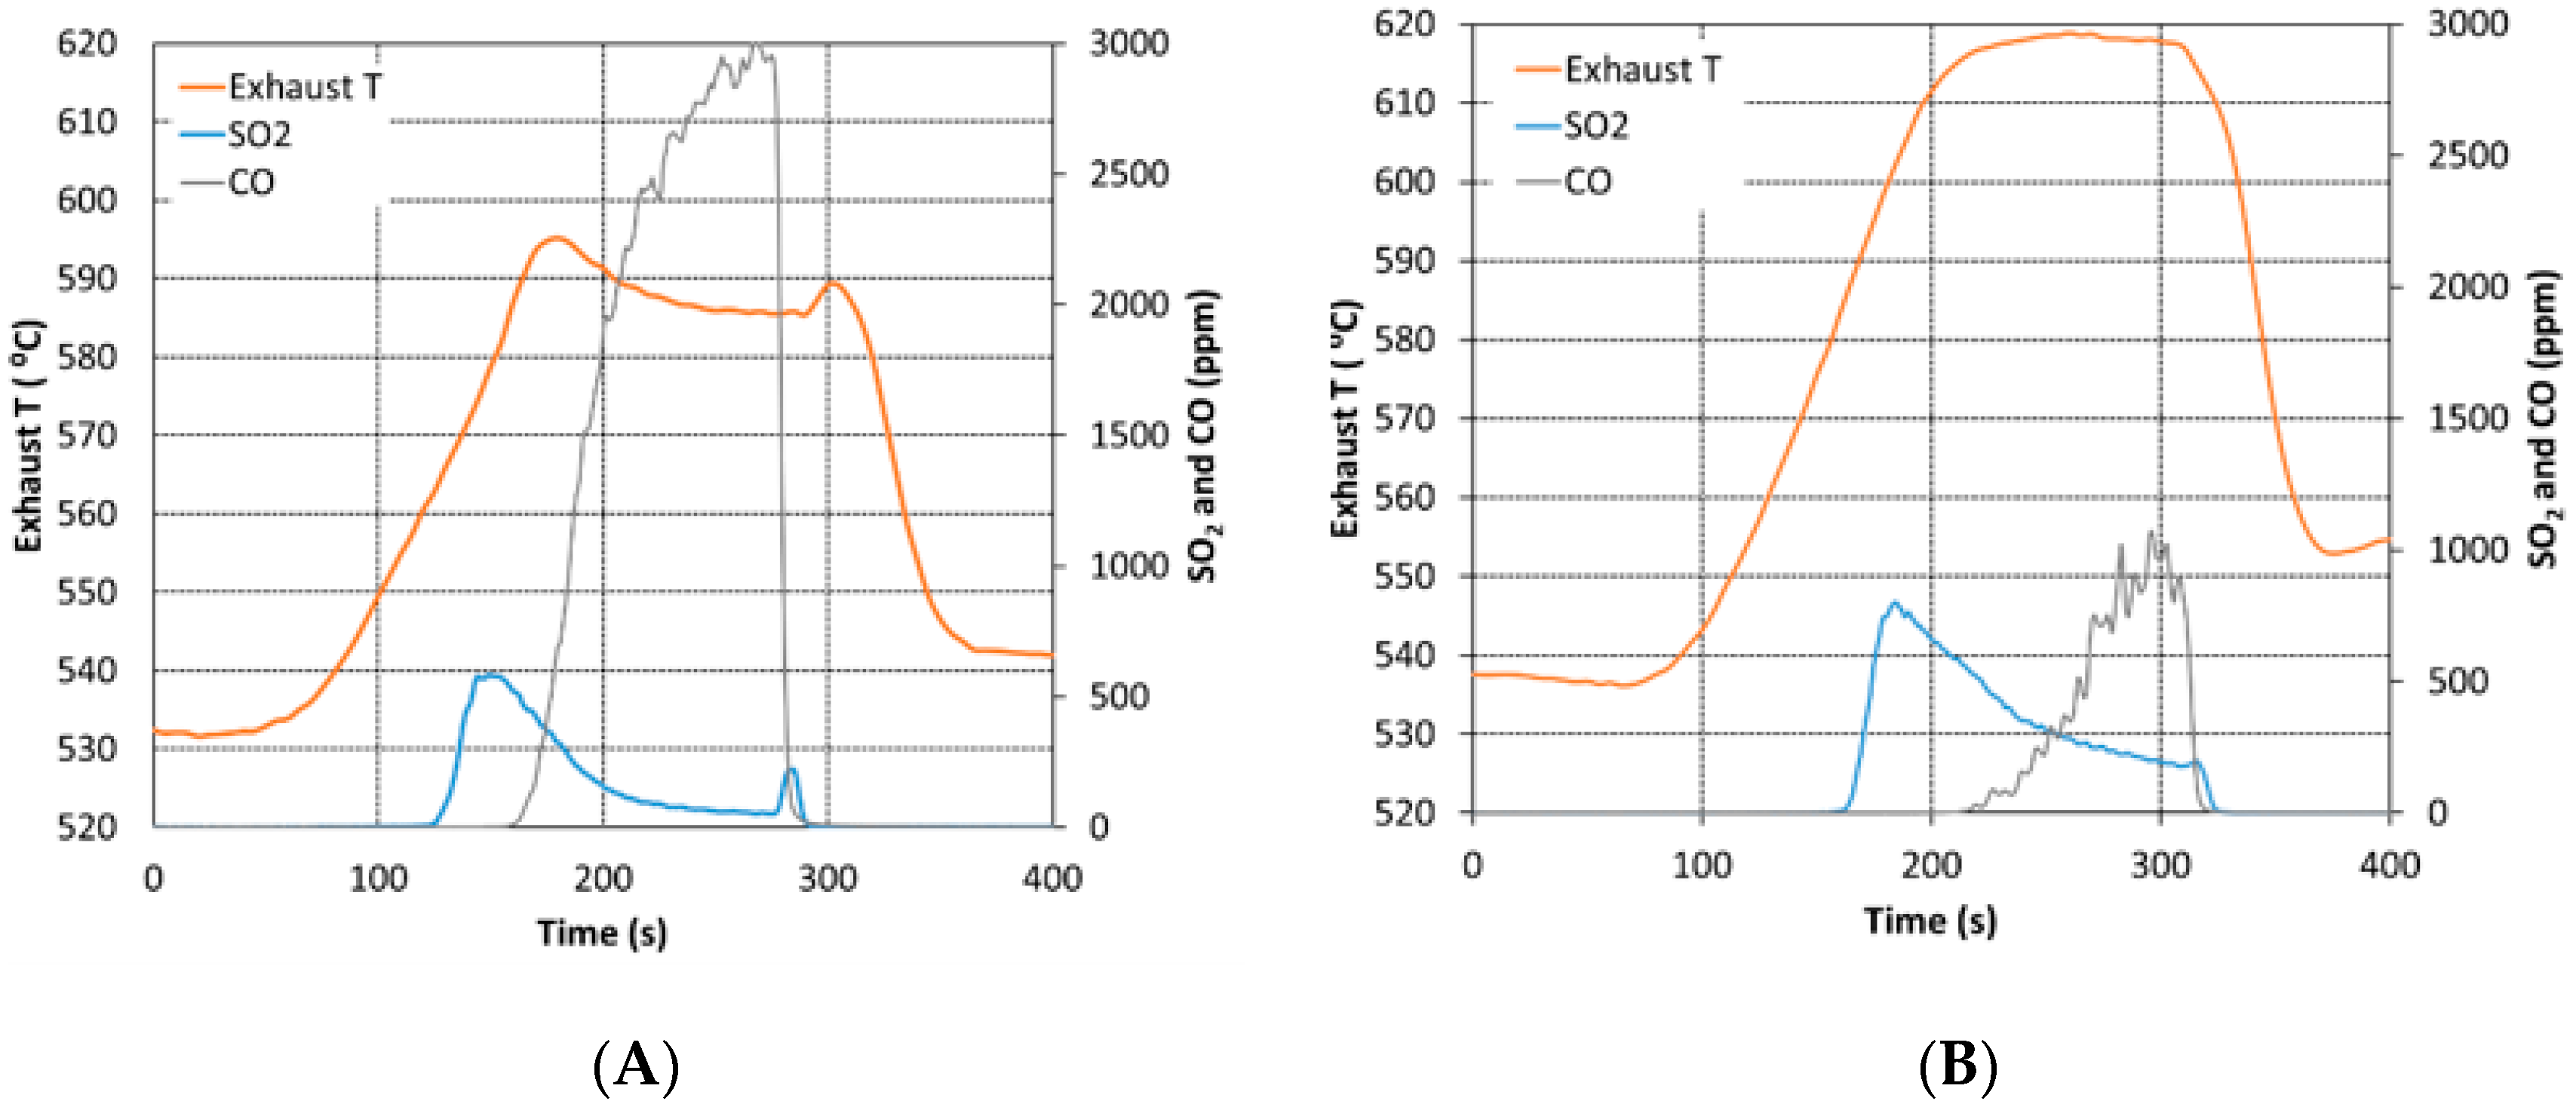
During the regeneration, the exhaust gas composition changed significantly (
Table 1). However, the MOC also worked during the regeneration. Although the engine out CO level increased to above 9000 ppm in the short regeneration phase (
Table 1), the level measured downstream of MOC increased only after approximately 2 min from the start of the regeneration (i.e., turning the engine to stoichiometric driving mode) and did not reach to higher than 3000 ppm (
Figure 5A). This also had strong influence on the exhaust temperature since oxidizing high amount of CO contributes to the temperature increase. This was also observed by temperature measurement downstream the MOC showing an increase of 50–60 degrees during the regeneration (
Figure 5A). Furthermore, no H
2 was observed downstream the MOC, confirming that also the H
2 (engine out concentration 0.6%,
Table 1) was oxidized during the regeneration, influencing exhaust temperature (measured downstream the MOC) as well.
Interestingly, the regeneration of “trap + MOC” done after longer time period (68–140 h) resulted in different behavior than all the other regenerations. As discussed above, in this case the methane slip from the engine increased during 68–140 h to a level of 2000 ppm. The temperature increase during regeneration was 20–30 degrees higher in this case (
Figure 5B) compared to other regenerations (
Figure 5A). The exhaust temperature downstream the catalyst was a few degrees higher in the normal driving mode (“ageing”) as well (see
Figure 5A,B prior to regeneration start). Since the methane conversion over the MOC was similar for both methane slip levels (normal 1000 ppm versus this higher 2000 ppm), the MOC was oxidizing more methane in this higher slip case and this methane oxidation increase can also result in temperature increase.
The CO level downstream the MOC in this regeneration of
Figure 5B (i.e., max. 1000 ppm) was significantly lower than in other regenerations although the engine out CO level was similar in all cases. This more effective CO oxidation can be due to temperature increase while this CO oxidation also influences to the temperature increase itself. In addition, a higher SO
2 release was observed (
Figure 5B). The temperature increase might be one reason for this while also the fact that after a longer period without regenerations also more SO
2 is most probably collected to the trap and therefore more SO
2 can be released during the regeneration as well. Also, the SO
2 level at the end of regeneration is on higher level in the regeneration of
Figure 5B being approx. 190 ppm while in the case of
Figure 5A the SO
2 level at the end of regeneration is approx. 50 ppm. The higher SO
2 level at the end of regeneration might indicate that if the regeneration mode is to be continued for a longer time period also more SO
2 could be released. However, on the other hand, especially in the case of
Figure 5A i.e., daily regenerations, most of the SO
2 is released in the first half of the regeneration period. This indicates that shorter regeneration times could be relevant.
4. Discussion
The reports of ICCT and Sphera present average methane slip values of 5.5 g/kWh and 3.8 g/kWh for LPDF engines, respectively [
14,
15]. However, the methane emissions from actual LNG vessels have not yet been widely studied. Anderson et al. [
8] conducted on-board studies on an LNG ship resulting in total hydrocarbon emissions of 1.1–6.7 g/kWh (depending on engine load). Ushakov et al. [
12] report average methane emission of 5.26 g/kWh based on on-board measurements. Peng et al. [
6] also did on-board studies and reported methane levels of 3.7–25.5 g/kWh, the lowest level corresponding to highest engine load and the highest methane level corresponding to engine load of 25%. They also publish the actual methane concentration of 1000 ppm at 90% engine load and higher concentrations at lower engine loads. Lehtoranta et al. [
5] reported methane levels from one medium speed engine (dual fuel, natural gas) at two load modes of 85% and 40% resulting in 5.6 g/kWh and 13.8 g/kWh, respectively. These levels correspond to methane concentrations of 1800 ppm (at 85% load) and 3750 ppm (at 40% load) (
Table 2). Wei and Geng [
30] review also reports total hydrocarbon concentrations above 2000 ppm from natural gas/diesel dual fuel combustion. Comparing these published results, there is a large variation in the methane levels reported, depending, most probably, on different engines (e.g., engine model, size, age) used as well as on engine loadings. Most of the values reported are in g/kWh while there are few publications reporting in concentrations (ppm) also. By comparing these values, it can be concluded that all the methane slips reported are in the order of 1000 ppm or higher. Furthermore, comparing this to the present study, the methane level (1000 ppm and 1500 ppm) in the present study was in the same order of magnitude. However, we used a smaller engine to investigate the performance of MOC but with a target to have similar exhaust gas composition to medium speed DF engines operating with NG as the main fuel. Therefore, we consider the results of the present study to be interpreted as indications of the possibilities to use MOC in LNG vessels.
In the present study, MOC was found to decrease the methane emission by 70–80% at the exhaust temperature of 550 °C. This efficiency, however, decreased significantly within time, even with only 0.5 ppm SO
2 in the exhaust. Regeneration was done once a day and was found to recover the efficiency. This regeneration was done in nearly stoichiometric conditions, the very low O
2 enabling SO
2 release from the MOC while also the temperature increase observed during the regeneration phase might influence the SO
2 release. In addition, the H
2 might play a role here too, since H
2 was found in the exhaust in the regeneration phase and has also been used for methane catalyst regeneration purposes in earlier studies [
26,
27].
Overall, it seems that the temperature is in significant role, both in methane oxidation efficiency as well as in regeneration. One regeneration performed in the present study resulted in higher exhaust temperature downstream of the catalyst and released higher amount of SO2 compared to other regenerations.
In addition to MOC, a SOx trap was studied in connection to MOC, for the first time (to the authors’ knowledge). The SOx trap was shown to protect the MOC against sulfur poisoning to some extent, since tripling the exhaust SO2 level (from 0.5 ppm to 1.5 ppm) was found to have, in practice, no effect on MOC performance when trap was used upstream the MOC.
Other hydrocarbon emissions (ethane, ethylene) and carbon monoxide are easier to oxidize and were found to be nearly totally diminished by the MOC over the whole ageing test. The NG in the present study was high in methane content, while the fuel gas composition from different suppliers can have lower methane content (see e.g., [
12]) and higher share of ethane and heavier hydrocarbons favoring better performance of MOC.
Formaldehyde, HCHO, is defined as carcinogenic substance and contribute also to other severe health effects, such as asthma, see, e.g., [
31,
32]. Therefore it is important to also consider the HCHO increase by LNG use (e.g., [
6]), especially in coastal areas. In the present study, formaldehyde measurements were employed and showed that the MOC very effectively (by 95–99%) reduced the formaldehyde emissions and practically no decrease was found in the formaldehyde oxidation efficiency during the catalyst ageing studies. This indicates that formaldehyde emissions from NG engines can be diminished with the MOC employment.
The results of the present study give indication of the possible use of MOC in LNG ships to control methane slip emissions. However, the regeneration process in real sized lean-burn marine engine is an issue that needs to be solved. Optimization of the regeneration interval and duration depending on the actual target of application is needed as well. Further catalyst development, regarding the efficiency and sizing, is to be done to have the best possible catalyst suitable to be installed at high-temperature conditions in the exhaust line.
Currently, LNG is a viable marine fuel deployed to substantially reduce pollutant emissions (NOx, SOx and particles) from ships. The use of LNG has therefore a notable effect on air quality and human health. In addition, LNG can provide reduction in GHG emissions if methane slip is controlled. This methane slip challenge needs to be solved to maximize LNG’s potential to contribute to climate neutrality. The present study shows that MOC can play a role here. As it is an after-treatment system, it has potential both in new vessels as well as to retrofit to existing vessels. However, further studies are needed to solve the optimized solution for MOC and performance on different engine loadings as well in transient loading relevant in vessel operation.
In the long term, the transition from fossil NG to renewable NG is needed. This means also that further studies on, e.g., biogas (LBG) is needed to be able to develop suitable systems for biogas emissions since, e.g., possible biogas impurities may play a major role in the catalyst performance.


