
Numerical Study of the Action of Convection on the Volume and Length of the Flammable Zone Formed by Hydrogen Emissions from the Vent Masts Installed on an International Ship

 ,
,
Abstract
:1. Introduction
2. Methods
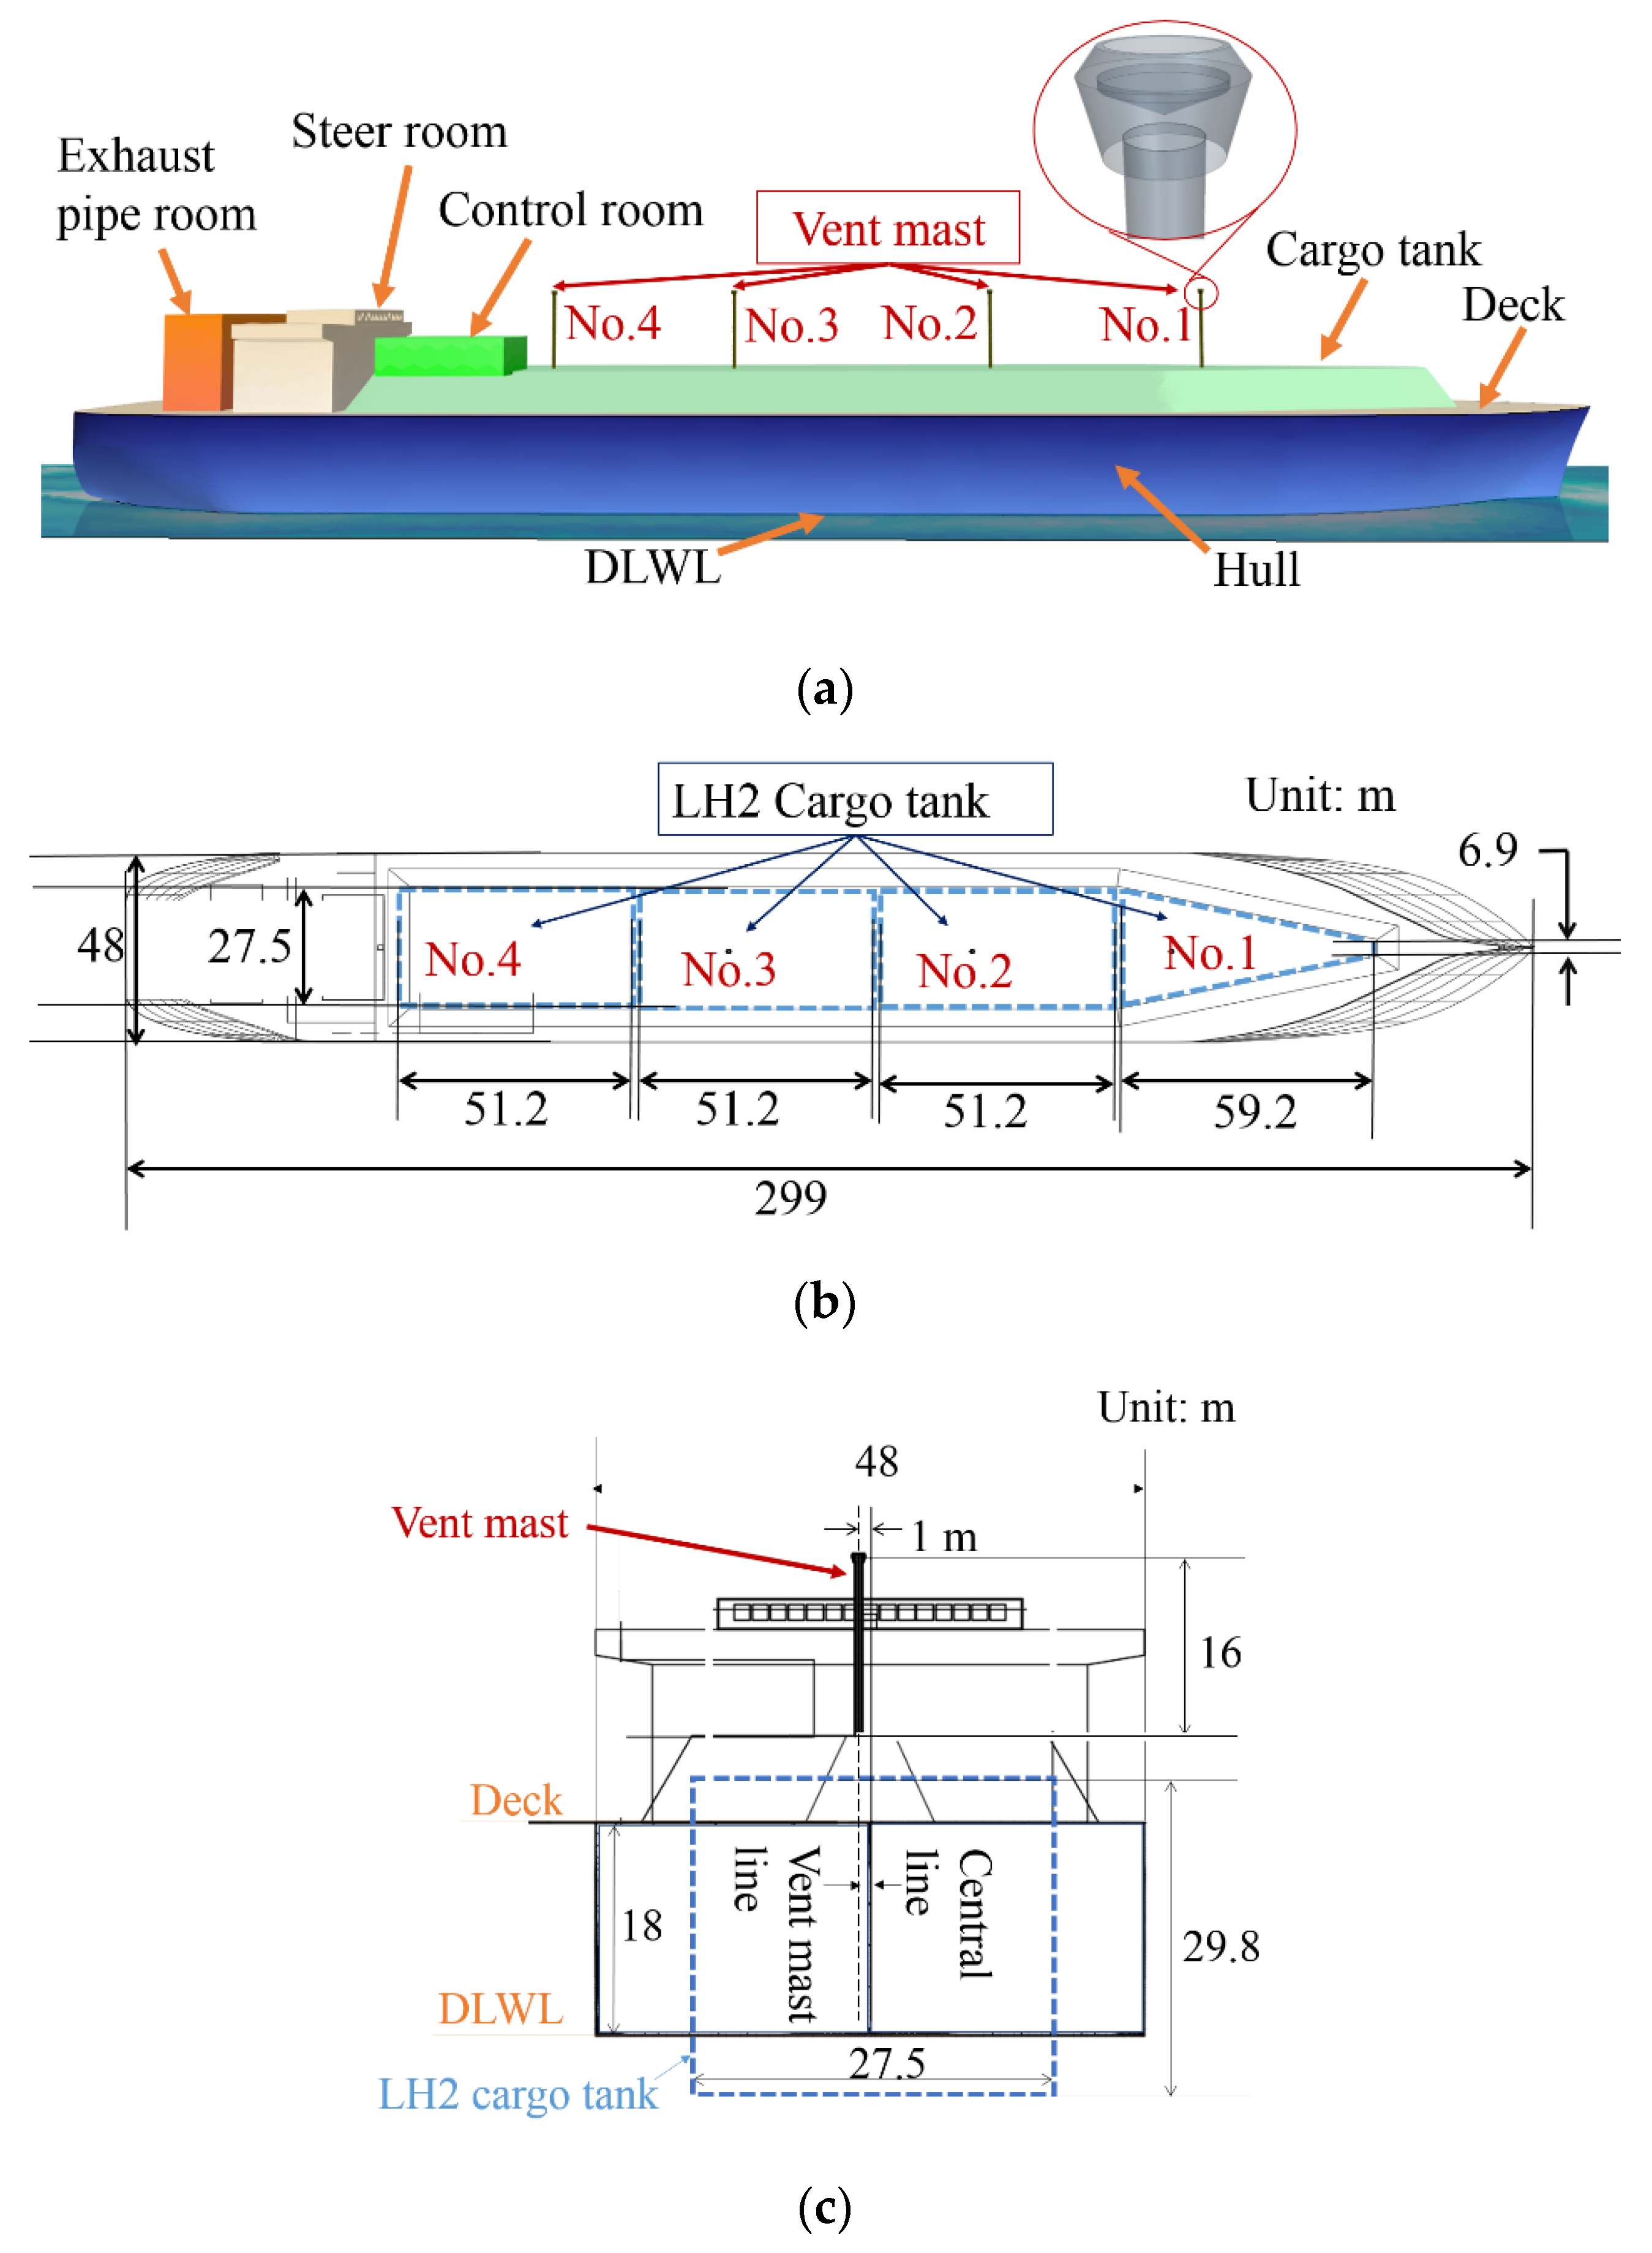
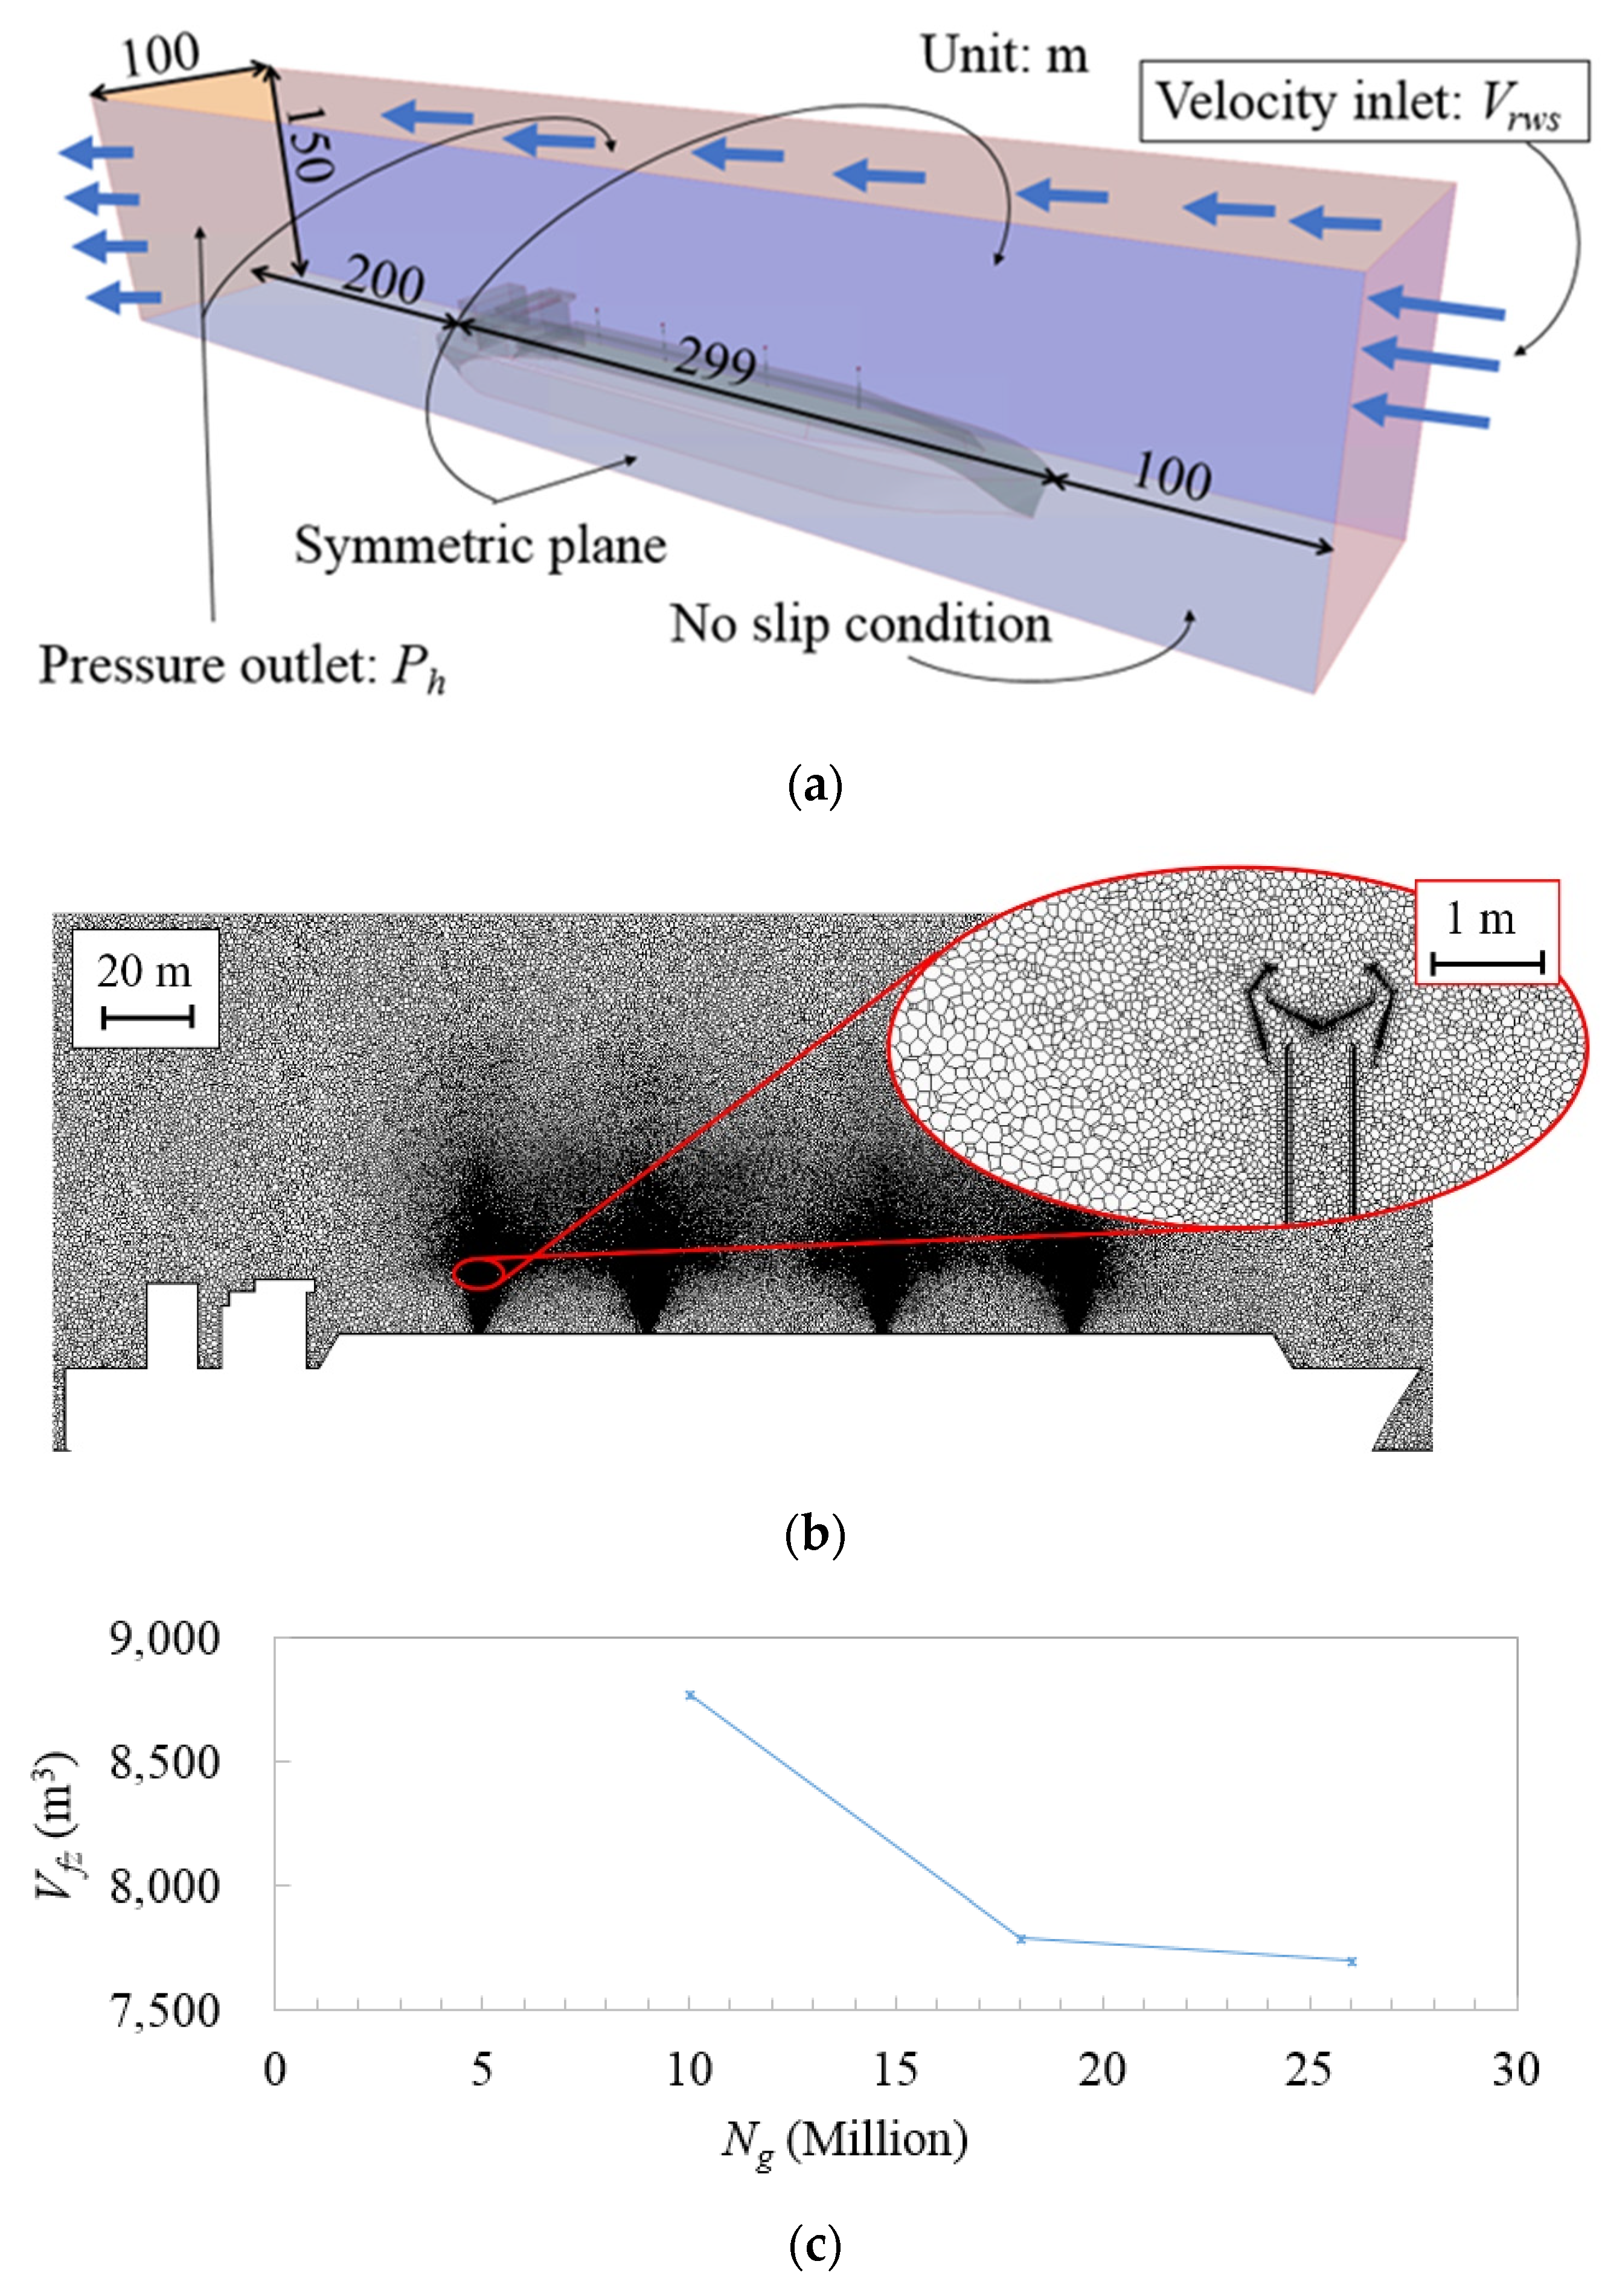
2.1. Modeling
2.2. CFD Solvers
2.3. Estimation with Assumptions
2.4. Parameters
- Relative wind speed.
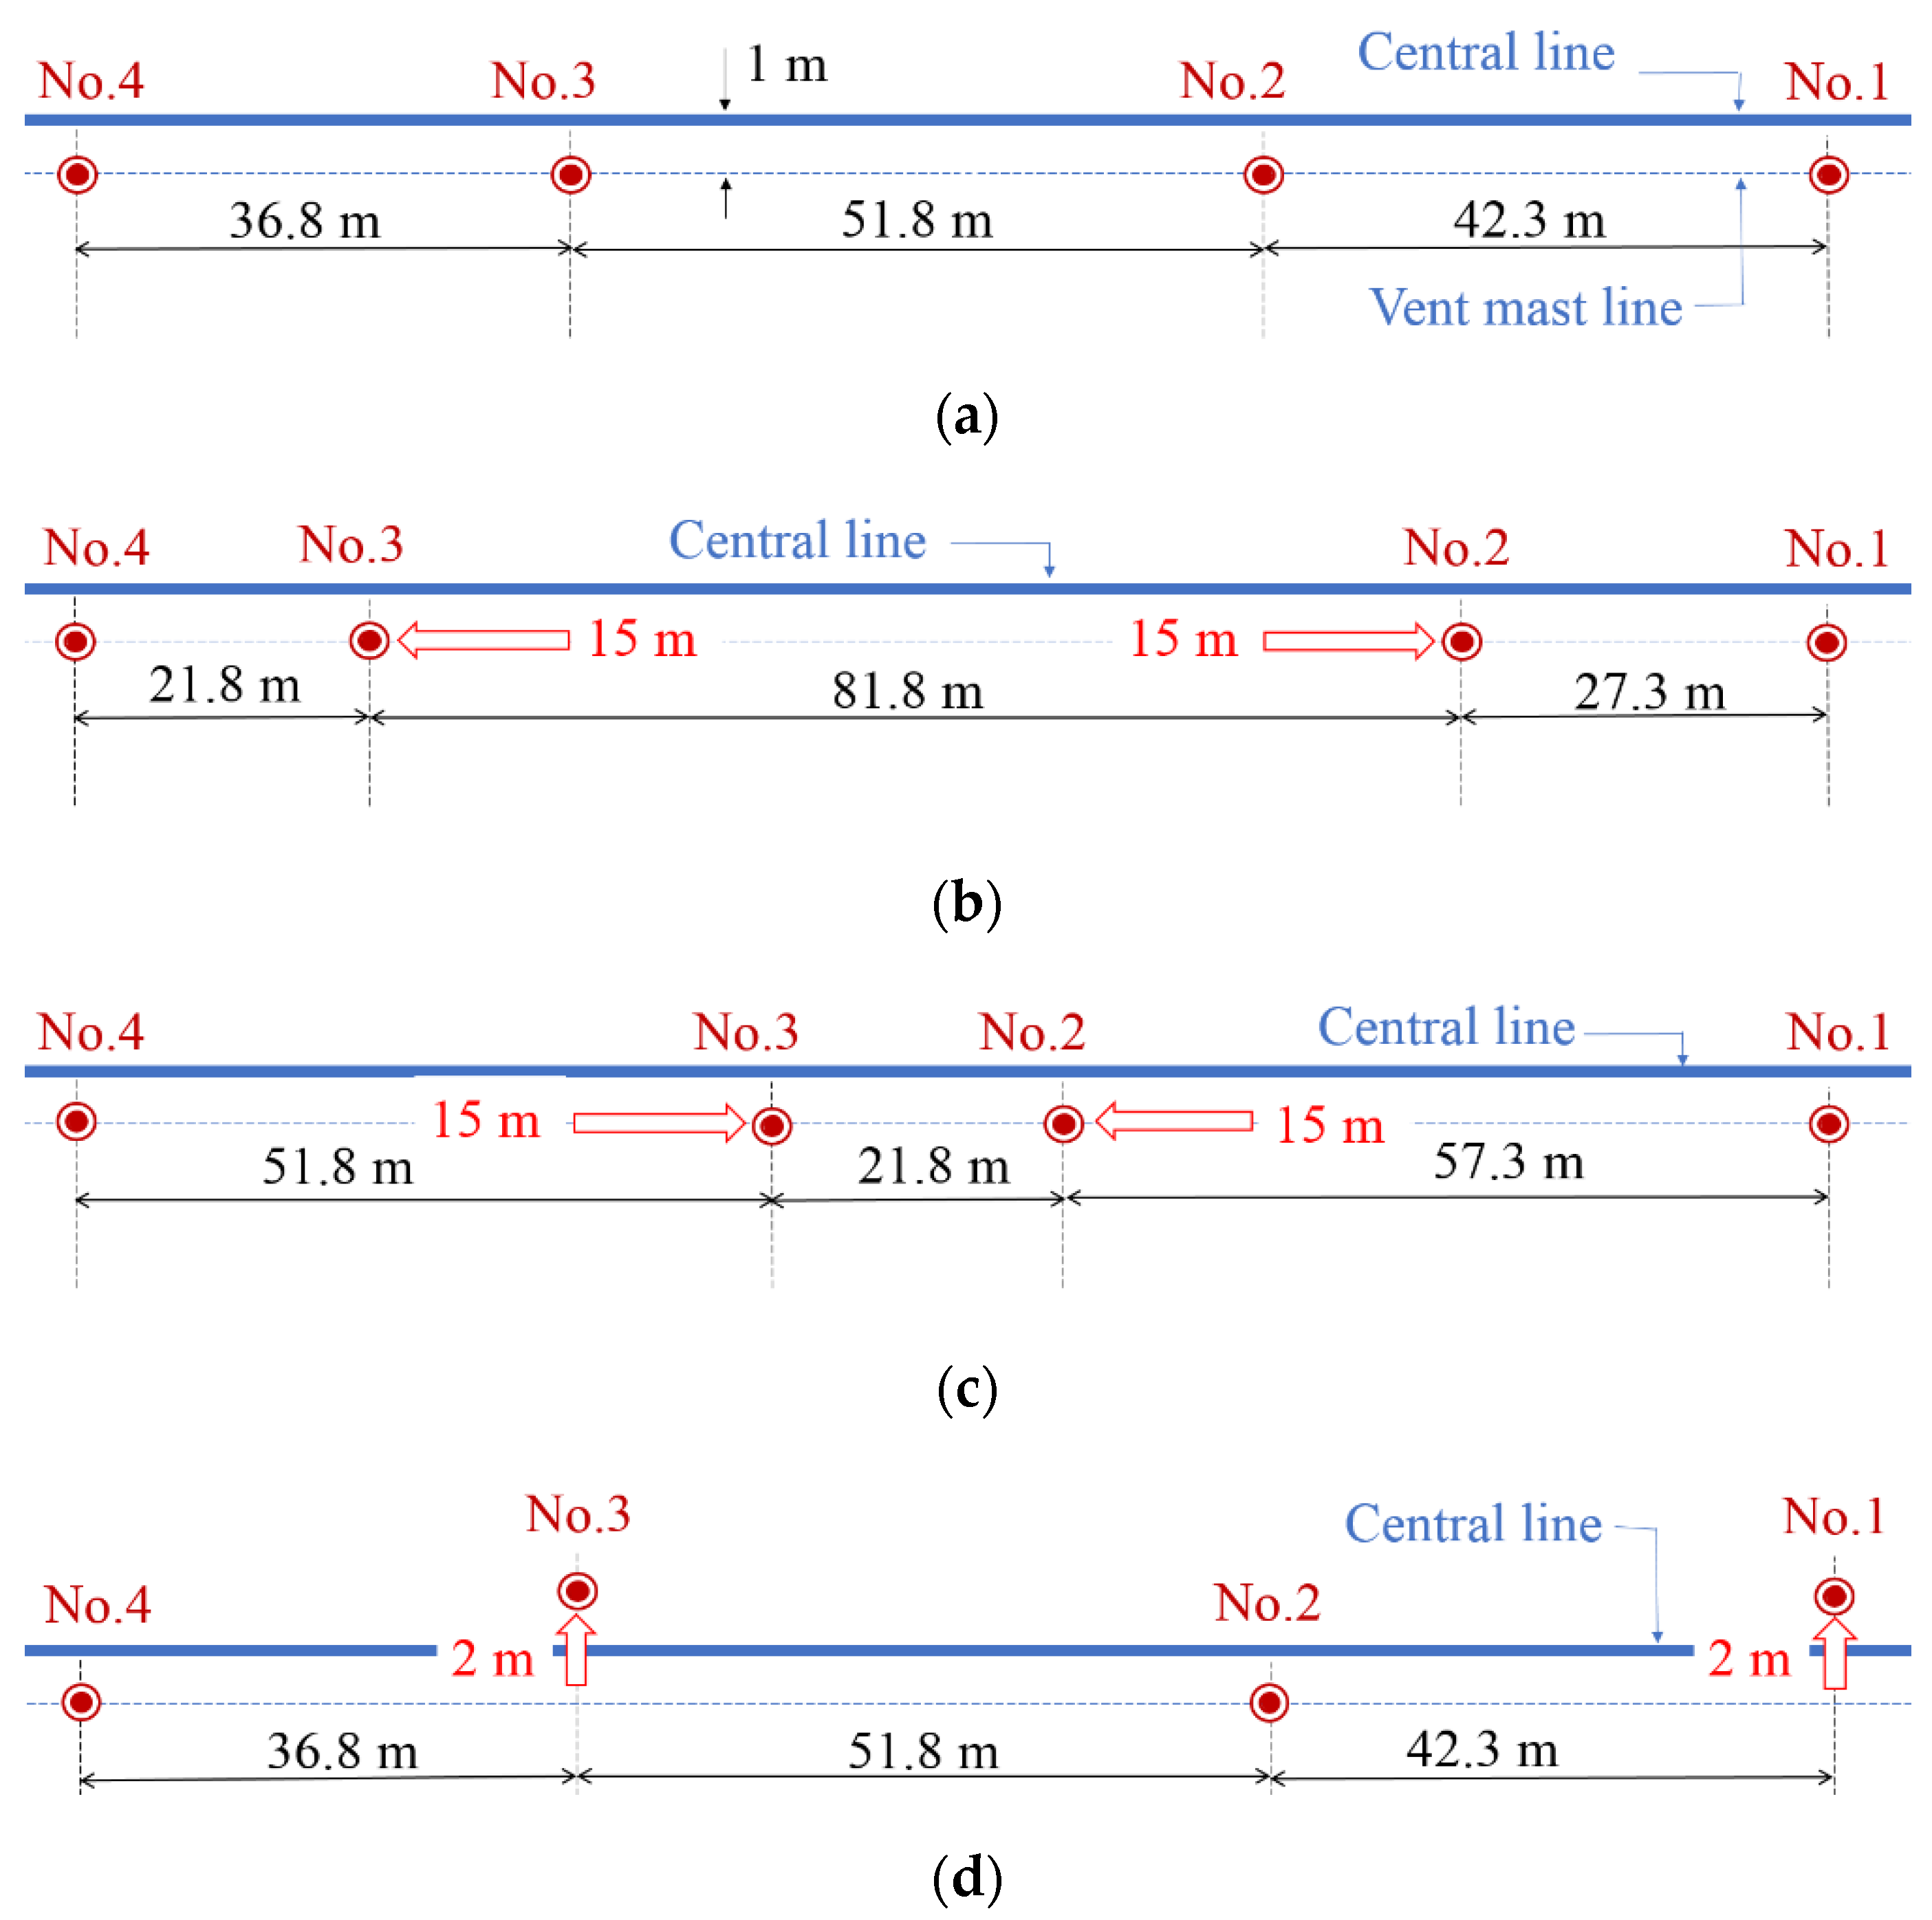
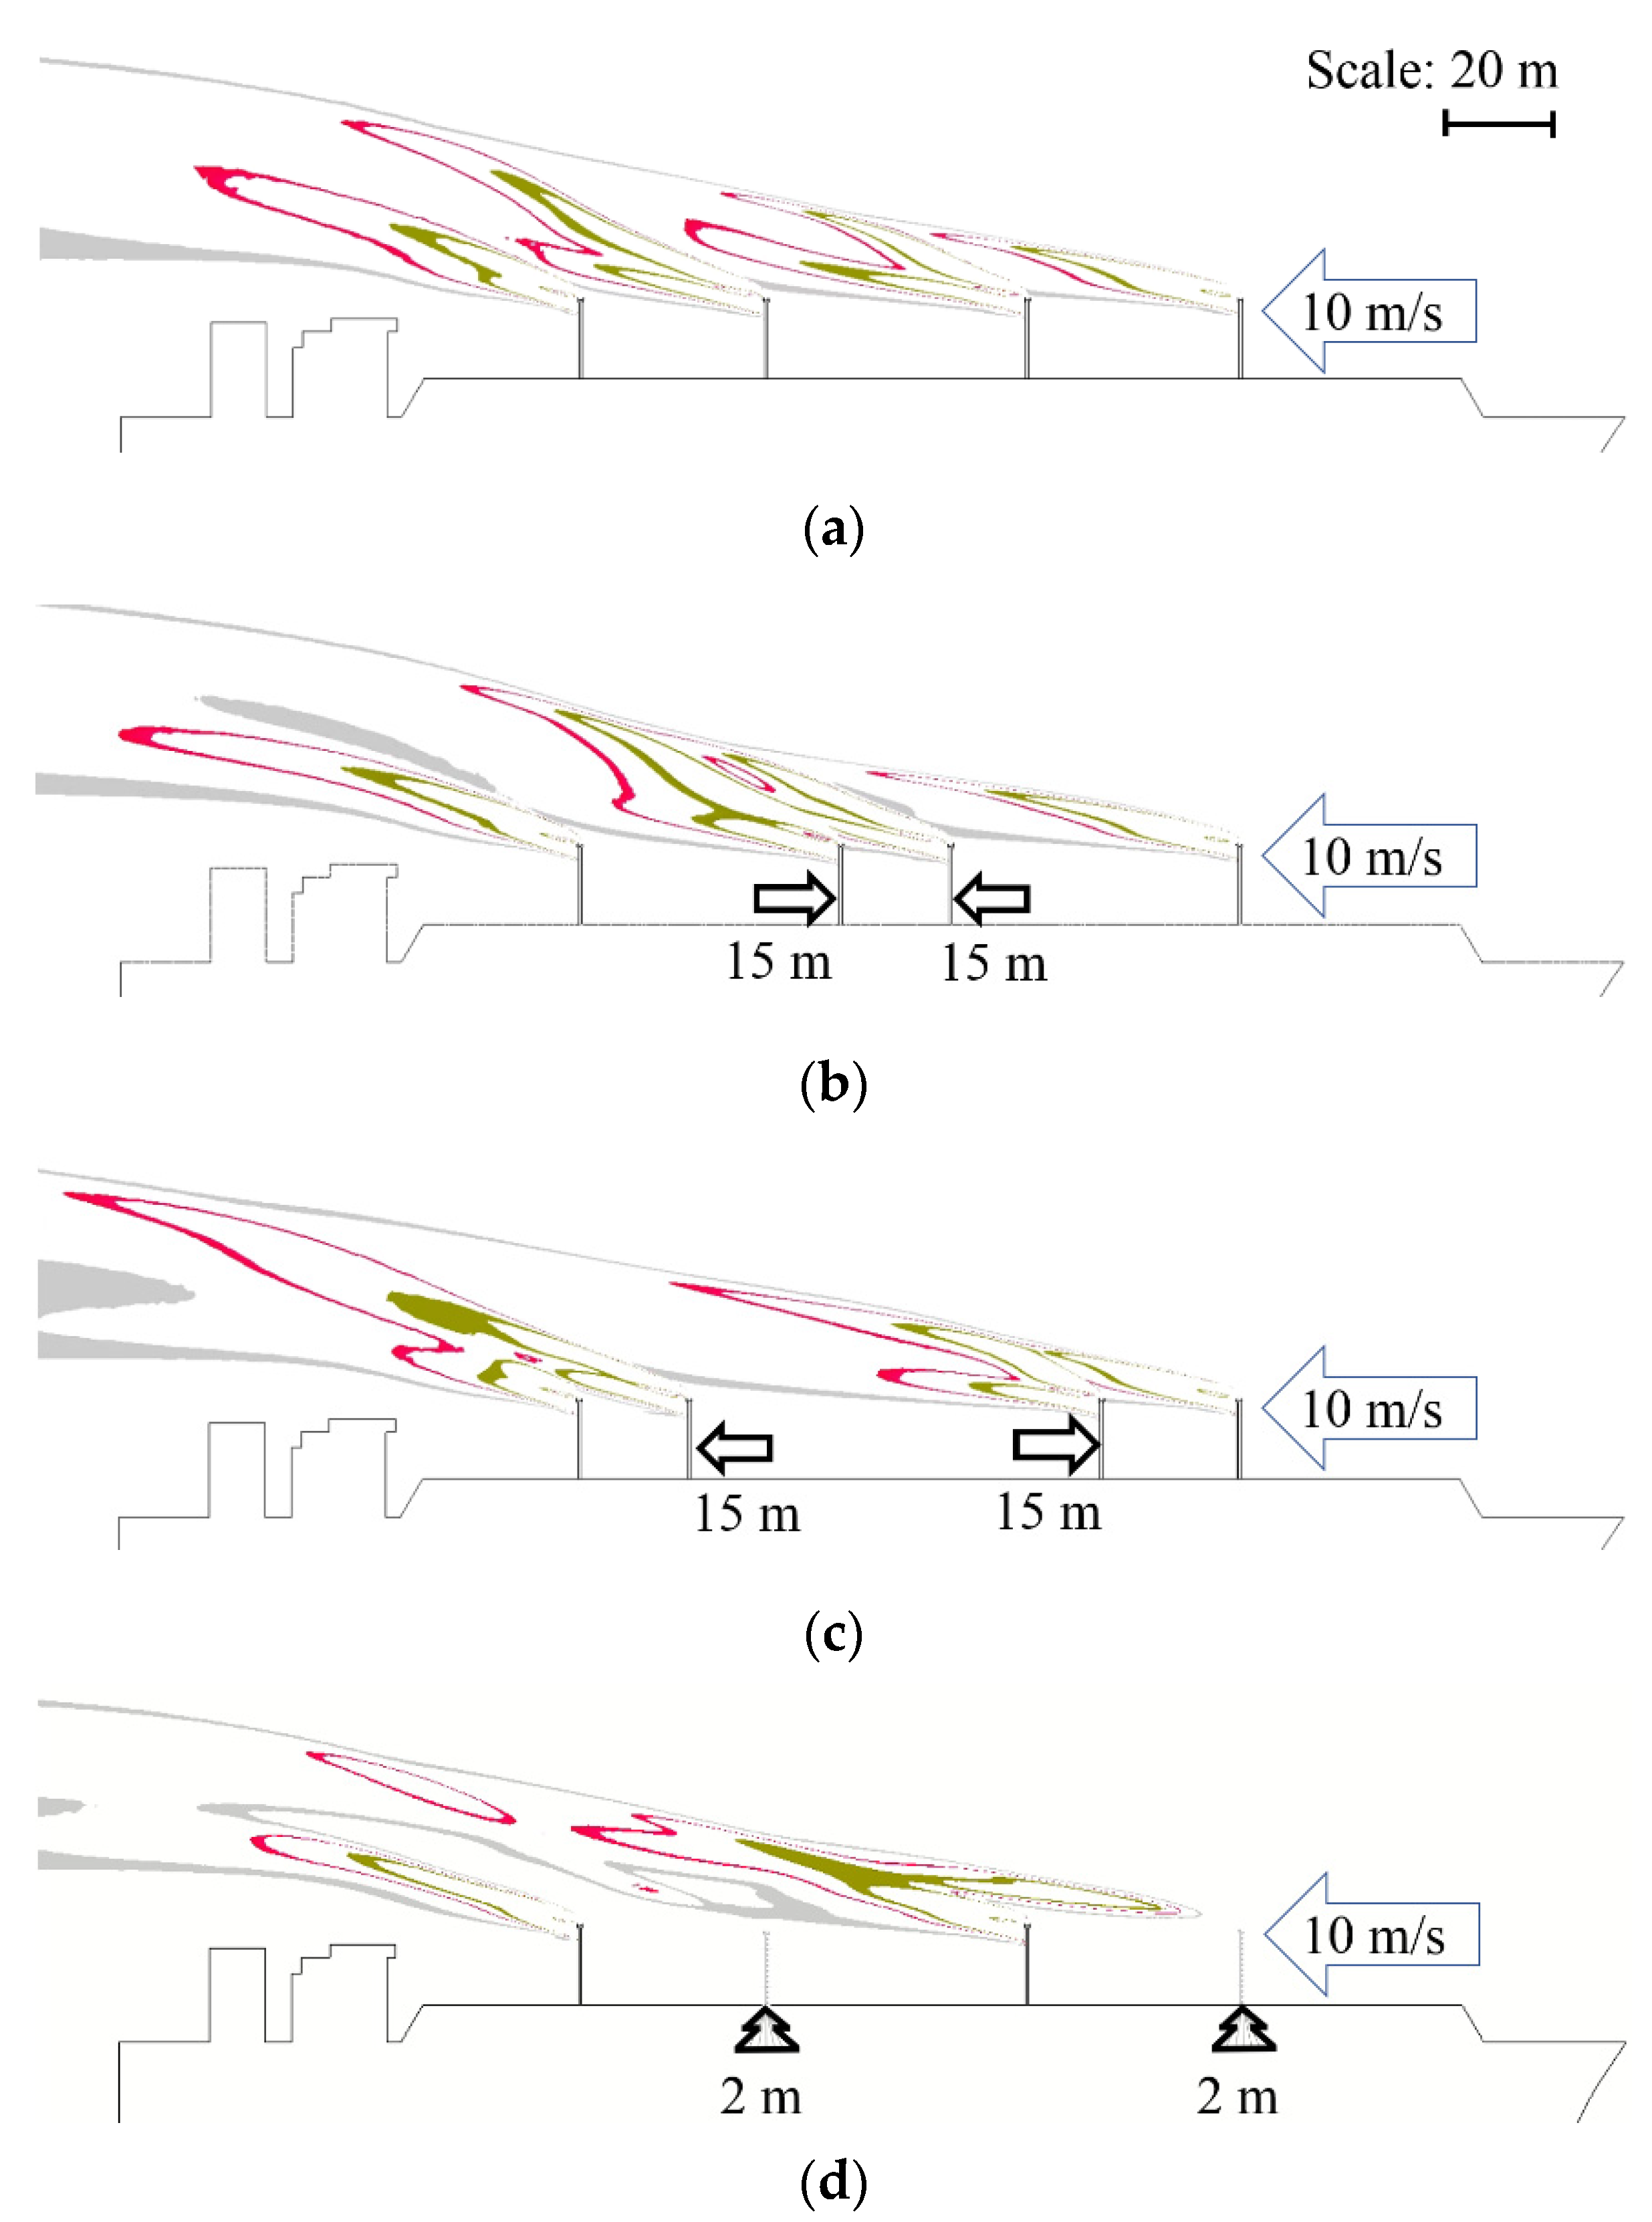
- Arrangement of the vent masts.
- Combination of emissions selected from among the four vent masts.
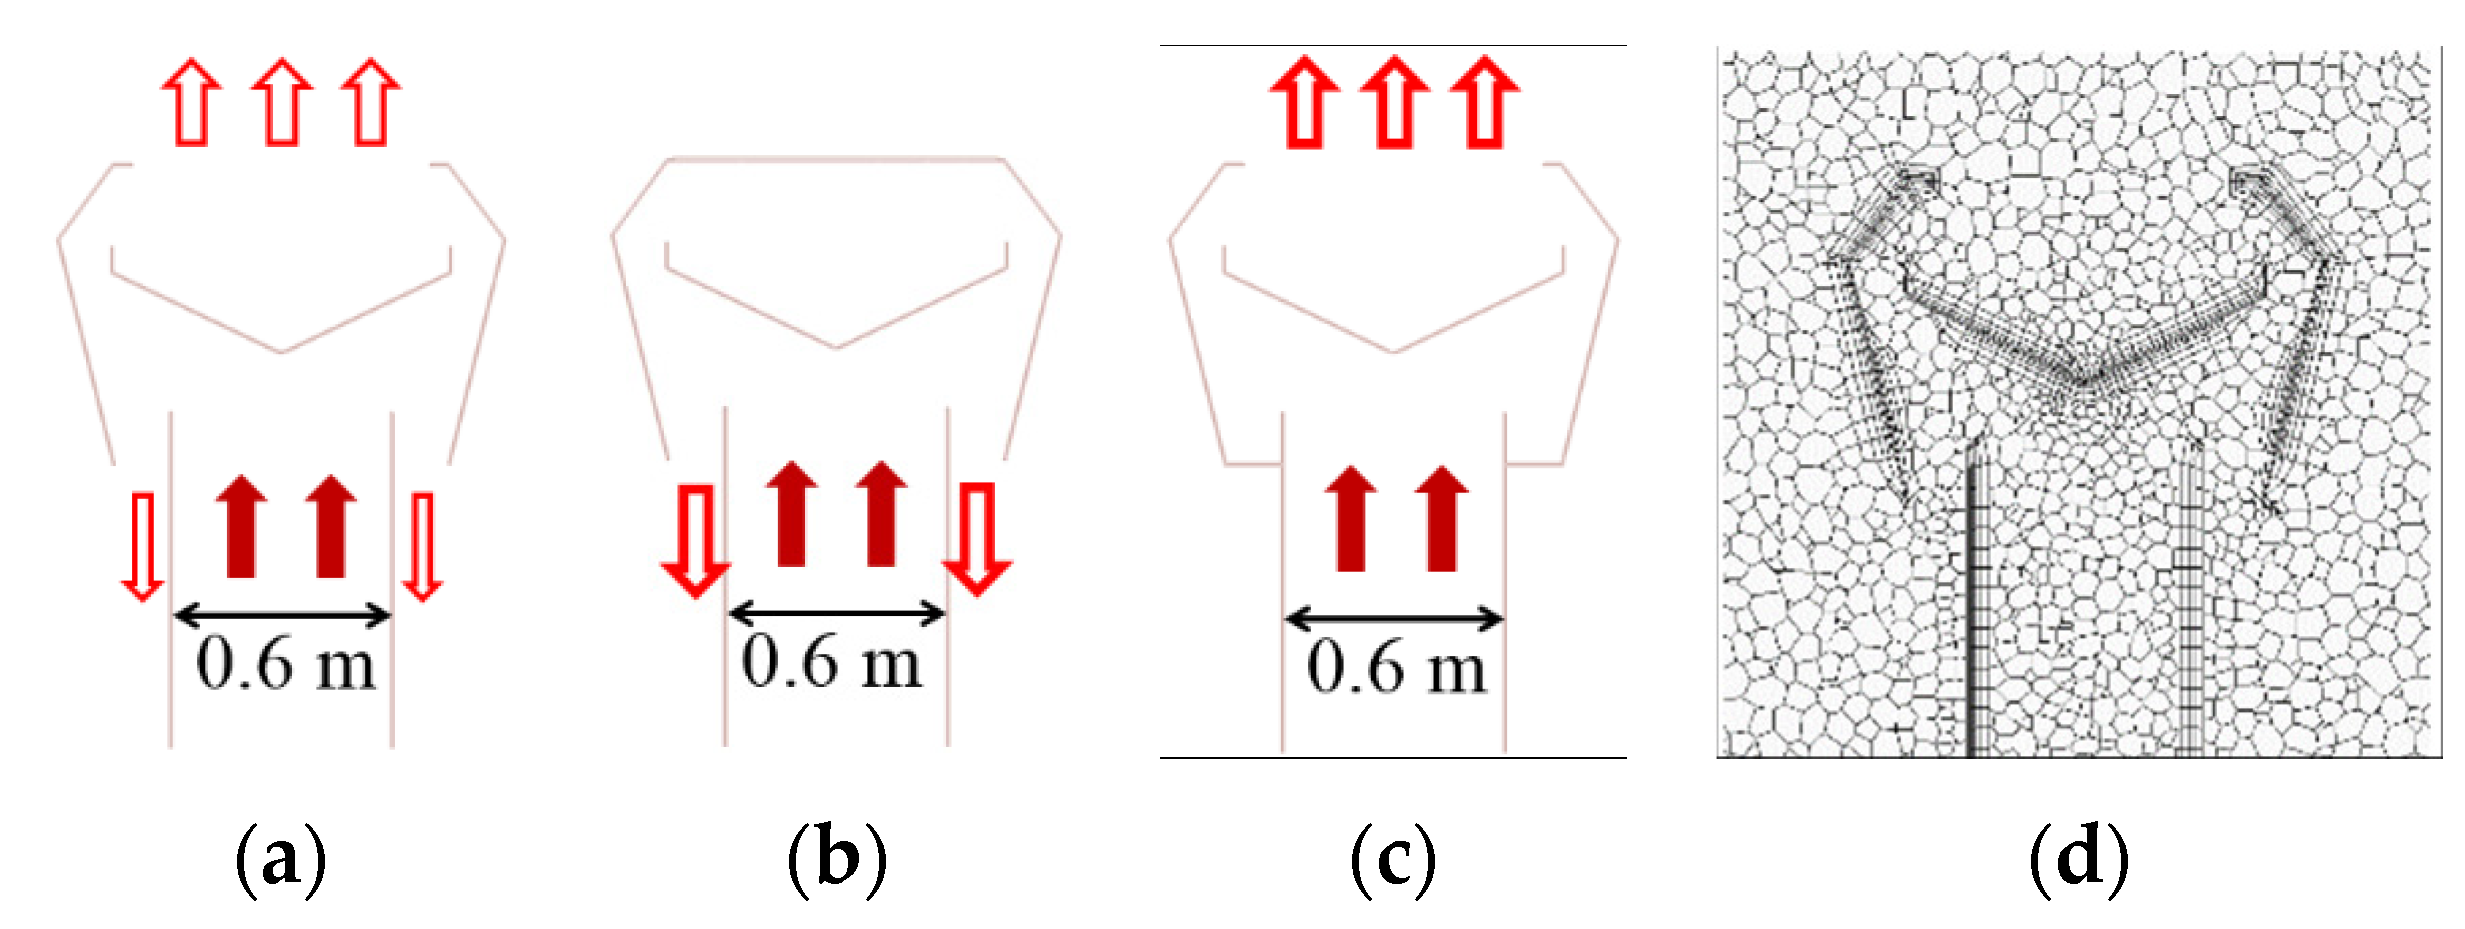
- Direction of emissions from the vent-mast outlet.
3. Results and Discussion
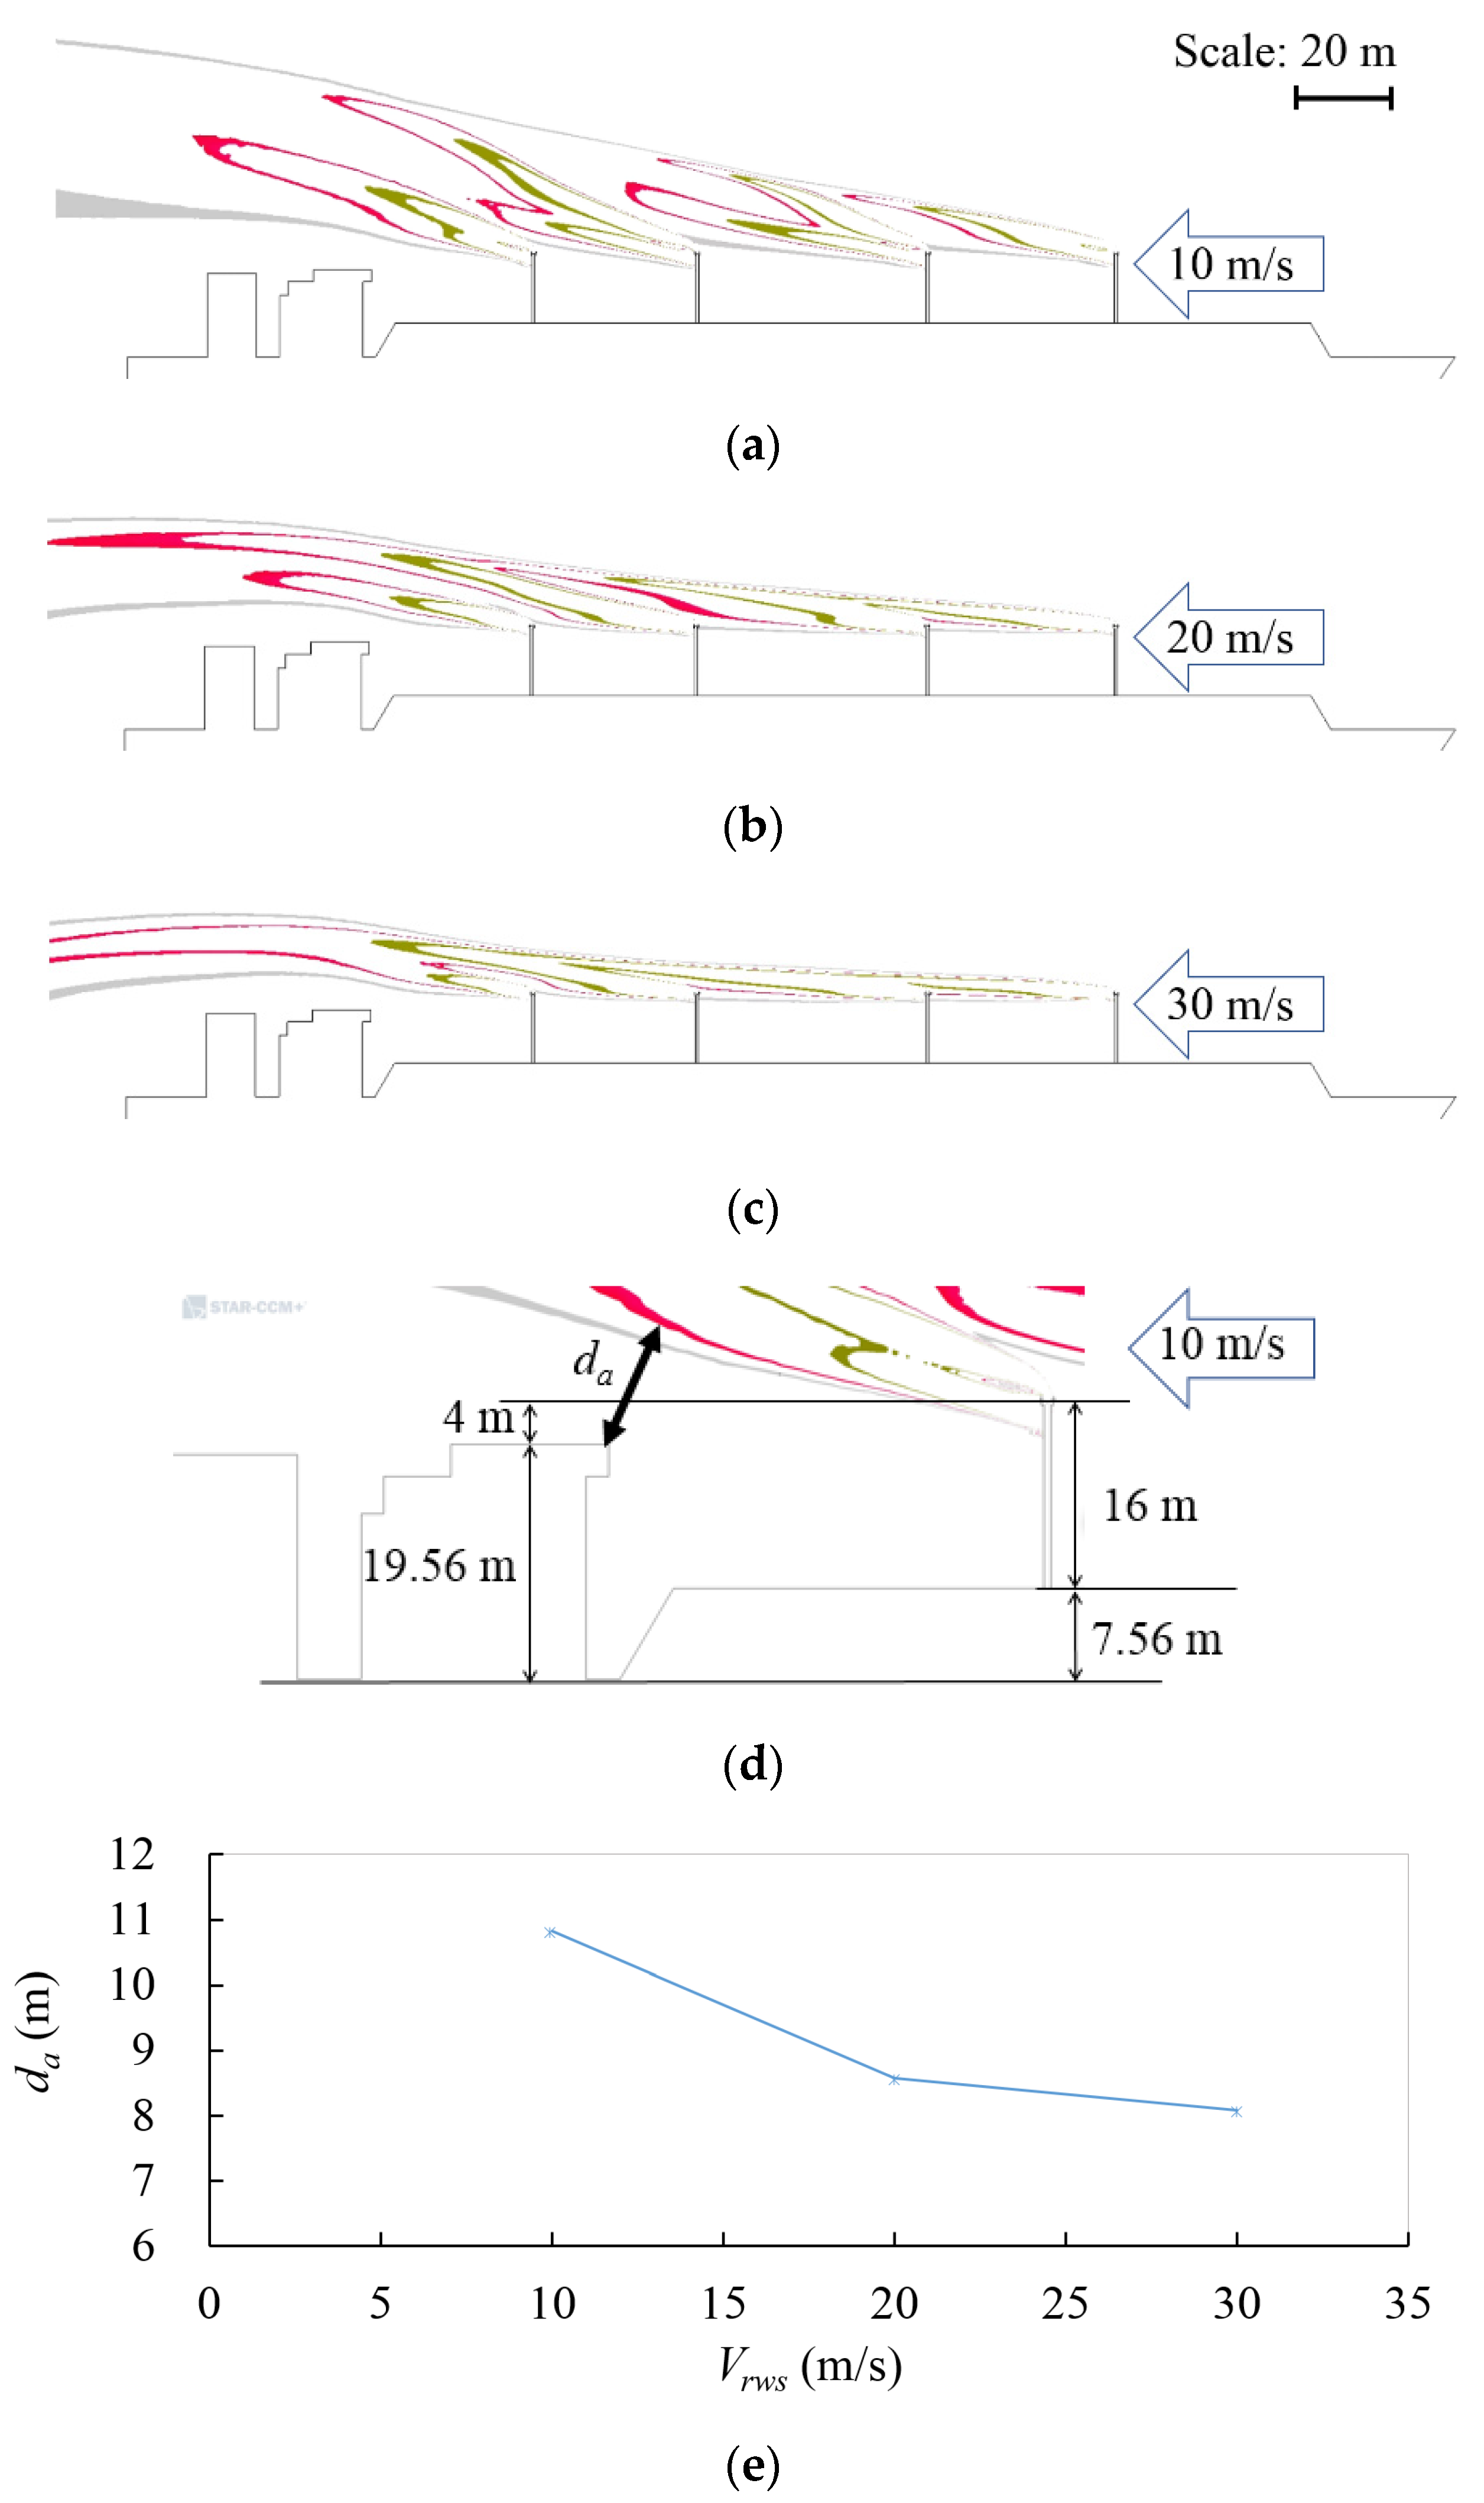
3.1. Relative Wind Speed
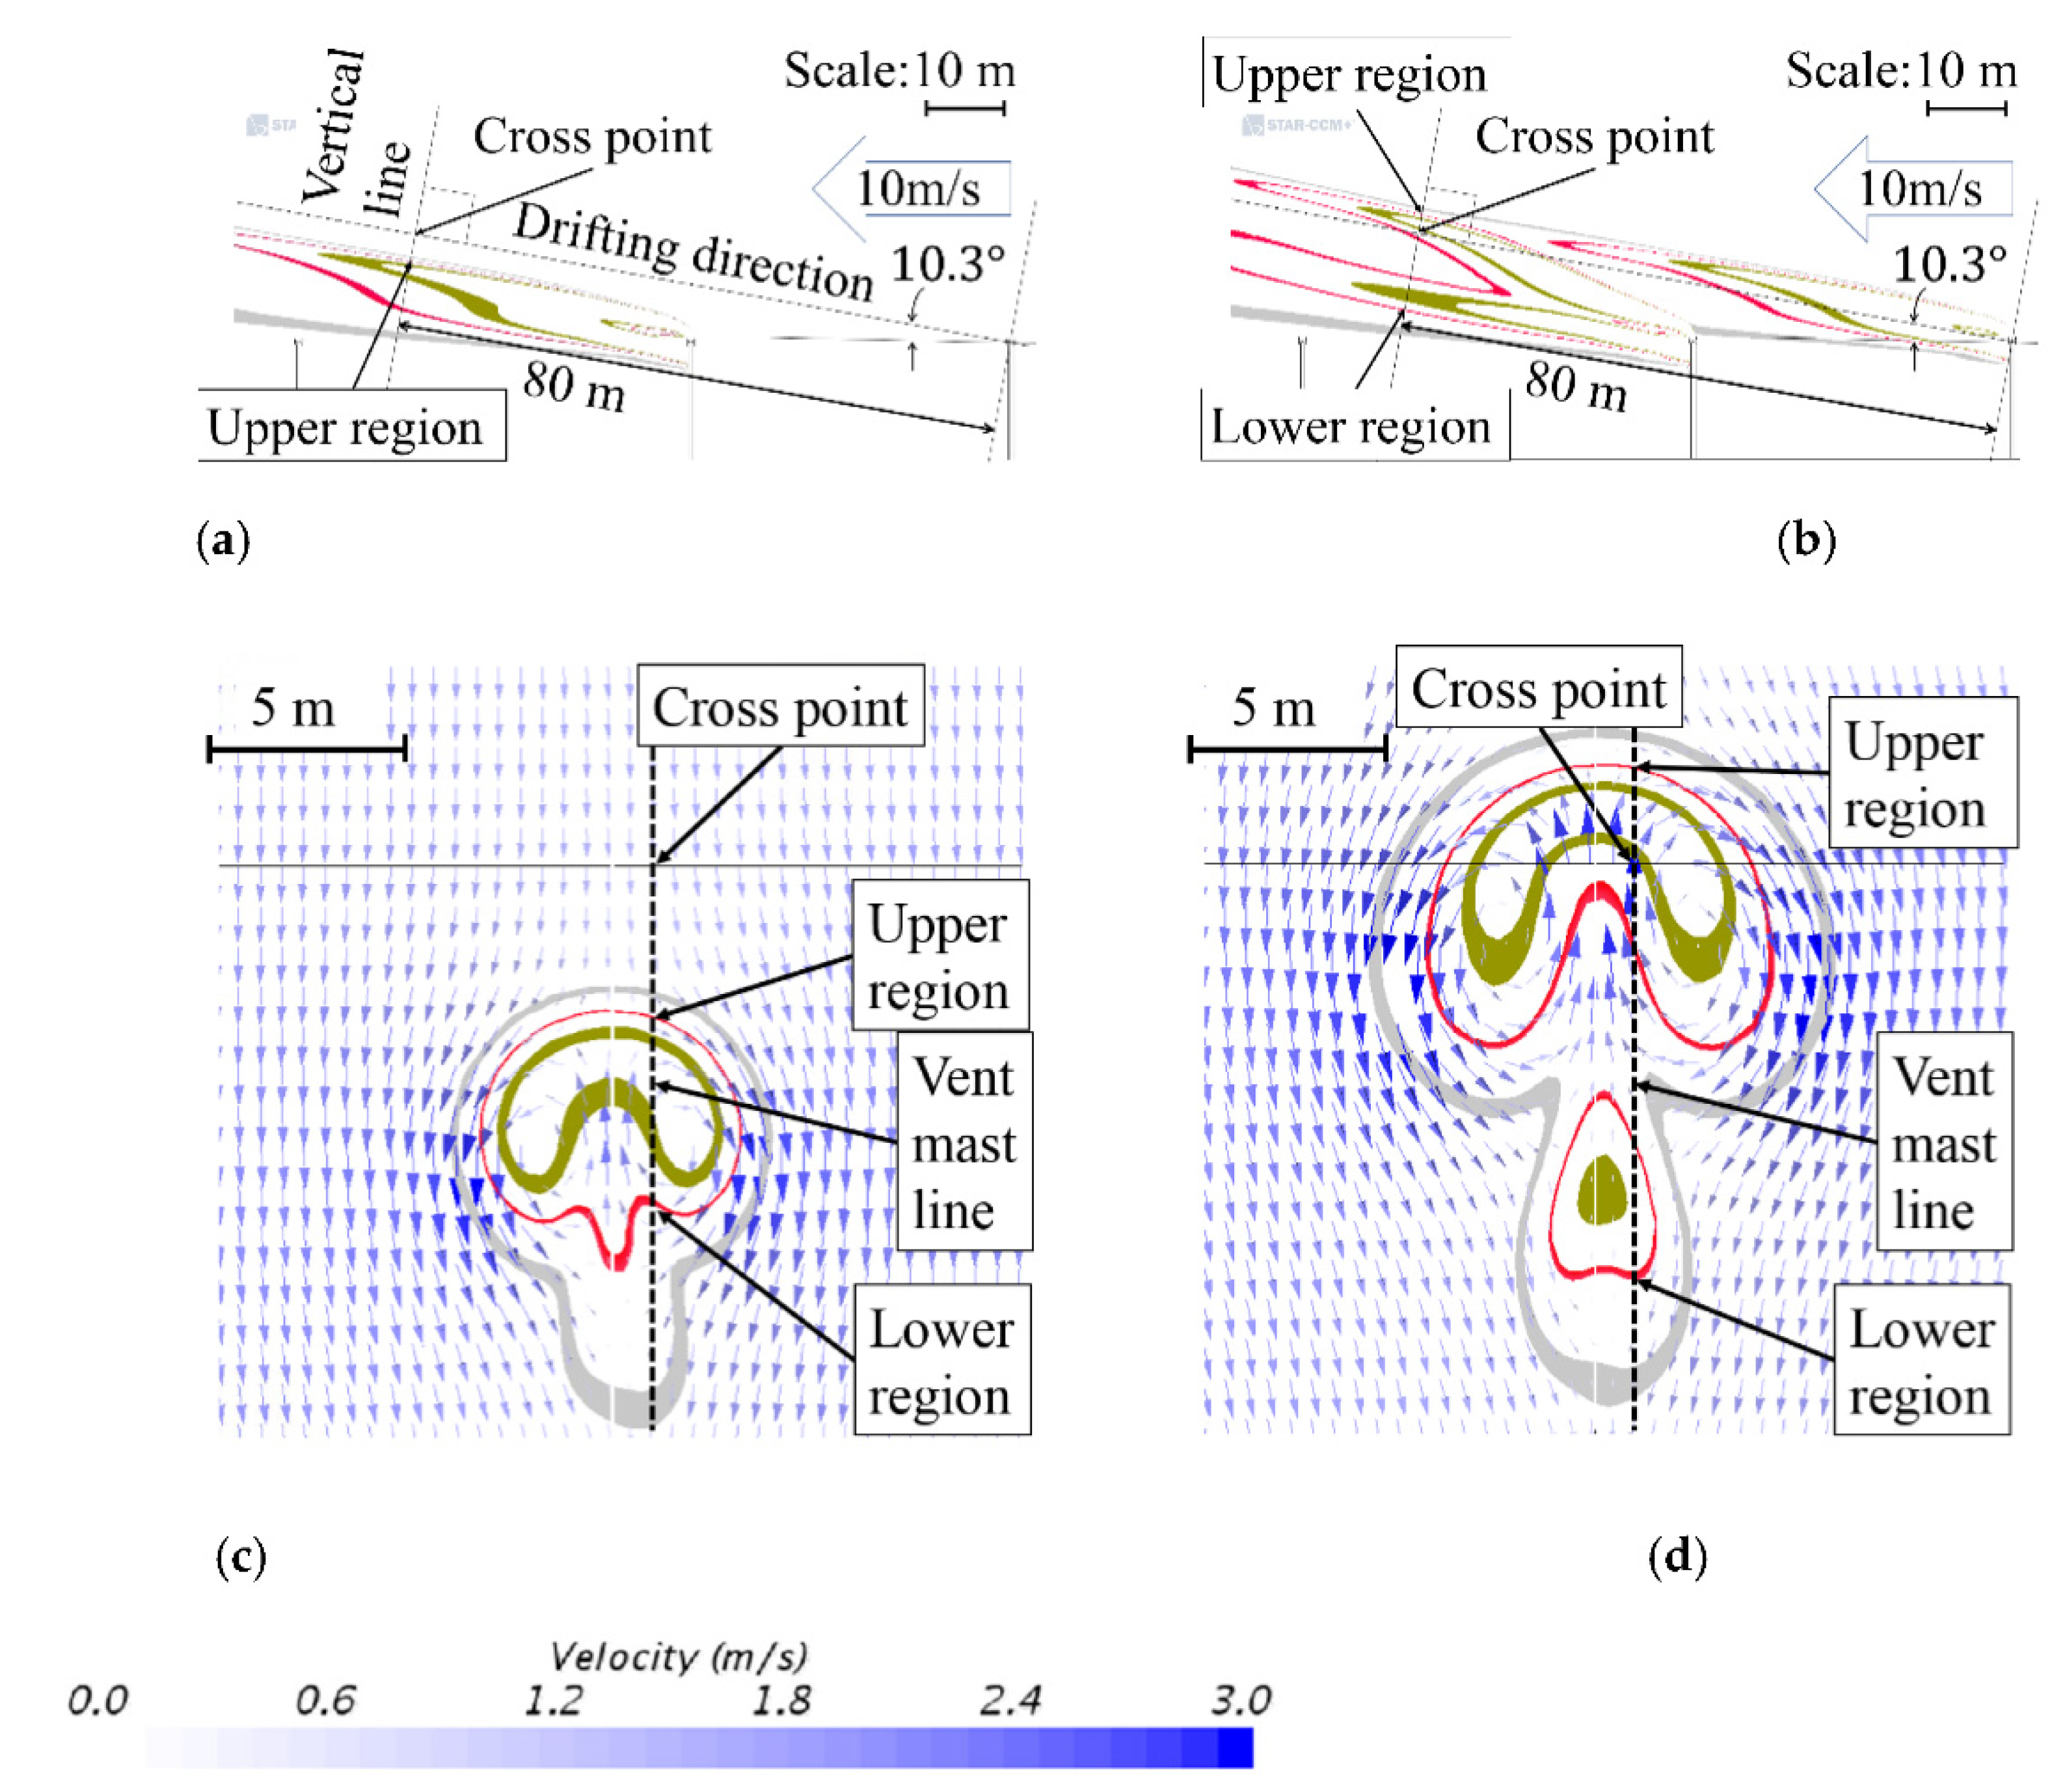
3.2. Arrangement of Vent Masts
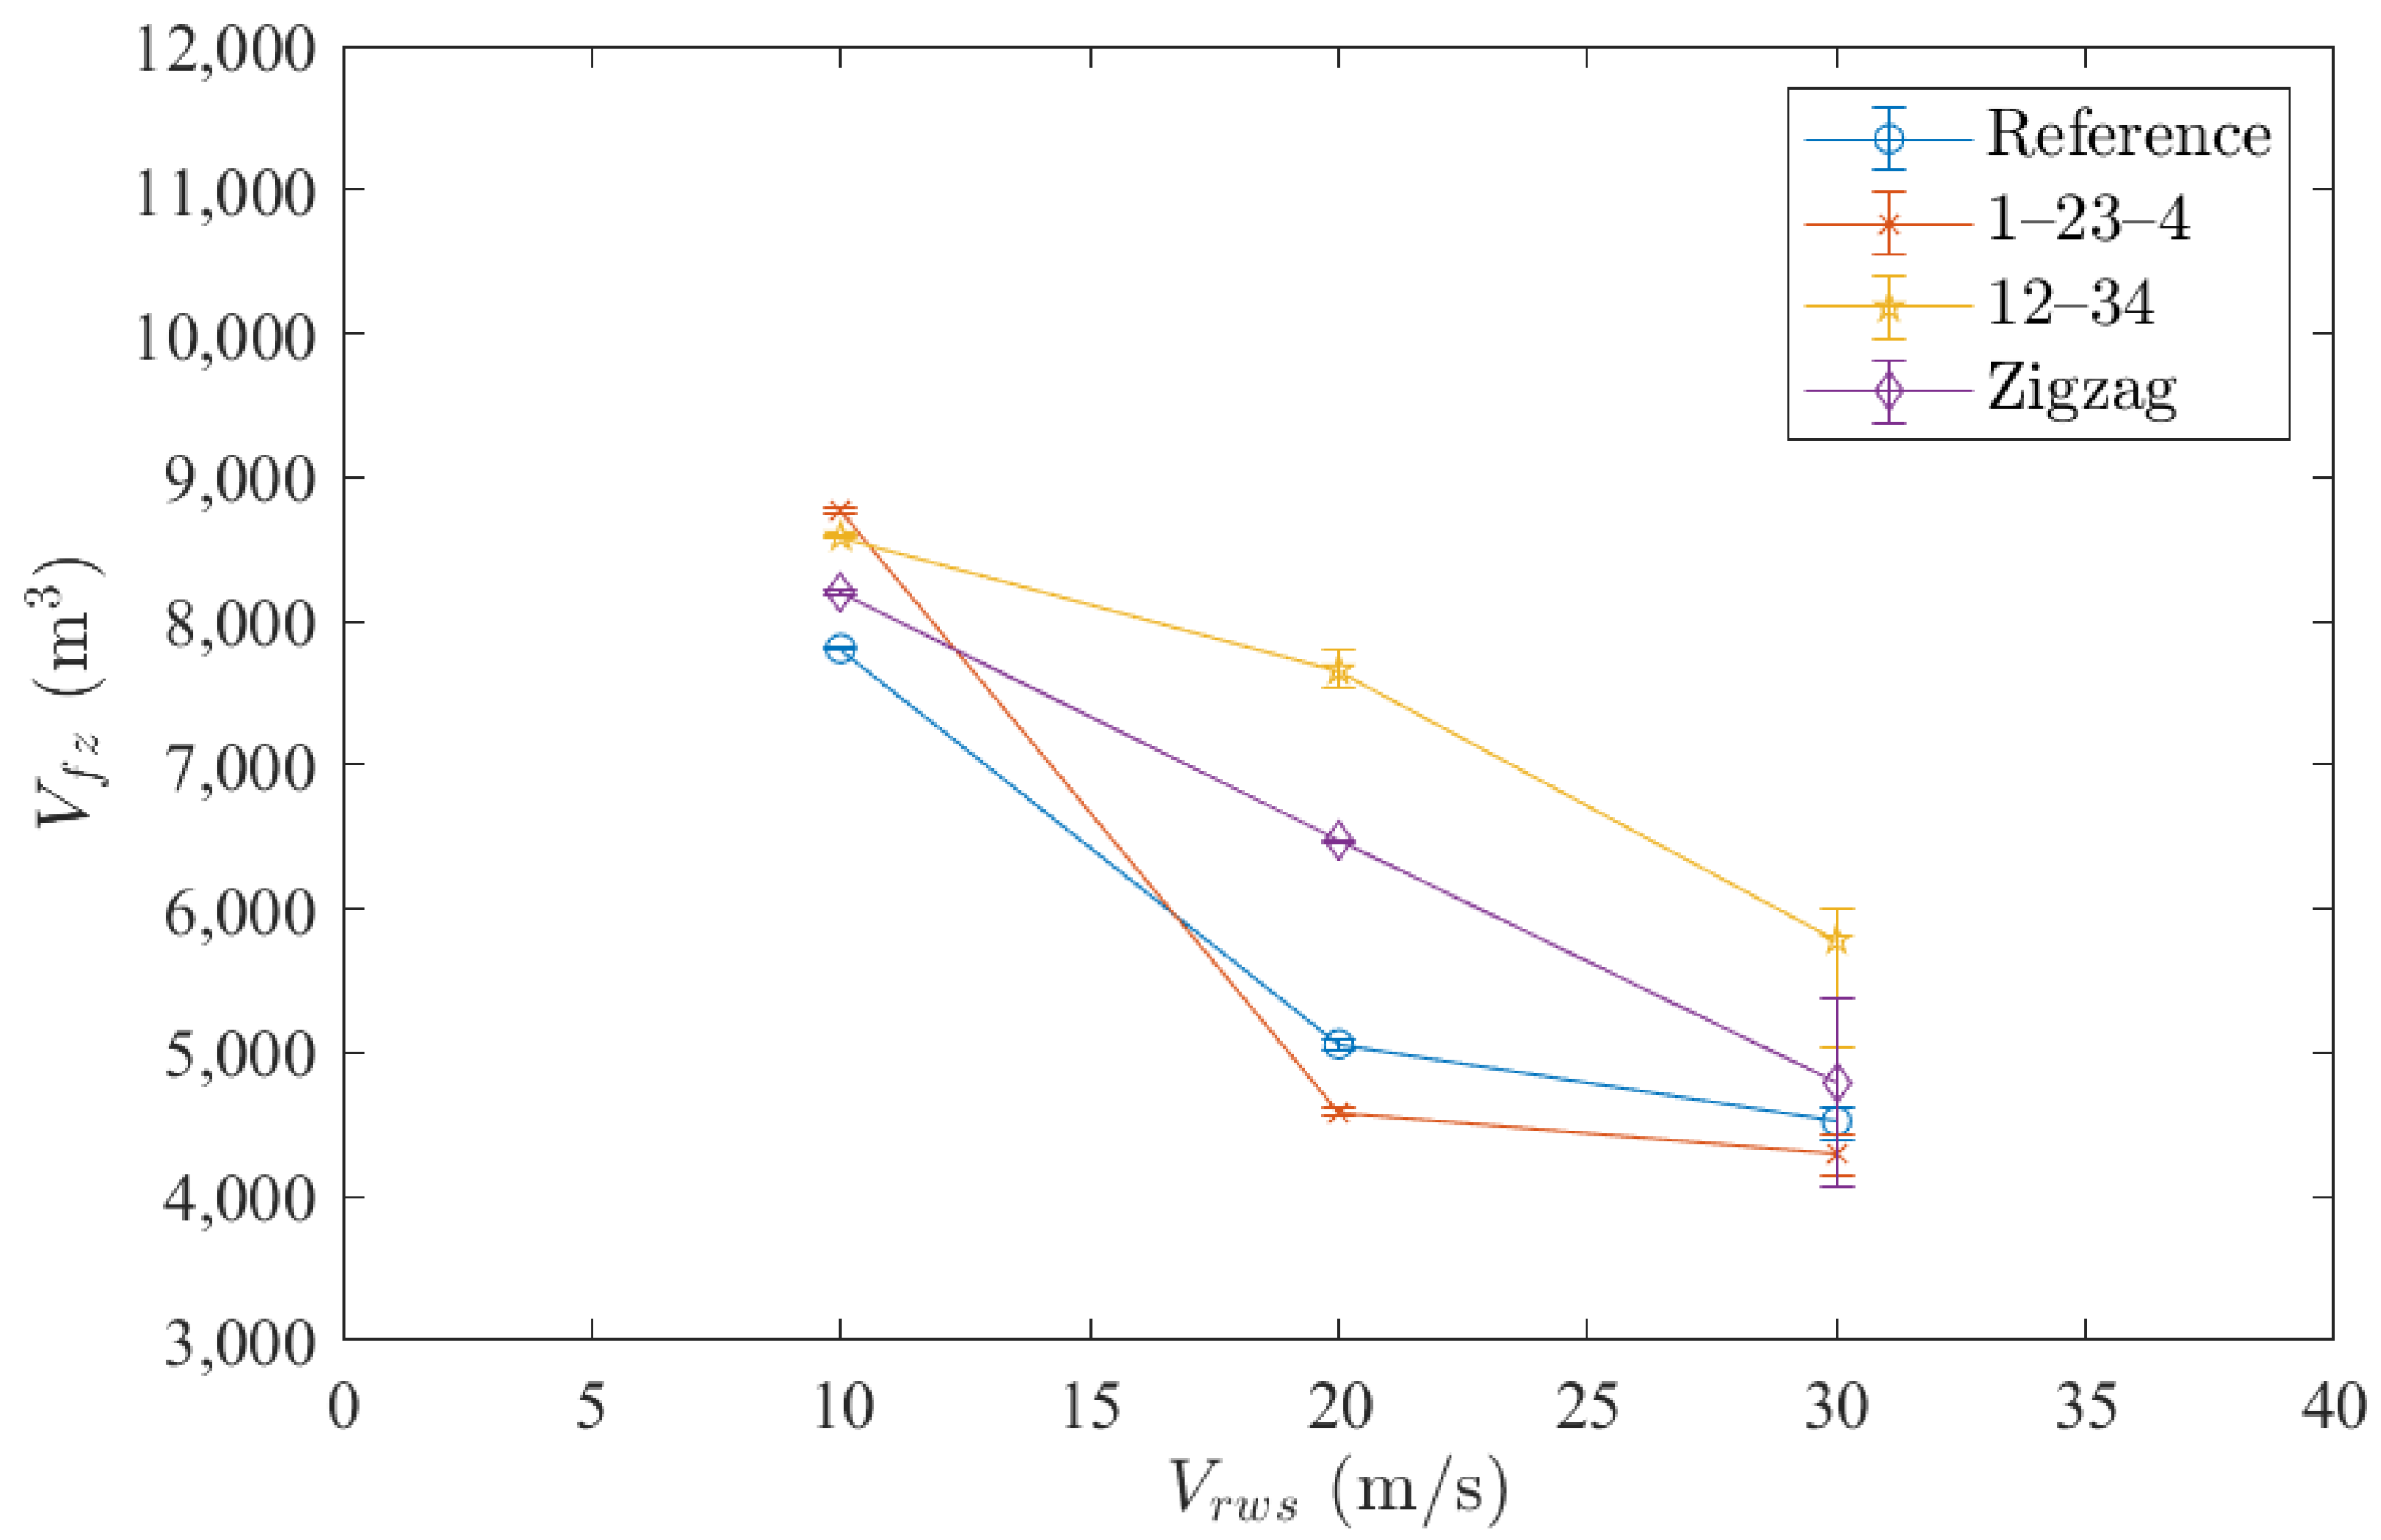
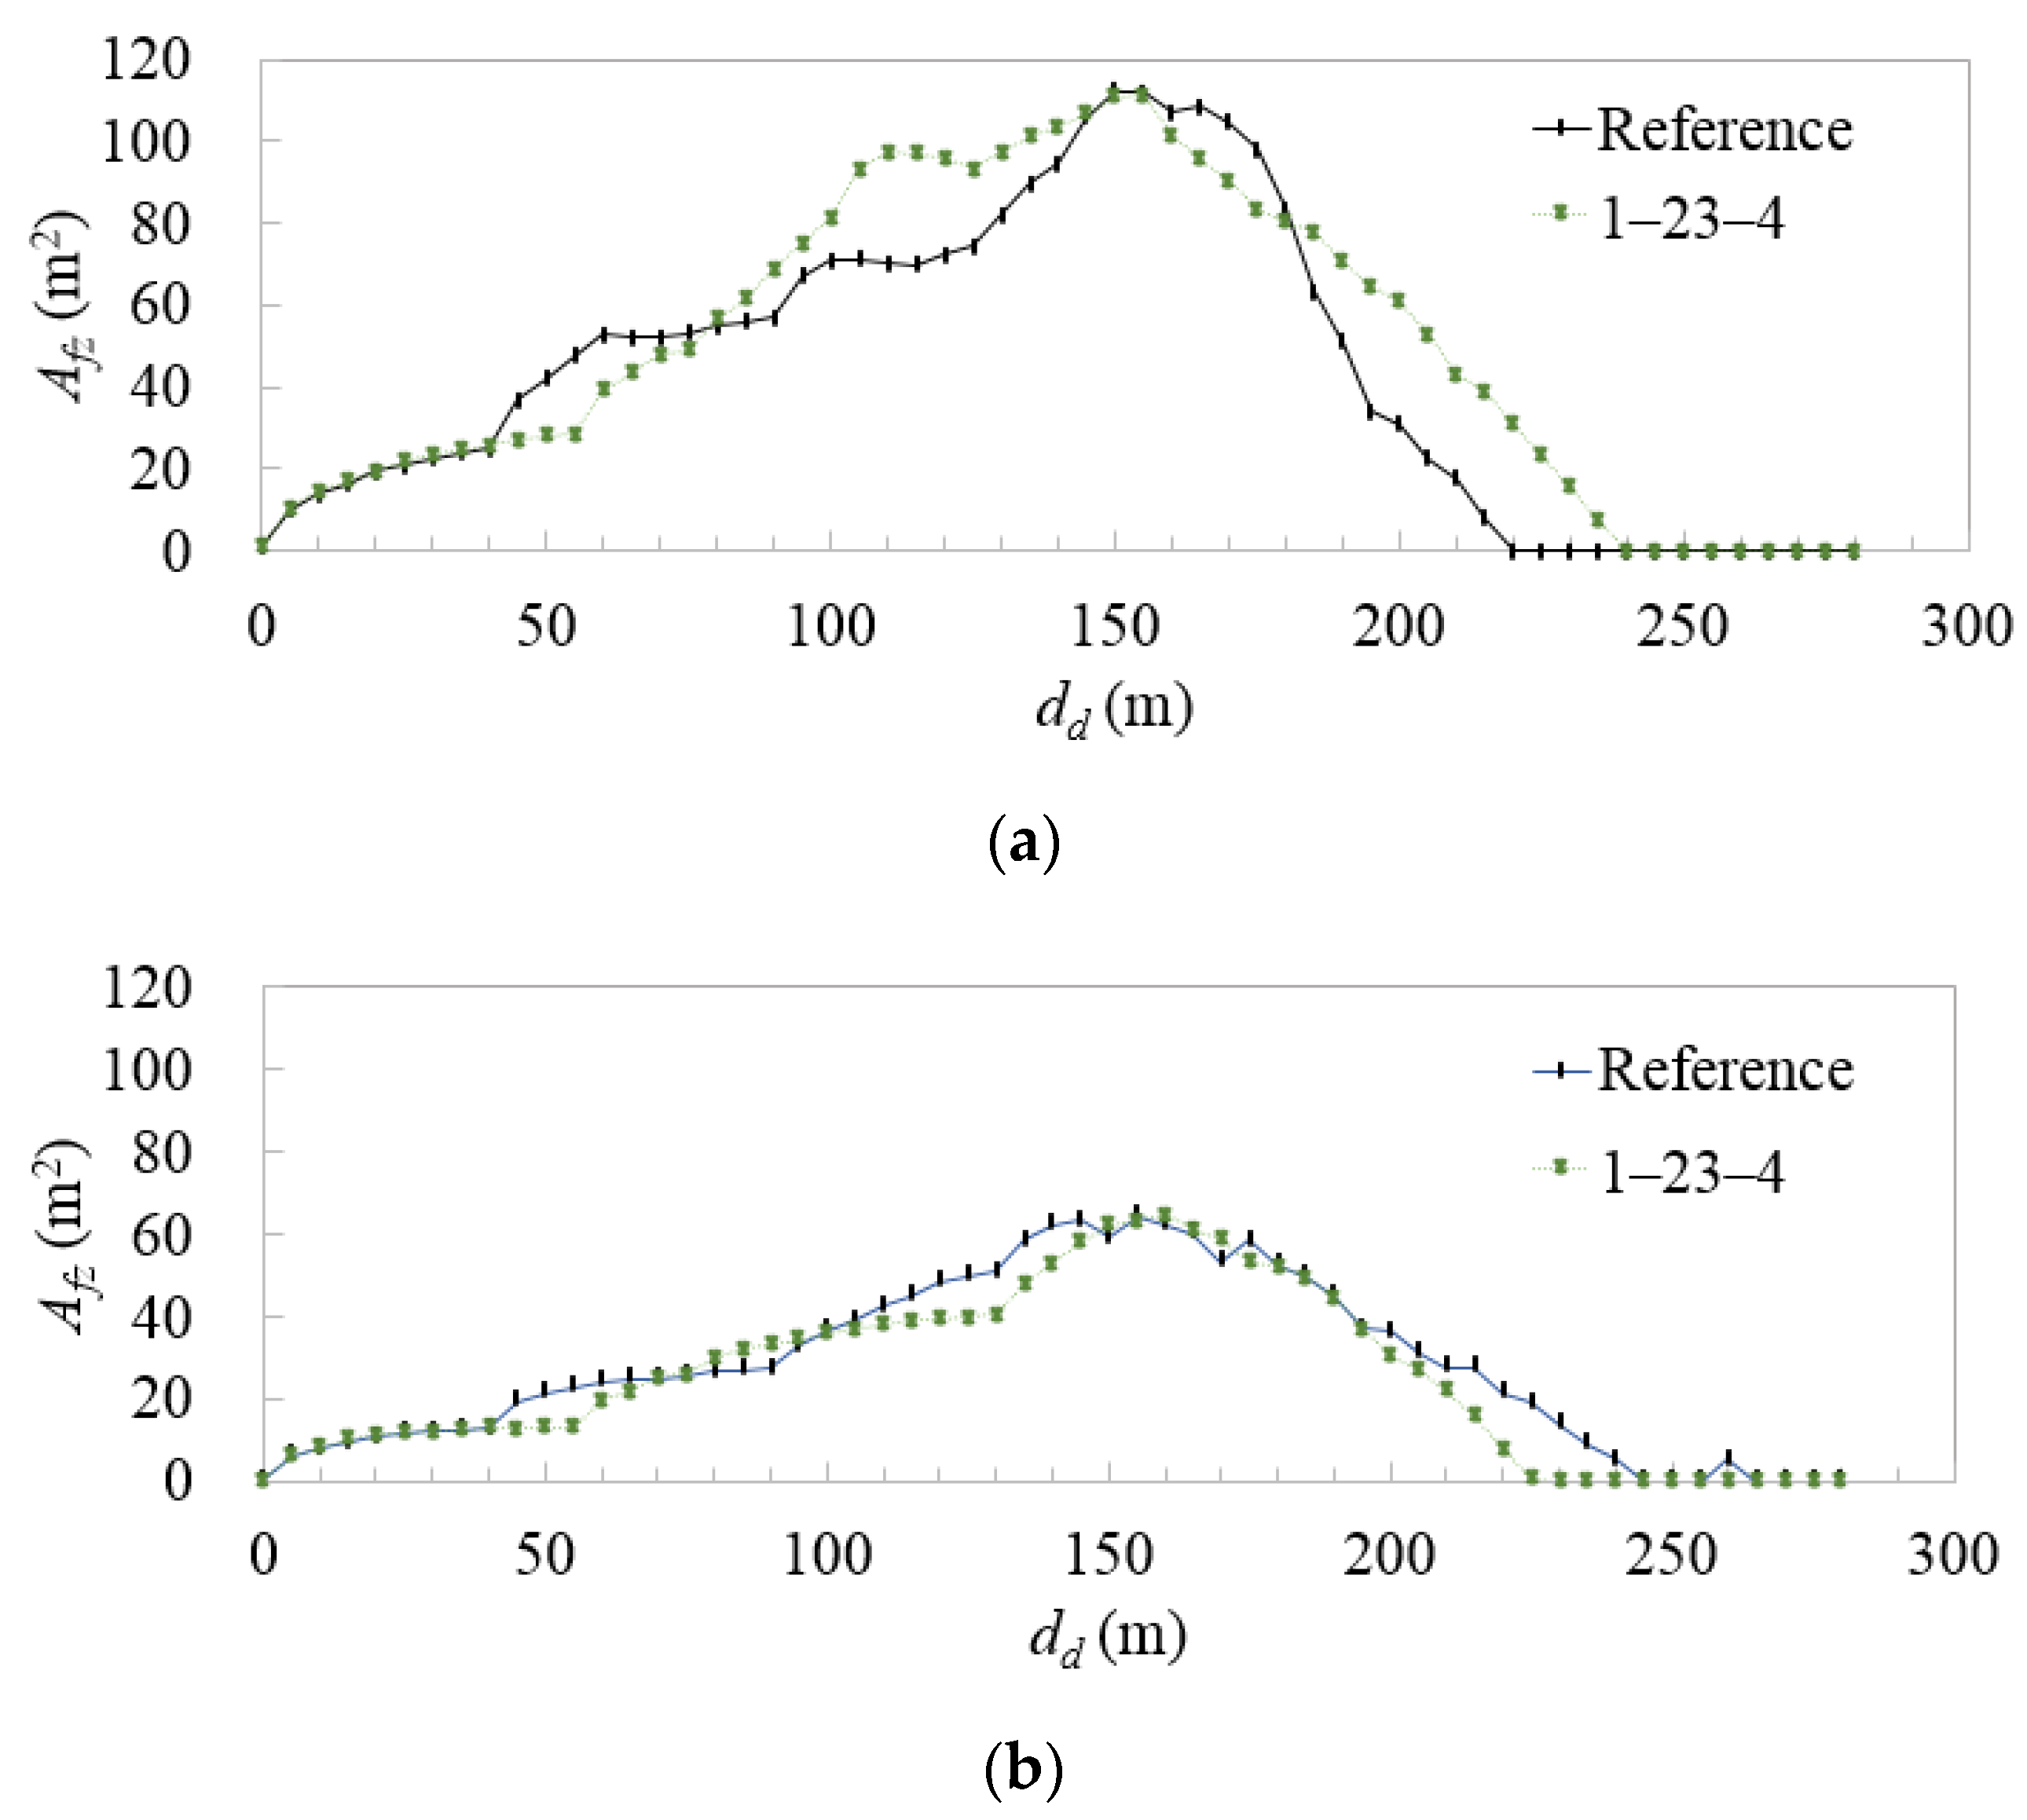
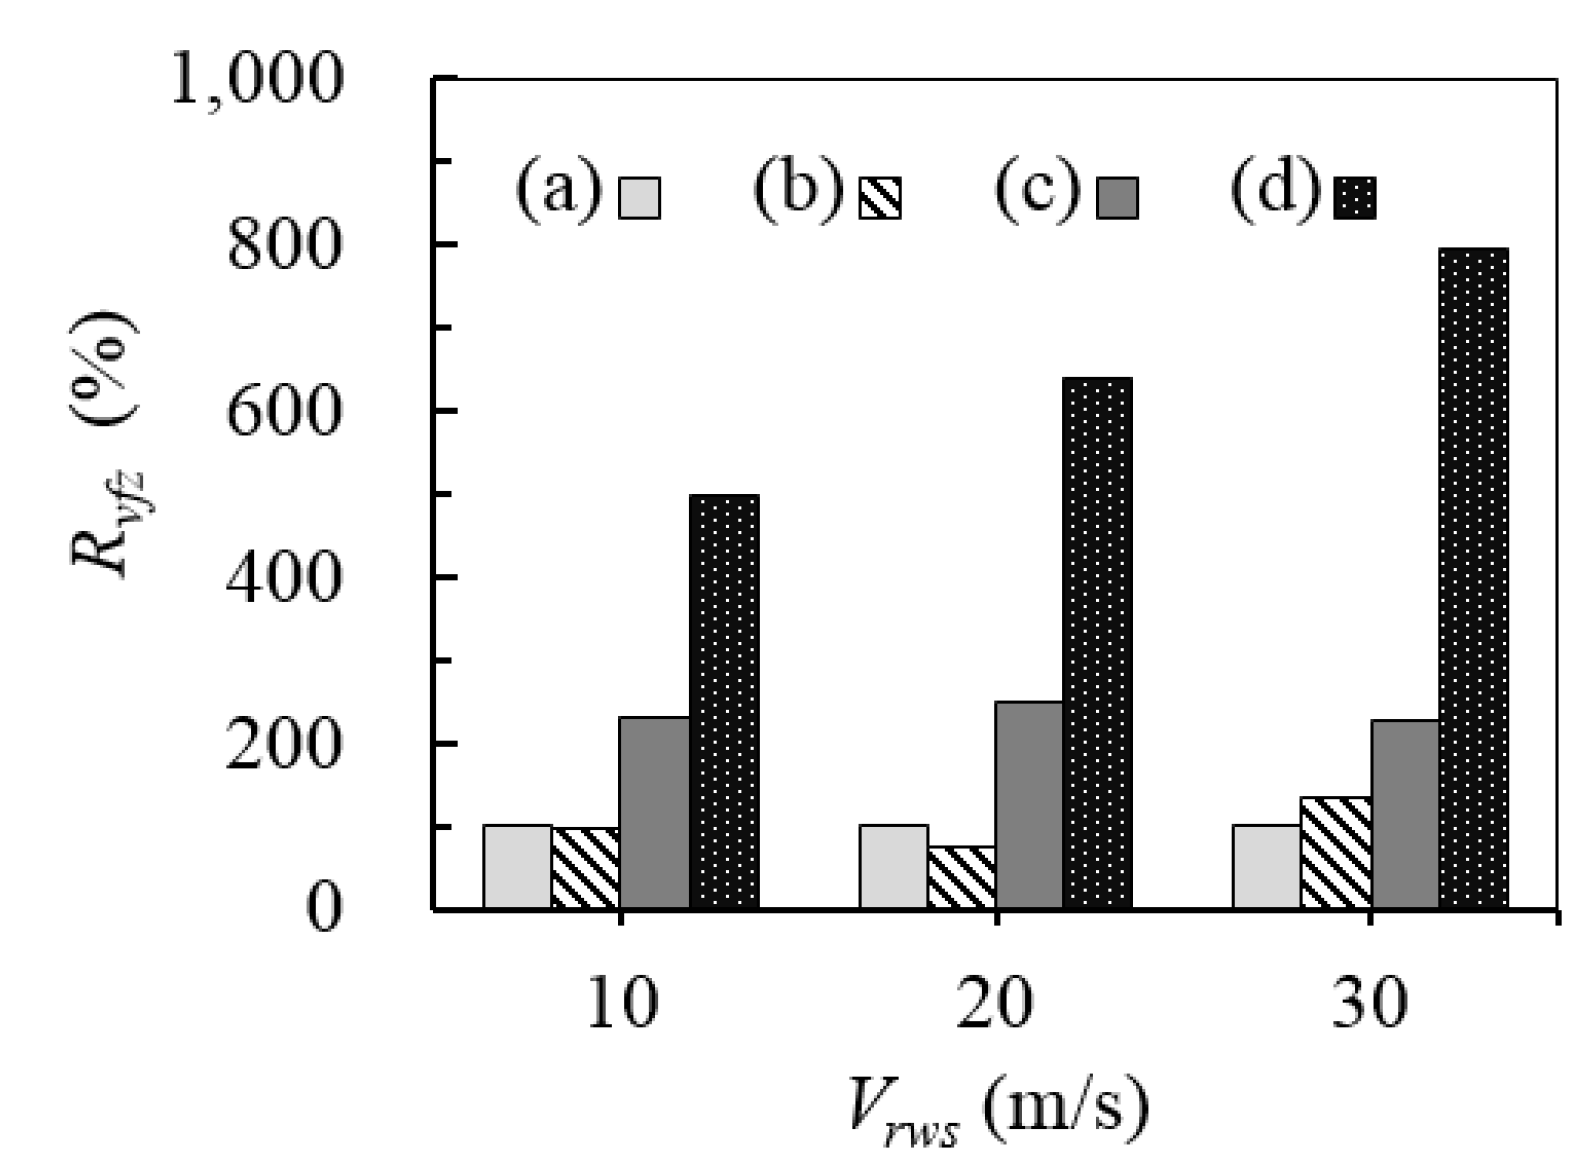
3.3. Combination of Emission Patterns Selected among the Four Vent Masts
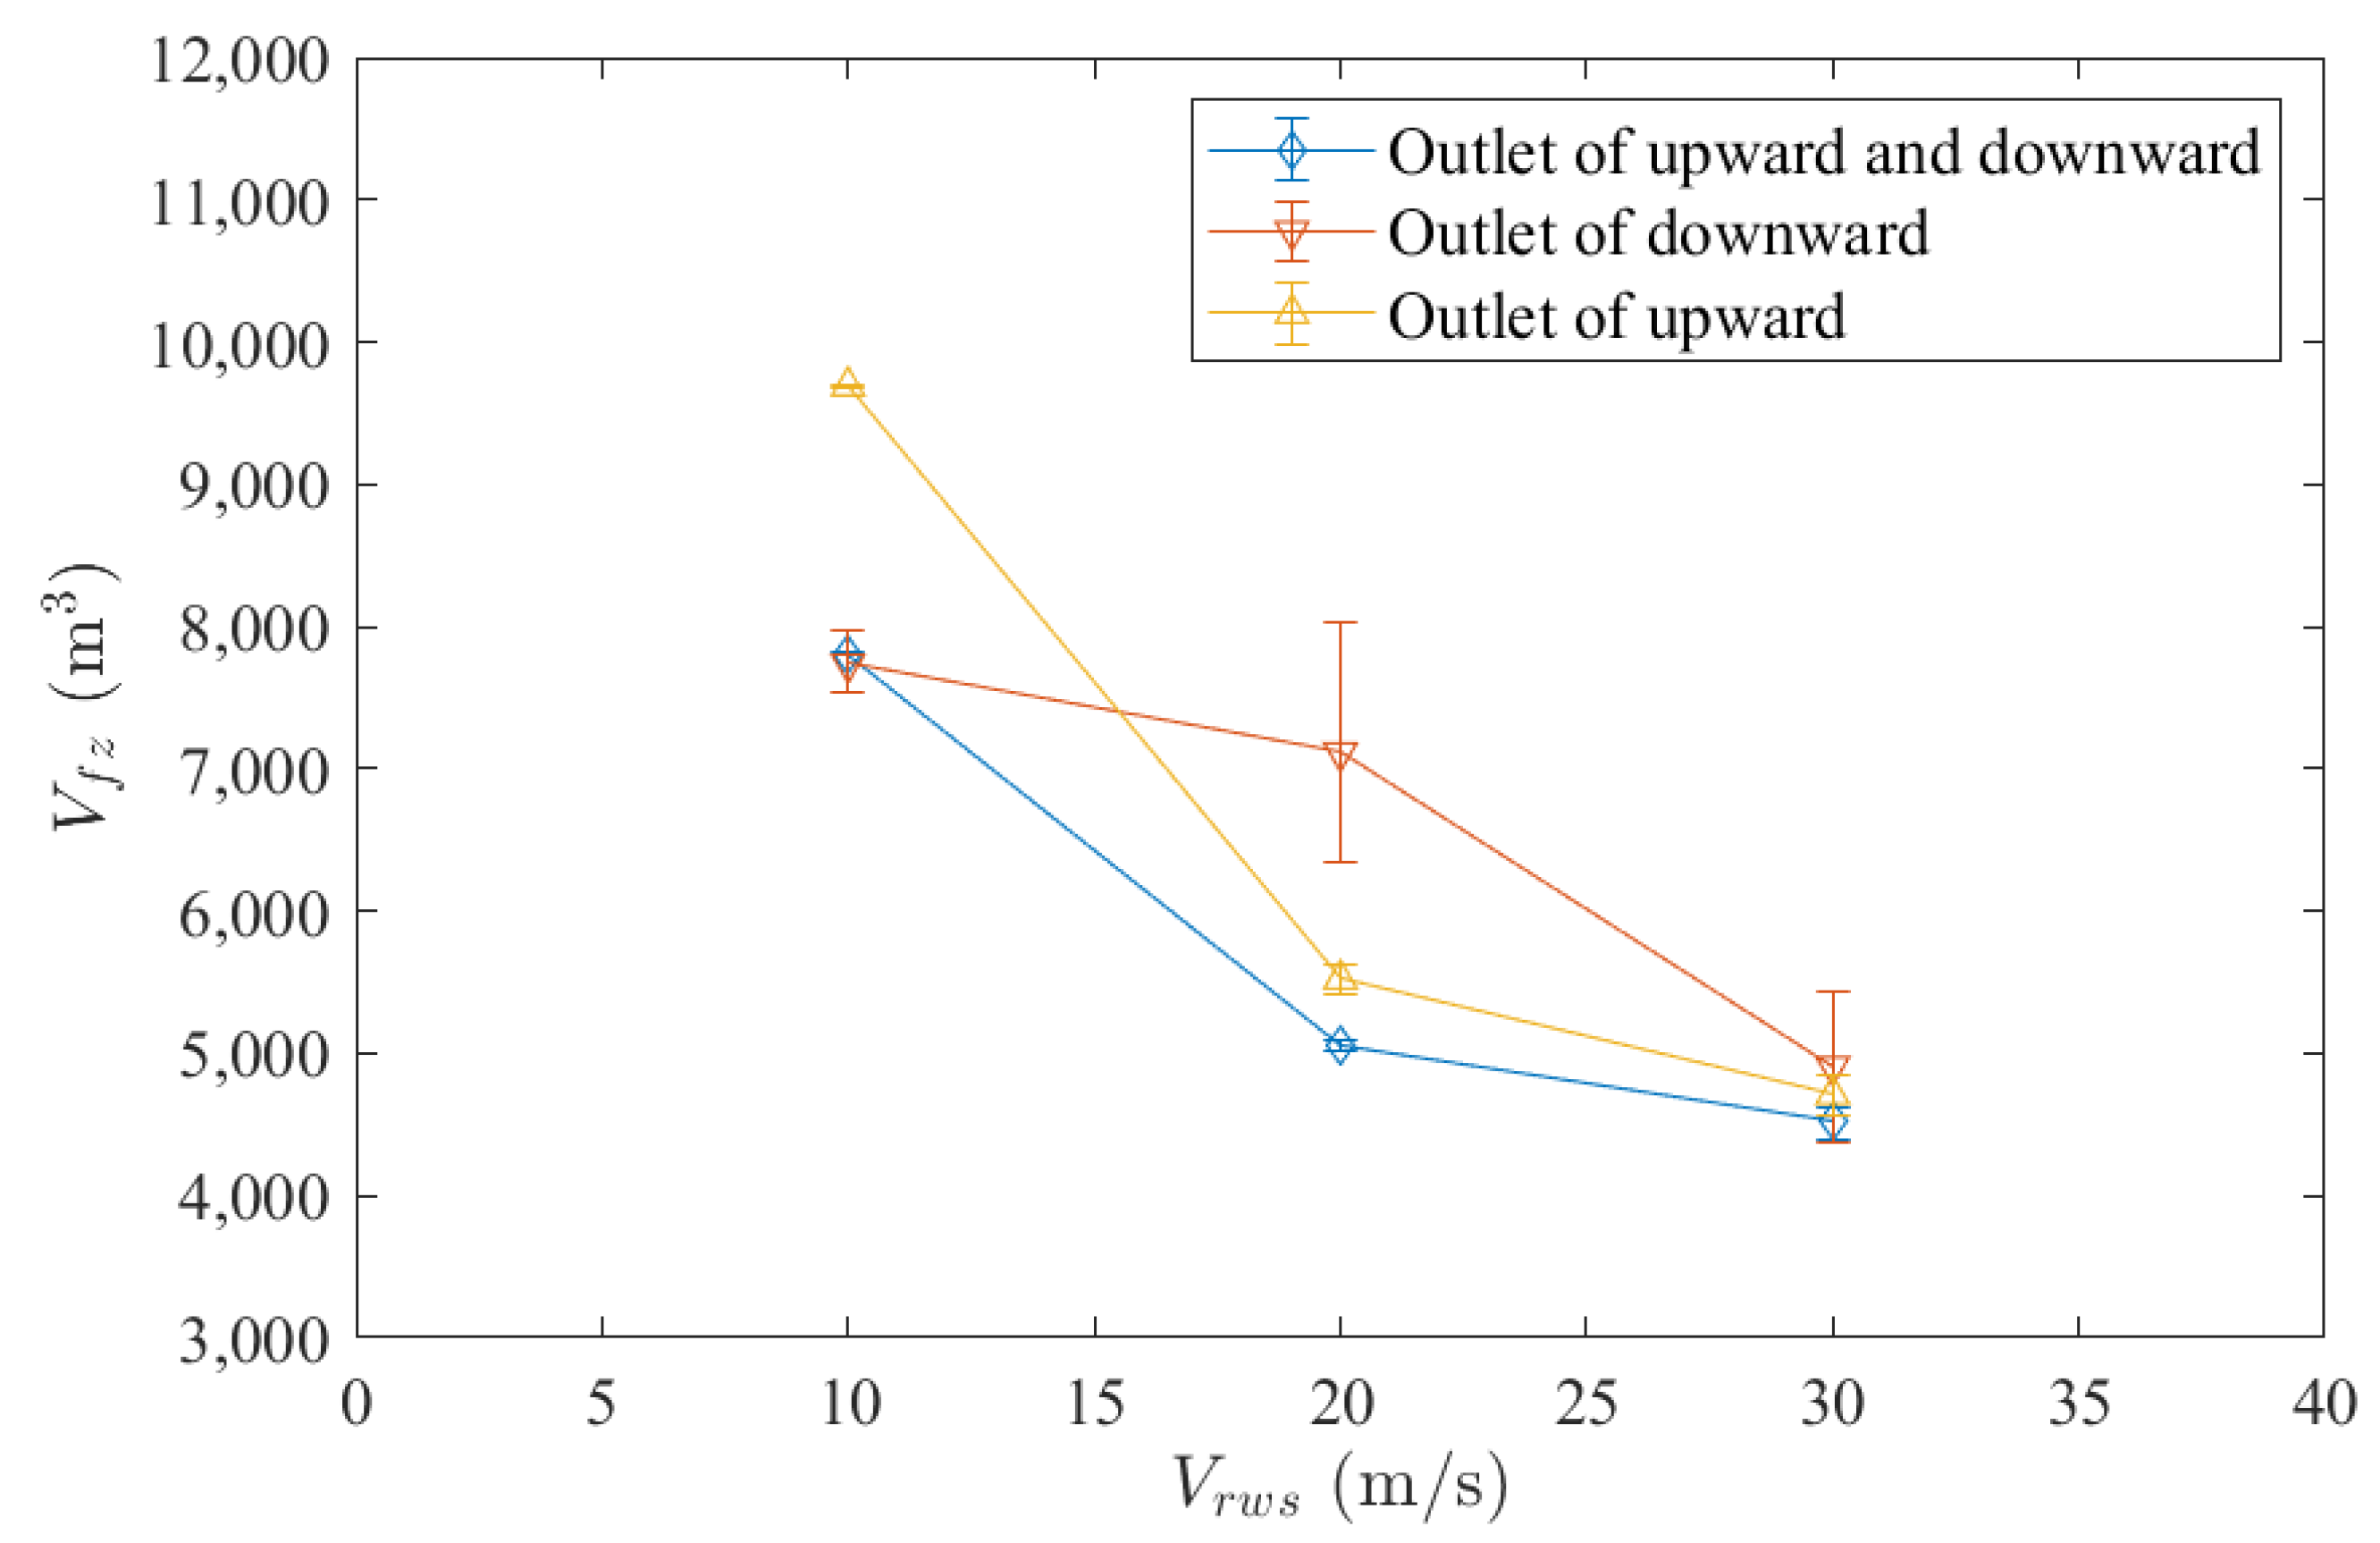
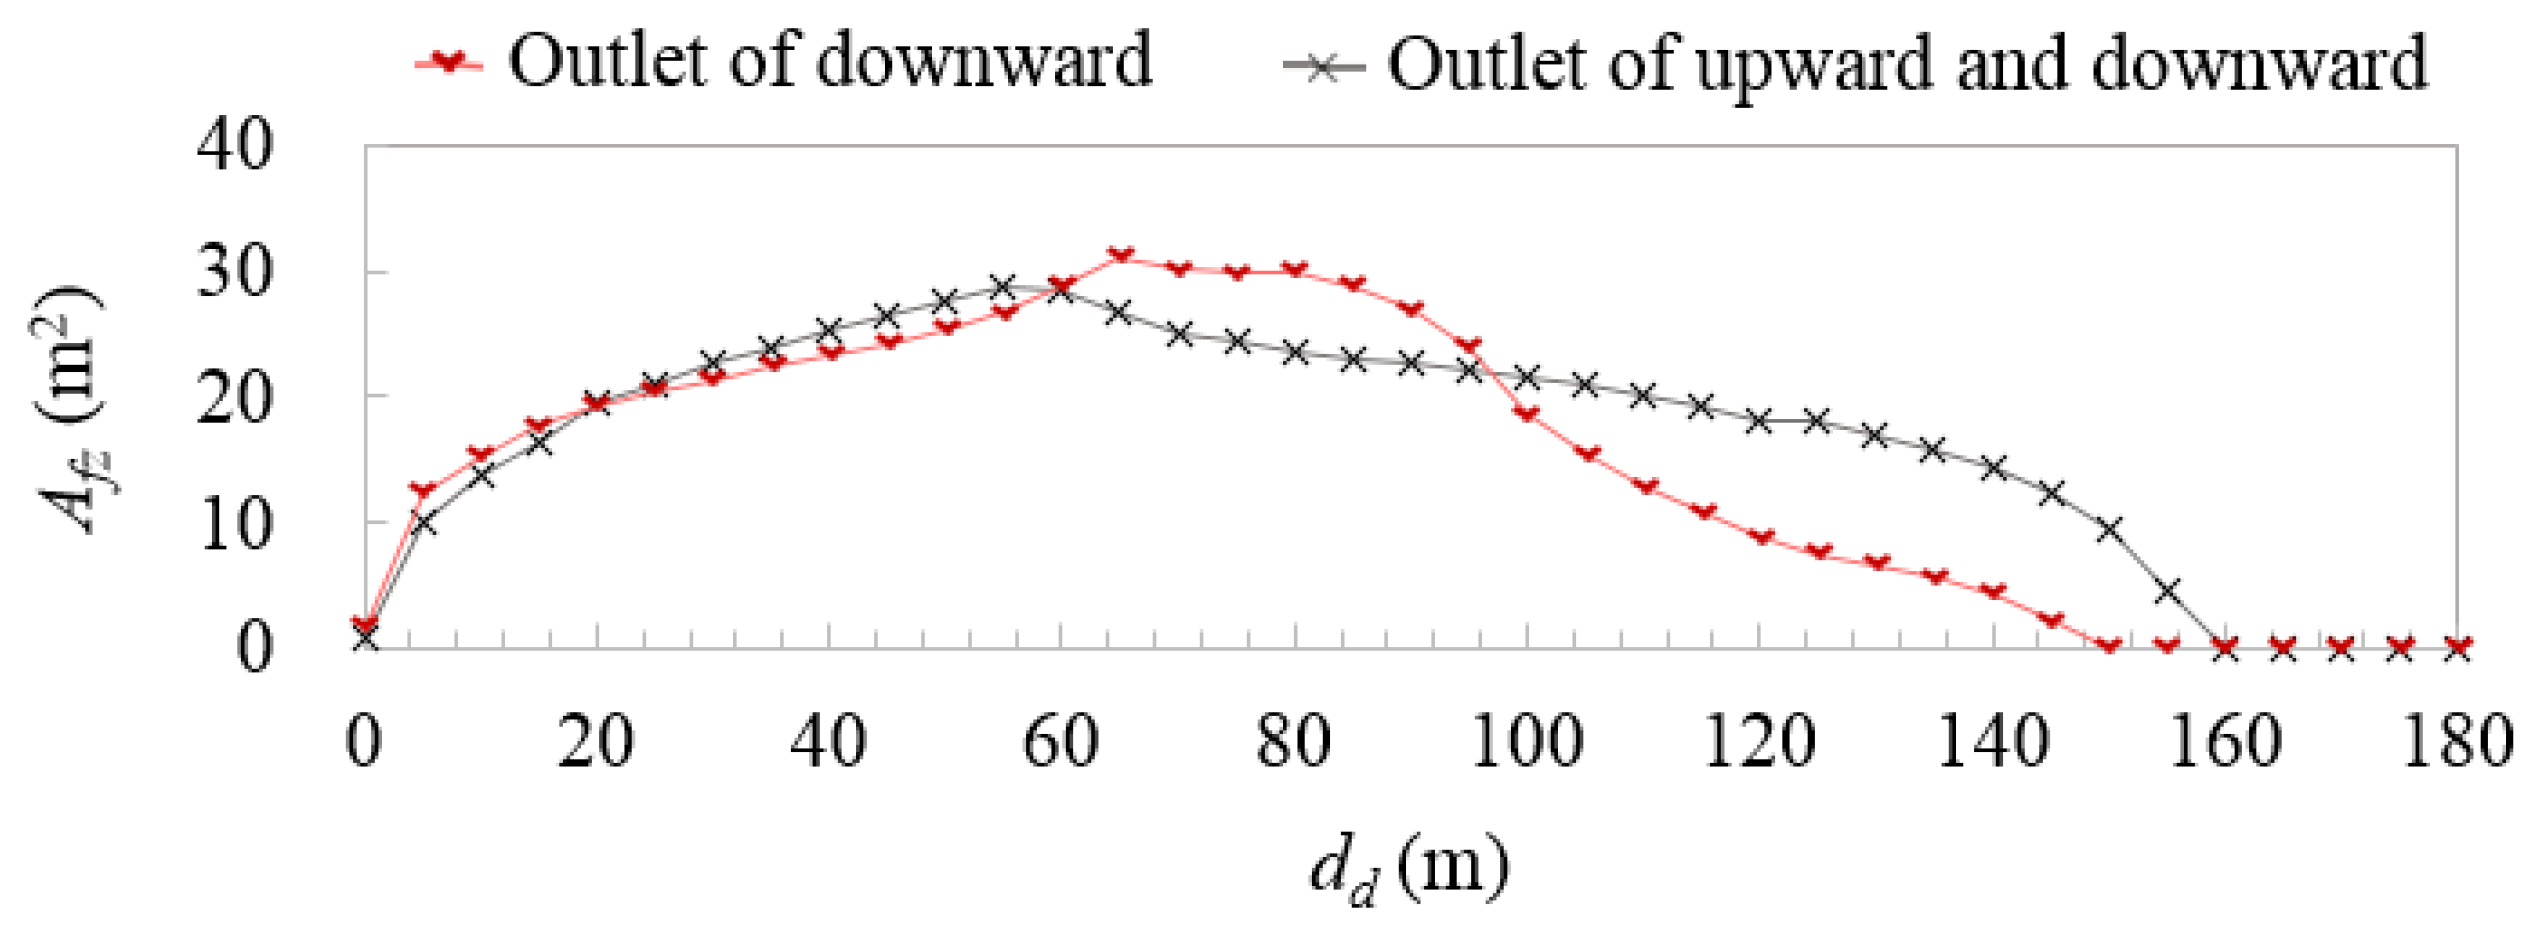
3.4. Direction of Emission from the Vent-Mast Outlet
4. Conclusions
Author Contributions
Funding
Institutional Review Board Statement
Informed Consent Statement
Conflicts of Interest
Abbreviations
| 3D | Three dimensional |
| A1 | Estimated surface area of the first tank (m2) |
| A2 | Estimated surface area of the second tank (m2) |
| Afz | Section area of flammable zone (m2) |
| CFD | Computational fluid dynamics |
| D | A constant coefficient based on a relation of specific heats k |
| DLWL | Design load water line |
| DWT | Dead weight tonnage (dwt) |
| da | The approximate minimum distance of the flammable area from the steer room at the cross section of vent mast line as criterion (m) |
| dd | Drifting distance from the first vent mast (m) |
| F | Fire exposure factor for membrane-type liquefied gas tank |
| FL | The flammability limits defined by the volume fraction of hydrogen |
| FZ | The zone is a flammable zone in which the volume fraction of hydrogen is between the lower flammability limits (4%) and upper flammability limits (75%) |
| g | Gravitational acceleration (m/s2) |
| G | Gas factor |
| GHG | Greenhouse gases |
| h | Height from DLWL (m) |
| IMO | International Maritime Organization |
| k–ε | k–epsilon turbulence model |
| kH2 | Specific heat ratio of hydrogen |
| L | Latent heat of parahydrogen at the normal boiling point (20.25 K) (kJ/kg) |
| LFL | Lower flammability limit |
| LH2 | Liquefied hydrogen |
| LNG | Liquefied natural gas |
| mH2,i | Estimated minimum required discharging mass flow rate of boiled hydrogen from the ith tank (kg/s) |
| MH2 | Molecular weight of hydrogen (kg/kmol) |
| Ng | Total numbers of grid for computational domain (Million) |
| Patm | Standard atmospheric pressure (Pa) |
| Ph | Pressure of computational domain at the height from DLWL (Pa) |
| Qi | Estimated minimum required discharging flow rate of boiled gas from the ith tank (m3/s) |
| RH | Relative humidity ratio (%) |
| Rvfz | Relative ratio of volume of flammable zone with the scenario of emission from the first vent mast alone (%) |
| Trel | Temperature at relieving conditions; The boiled gas is assumed to be heated more 32.9 K at relieving conditions (K) |
| UFL | Upper flammability limit |
| Vfz,1 | The volume of flammable zone at the scenario of emission from the first vent mast alone (m3) |
| Vfz | Total volume of flammable zone (m3) |
| Vrws | Relative wind speed of air to the ship (m/s) |
| xdryair | Mass fraction of dry air at atmosphere; It was estimated from BERTSCH steam table at a temperature of 20 °C |
| xvapor | Mass fraction of vapor at atmosphere; It was estimated from BERTSCH steam table at a temperature of 20 °C |
| Z | Compressibility factor of hydrogen; Boiled hydrogen is regarded as an ideal gas |
| μair | Viscosity of air (Pa · s) |
| μH2 | Viscosity of hydrogen (Pa · s) |
| μvapor | Viscosity of vapor (Pa · s) |
| ρair | Density of air at approximately 20.5 °C, 1 atm (kg/m3) |
| ρH2 | Density of hydrogen at approximately 16 °C, 1 atm (kg/m3) |
| ρatm | Density of atmospheric air at computational domain (kg/m3) |
| ρref | Reference density of air at computational domain (kg/m3) |
| ρvapor | Density of vapor; It corresponds to a temperature of approximately 20 °C, 1 atm, if it is considered as an ideal gas (kg/m3) |
| air | Air |
| dryair | Dry air |
| H2 | Hydrogen |
| i | Index number for tanks or vent masts |
| rel | Relieving condition |
| vapor | Vapor |
References
- Pulgar-Vida, M. Report of the Conference of the Parties on Its Twenty-First Session, Held in Paris from 30 November to 13 December 2015: Addendum. Part Two: Action Taken by the Conference of the Parties at Its Twenty-First Session; United Nations Framework Convention on Climate Change Bonn: Bonn, Germany, 2015. [Google Scholar]
- Saito, H. Initial IMO Strategy on Reduction of GHG Emissions from Ships; Resolution MEPC.304(72); IMO: London, UK, 2018. [Google Scholar]
- Adamchak, F.; Adede, A. LNG as marine fuel. In Proceedings of the 17th International Conference and Exhibition of Liquefied Natural Gas, Houston, TX, USA, 16–19 April 2013. [Google Scholar]
- Olmer, N.; Comer, B.; Roy, B.; Mao, X.; Rutherford, D. Greenhouse Gas Emissions from Global Shipping, 2013–2015 Detailed Methodology; International Council on Clean Transportation: Washington, DC, USA, 2017; pp. 1–38. [Google Scholar]
- Breinholt, C. Adoption of the International Code of Safety for Ships Using Gases or Other Low-Flashpoint Fuels (IGF Code); Resolution MSC.391(95); IMO: London, UK, 2015. [Google Scholar]
- Markowski, J.; Pielecha, I. The potential of fuel cells as a drive source of maritime transport. IOP Conf. Ser. Earth Environ. Sci. 2019, 214, 012019. [Google Scholar] [CrossRef]
- New Energy and Industrial Technology Development Organization (NEDO). Development of Technologies for Realizing Hydrogen Society. Available online: https://www.nedo.go.jp/english/activities/activities_ZZJP_100096.html (accessed on 14 November 2021).
- CO2-Free Hydrogen Energy Supply-Chain technology Research Association (HyStra), Hydrogen Energy Supply Chain Pilot Project between Australia and Japan. Available online: http://www.hystra.or.jp/en/project/ (accessed on 14 November 2021).
- Lee, H.; Shao, Y.; Lee, S.; Roh, G.; Chun, K.; Kang, H. Analysis and assessment of partial re-liquefaction system for liquefied hydrogen tankers using liquefied natural gas (LNG) and H2 hybrid propulsion. Int. J. Hydrog. Energy 2019, 44, 15056–15071. [Google Scholar] [CrossRef]
- International Maritime Organization. International Code for the Construction and Equipment of Ships Carrying Liquefied Gases in Bulk (IGC Code); IMO Publishing: London, UK, 2016; pp. 103–108. [Google Scholar]
- Roh, G.; Na, Y.; Park, J.-Y.; Kim, H. Analysis of Internal Gas Leaks in an MCFC System Package for an LNG-Fueled Ship. Appl. Sci. 2019, 9, 2330. [Google Scholar] [CrossRef] [Green Version]
- Kim, J.-H.; Doh, D.-H.; Choi, B.C. Evaluation of the ventilation safety requirements for the fuel gas supply system room of a gas-fueled vessel: Simulated leaks of methane and propane. J. Mech. Sci. Technol. 2018, 32, 5521–5532. [Google Scholar] [CrossRef]
- Doh, D.-H.; Chun, K.W.; Ninomiya, N.; Choi, B.C. A swirl static mixer with diluent for reducing the flammable extent of venting gases in a low-flashpoint fueled vessel. J. Mech. Sci. Technol. 2019, 33, 3311–3321. [Google Scholar] [CrossRef]
- Blaylock, M.; Pratt, J.; Bran-Anleau, G.; Proctor, C. Informing Hazardous Zones for On-Board Maritime Hydrogen Liquid and Gas Systems; Sandia National Lab. (SNL-NM): Albuquerque, NM, USA, 2018. [Google Scholar]
- Kang, H.-K. An examination on the dispersion characteristics of boil-off gas in vent mast exit of membrane type LNG carriers. J. Korean Soc. Mar. Environ. Saf. 2013, 19, 225–231. [Google Scholar] [CrossRef] [Green Version]
- Hansen, O.R. Liquid hydrogen releases show dense gas behavior. Int. J. Hydrog. Energy 2020, 45, 1343–1358. [Google Scholar] [CrossRef]
- Cao, Y.; Jia, Q.-J.; Wang, S.-M.; Jiang, Y.; Bai, Y. Safety design analysis of a vent mast on an LNG powered ship during a low temperature combustible gas leakage accident. J. Ocean Eng. Sci. 2021. [Google Scholar] [CrossRef]
- Cornwell, J.B.; Johnson, D.W.; Martinsen, W.E. Relief Valves and Vents: How Exit Conditions Affect Hazard Zones. In Proceedings of the American Institute of Chemical Engineers 1990 Summer National Meeting, San Diego, CA, USA, 19–22 August 1990. [Google Scholar]
- Molland, A.F. The Maritime Engineering Reference Book: A Guide to Ship Design; Butterworth-Heinemann: Oxford, UK, 2008; pp. 52–56. [Google Scholar]
- Class, N.K. Guidelines for Liquefied Hydrogen Carriers; Class NK: Tokyo, Japan, 2017. [Google Scholar]
- White, F.M. Fluid Mechanics, in SI Units; McGraw-Hill: New York, NY, USA, 2011; p. 840. [Google Scholar]
- Flynn, T. Cryogenic Engineering, Revised and Expanded, 2nd ed.; Marcel Dekker: New York, NY, USA, 2008; pp. 185–186; 199; 201–204; 789. [Google Scholar]
- Threlkeld, J.L. Thermal Environmental Engineering; Prentice Hall: Hoboken, NJ, USA, 1998; Appendix A, Table A.6SI. [Google Scholar]
- Josef BERTSCH Ges. m.b.H & Co. Steam Table. Available online: https://www.bertsch.at (accessed on 15 October 2020).
- Hydrogen. Available online: https://pubchem.ncbi.nlm.nih.gov/compound/Hydrogen (accessed on 18 June 2019).
- Standard Atmosphere. Available online: https://en.wikipedia.org/wiki/Standard_atmosphere_(unit) (accessed on 11 May 2021).
- Beaufort Wind Force Scale. Available online: https://www.metoffice.gov.uk/weather/guides/coast-and-sea/beaufort-scale (accessed on 22 January 2021).
- Schefer, R.; Evans, G.; Zhang, J.; Ruggles, A.; Greif, R. Ignitability limits for combustion of unintended hydrogen releases: Experimental and theoretical results. Int. J. Hydrog. Energy 2011, 36, 2426–2435. [Google Scholar] [CrossRef]
- Griffiths, D.V.; Smith, I.M. Numerical Methods for Engineers, 7th ed.; McGraw-Hill Education: New York, NY, USA, 2016; pp. 475–481. [Google Scholar]


| Parameter | Value | Reference | Unit |
|---|---|---|---|
| 1.198 | [20] | kg/m3 | |
| 0.084 | [20] | kg/m3 | |
| 0.59531 | kg/m3 | ||
| [21] | |||
| [22] | |||
| [23] | |||
| RH | 64 | % | |
| 0.990639 | [24] | ||
| 0.009361 | [24] |
| Parameter | Value | Reference | Unit |
|---|---|---|---|
| F | 0.1 | [10] | |
| A1 | 6534 | m2 | |
| A2 | 7500 | m2 | |
| L | 445.65 | [22] | kJ/kg |
| Z | 1 | [10] | |
| Trel | 53.15 | [10] | K |
| MH2 | 2.016 | [25] | kg/kmol |
| kH2 | 1.383 | [22] | |
| ρH2 | 0.084 | kg/m3 | |
| Patm | 101,325 | [26] | Pa |
| Name of Contour Line | Range of Volume Fraction (%) | Color |
|---|---|---|
| 12.5% of LFL | 0.5–1.0 | Gray  |
| LFL | 4.0–4.5 | Red  |
| 200% of LFL | 8.0–10.0 | Brass  |
Publisher’s Note: MDPI stays neutral with regard to jurisdictional claims in published maps and institutional affiliations. |
© 2021 by the authors. Licensee MDPI, Basel, Switzerland. This article is an open access article distributed under the terms and conditions of the Creative Commons Attribution (CC BY) license (https://creativecommons.org/licenses/by/4.0/).
Share and Cite
Nam, H.; Kim, G.W.; Lee, H.; Choi, B.C.; Roh, G.; Na, Y. Numerical Study of the Action of Convection on the Volume and Length of the Flammable Zone Formed by Hydrogen Emissions from the Vent Masts Installed on an International Ship. J. Mar. Sci. Eng. 2021, 9, 1348. https://doi.org/10.3390/jmse9121348
Nam H, Kim GW, Lee H, Choi BC, Roh G, Na Y. Numerical Study of the Action of Convection on the Volume and Length of the Flammable Zone Formed by Hydrogen Emissions from the Vent Masts Installed on an International Ship. Journal of Marine Science and Engineering. 2021; 9(12):1348. https://doi.org/10.3390/jmse9121348
Chicago/Turabian StyleNam, Hyeonsu, Gun Woo Kim, Hyunyong Lee, Byung Chul Choi, Gilltae Roh, and Youngseung Na. 2021. "Numerical Study of the Action of Convection on the Volume and Length of the Flammable Zone Formed by Hydrogen Emissions from the Vent Masts Installed on an International Ship" Journal of Marine Science and Engineering 9, no. 12: 1348. https://doi.org/10.3390/jmse9121348