1. Introduction
In previous decades, the lack of decision support during the progressive flooding of a damaged passenger ship has been highlighted by many accidents. Large passenger vessels have a complex non-watertight subdivision, limited stability reserve, and limited freeboard at the bulkhead deck, leading to a difficult prediction of the flooding consequences without the aid of a computer system. Therefore, after a collision or grounding, the master needs to have at his/her disposal a Decision Support System (DSS) to make his/her decisions on a rational basis instead of heuristics or his/her experience.
The information given to the master required by the international rules was proven to be inadequate especially during the sinking of Costa Concordia. After the grounding, it was not easy to even identify the breached compartments [
1]. Besides, the mandatory onboard documentation regarding damage stability/control requires much time for consultation. Recently, some efforts have been made toward the digitalization of these documents. Nevertheless, most of them relate to a standard loading condition that is not likely met during navigation or to Safe Return to Port (SRtP) recovery actions and damage control in the final stage of flooding [
2,
3]. Besides, all modern ships are equipped with loading computers capable of carrying out damage stability calculations by applying the lost buoyancy method [
4]. These tools might be capable of assessing the ship’s survivability; however, they cannot consider physically consistent intermediate stages of flooding, which might lead to excessive heeling angles or to the ship capsizing. Moreover, they usually require the manual input of damaged compartments. The last problem has been overcome by the introduction of a mandatory flooding detection system on passenger vessels laid down after 1 July 2010 [
5]. Furthermore, the installation of flooding sensors capable of measuring floodwater levels enabled the direct application of quasi-static progressive flooding simulation codes within onboard DSSs [
6,
7,
8]. The flooding sensors shall be fit in each ship’s internal space to permit the assessment of the damage dimension and location [
9]. These data are then the input for the progressive flooding simulation, which allows the forecast of the damage consequences. The so improved situational awareness after damage occurrence can reduce the reaction time for damage control or ship abandonment, if required. However, up to now, most of the existing passenger ships are not equipped with flooding sensors and, thus, can suffer from the lack of emergency decision support. Besides, the flooding detection system retrofit required for the installation of the most advanced solutions available on the market is costly, discouraging the ship owners from adopting emergency DSSs based on time-domain simulations. A viable solution to overcome such a problem is the introduction of systems requiring a more basic set of sensors to make available the essential information during a flooding emergency. In this context, the time evolution of the damaged ship’s floating position can be exploited instead of the floodwater levels [
10], requiring only the measurement of the ship heel angle, trim angle, and draft during the progressive flooding of the ship. The required set of instruments is limited to inclinometers (usually fit on all the vessels) and one or more level radar(s) fit in still-pipes or below bridge wings to measure ship draught. Then, Machine Learning (ML) can be used to correlate the recorded floating position with the main flooding consequences [
11].
In this context, Random Forests (RFs) have provided promising results [
12]. RFs are trained using a database of progressive flooding simulations in the time domain. The training database is built according to a damage case generator that can be based on different mathematical formulations. Up to now, an extensive discussion of the effect of damage case generation on the classification and regression accuracy is lacking. To fill such a gap, the present work explores the effect of different damage-case-generation algorithms on the prediction of the progressive flooding consequences provided by RFs. In particular, four solutions were tested: a Parametric (P) one and three based on Monte Carlo (MC) sampling (according to probability distributions for damage dimensions used in the convention for Safety of Life at Sea (SOLAS), assuming a uniform distribution of the damage dimension or a uniform distribution of the damage area inverse). After a short overview of the progressive flooding consequences’ prediction, the database generation algorithms are presented. The proposed methodology is, then, applied to a box-shaped barge using a large SOLAS-based database for validation purposes.
2. Prediction of Damage Consequences
When the hull integrity is compromised leading to the progressive flooding of the ship, a few pieces of information are essential to support the master’s decision [
11]. The most important one is the
final fate of the ship, namely whether the ship will survive the damage scenario, reaching a new safe equilibrium position, or will sink, capsize, or shift towards an unsafe condition, e.g., excessive equilibrium heeling angle. Besides, the set of flooded watertight compartments should be known by the crew to promptly carry out the damage control procedures and prevent further spreading of floodwater towards intact watertight compartments. Finally, in a nonsurvival damage case requiring ship abandonment, it is vital to know the
time-to-flood , i.e., the time to reach the ship capsizing, sinking, or an unsafe condition, to manage the ship evacuation process. A viable method to assess this information from the floating position of the damaged ship employs ML. The process is sketched in
Figure 1. More details about the applied methodology can be found in [
11].
During the progressive flooding, the loading condition of the ship changes due to the embarked floodwater, leading to a variation of the floating position as well. The floodwater pouring among connected internal rooms is governed by the hydraulic laws, and thus, it can be predicted by applying progressive flooding simulation codes. Using RF, a link can be searched between the time records of sinkage
s, heel
and trim
angles, i.e., the predictors, and the above-mentioned damage consequences, i.e., the responses [
11]. Considering a time instant
during the progressive flooding, the past time evolution of the floating position is known. Therefore,
,
, and
s can be sampled with a constant time step
up to
, defining the predictor at
. The predictors are used within three specific learners that are trained to predict the main progressive damage consequences (
final fate,
flooded compartments, and
time-to-flood). As time goes by, the predictor set’s size increases, since new information about the floating position is available. Hence, specifically trained learners are produced at each time instant
by exploiting all the available information.
Among the ML algorithms present in the literature, RFs have shown good performances in addressing the classification problems (for final fate and flooded compartments) and the regression one (for the time-to-flood). This is why they were employed in the present work. The learners used in the DSS were trained during a preliminary preparation phase with a database of progressive flooding simulations defined according to a damage case generator. Moreover, to validate the trained learners, another independently generated database was utilized. To this end, the progressive flooding simulations included in the validation database provided the predictors’ values up to the instant , allowing statistically testing the accuracy of the responses. To ensure a reliable accuracy evaluation, the validation database shall be as much as possible representative of a real probability distribution of damage scenarios.
2.1. Random Forests
RFs are supervised ML algorithms belonging to the decision trees family. They can be employed in both classification and regression problems, where they provide a piecewise approximation of the response function. All the decision trees are based on binary decisions made according to the value of one predictor
at each node. Therefore, the process is shaped as a tree, starting from a root and reaching one leaf, i.e., the response, moving decision by decision (
Figure 2). A single decision tree is trained with a database capable of describing the relationship between the predictors’ values and a response [
13]. RFs have been introduced to improve the accuracy of the prediction provided by standard decision trees [
14]. As for bootstrap aggregation, the problem is decomposed into a set of “weak” trees trained with a partition of the original database instead of a single tree trained with the complete database. The response of the overall model is selected according to the vote of the multiple trees for classification problems and as the average of the responses for the regression one. In the present work, 30 weak learners were employed. In addition to the application of multiple learners, RFs also utilize a random selection of a predictors’ subset at each split in a single tree to decorrelate the trees in the ensemble [
15]. These features make RFs more resilient to noise/missing data and more capable of dealing with higher-dimensional data compared to standard decision trees and other ensemble methods. Hence, the choice of such an ML technique was initially considered for the studied problems, involving a large number of predictors for higher
and progressive flooding being affected by several uncertainties [
16,
17].
2.2. Accuracy Estimation
The accuracy of trained learners can be estimated using a validation database independent of the training one. Considering a classification problem, the accuracy rate is usually defined as the capability of assigning a specific scenario from the validation database to the correct response class. Namely, given a time instant
, the accuracy of the related classifiers is defined as:
where
is the number of correctly classified damage scenarios and
N the total number of scenarios induced in the validation database.
Aiming to predict the outcomes of the damage scenario, the so-called “ongoing” damage scenarios, i.e., the scenarios having
, are more interesting. Thus, the ongoing accuracy can also be defined as:
where
is the number of correctly classified ongoing damage scenarios and
the total number of ongoing scenarios induced in the validation database.
Regarding the regression problems, the accuracy can be checked by means of a proper statistical indicator. Here, the coefficient of determination
was used:
where
are the known responses,
is their mean value, and
are the responses predicted by the model. Once again, an
ongoing coefficient of determination was also defined based only on the
ongoing damage scenarios.
3. Database-Generation Methods
As mentioned, to assess the damage consequences by applying ML, a training dataset is needed, composed of progressive flooding simulations. The simulations are driven by a damage case generation algorithm. In the present section, several options are proposed to generate the training database according to a different characterization of the damages. All the progressive flooding simulations were carried out using a quasi-static technique based on the solution of a linearized differential-algebraic equation system [
18,
19]. The method represents a good compromise between accuracy and computational effort [
20]; hence, it was considered adequate for the generation of large databases of progressive flooding simulations.
Usually, the damage is modeled as a parallelepiped box intersecting the hull [
21,
22,
23]. With such an assumption, the surface of the hull shell enclosed in the damage box is removed to define the damage. Considering a collision case, the box-shaped damage is always crossing the waterline and can be completely defined by five parameters (
Figure 3):
Damage length ;
Longitudinal position of the damage center ;
Transversal damage penetration measured from the shell side ();
Vertical height of the highest tip of the damage above the Baseline ();
Vertical height of the lowest tip of the damage above the .
In the present work, the damage penetration was neglected since all the internal structures were considered intact.
Here, two families of methods for the database generation of side damage cases in calm water were tested, one based on MC generation and the other based on a parametric generation aimed to cover all the possible damage scenarios involving multiple neighboring rooms. Applying MC sampling, the damage cases can be generated following the probability distribution of their parameters [
24]. Here, three different options were explored. The first was based on the probability distributions embedded in SOLAS and the other two on two types of uniform distributions.
3.1. Monte Carlo with SOLAS Probability Distributions
The SOLAS probabilistic rule framework for ship damage stability is based on the statistical analysis of a database of side collision accidents [
25]. In the SOLAS, the probability distributions are used to define a so-called zonal approach, so they are not explicitly defined. However, recent studies explored the so-called nonzonal approach, which directly applies the probability distributions on the damage parameters [
26]. With this approach, the following damage parameter probability distributions can be taken from SOLAS:
,
,
, which lead to the definition of the p-factor, and
, which is considered in the v-factor. The
is not defined, since SOLAS adopts a worst-case approach in s-factor determination to consider horizontal subdivision below the waterline. However, the
probability distribution can be taken from the statistical analysis of collision damage data available in the literature [
22]. The adopted probability distributions for the SOLAS database generation are defined as follows:
Damage length was modeled with a bilinear probability density function, leading to the following cumulative distribution:
where
, and all the other parameters are defined as in SOLAS Ch.II-1 Part B-1 Regulation 7-1 [
27].
The longitudinal position of the damage center is uniformly distributed along the ship subdivision length
:
The vertical height
was modeled with a bilinear cumulative density function:
The vertical height
was modeled with a linear probability density function, leading to the following cumulative distribution:
3.2. Monte Carlo with a Uniform Distribution of the Damage Dimensions
In this database-generation algorithm, the maximum damage dimensions were still taken from SOLAS. However, a uniform distribution was assumed for the damage length and height. The applied cumulative density functions are, then, defined as follows:
Damage length was assumed as uniformly distributed between zero and the maximum admissible nondimensional length according to SOLAS:
The longitudinal position of the damage center is already uniformly distributed in SOLAS. Hence, Equation (
5) can still be applied.
The damage height
is uniformly distributed between zero and
, i.e., the maximum value according to SOLAS:
As the damage height is defined, the vertical position of the damage center
is defined ensuring that the damage is crossing the waterline in compliance with SOLAS. Hence,
was assumed as uniformly distributed in the interval:
3.3. Monte Carlo with a Uniform Distribution of the Damage Area Inverse
In this damage-case-generation algorithm, a uniform distribution of the inverse of the damage area was applied. The main objective of such a method is to generate a more uniform distribution of the time-to-flood, compared to the SOLAS one. SOLAS’s probability distributions lead to many large-area damages having, consequently, a short time-to-flood. Such damages are not very interesting for decision support purposes since the events evolve too fast to gain any advantage from a DSS response. Moreover, a too-small number of long damage scenarios might affect the forecast accuracy of the learners due to the lack of training data.
The following cumulative probability function was applied to draw the damage areas:
where
and
are the minimum and maximum damage areas that can be defined for each different ship. In a real application, floodwater inflow due to very small damages can be controlled by the bilge system. Hence, it can be assessed considering the bilge pumps’ capacity. The maximum area can be defined as the maximum damage area according to SOLAS:
.
Given the damage area, the other parameters were defined. The longitudinal position of the damage center was here assessed as for SOLAS according to Equation (
5). Two alternative procedures were then applied to half of the generated damage cases:
The heights
and
were drawn following the SOLAS
provided in Equations (
6) and (
7), respectively. Then, defining the damage height
, the damage length was determined as
;
The damage length was drawn following the SOLAS
provided in Equation (
4), and damage height
was determined as
. Then, the vertical position of damage center
was randomly drawn within the range defined in Equation (
10) to have the damage crossing the waterline.
Damages having a height or length outside the ship boundaries were discarded and randomly generated again.
3.4. Parametric Method
The parametric generation of the damage cases was divided into two phases. In the first, the box-shaped damages were generated considering every single room laying on the hull shell. In the latter, the single-room damage cases were parametrically combined to define additional damage cases involving neighboring rooms.
In a previous study [
17], it was observed that the longitudinal position of the damage center has only a limited impact on progressive flooding, whereas its vertical position has a relevant effect. Hence, all the single-room damages were applied at half of the room longitudinal extension assuming an
equal to the room longitudinal extension. On the other hand, at least three different vertical positions of damage center
were considered for each room: the room’s bottom, half-height, and top. If a room extends over multiple decks, additional intermediate positions were considered corresponding to the main decks’ heights from the baseline. The damage center height was corrected for top and bottom damages, considering the applied damage area as shown in
Figure 4, to avoid damages extending outside the room boundaries. For each possible damage location
, multiple damage sizes were considered. The area of the
i-th damage in the
j-th room, considering the
k-th center, is evaluated as:
with
, where
is the so-called number of divisions, which is the main parameter governing the database size. Besides,
and
were defined for each room and each position of the damage center. The minimum area was defined as the one corresponding to an initial inflow equal to the bilge pumps’ capacity. To define the maximum area, note that very large damages result in the almost instantaneous filling of the damaged room. Hence, the maximum damage area was defined as the area that causes the room filling in 15 s. Furthermore, every single room was assumed as lost at the beginning of progressive flooding (instantaneous flooding), defining an additional single-room damage case. After the definition of the single-room damage cases, they were combined with the ones related to the neighboring rooms. Namely, all the possible combinations of the damage areas of damages having the same center height (bottom, half-height, top) and sharing a boundary (watertight bulkhead, deck) were considered. For instance, at the intersection of a deck and a transverse bulkhead, the combinations were defined considering up to four rooms. Here, only one or two compartments’ damages were generated. Nevertheless, the parametric generation technique can be easily extended to a higher number of contiguous compartments if required.
4. Test Case
The multiple generation algorithms were tested on a simple test geometry to study their effect on damage consequences’ assessment. In the present section, the test arrangement is described. Then, the tested training and validation databases are described.
4.1. Test Arrangement
The test arrangement was a box-shaped barge having the general arrangement shown in
Figure 5, and the main particulars are provided in
Table 1. The test barge had three decks: DK1 located near the water plane (at 5 m above the
BL), DK2 (located at 10 m above the
BL), and the bulkhead deck DK3 (located 15 m above the baseline). Beneath the bulkhead deck, the barge was divided into five main compartments. In first and third compartments, the lowest rooms extended from the barge bottom to DK2. In the lowest room within Compartments 1 and 3, longitudinal bulkheads were fit on the centerline. In addition, another longitudinal bulkhead was fit in Compartment 5 between DK2 and DK3 to create a long flooding chain when the lowest room was damaged.
All the rooms were considered fully vented, had unitary permeability and were interconnected by a set of openings, as shown in
Figure 5. The openings’ size and position are provided in
Table 2. To apply a hydrostatic code based on pressure integration technique [
28], both the rooms and the openings were modeled with nonstructured triangular meshes having a maximum panel area of 3.125 m
2 and 0.25 m
2, respectively. A sketch of the 3D model of the test geometry is shown in
Figure 6.
4.2. Tested Databases
The different database-generation techniques defined in the previous section were applied to create five different training databases related to the test arrangement:
MC20: based on the SOLAS probability distributions and being composed of 20,000 damage cases (3082 nonsurvival cases);
MCD20: based on a uniform distribution of damage dimensions and being composed of 20,000 damage cases (8898 nonsurvival cases);
MCA20: based on a uniform distribution of the damage area inverse and being composed of 20,000 damage cases (2318 nonsurvival cases);
P8: a parametric database having and being composed of 18,854 damage cases (15,388 nonsurvival cases).
The number of damage cases
20,000 was chosen to ensure a proper convergence of the accuracy [
11]. For the same reason, 20,000 damage cases were included in the MCD20 and MCA20 databases, whereas
was chosen for the P8 database to have a similar number of damage cases and ensure a fair comparison of the methods.
Figure 7 shows the resulting cumulative density functions of the damage dimensions, location, and
time-to-flood of the damage cases in the four databases.
The MC-based methods provided a continuous distribution of all the parameters, whereas the parametric one led to scattered distributions except for . As expected, an almost uniform distribution of was associated with the MCA20 database. This means that many small damages were generated located near the free surface, while the number of nonsurvival scenarios was lower than that of MC20. On the contrary, both, the MCD20 and P8 databases contained a significantly higher percentage of nonsurvival scenarios compared to MC20. It is worth noticing that MC20 and MCD20 drive toward a comparable cumulative distribution of , although driven by different probability distributions of damage parameters.
Besides the training databases, a single validation database was defined:
The SOLAS probability distributions were chosen for the validation database since they were considered the most representative of the collision damages that might occur in an operative environment. Hence, aiming at the definition of a methodology to be employed during a real flooding emergency, such a choice was deemed appropriate.
For all the databases, the maximum simulation time was set to 2250 s.
5. Results
In
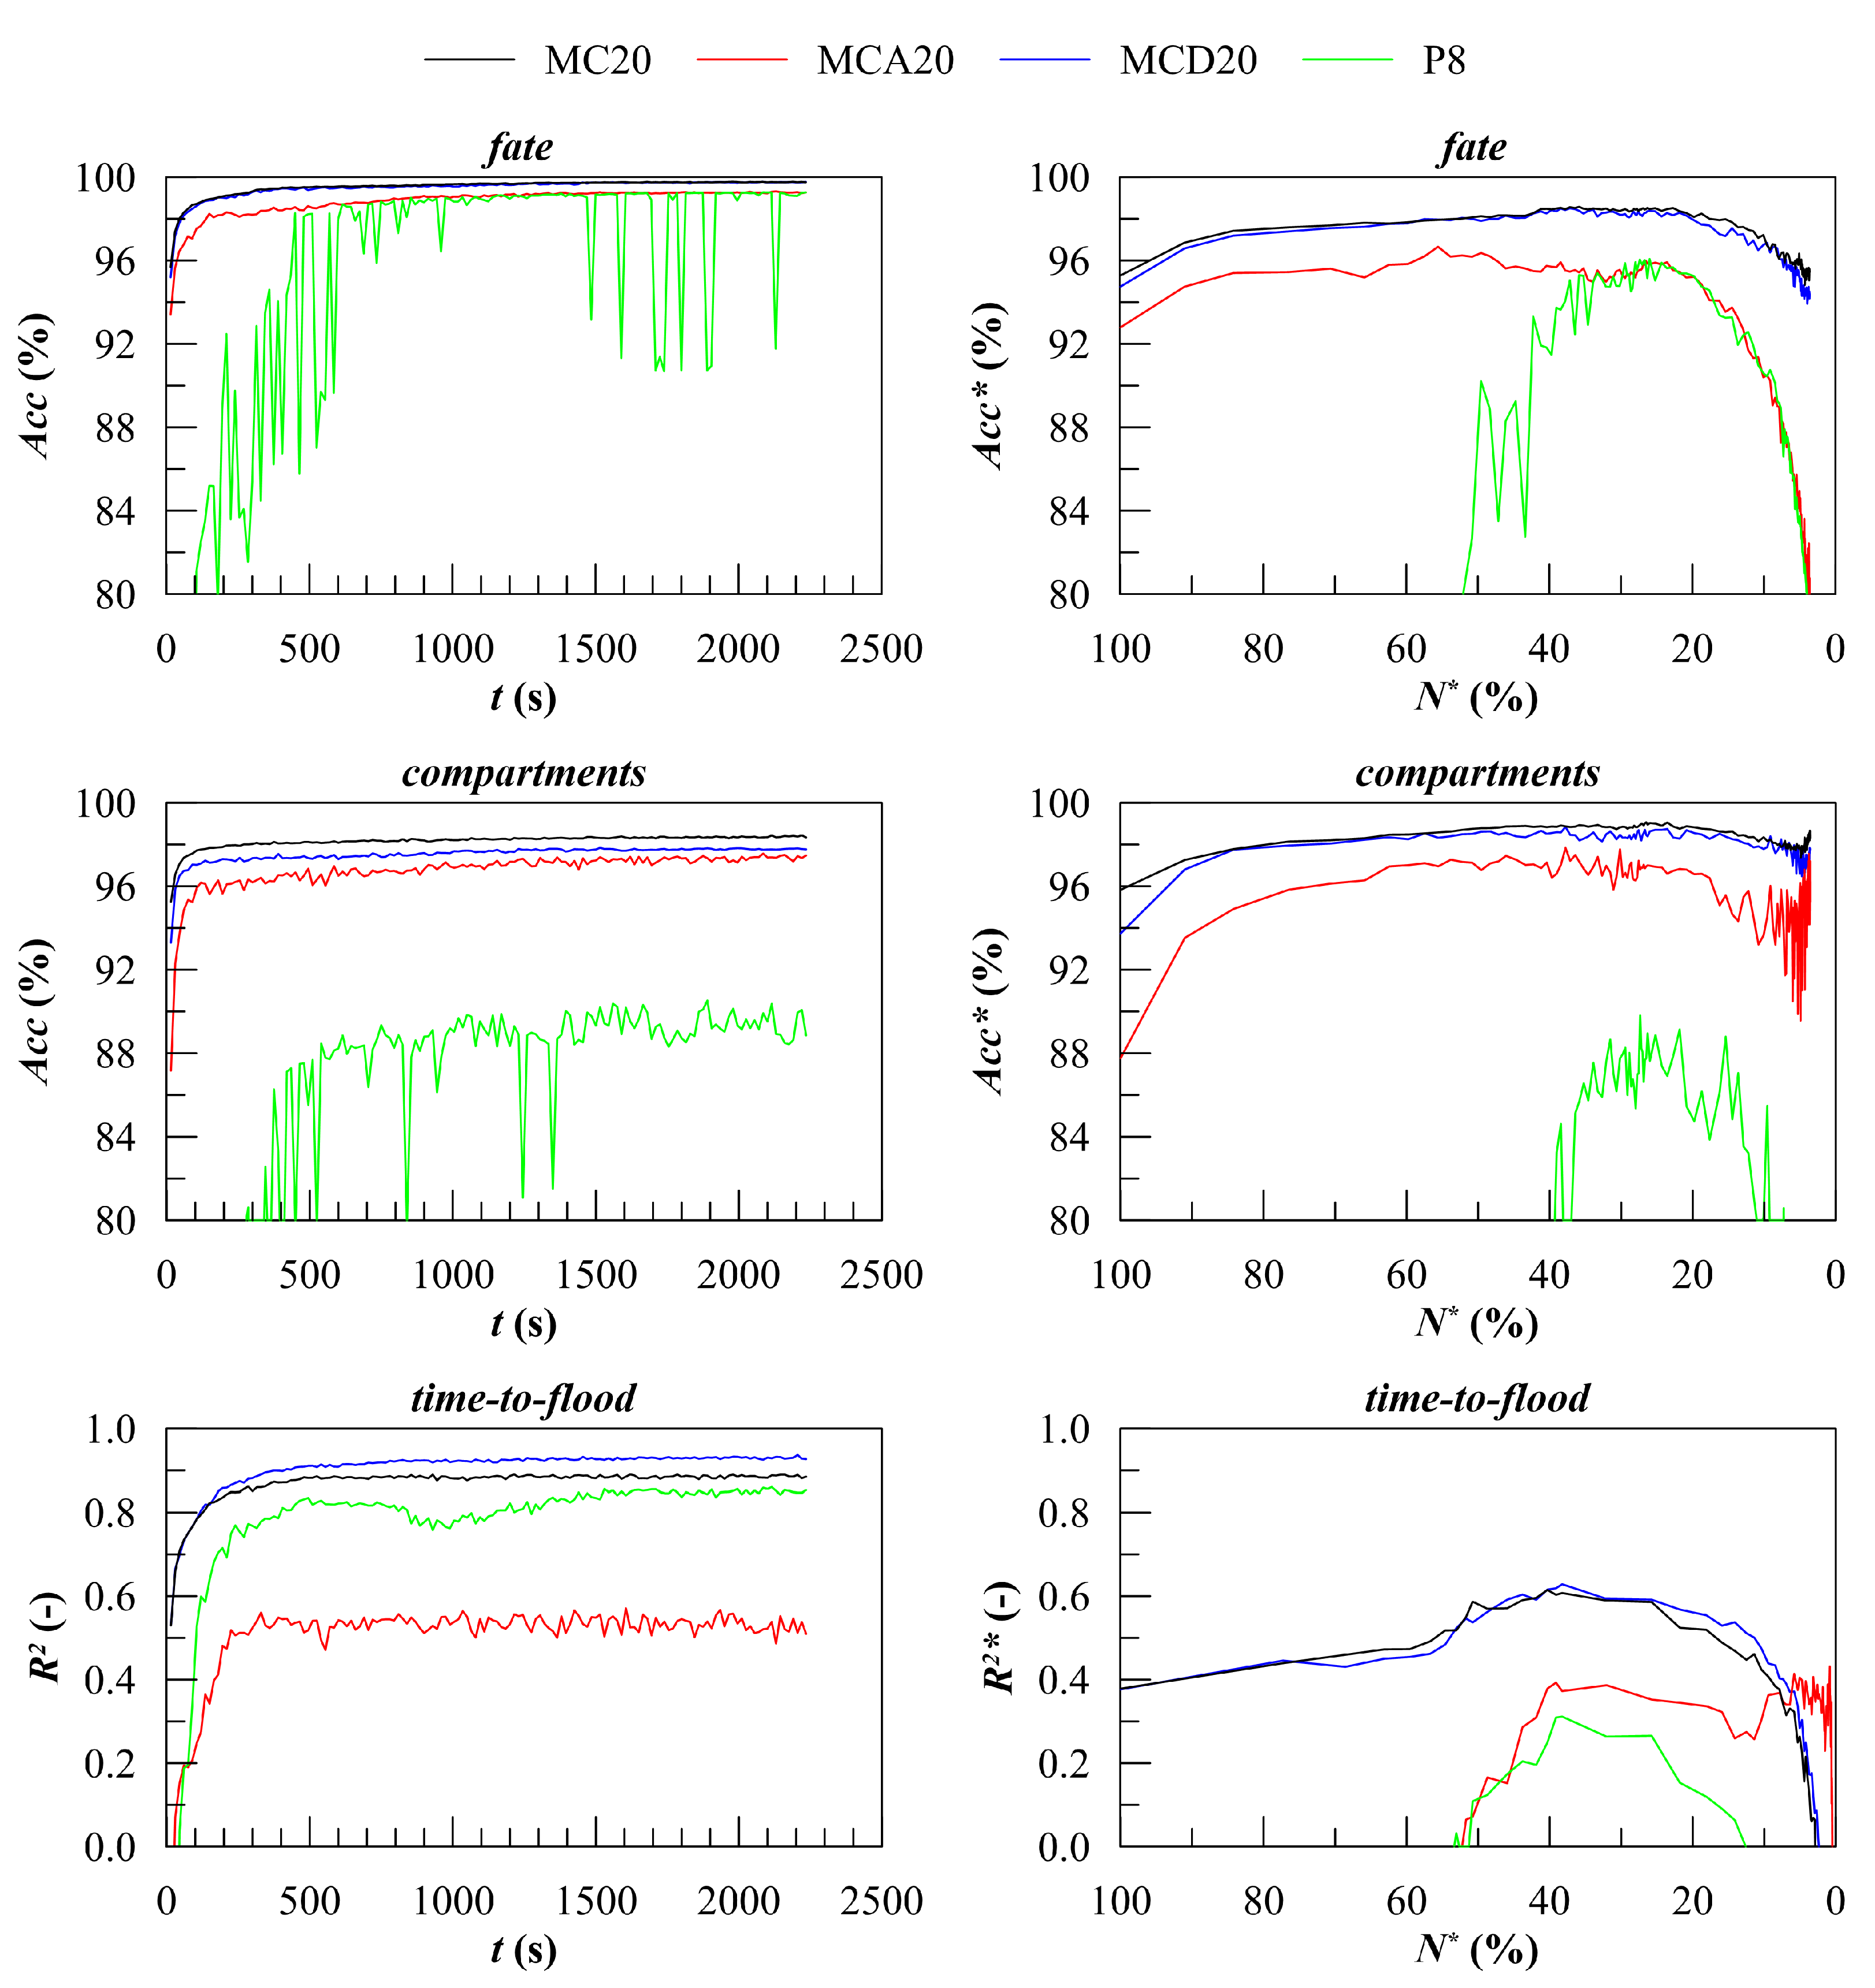
Figure 8, the overall performances obtained applying the different training databases are provided. It is worth noticing that the MC20 database employing the SOLAS probability distributions was not always associated with the best performances despite a SOLAS-based dataset always being employed for validation.
Namely, the MCD20 database provided similar results for the final fate and flooded compartments classification problems compared to the MC20 one. Besides, the MCD20 dataset was more accurate in the prediction of than MC20. The MCA20 database showed a lower accuracy than MC20 and MCD20 for all the studied problems. However, MCA20 showed a larger region of stable forecast, although a lower maximum of and was reached. decayed under a null value at about (corresponding to 0.5% of the ongoing damage scenarios in the validation database) instead of , which was related to the MCD20 database. The parametric generation method always led to lower accuracy compared to all the methods based on MC generation. Moreover, the P8 training database led to strong accuracy instability in both classification problems.
6. Discussion
Considering the final fate classification problem, the adoption of the MCD20 training database had a very limited effect on the overall and ongoing accuracy. In detail, a less skewed training dataset was obtained by the larger number of nonsurvival damage cases in MCD20. This reduced by about 0.05% the type I error (i.e., when a nonsurvival scenario was classified as a survival one by the learner), while increasing by about 0.15% the type II one (i.e., when a survival scenario was classified as a nonsurvival one by the learner). The adoption of the MCA20 training database decreased the accuracy by about 2% in forecasting the final fate compared to MC20/MCD20. Furthermore, a strong decay of the ongoing accuracy for long damage scenarios was also observed. The main reason can be found in the larger number of damage scenarios exceeding the maximum simulation time compared to the other databases: in MCA20, 30% of damage scenarios had . The adoption of the P8 training database led to a similar behavior, although the accuracy reached an almost stable value later (at about 500 s). Analyzing the results provided by the parametric generation, note that damage cases affected one or two adjoining compartments. On the other hand, the validation database (MC50b) was based on the SOLAS probability distributions. According to SOLAS, the maximum damage length for the test barge is 22.72 m, which exceeds the length of each watertight compartment (15 m). Hence, 7.4% of the damage scenarios in the validation database affected three adjoining compartments. The accuracy gap between MC20 and P8 for the final fate classification problem in the stable region was between 1% and 3%, being lower than 7.4%. This means that many of the three-compartment damage scenarios were still correctly classified by RFs trained with the P8 database.
On the contrary, the classification of flooded compartments led to an accuracy gap of about 9–10%, which was larger than the percentage of the three-compartment damage scenarios included in the validation database. For flooded compartments classification, the MCD20 and MCA20 databases had an overall accuracy 1% and 2% lower than the MC20 one, respectively. On the other end, the ongoing accuracy of MCD20 was comparable to the MC20 one, whereas the MCA20 one was again 2% worse and showed a greater instability for large values.
The
regression related to nonsurvival scenarios based on the different techniques for training database generation led to more interesting results. In
Figure 9,
Figure 10,
Figure 11 and
Figure 12, the predicted–observed plots evaluated at
and
are provided.
As mentioned, the SOLAS-based training database was not always the best option. The MCD20 training database led to better results since it contained more than double the nonsurvival scenarios compared to MC20, while the two databases had almost the same distribution of the
time-to-flood. Due to the increased density of the training database, the RFs better forecast the
up to
. Nevertheless, at larger
values, the ongoing accuracy still decayed. In such a region, better results could be reached by employing the MCA20 training database, which allowed a good forecast of the
time-to-flood up to
. The main reason was the lower dimension of the generated damages, which led to a higher density of the training data in the most critical region. However, note that the model tended to overestimate
, highlighted by the clusters in the lower part in
Figure 10.
Another criticality associated with the MCA20 training database was the poor capacity to deal with large damages having short . This was mainly due to the limited number of nonsurvival damage scenarios. Bulky errors can be observed in the lower region, leading to poor values of the overall (never greater than 0.55). Regarding the parametric generation method, it was not capable of ensuring good results for the regression problem for the test geometry.
7. Conclusions
The paper explored multiple options for training database generation on damage consequences’ assessment. Four generation algorithms were tested on a box-shaped barge, demonstrating that the accuracy of prediction can be heavily affected by the database-generation method. An interesting result was that the training database generation based on the SOLAS probability distributions was not always the best option for the test geometry. Although the validation database was also based on the SOLAS probability distributions, different distributions applied to the damage parameters driving the MC sampling led to equal or better results.
Among the studied problems, the regression problem was the most affected by the training database. Namely, the application of the uniform probability distribution of the damage dimensions or inverse area significantly improved the performances for short and large values, respectively. For the two classification problems, the uniform probability distribution of the damage dimensions led to slightly better results compared to the SOLAS one.
The parametric generation method showed always poorer performances compared to the other tested options. However, this gap was mainly due to the assumption of a maximum of two adjoining compartments involved in a damage scenario valid for the parametrically generated database. Moreover, the parametric method showed quite good resilience in the final fate classification problem and led to a large percentage of long nonsurvival damage cases, thus to a less skewed training database. Hence, it can be concluded that the parametric generation is worthy of further investigation to assess its real effectiveness.
Future research should also focus on more complex geometries (such as a full-scale passenger vessel), the effect of the ship loading condition, waves, and internal openings’ type and status (open/closed). All these issues shall be properly considered during the training database generation to move towards a real application of flooding-sensor-agnostic DSS in an operative environment. Nevertheless, the outcomes of the present study can help naval architects in addressing the issues that might affect the result of a flooding-sensor-agnostic DSS due to the adopted database-generation technique.
Author Contributions
Conceptualization, L.B., J.P.-O., and M.V.; methodology, L.B., J.P.-O. and M.V.; software, L.B.; validation, L.B. and M.V.; formal analysis, L.B. and M.V.; investigation, L.B.; resources, L.B.; data curation, L.B.; writing—original draft preparation, L.B.; writing—review and editing, J.P.-O. and M.V.; visualization, L.B., M.V. and J.P.-O.; supervision, J.P.-O. and M.V.; project administration, J.P.-O.; funding acquisition, J.P.-O. All authors have read and agreed to the published version of the manuscript.
Funding
This work was fully supported by the Croatian Science Foundation under the project IP-2018-01-3739.
Institutional Review Board Statement
Not applicable.
Informed Consent Statement
Not applicable.
Data Availability Statement
The data are contained within the article.
Acknowledgments
This work was also supported by the University of Rijeka (Project Nos. uniri-tehnic-18-18 1146 and uniri-tehnic-18-266 6469).
Conflicts of Interest
The authors declare no conflict of interest.
References
- Marine Casualties Investigative Body. Cruise Ship Costa Concordia, Marine Casualty on January 13, 2012, Report on the Safety Technical Investigation; Technical Report; Ministry of Infrastructures and Transports: Rome, Italy, 2013.
- Hu, L.; Ma, K. Genetic algorithm-based counter-flooding decision support system for damaged surface warship. Int. Shipbuild. Prog. 2008, 55, 301–315. [Google Scholar]
- Kang, H.; Choi, J.; Yim, G.; Ahn, H. Time Domain Decision-Making Support Based on Ship Behavior Monitoring and Flooding Simulation Database for On-Board Damage Control. In Proceedings of the 27th International Ocean and Polar Engineering Conference, San Francisco, CA, USA, 25–30 June 2017. [Google Scholar]
- Ruponen, P.; Pennanen, P.; Manderbacka, T. On the alternative approaches to stability analysisin decision support for damaged passenger ships. WMU J. Marit. Aff. 2019, 18, 477–494. [Google Scholar] [CrossRef] [Green Version]
- IMO. MSC.1/Circ.1291 Guidelines for Flooding Detection Systems on Passenger Ships; Technical Report; International Maritime Organisation: London, UK, 2008.
- Ruponen, P.; Larmela, M.; Pennanen, P. Flooding Prediction Onboard a Damage Ship. In Proceedings of the 11th International Conference on the Stability of Ships and Ocean Vehicles, Athens, Greece, 23–28 September 2012; pp. 391–400. [Google Scholar]
- Dankowski, H.; Krüger, S. A Fast, Direct Approach for the Simulation of Damage Scenarios in the Time Domain. In Proceedings of the 11th International Marine Design Conference—IMDC 2012, Glasgow, UK, 11–14 June 2012. [Google Scholar]
- Rodrigues, J.; Guedes Soares, C. A generalized adaptive mesh pressure integration technique applied to progressive flooding of floating bodies in still water. Ocean Eng. 2015, 110, 140–151. [Google Scholar] [CrossRef]
- Ruponen, P.; Pulkkinen, A.; Laaksonen, J. A method for breach assessment onboard a damaged passenger ship. Appl. Ocean Res. 2017, 64, 236–248. [Google Scholar] [CrossRef]
- Trincas, G.; Braidotti, L.; De Francesco, L. Risk-Based System to Control Safety Level of Flooded Passenger Ship. Brodogradnja 2017, 68, 31–60. [Google Scholar] [CrossRef] [Green Version]
- Braidotti, L.; Valčić, M.; Prpić-Oršić, J. Exploring a Flooding-Sensors-Agnostic Prediction of the Damage Consequences Based on Machine Learning. J. Mar. Sci. Eng. 2021, 9, 271. [Google Scholar] [CrossRef]
- Braidotti, L.; Prpić-Oršić, J.; Valčić, M. Application of decision trees to predict damage consequences during the progressive flooding. In Proceedings of the 8th International Conference on marine Structures, Trondheim, Norway, 7–9 June 2021. [Google Scholar]
- Breiman, L.; Friedman, J.H.; Olshen, R.A.; Stone, C.J. Classification and Regression Trees; CRC Press: Boca Raton, FL, USA, 1984. [Google Scholar]
- Breiman, L. Random Forests. Mach. Learn. 2001, 45, 5–32. [Google Scholar] [CrossRef] [Green Version]
- James, G.; Witten, D.; Hastie, T.; Tibshirani, R. An Introduction to Statistical Learning: With Applications in R; Springer: New York, NY, USA, 2017. [Google Scholar]
- Rodrigues, J.; Lavrov, A.; Hinostroza, M.; Guedes Soares, C. Experimental and numerical investigation of the partial flooding of a barge model. Ocean Eng. 2018, 169, 586–603. [Google Scholar] [CrossRef]
- Braidotti, L.; Marinò, A.; Bucci, V. On the Effect of Uncertainties on Onboard Progressive Flooding Simulation. In Proceedings of the 3rd International Conference on Nautical and Maritime Culture—CNM 2019, Naples, Italy, 14–15 November 2019; pp. 21–30. [Google Scholar] [CrossRef]
- Braidotti, L.; Mauro, F. A New Calculation Technique for Onboard Progressive Flooding Simulation. Ship Technol. Res. 2019, 66, 150–162. [Google Scholar] [CrossRef]
- Braidotti, L.; Mauro, F. A Fast Algorithm for Onboard Progressive Flooding Simulation. J. Marit. Sci. Eng. 2020, 8, 369. [Google Scholar] [CrossRef]
- Braidotti, L.; Degan, G.; Bertagna, S.; Bucci, V.; Marinò, A. A Comparison of Different Linearized Formulations for Progressive Flooding Simulations in Full-Scale. Procedia Comput. Sci. 2021, 180, 219–228. [Google Scholar] [CrossRef]
- DNV GL. Evaluation of Risk from Raking Damages Due to Grounding; Technical Report PP090623/3-1; DNV GL: Høvik, Norway, 2014. [Google Scholar]
- Bulian, G.; Cardinale, M.; Francescutto, A.; Zaraphonitis, G. Complementing SOLAS damage ship stability framework with a probabilistic description for the extent of collision damage below the waterline. Ocean Eng. 2019, 186, 106073. [Google Scholar] [CrossRef]
- Ruponen, P.; Lindroth, D.; Routi, A.; Aartovaara, M. Simulation-based analysis method for damage survivability of passenger ships. Ship Technol. Res. 2019, 66, 180–192. [Google Scholar] [CrossRef] [Green Version]
- Kruger, S.; Dankowsky, H. A Monte Carlo based simulation method for damage stability problems. In Proceedings of the 38th International Conference on Ocean, Offshore and Arctic Engineering—OMAE 2019, Glasgow, UK, 9–14 June 2019. [Google Scholar]
- IMO. Resolution MSC.281(85) Explanatory Notes to the SOLAS Chapter II-1 Subdivision and Damage Stability Regulations; Technical Report; International Maritime Organisation: London, UK, 2008.
- Bulian, G.; Lindroth, D.; Ruponen, P.; Zaraphonitis, G. Probabilistic assessment of damaged ship survivability in case of grounding: Development and testing of a direct non-zonal approach. Ocean Eng. 2016, 120, 331–338. [Google Scholar] [CrossRef]
- IMO. Chapter Ch.II-1 Part B Subdivision and Stability. In SOLAS 2018 Consolidated Edition; International Maritime Organisation: London, UK, 2018. [Google Scholar]
- Braidotti, L.; Trincas, G.; Bucci, V. Analysis of the Influence of Pressure Field on Accuracy for Onboard Stability Codes. In Proceedings of the 19th International Conference on Ships and Maritime Research—NAV 2018, Trieste, Italy, 20–22 June 2018; pp. 80–87. [Google Scholar] [CrossRef]
| Publisher’s Note: MDPI stays neutral with regard to jurisdictional claims in published maps and institutional affiliations. |
© 2021 by the authors. Licensee MDPI, Basel, Switzerland. This article is an open access article distributed under the terms and conditions of the Creative Commons Attribution (CC BY) license (https://creativecommons.org/licenses/by/4.0/).


