
Research on Visualization of Inducer Cavitation of High-Speed Centrifugal Pump in Low Flow Conditions


Abstract
:1. Introduction
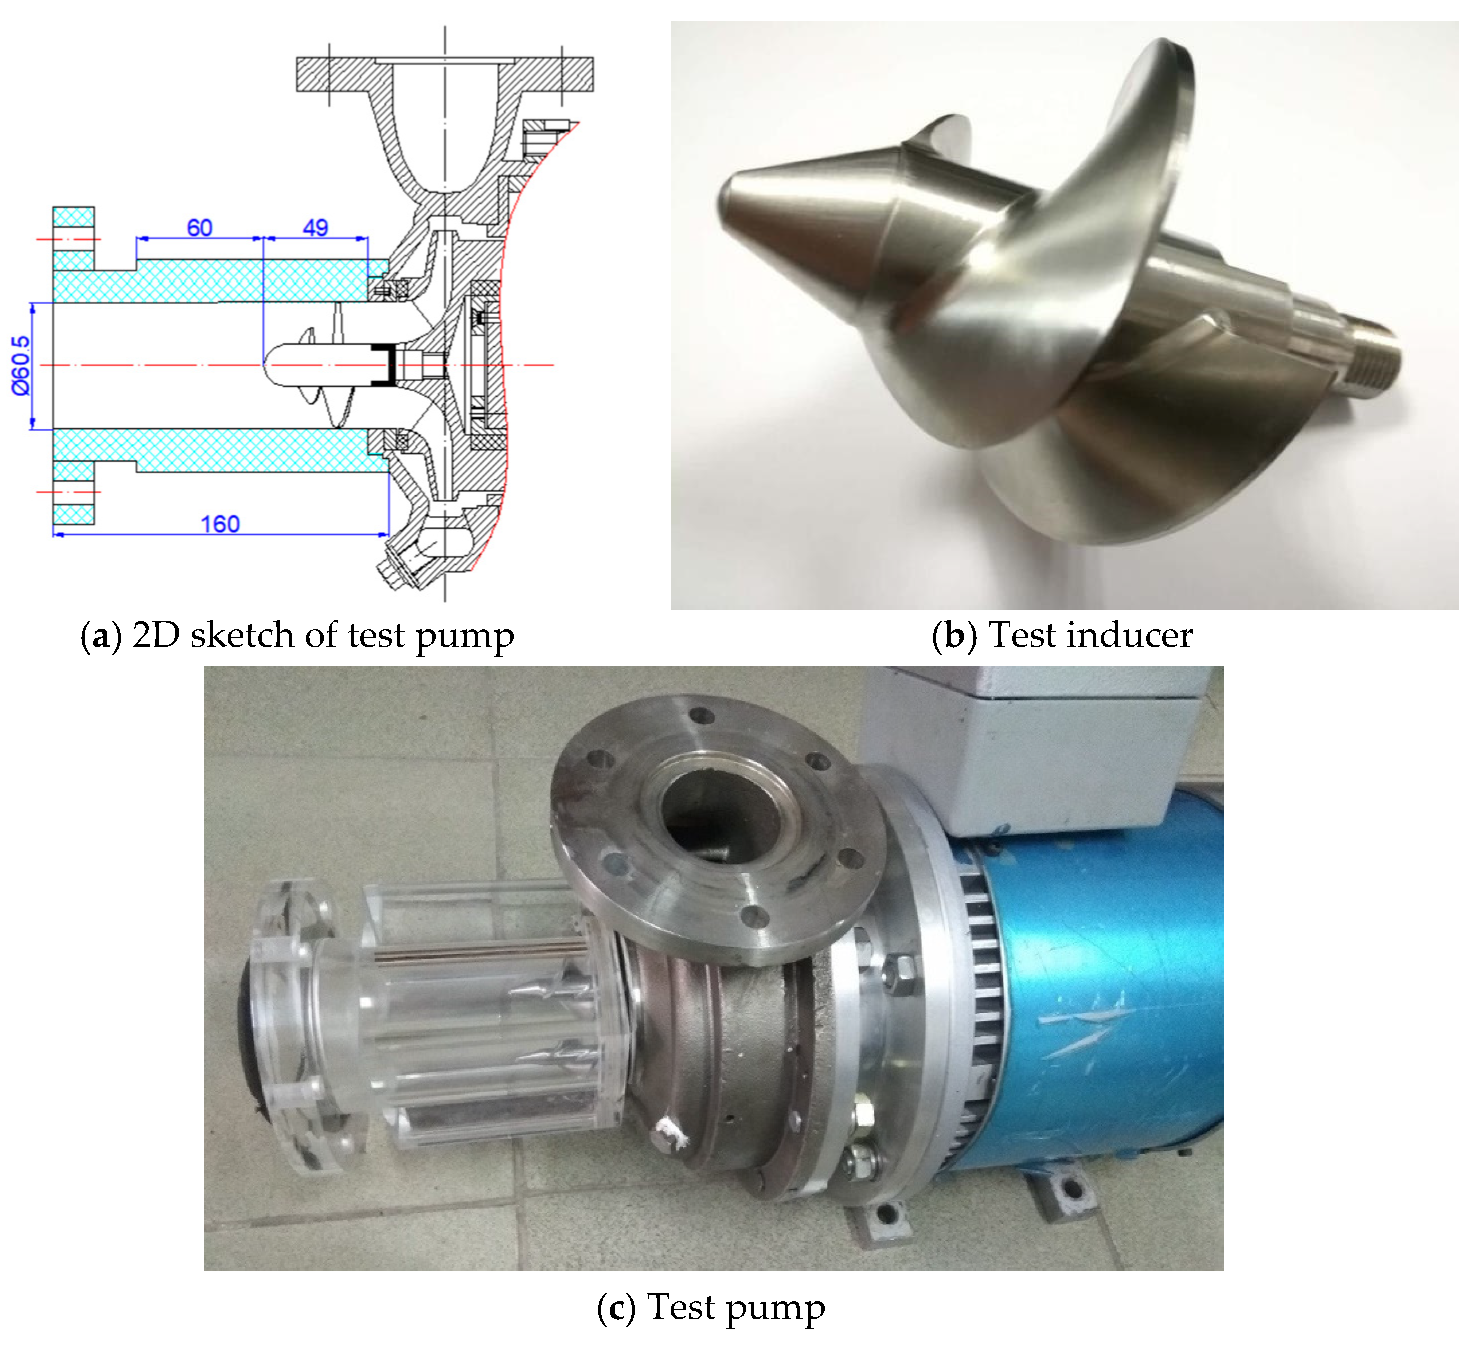
2. Research Object
3. Numerical Method
3.1. Continuity Equation and Momentum Equation
3.2. Cavitation Model
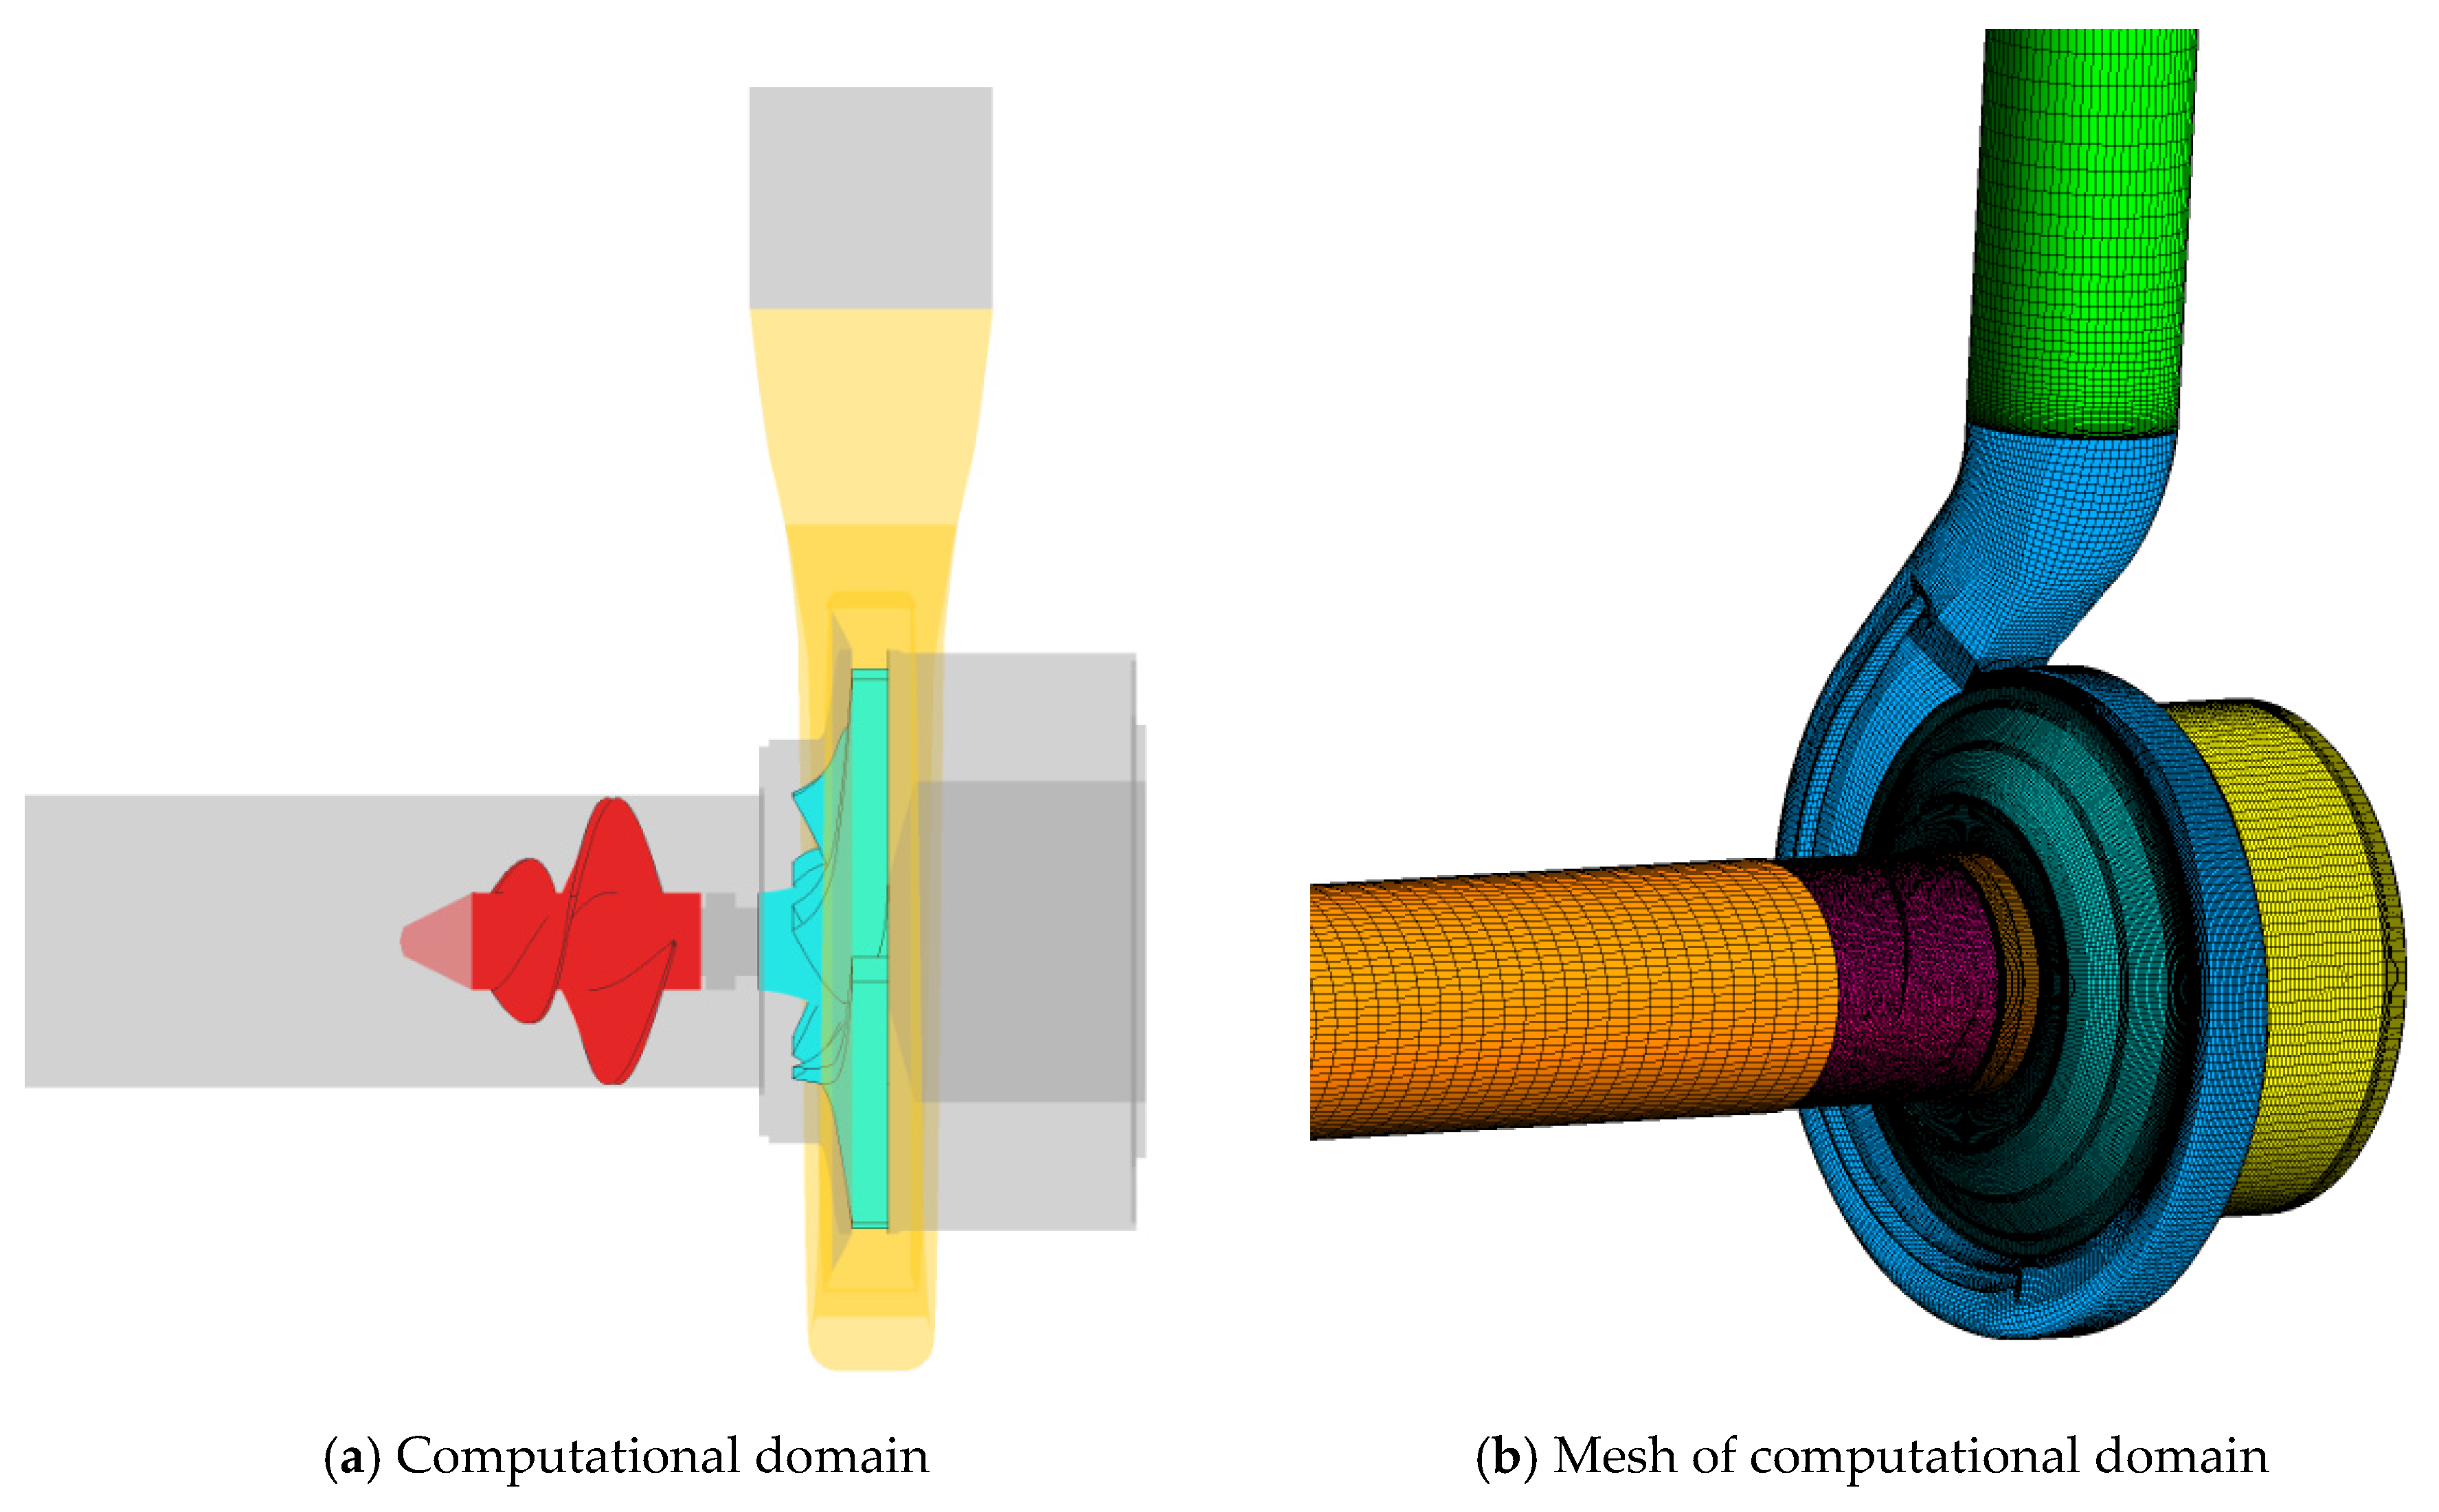
3.3. Numerical Setup and Grid Validation
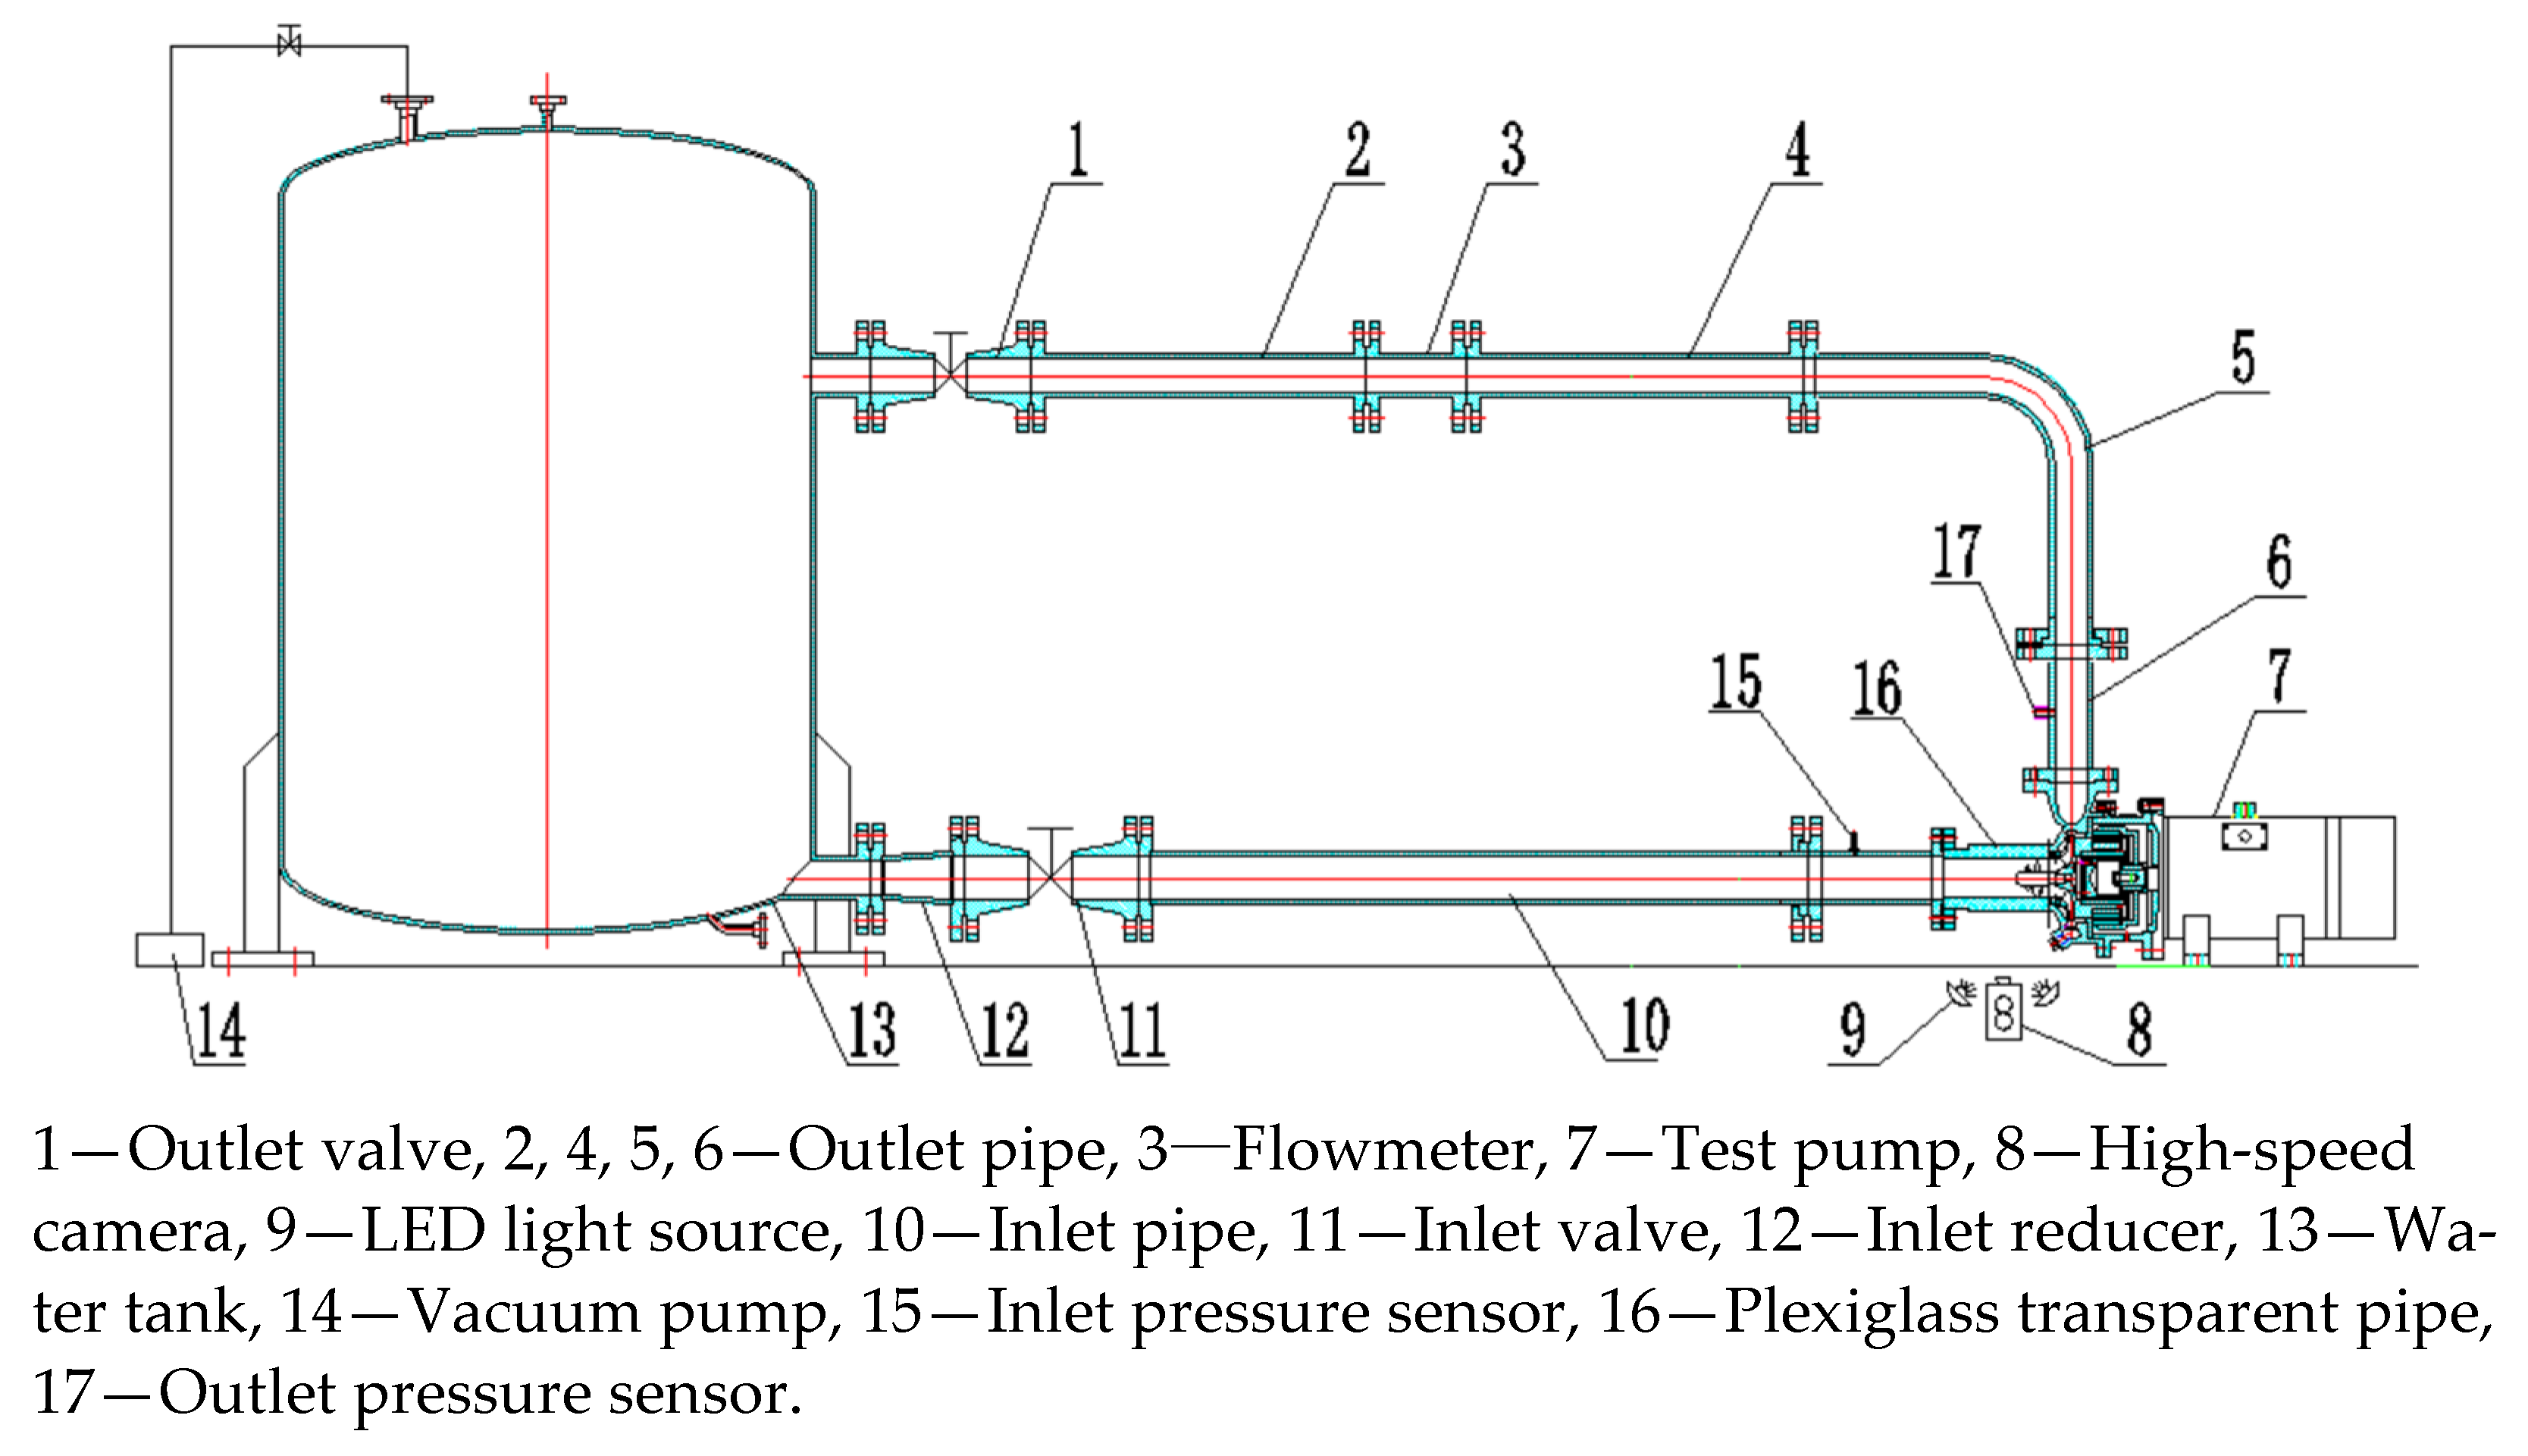
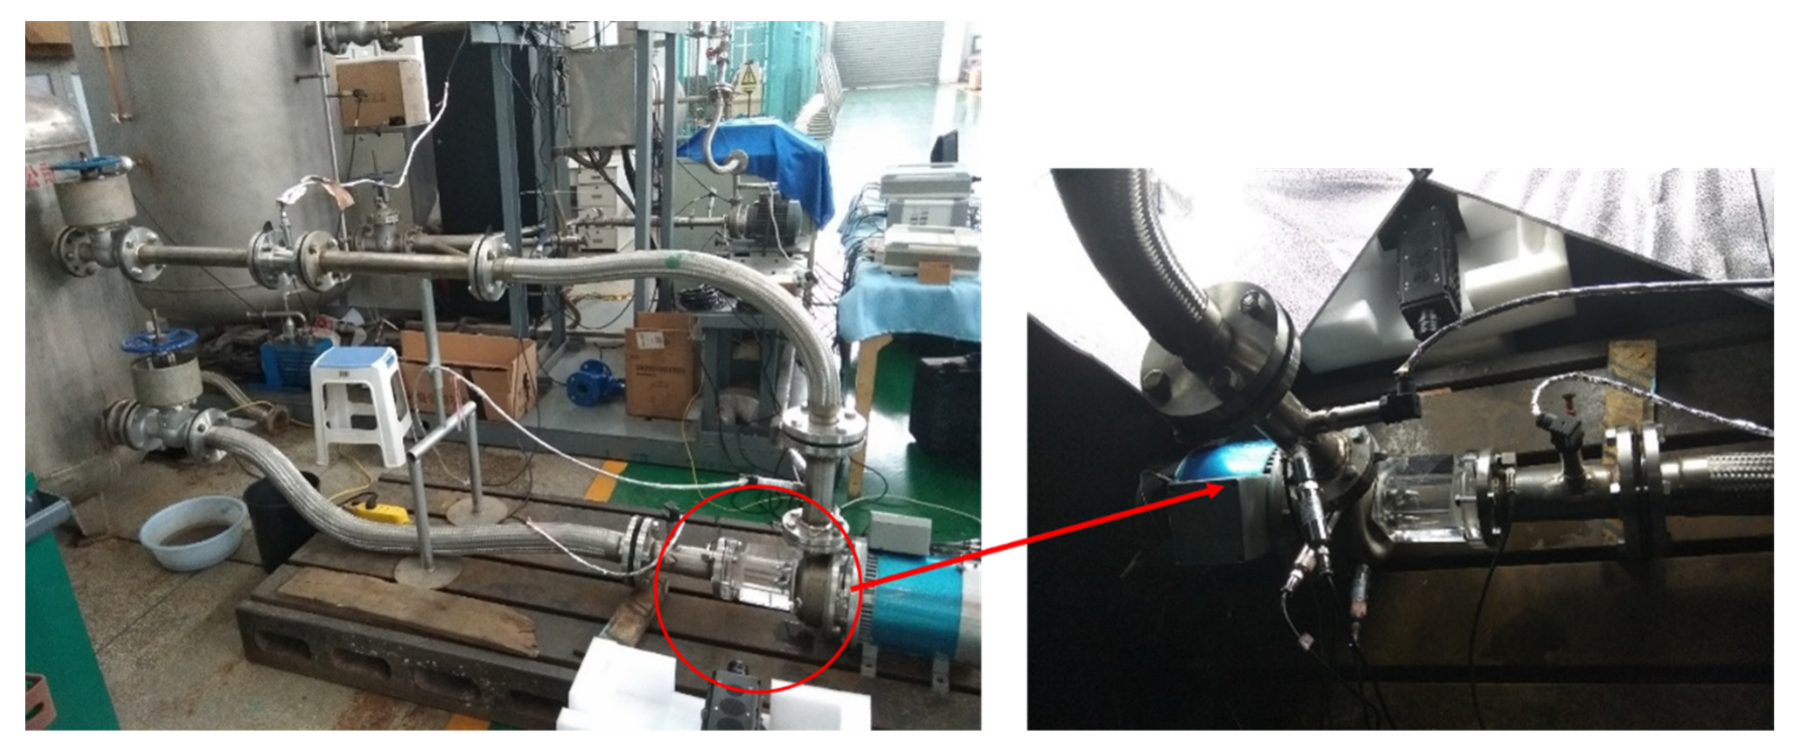
4. Test Setup
5. Analysis of the Experimental Results
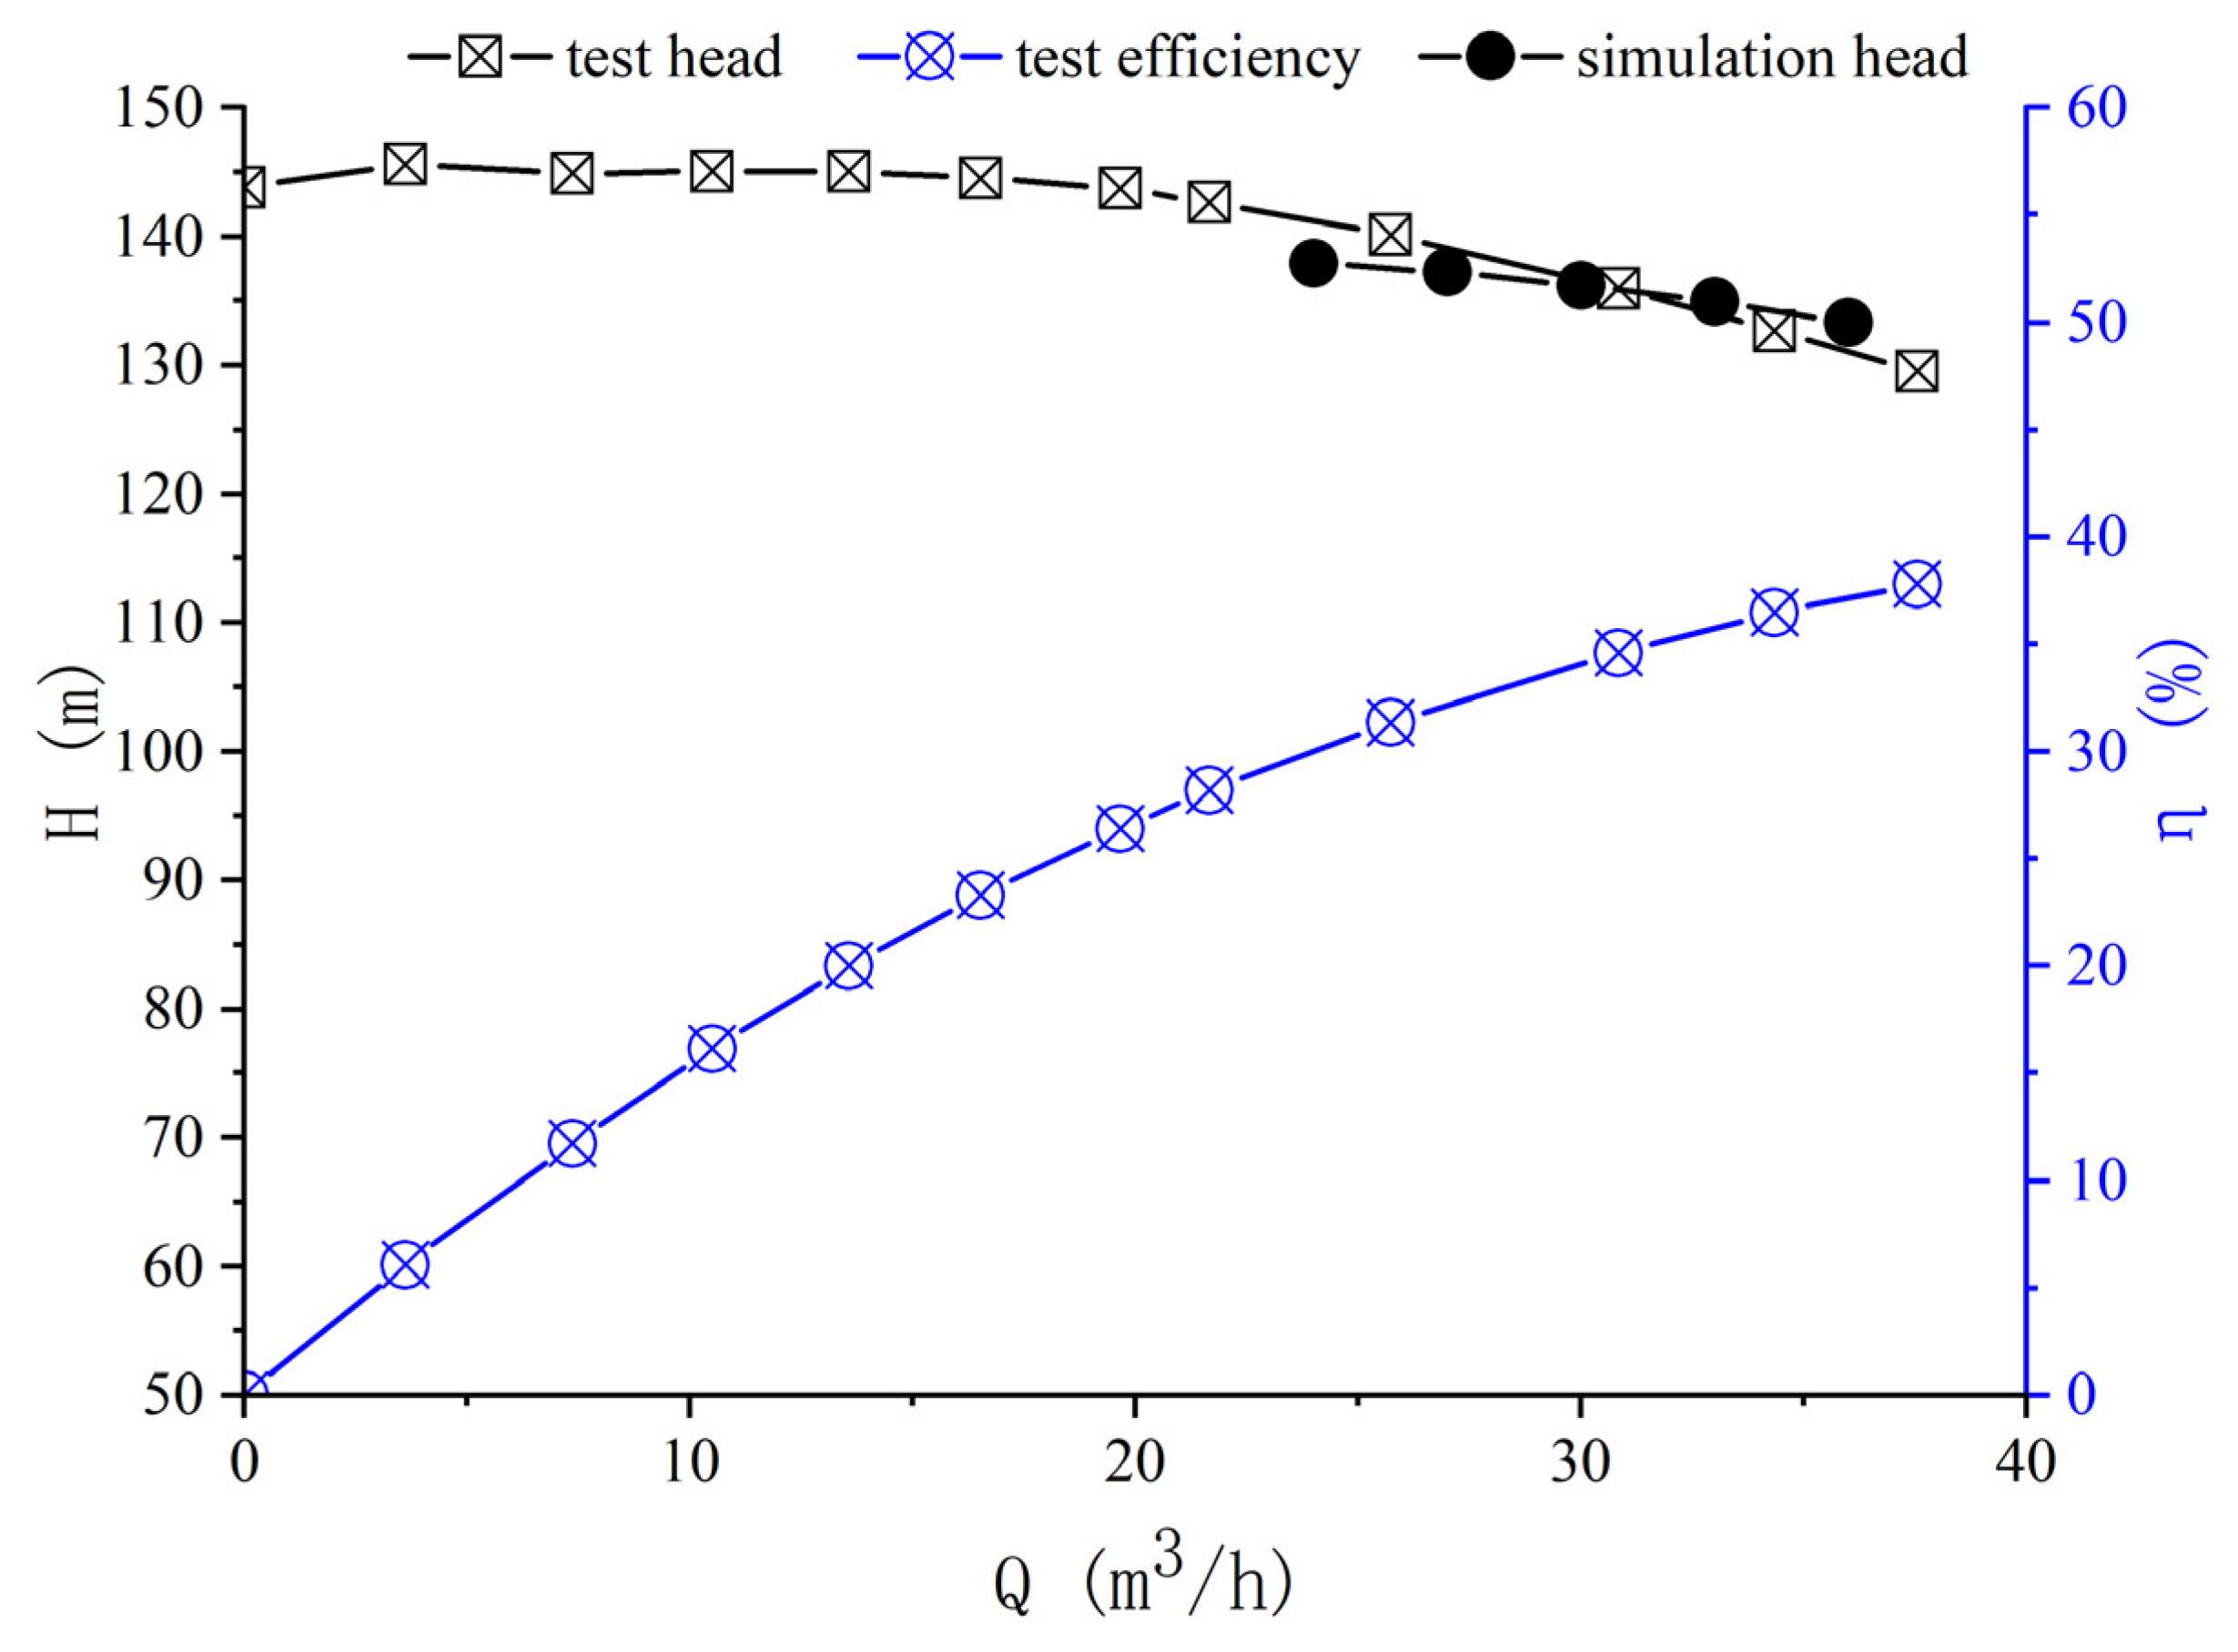
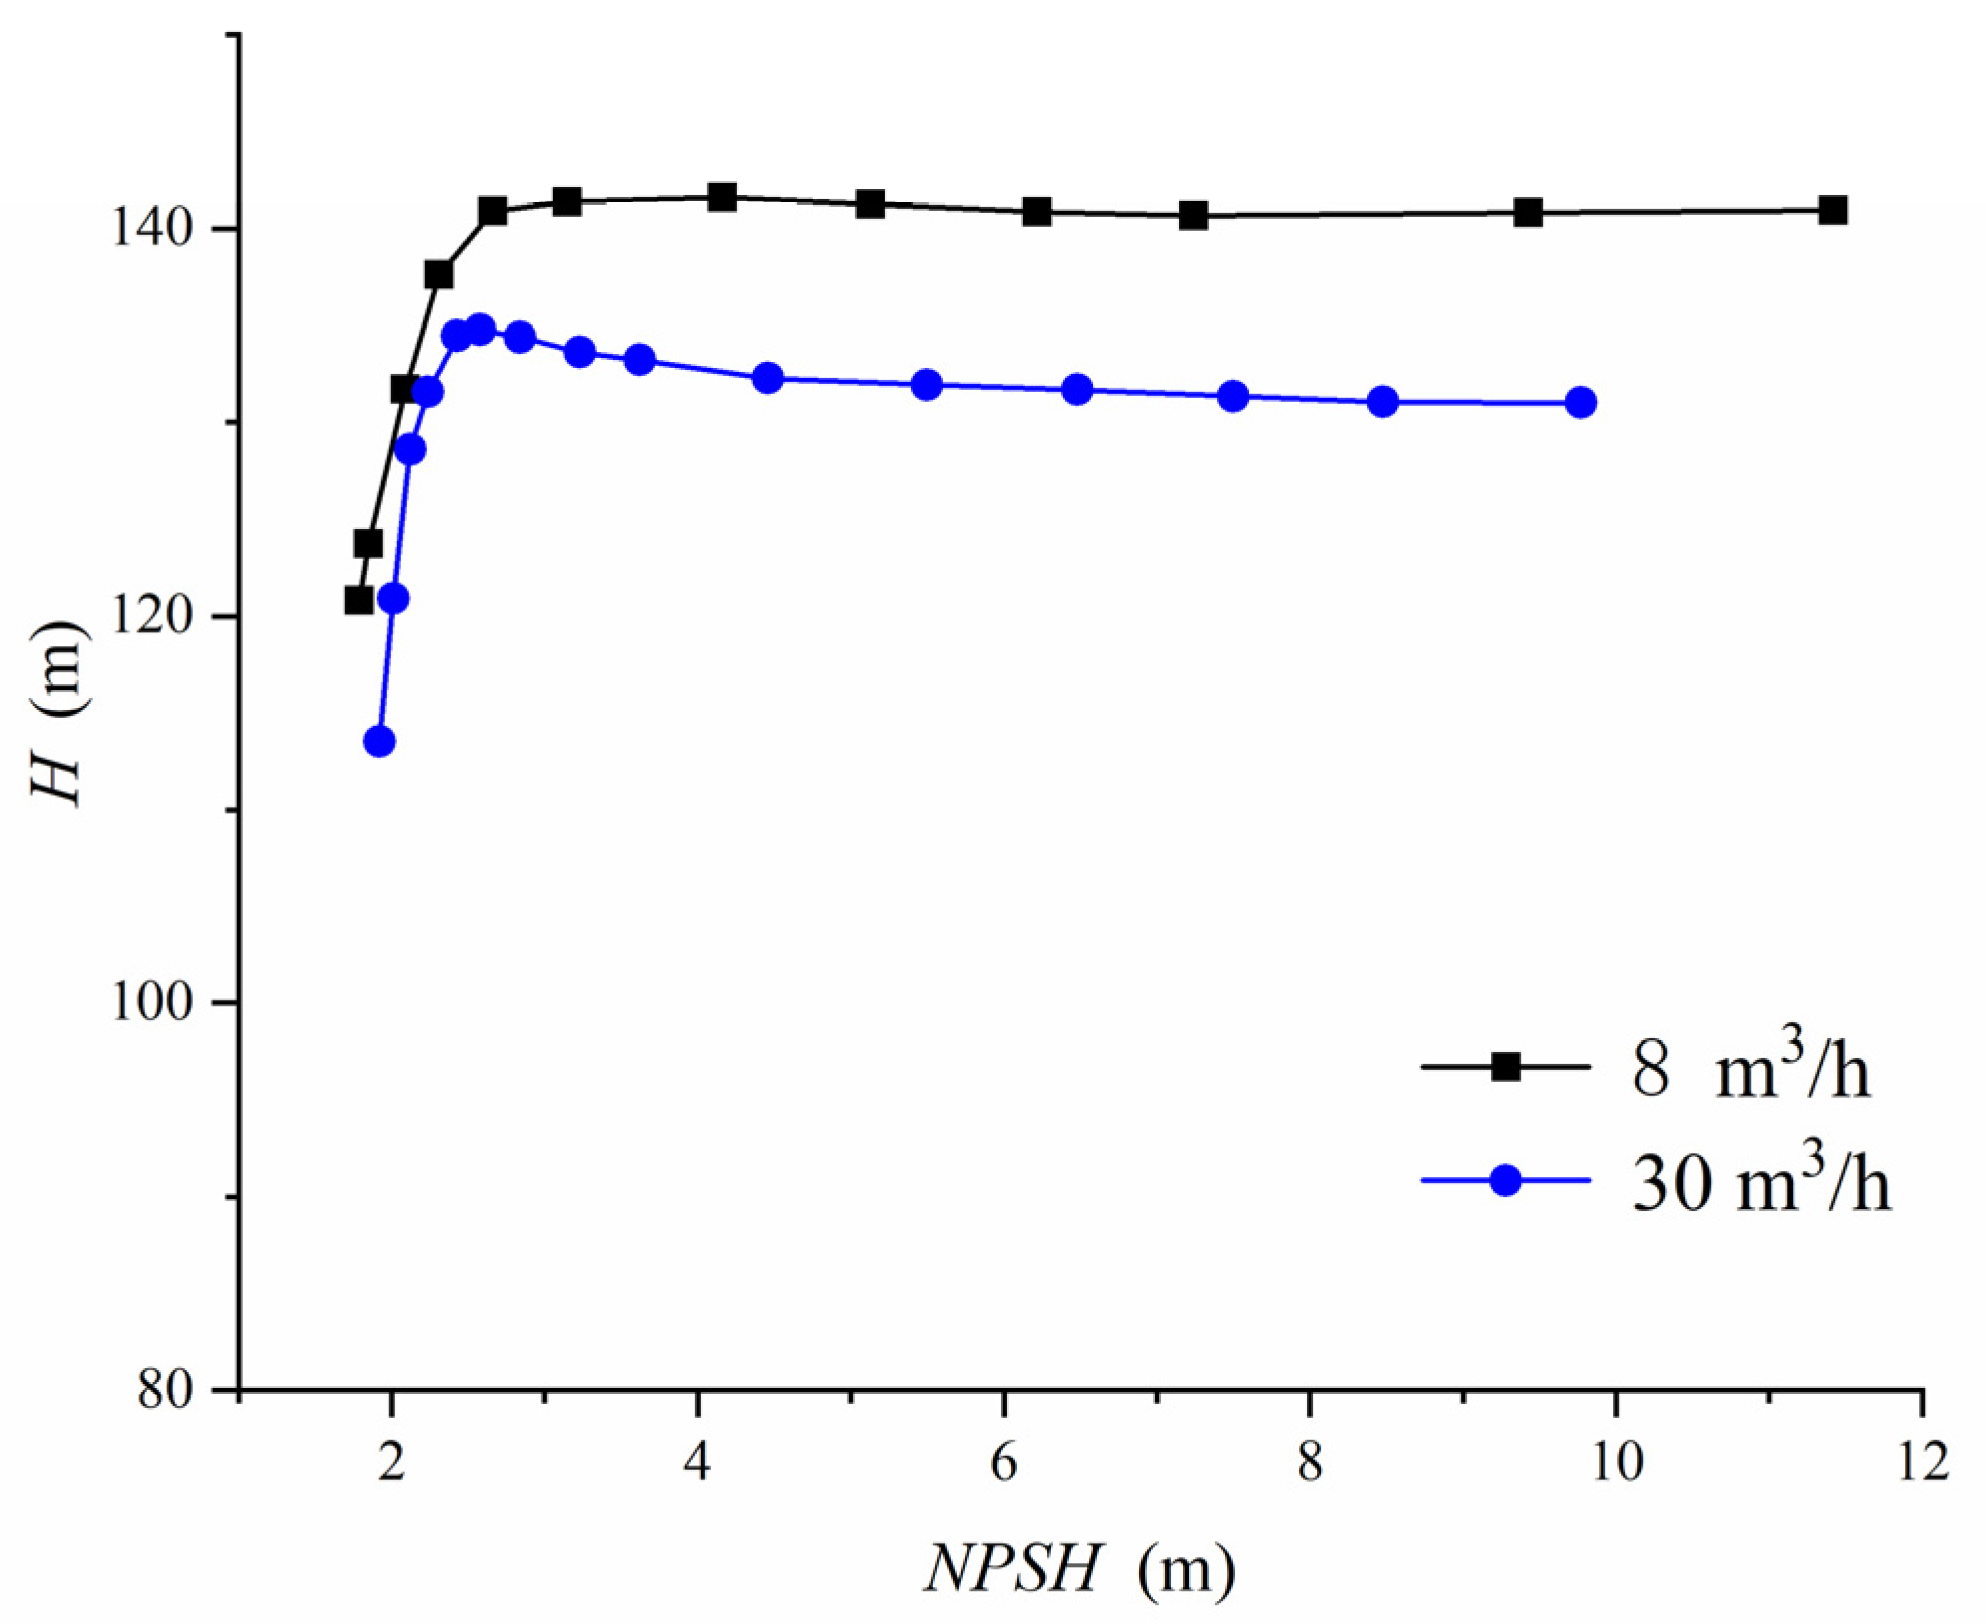
5.1. Performance Curve of High-Speed Magnetic Pump
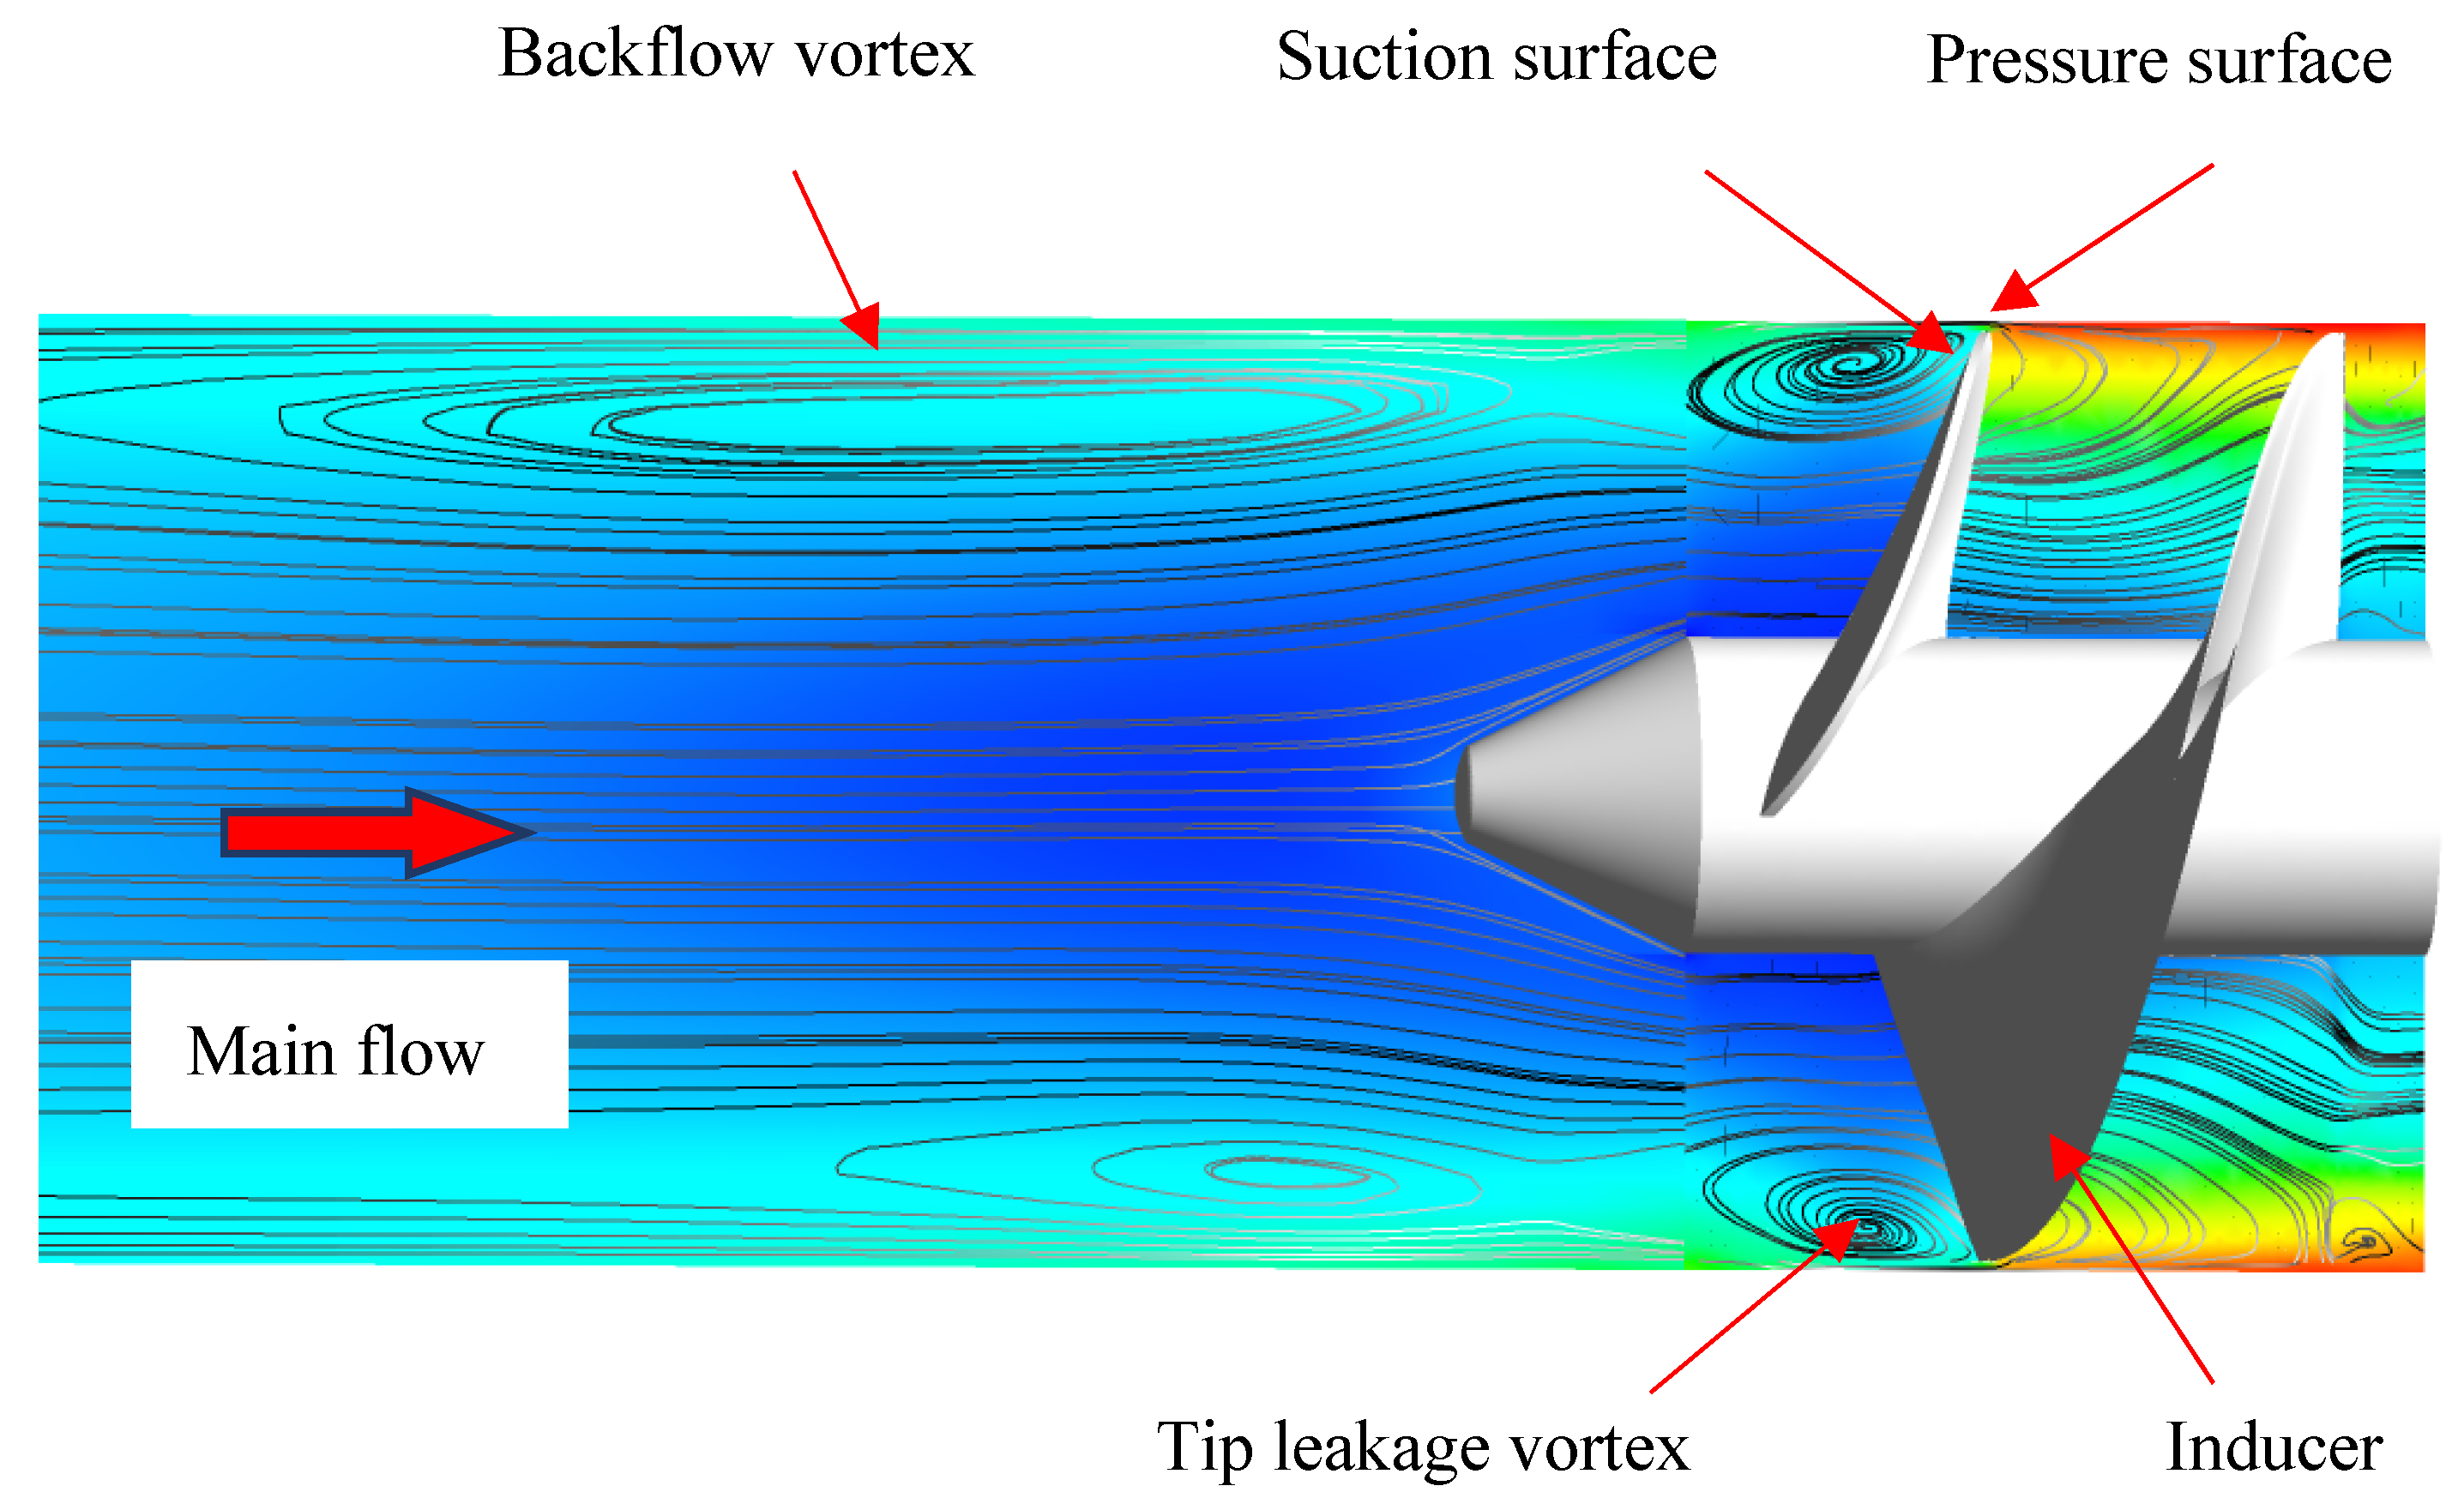
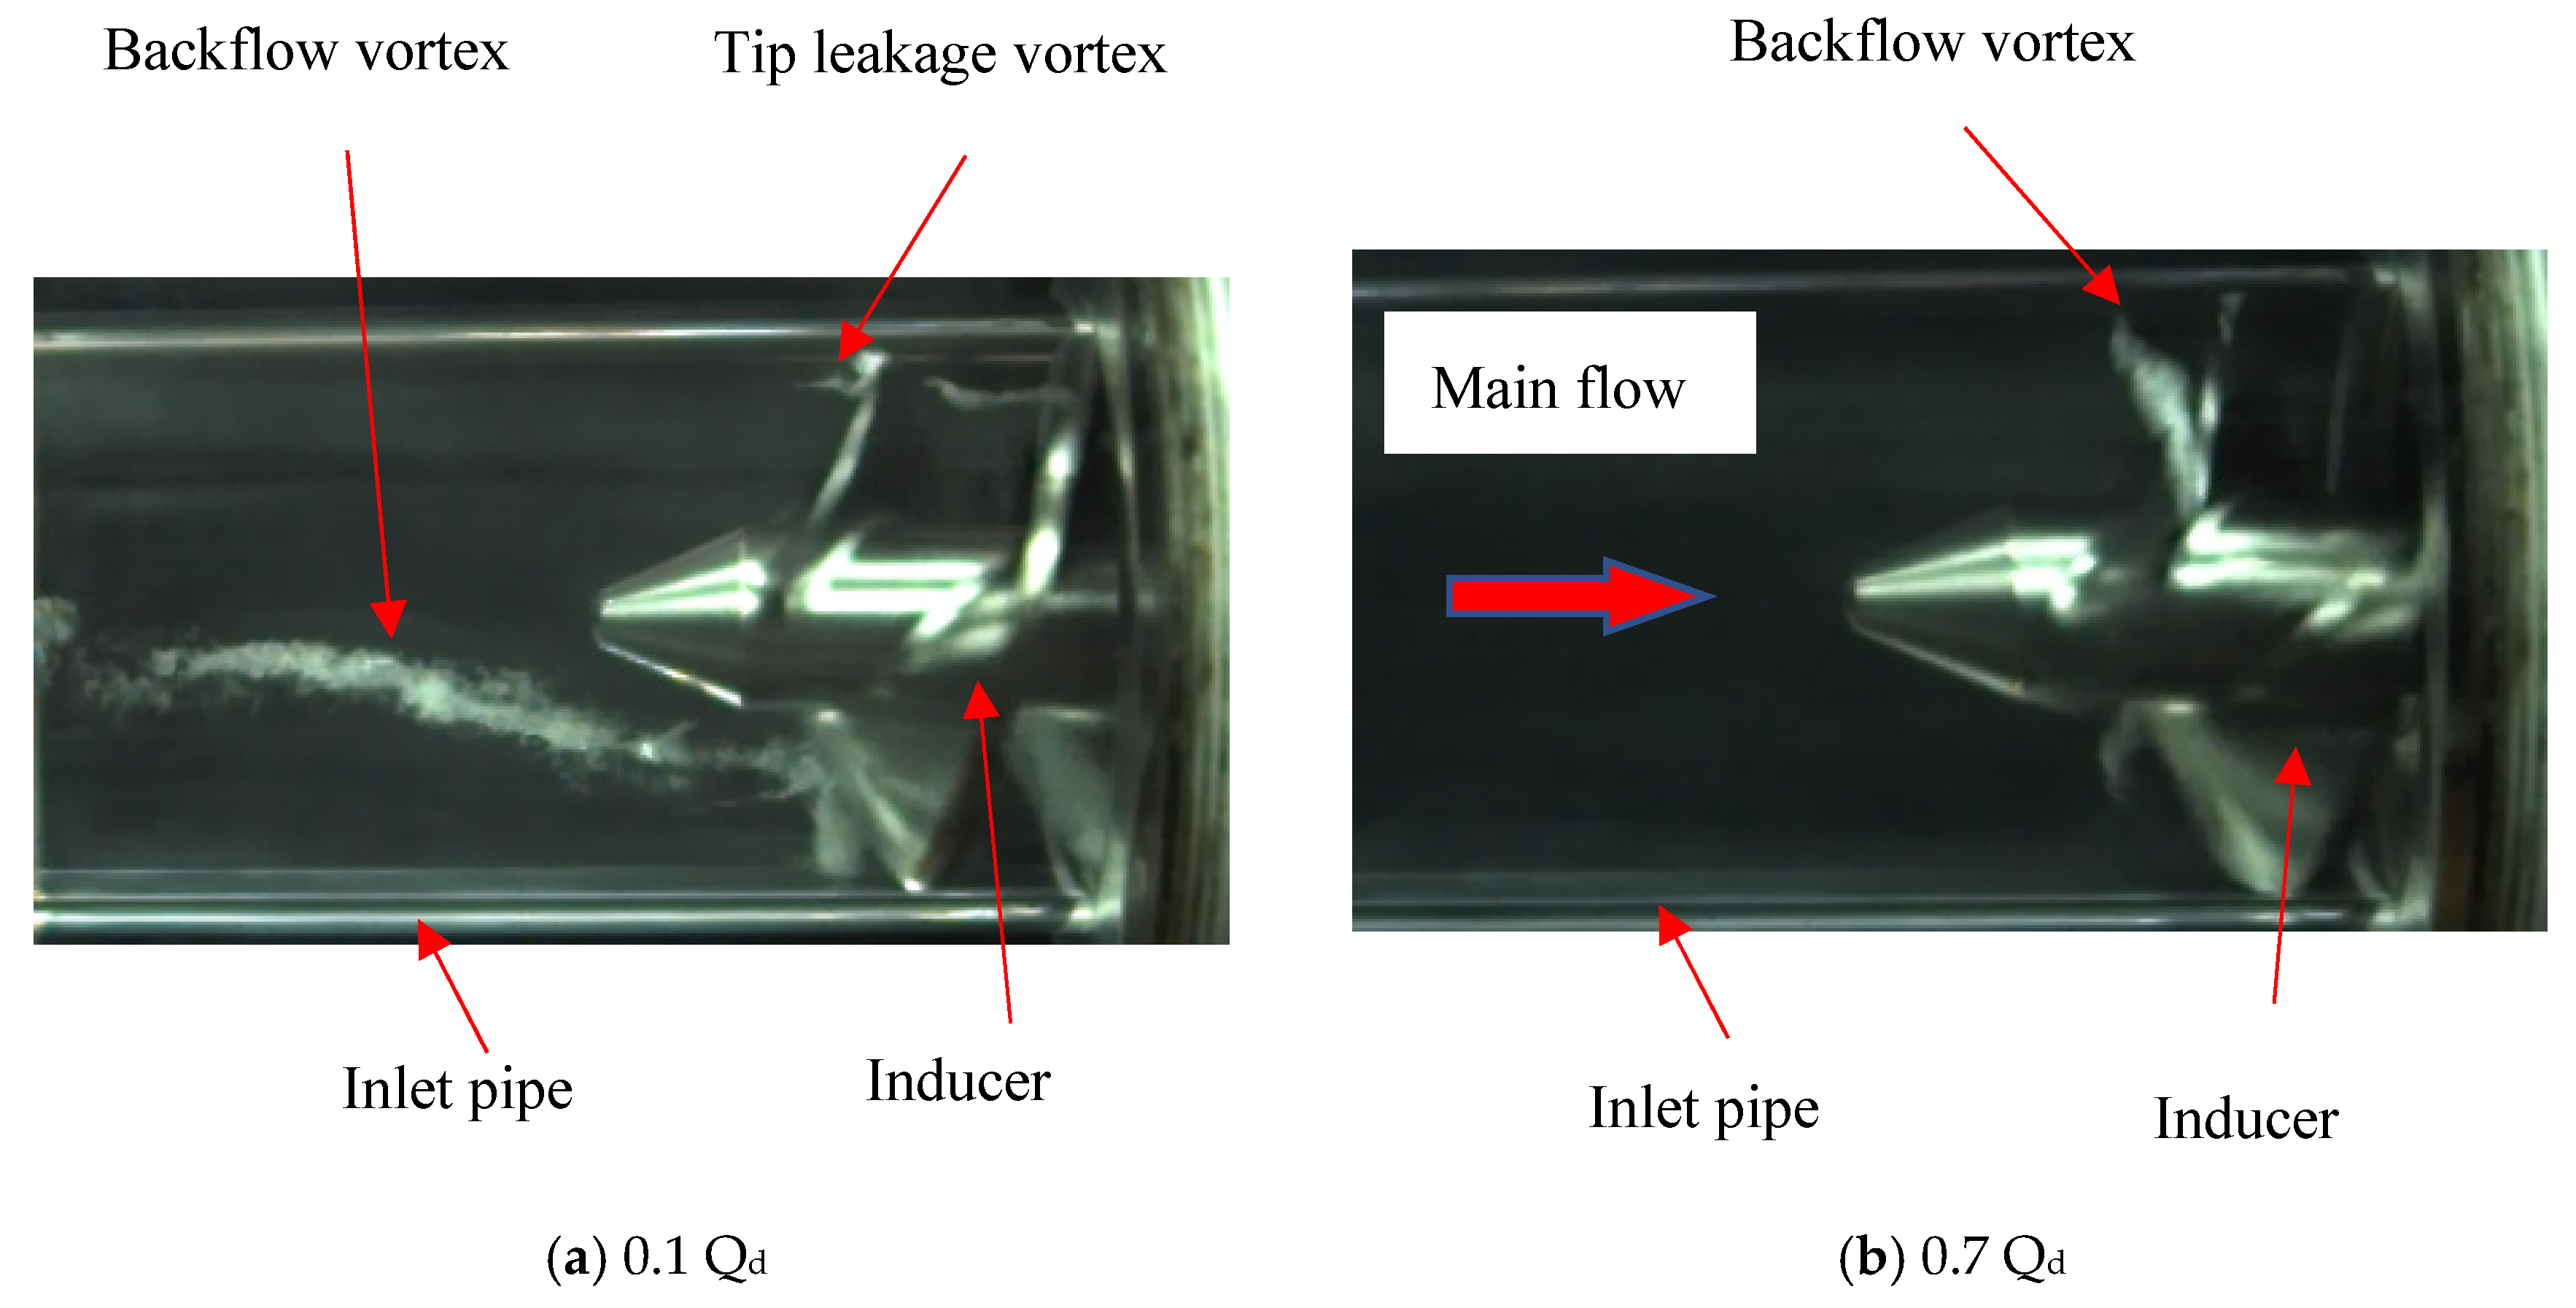
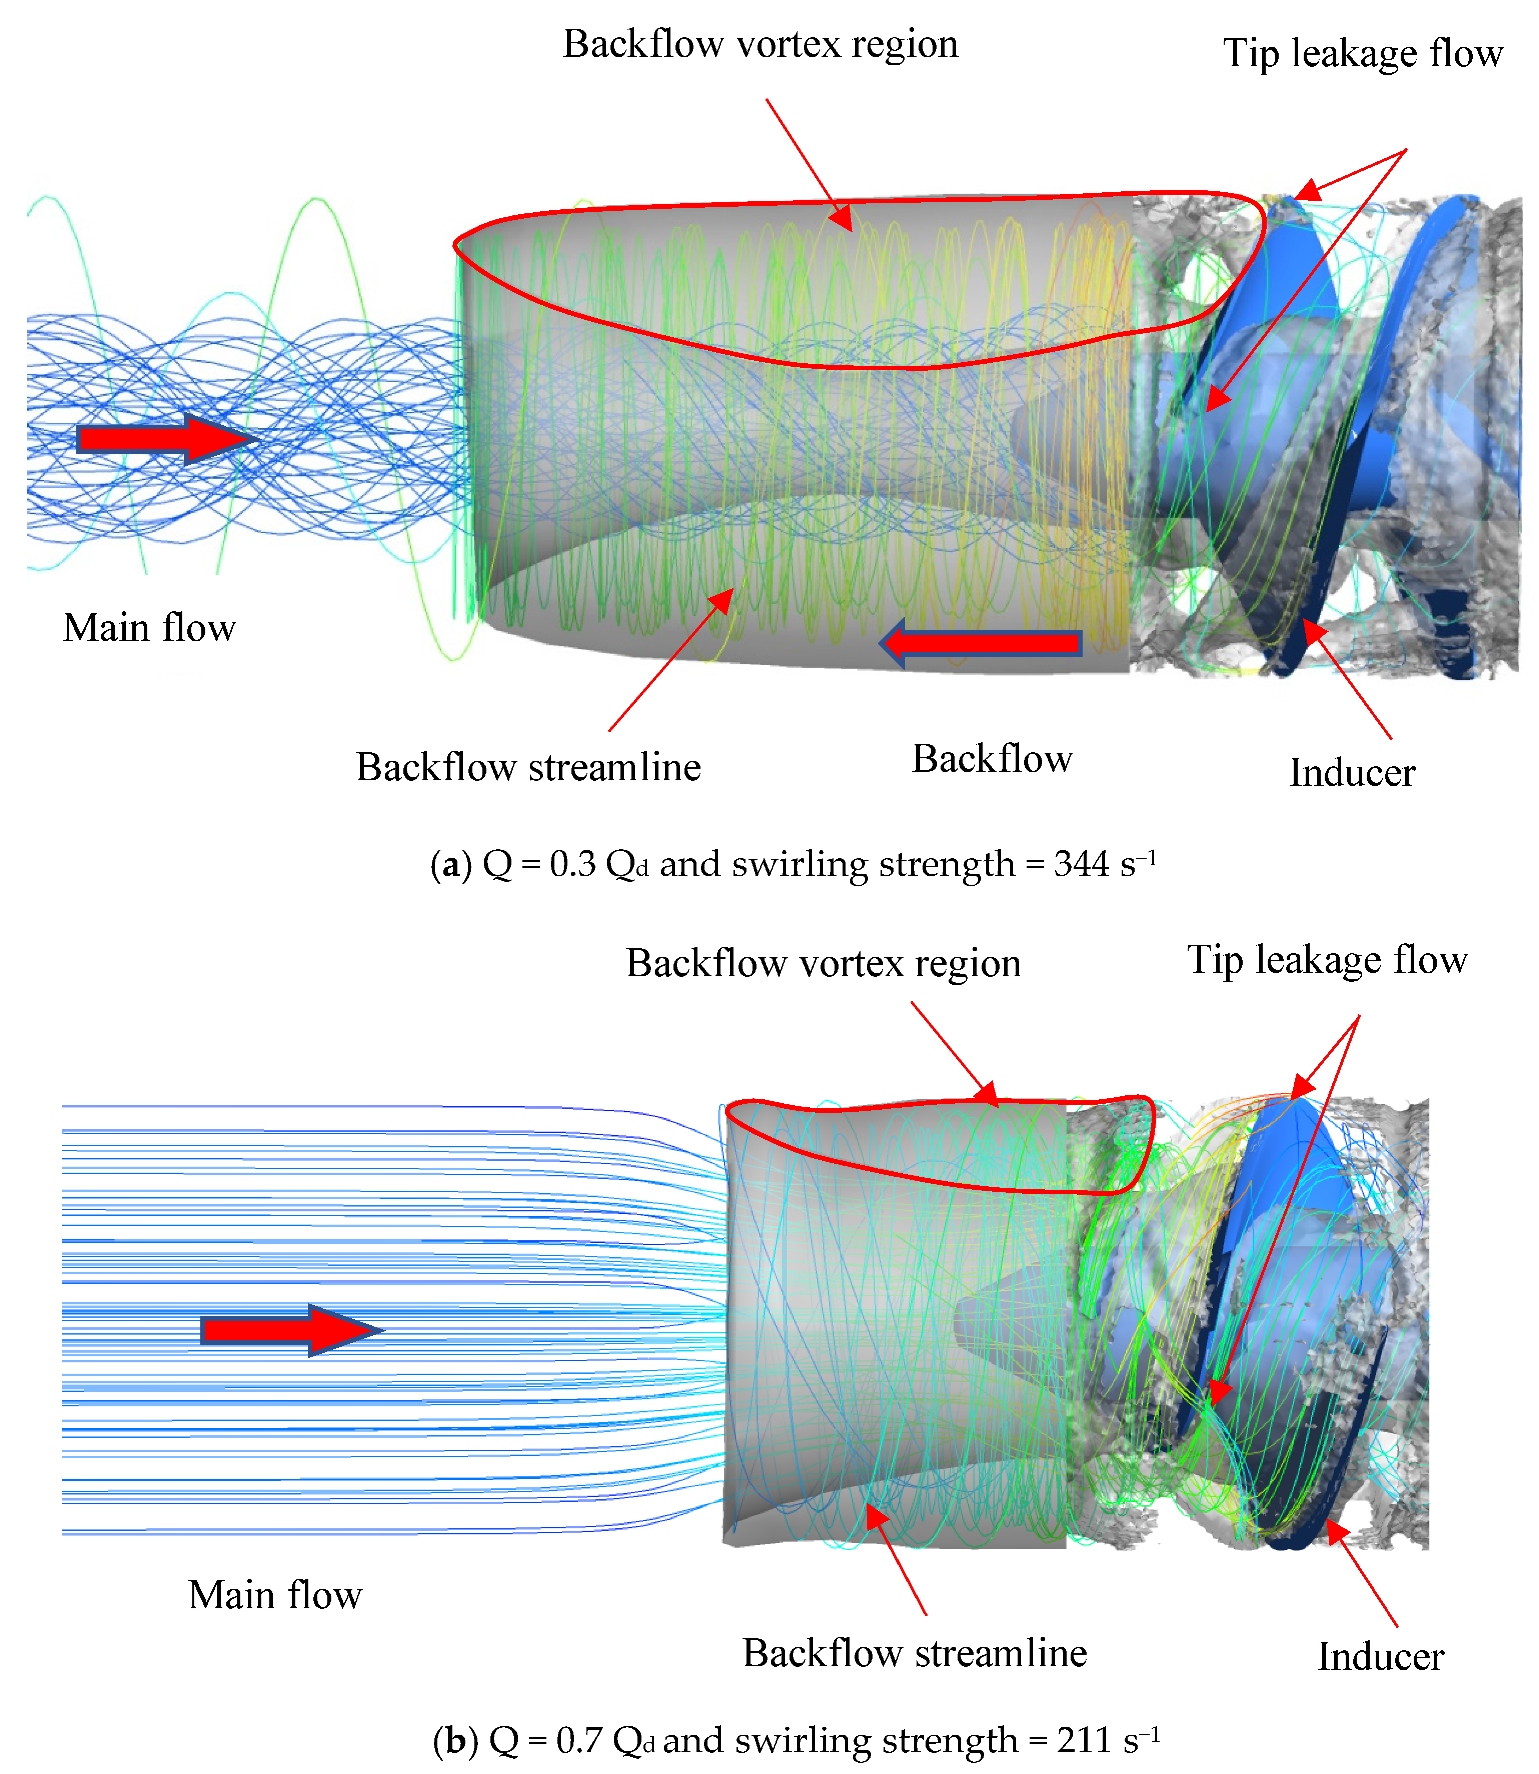
5.2. Analysis of the Backflow Vortex
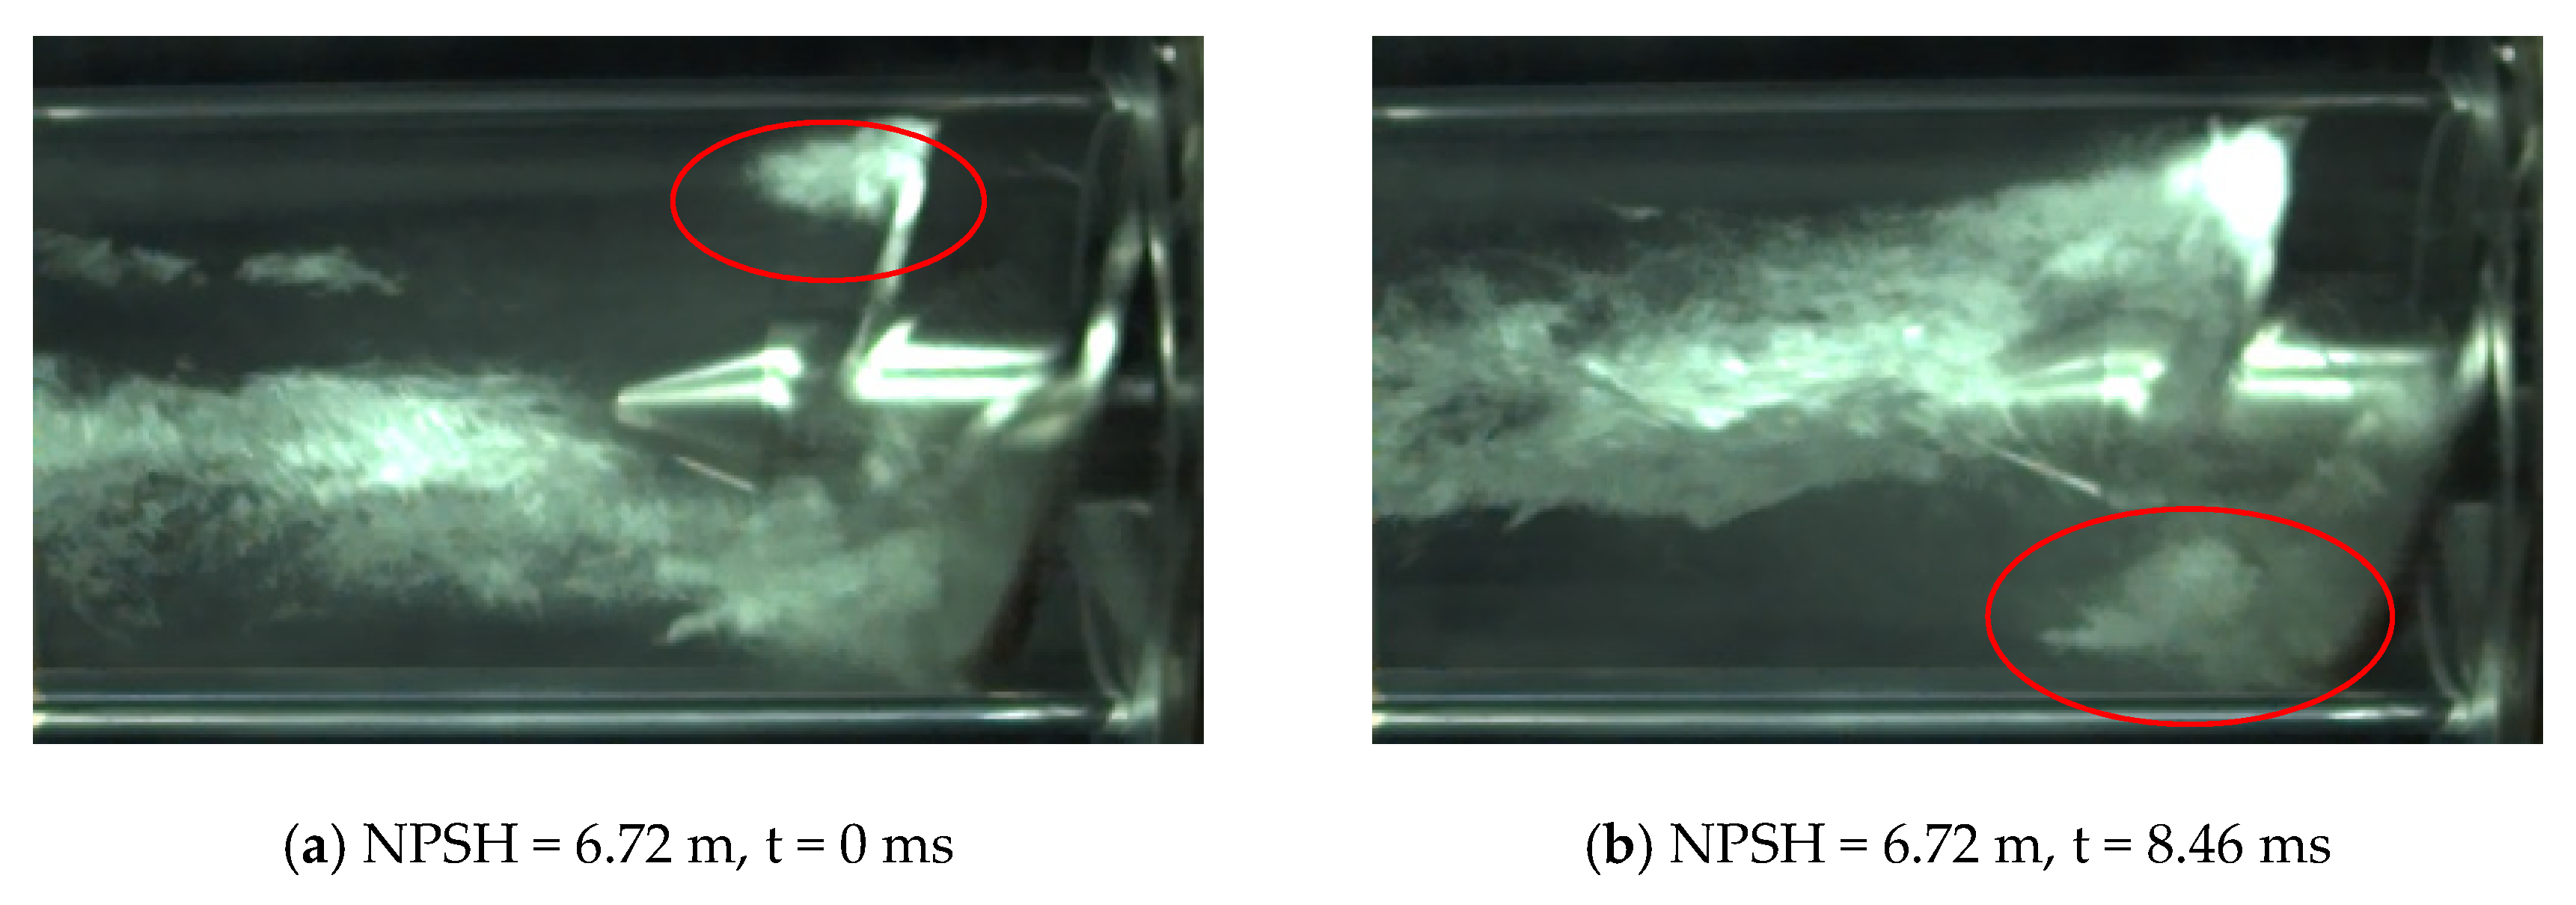
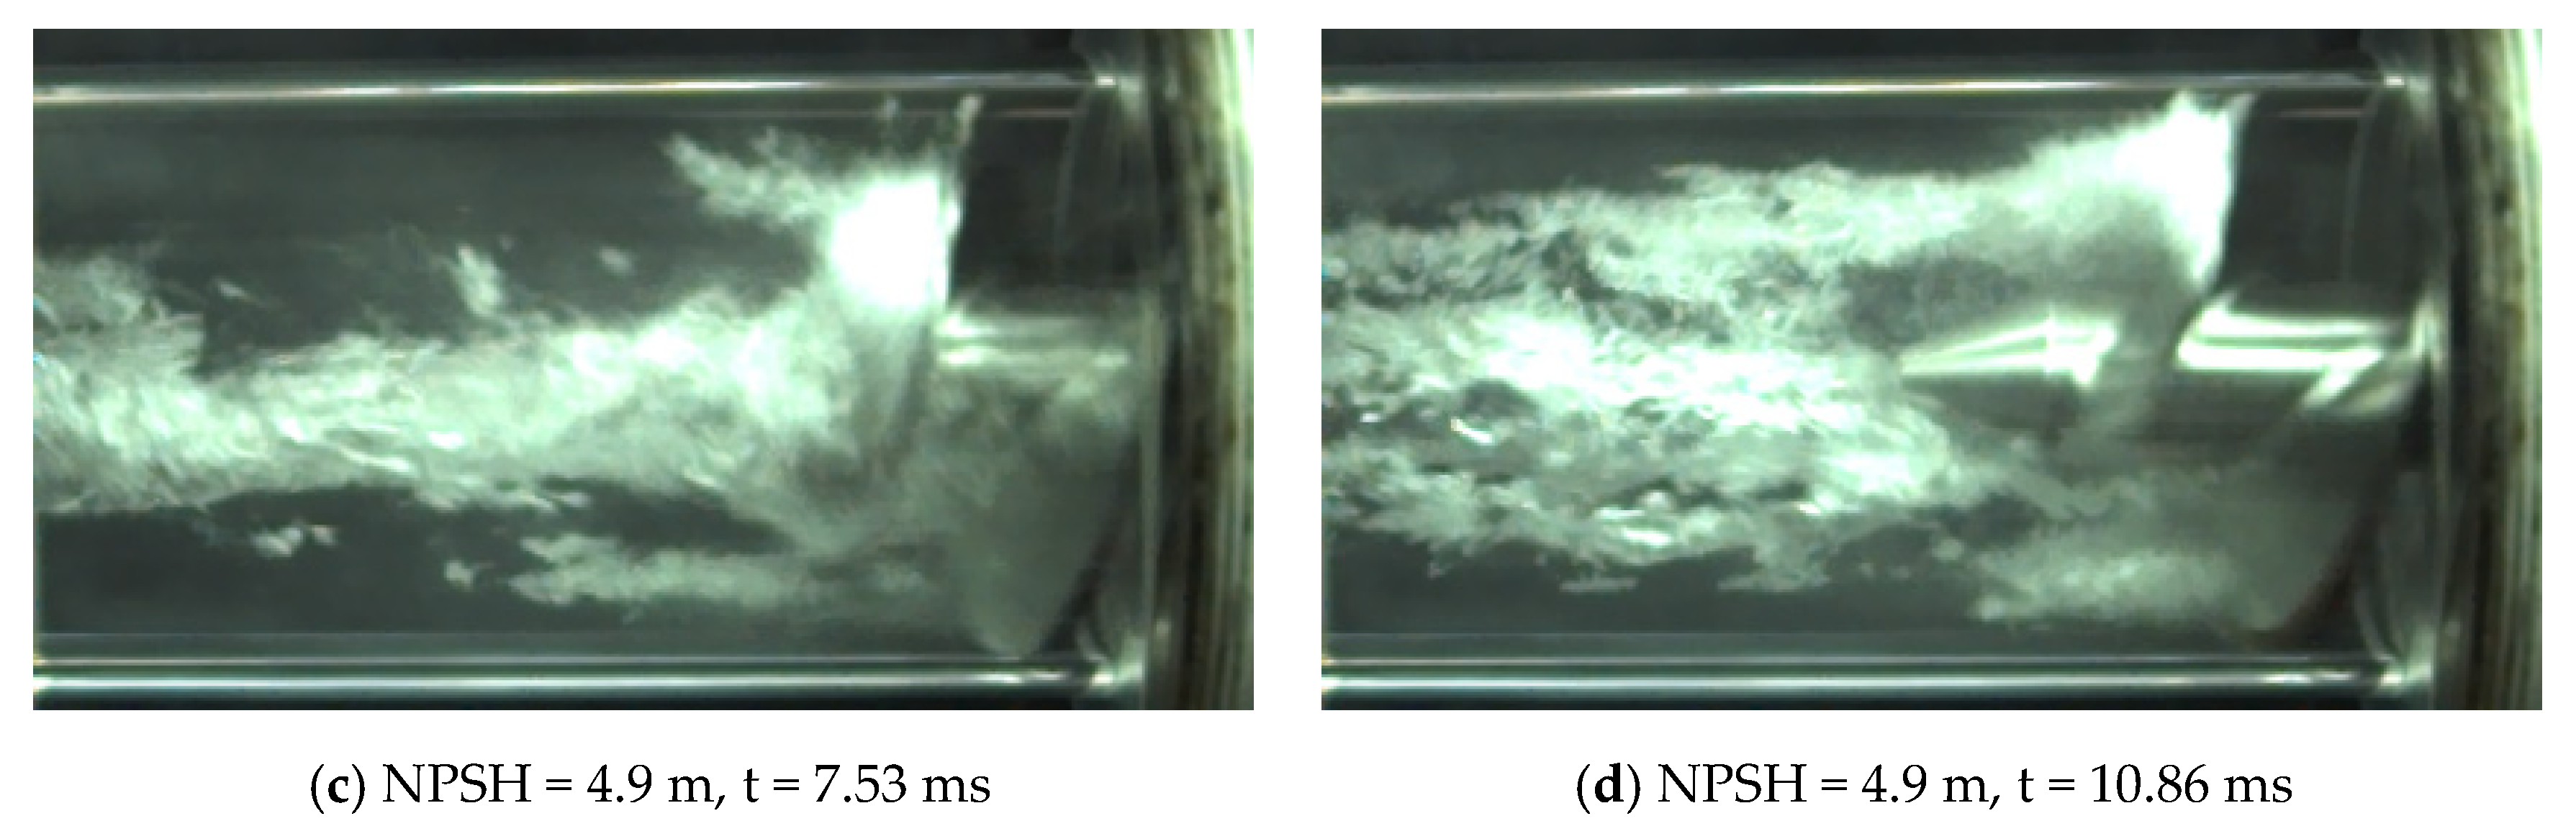
5.3. Cavitation Evolution in the Inducer with Different NPSH
5.4. Analysis of Cavitation Asymmetry
5.5. Comparison of Cavitation Performance
6. Conclusions
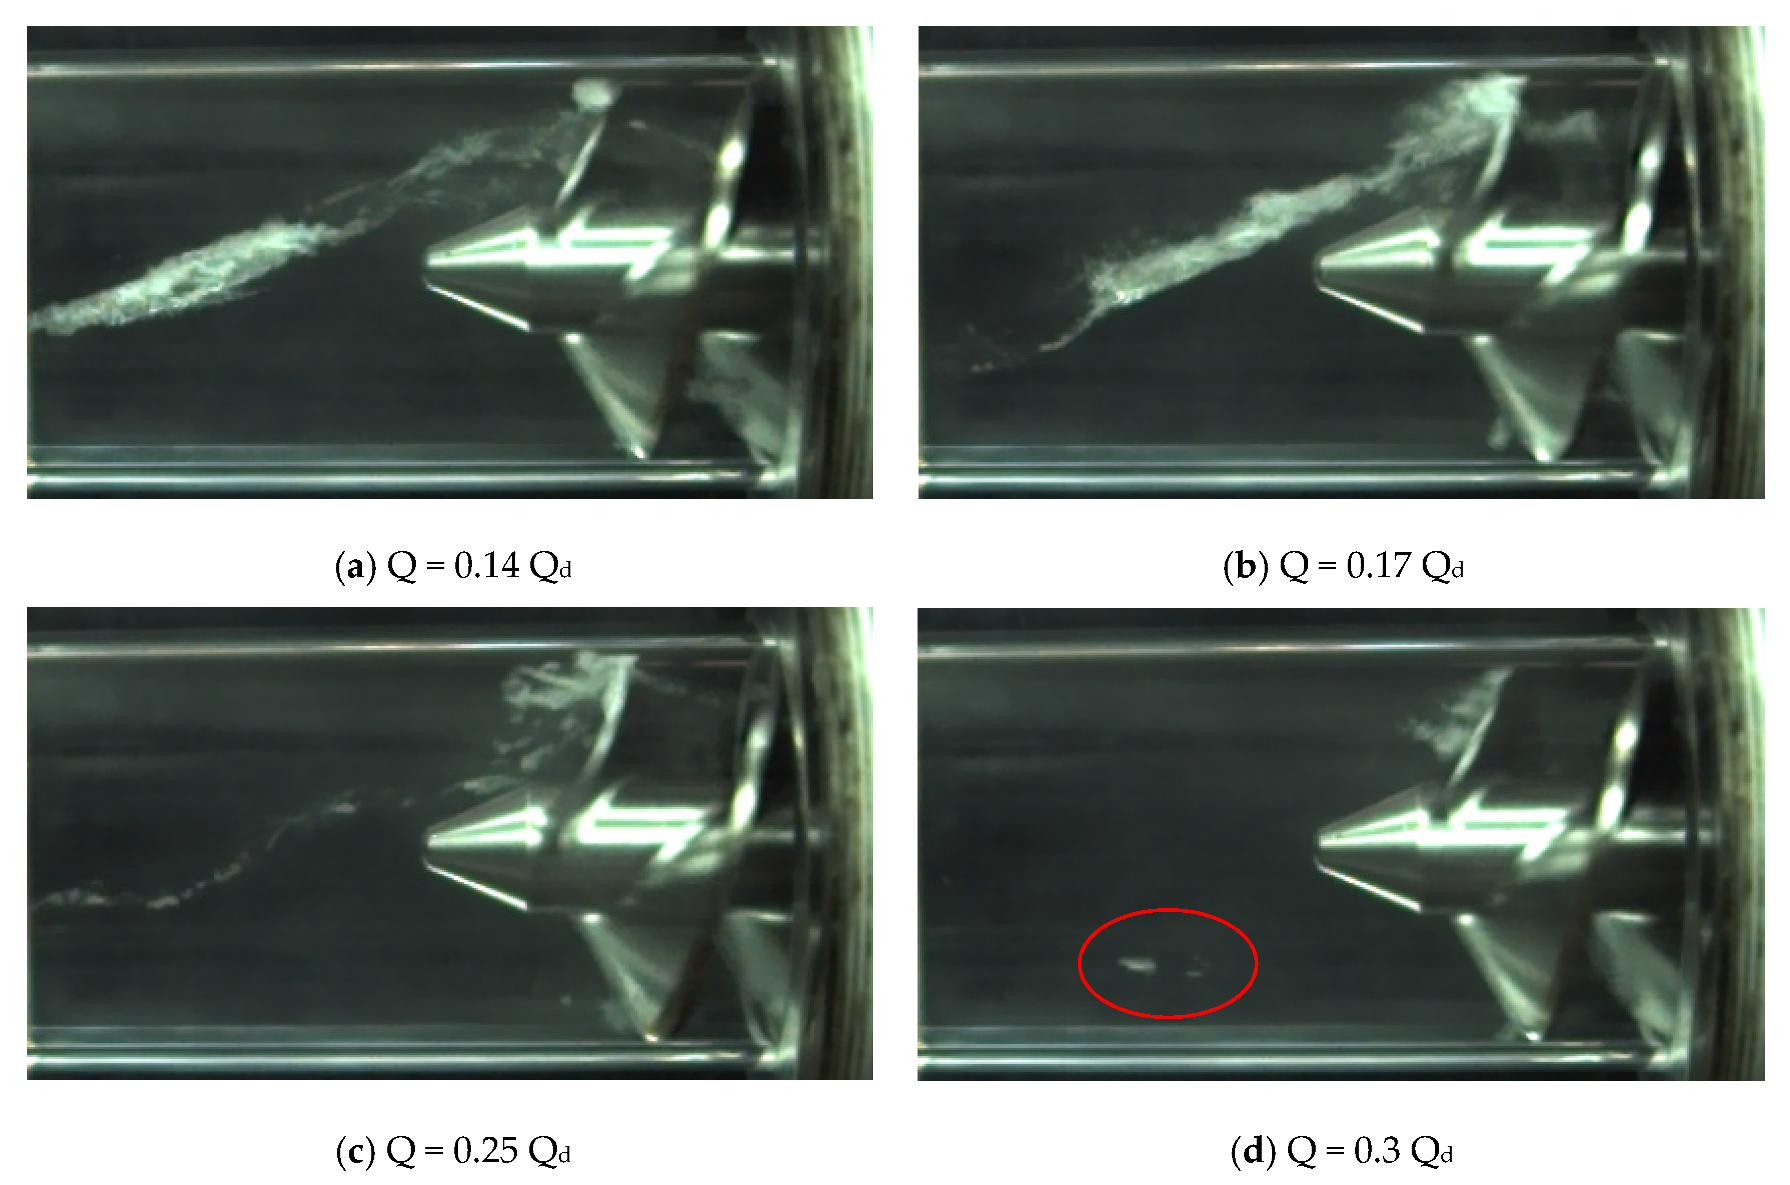
- A band-shaped vertex appeared in the inlet pipe when the inducer operated under extremely low flow rate, which was at odds with the designed condition.
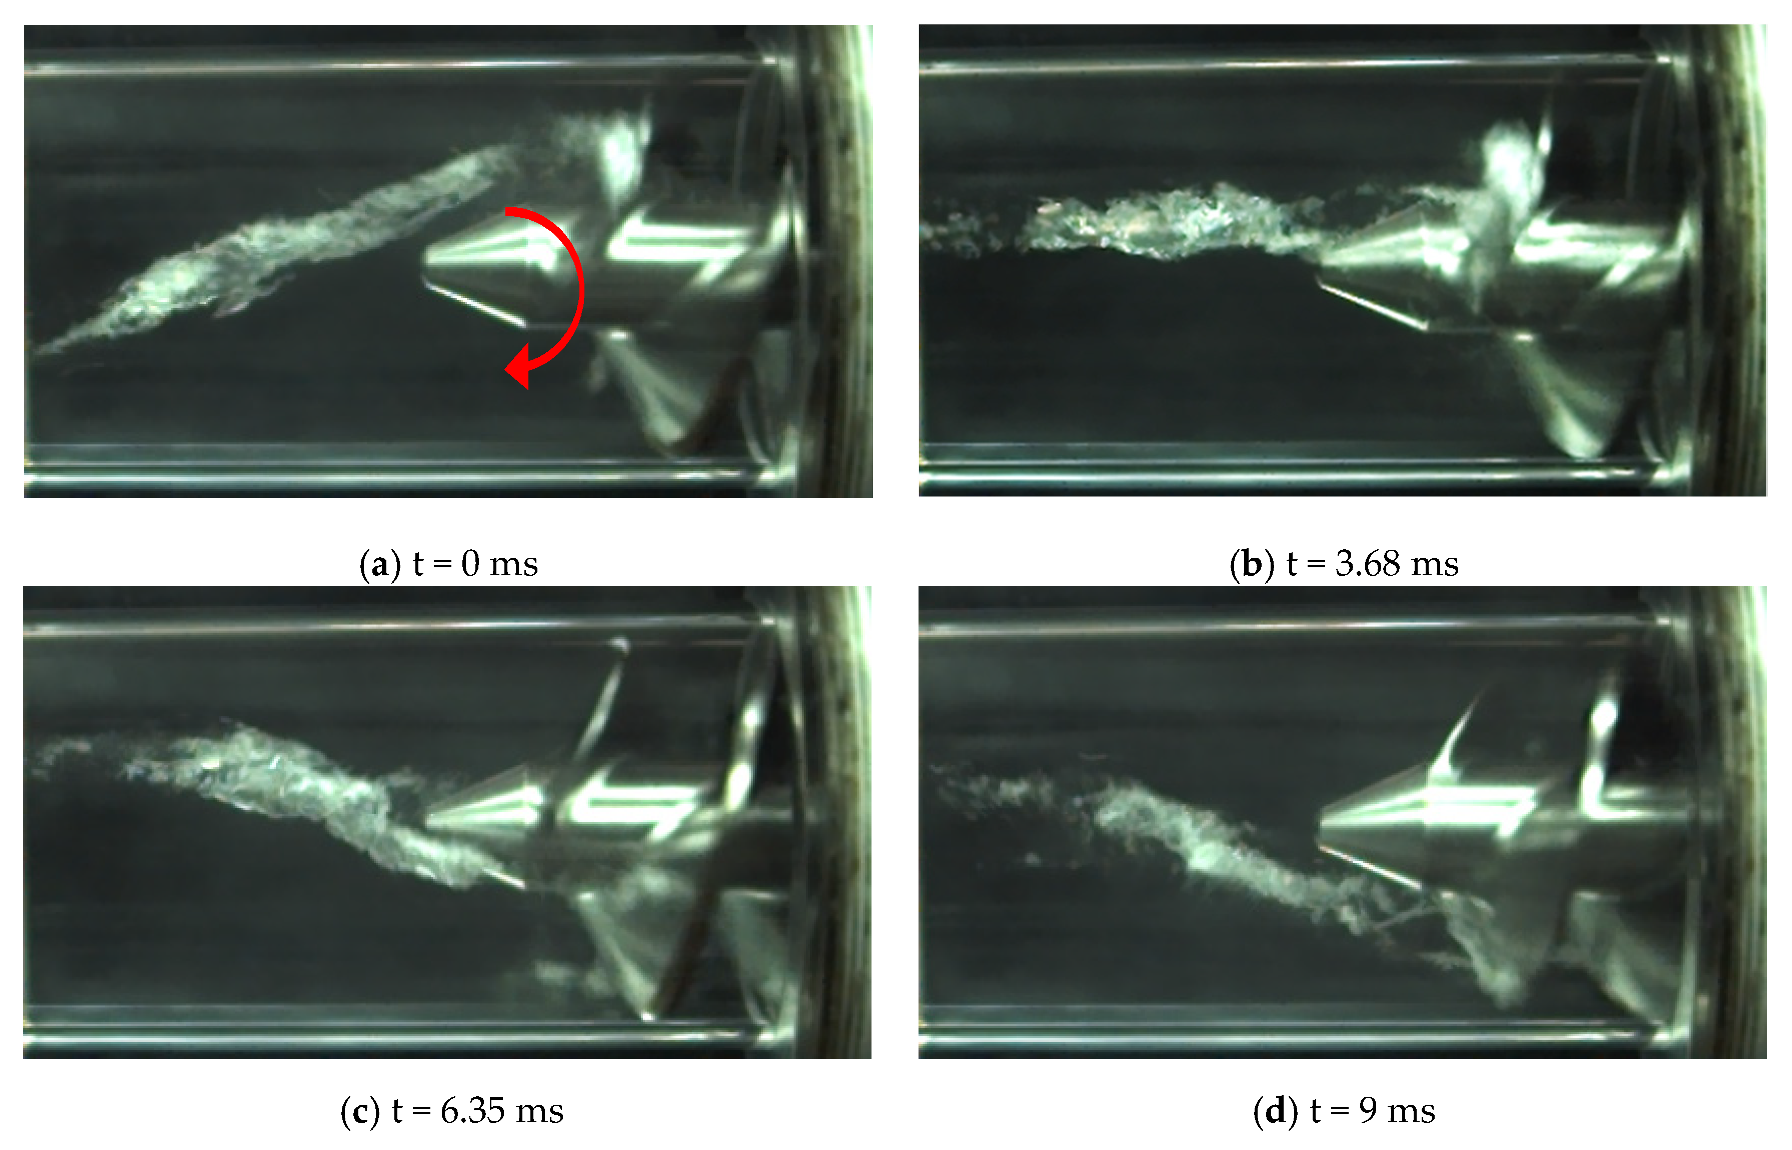
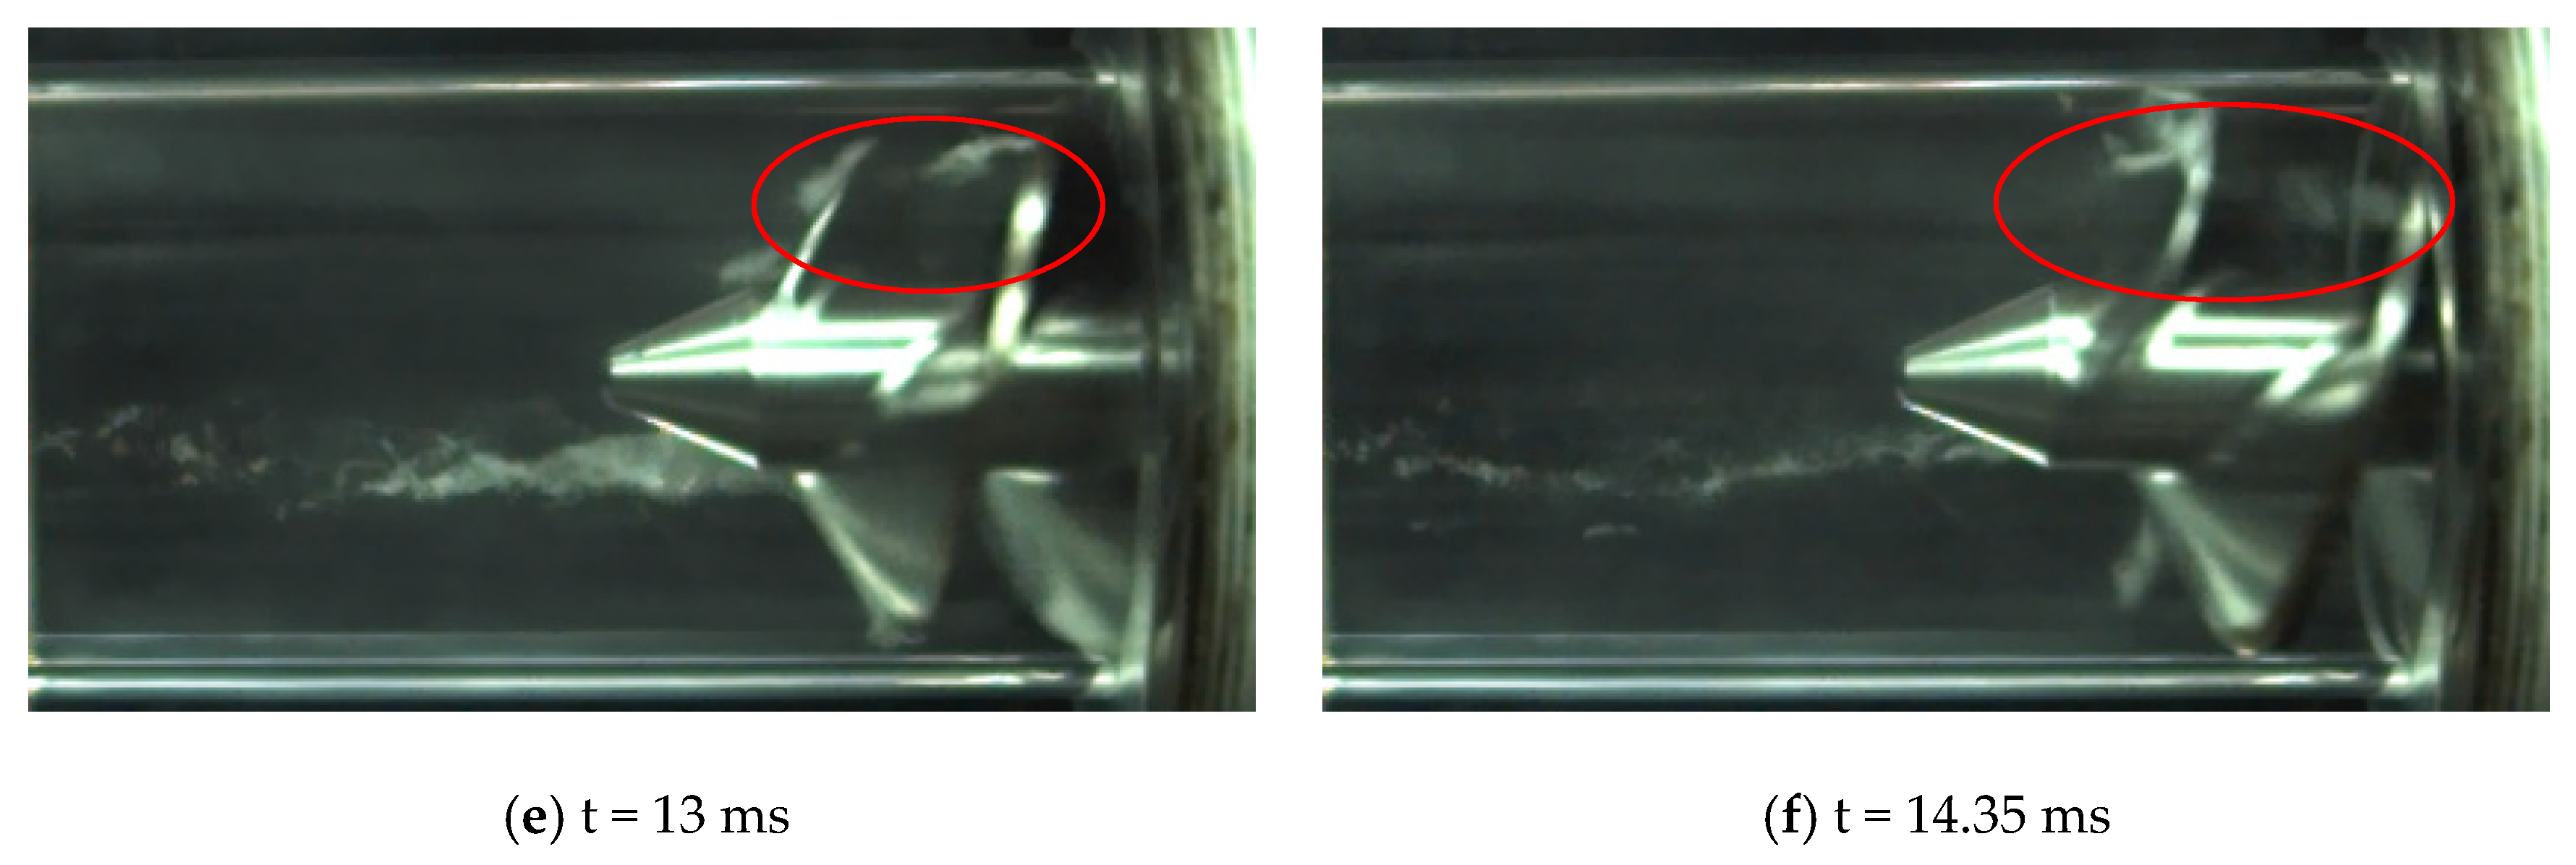
- The backflow vortex in the inlet pipe rotated with the inducer. Furthermore, the rotational speed of the backflow vortex was approximately half of the inducer.
- The volume of the backflow vortex decreased with the flow rate increase. When the flow rate increased to 0.3 Qd, the band-shaped vortex in the inlet pipe disappeared.
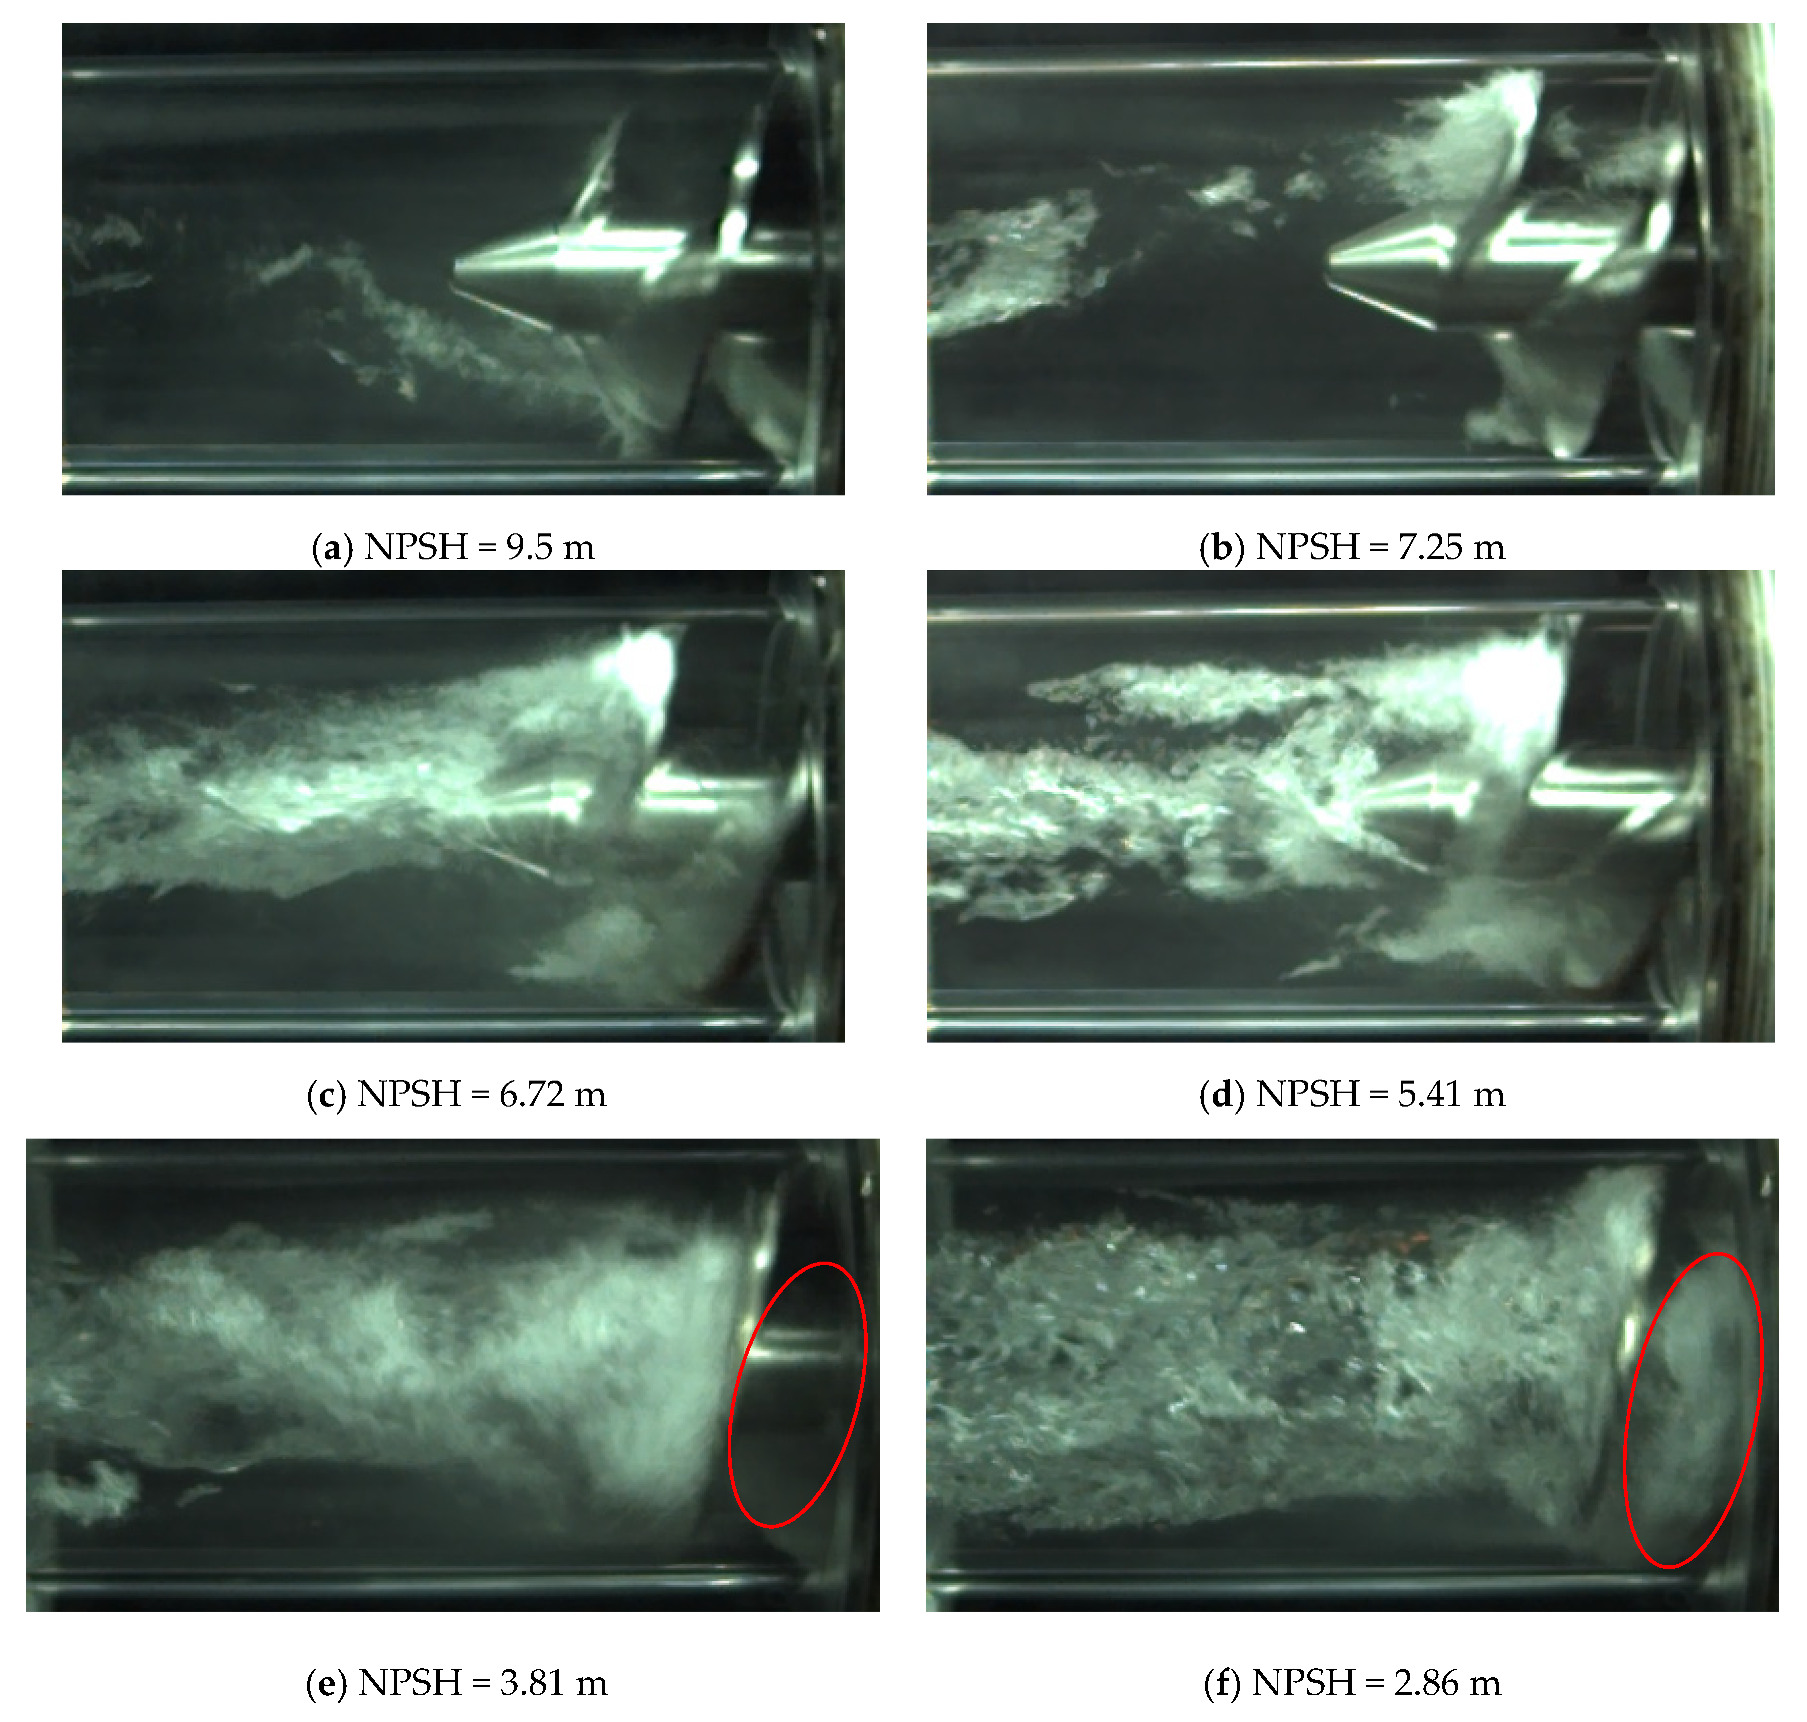
- When the flow rate was 0.27 Qd and NPSH was larger than 6.72 m, cavitation was in the initial stage and was asymmetrical; when NPSH dropped to 5.41 m, cavitation was in the developing stage and was less asymmetrical; when NPSH dropped to 3.81 m, cavitation evolved to the deteriorating stage, plenty of bubbles entered the main impeller, resulting in full-scale cavitation and rapid decline of pump performance.
- The cavitation performance under extremely low flow rate was worse than that of under design condition. The NPSH value of 0.27 Qd was 7.5% greater than that of under design condition.
Author Contributions
Funding
Conflicts of Interest
Nomenclature
| Q | Volume flow rate |
| Qd | Design volume flow rate |
| H | Head |
| NPSH | Net positive suction head |
| n | Rotate speed |
| P | Power |
| η | Efficiency |
| Pin | Static pressure at pump inlet |
| Pv | Vapor pressure |
| ρ | Fluid density |
| g | Gravitational acceleration |
| t | Time |
References
- Bakir, F.; Kouidri, S.; Noguera, R.; Rey, R. Experimental Analysis of an Axial Inducer Influence of the Shape of the Blade Leading Edge on the Per-formances in Cavitating Regime. J. Fluids Eng. 2003, 125, 293–301. [Google Scholar] [CrossRef]
- Coutier-Delgosha, O.; Caignaert, G.; Bois, G.; Leroux, J.-B. Influence of the Blade Number on Inducer Cavitating Behavior. J. Fluids Eng. 2012, 134, 081304. [Google Scholar] [CrossRef]
- Cheng, X.; Li, Y.; Zhang, S. Effect of inlet sweepback angle on the cavitation performance of an inducer. Eng. Appl. Comput. Fluid Mech. 2019, 13, 713–723. [Google Scholar] [CrossRef] [Green Version]
- Okita, K.; Ugajin, H.; Matsumoto, Y. Numerical Analysis of the Influence of the Tip Clearance Flows on the Unsteady Cavitating Flows in a Three-Dimensional Inducer. J. Hydrodyn. 2009, 21, 34–40. [Google Scholar] [CrossRef]
- Hong, S.-S.; Kim, J.-S.; Choi, C.-H.; Kim, J. Effect of Tip Clearance on the Cavitation Performance of a Turbopump Inducer. J. Propuls. Power 2006, 22, 174–179. [Google Scholar] [CrossRef]
- Kim, S.; Choi, C.; Kim, J.; Park, J.; Baek, J. Tip Clearance Effects on Cavitation Evolution and Head Breakdown in Turbopump Inducer. J. Propuls. Power 2013, 29, 1357–1366. [Google Scholar] [CrossRef]
- Franc, J.-P.; Rebattet, C.; Coulon, A. An Experimental Investigation of Thermal Effects in a Cavitating Inducer. J. Fluids Eng. 2004, 126, 716–723. [Google Scholar] [CrossRef]
- Ehrlich, D.A.; Murdock, J.W. A Dimensionless Scaling Parameter for Thermal Effects on Cavitation in Turbopump Inducers. J. Fluids Eng. 2015, 137, 041103. [Google Scholar] [CrossRef]
- Guo, X.; Zhu, Z.; Cui, B.; Li, Y. Effects of the short blade locations on the anti-cavitation performance of the splitter-bladed inducer and the pump. Chin. J. Chem. Eng. 2015, 23, 1095–1101. [Google Scholar] [CrossRef]
- Choi, Y.-D.; Kurokawa, J.; Imamura, H. Suppression of Cavitation in Inducers by J-Grooves. J. Fluids Eng. 2006, 129, 15–22. [Google Scholar] [CrossRef]
- Pace, G.; Valentini, D.; Pasini, A.; Hadavandi, R.; D’Agostino, L. Analysis of Flow Instabilities on a Three-Bladed Axial Inducer in Fixed and Rotating Frames. J. Fluids Eng. 2018, 141. [Google Scholar] [CrossRef] [Green Version]
- Lettieri, C.; Spakovszky, Z.; Jackson, D.; Schwille, J. Characterization of Cavitation Instabilities in a Four-Bladed Turbopump Inducer. J. Propuls. Power 2018, 34, 510–520. [Google Scholar] [CrossRef]
- Xiang, L.; Tan, Y.; Chen, H.; Xu, K. Experimental investigation of cavitation instabilities in inducer with different tip clearances. Chin. J. Aeronaut. 2021, 34, 168–177. [Google Scholar] [CrossRef]
- Tsujimoto, Y.; Yoshida, Y.; Maekawa, Y.; Watanabe, S.; Hashimoto, T. Observations of Oscillating Cavitation of an Inducer. J. Fluids Eng. 1997, 119, 775–781. [Google Scholar] [CrossRef]
- Ito, Y.; Sato, Y.; Nagasaki, T. Theoretical Analyses of the Number of Backflow Vortices on an Axial Pump or Compressor. J. Fluids Eng. 2020, 142. [Google Scholar] [CrossRef] [Green Version]
- Yamanishi, N.; Fukao, S.; Qiao, X.; Kato, C.; Tsujimoto, Y. LES Simulation of Backflow Vortex Structure at the Inlet of an Inducer. J. Fluids Eng. 2007, 129, 587–594. [Google Scholar] [CrossRef]
- Tani, N.; Yamanishi, N.; Tsujimoto, Y. Influence of Flow Coefficient and Flow Structure on Rotational Cavitation in Inducer. J. Fluids Eng. 2012, 134, 021302. [Google Scholar] [CrossRef]
- Choi, C.-H.; Kim, J. Study on the Cavitating Flows in a Turbopump Inducer. J. Propuls. Power 2015. [Google Scholar] [CrossRef]
- Cui, B.; Cai, M.; Li, Y. Influence of air–water two-phase flow on the performance of a high-speed inducer. Proc. Inst. Mech. Eng. Part E J. Process. Mech. Eng. 2020, 234, 588–599. [Google Scholar] [CrossRef]
- Huan, Y.-Y.; Liu, Y.-Y.; Li, X.-J.; Zhu, Z.-C.; Qu, J.-T.; Zhe, L.; Han, A.-D. Experimental and numerical investigations of cavitation evolution in a high-speed centrifugal pump with inducer. J. Hydrodyn. 2021, 33, 140–149. [Google Scholar] [CrossRef]
- Ito, Y.; Tsunoda, A.; Kurishita, Y.; Kitano, S.; Nagasaki, T. Experimental Visualization of Cryogenic Backflow Vortex Cavitation with Thermodynamic Effects. J. Propuls. Power 2016, 32, 71–82. [Google Scholar] [CrossRef] [Green Version]
- Zhang, D.; Shi, W.; Pan, D.; Dubuisson, M. Numerical and Experimental Investigation of Tip Leakage Vortex Cavitation Patterns and Mechanisms in an Axial Flow Pump. J. Fluids Eng. Trans. ASME 2015, 137, 121103. [Google Scholar] [CrossRef]
- Guo, X.; Zhu, Z.; Cui, B.; Huang, Y. Anti-cavitation performance of a splitter-bladed inducer under different flow rates and different inlet pres-sures. Sci. China Technol. Sci. 2015, 58, 2131–2138. [Google Scholar] [CrossRef]
- Zwart, P.J.; Gerber, A.G.; Belamri, T. A two-phase flow model for predicting cavitation dynamics. In Proceedings of the Fifth In-ternational Conference on Multiphase Flow, Yokohama, Japan, 30 May–4 June 2004; Volume 152. [Google Scholar]
- Al-Obaidi, A.R. Investigation of the influence of various numbers of impeller blades on internal flow field analysis and the pressure pulsation of an axial pump based on transient flow behavior. Heat Transf. 2020, 49, 2000–2024. [Google Scholar] [CrossRef]
- Al-Obaidi, A.R. Numerical Investigation of Flow Field Behaviour and Pressure Fluctuations within an Axial Flow Pump under Transient Flow Pattern Based on CFD Analysis Method. J. Phys. Conf. Ser. 2019, 1279. [Google Scholar] [CrossRef] [Green Version]
- Al-Obaidi, A.R. Monitoring the Performance of Centrifugal Pump under Single-Phase and Cavitation Condition: A CFD Analysis of the Number of Impeller Blades. J. Appl. Fluid Mech. 2019, 12, 445–459. [Google Scholar] [CrossRef]
- Al-Obaidi, A.R.; Mohammed, A. Numerical Investigations of Transient Flow Characteristic in Axial Flow Pump and Pressure Fluctuation Analysis Based on the CFD Technique. J. Eng. Sci. Technol. Rev. 2019, 12, 70–79. [Google Scholar] [CrossRef]
- Al-Obaidi, A.R. Numerical investigation on effect of various pump rotational speeds on performance of centrifugal pump based on CFD analysis technique. Int. J. Model. Simul. Sci. Comput. 2021, 12. [Google Scholar] [CrossRef]
- Al-Obaidi, A.R. Analysis of the Effect of Various Impeller Blade Angles on Characteristic of the Axial Pump with Pressure Fluctuations Based on Time- and Frequency-Domain Investigations. Iran. J. Sci. Technol. Trans. Mech. Eng. 2021, 45, 441–459. [Google Scholar] [CrossRef]
- Al-Obaidi, A.R. Effects of Different Turbulence Models on Three-Dimensional Unsteady Cavitating Flows in the Centrifugal Pump and Performance Prediction. Int. J. Nonlinear Sci. Numer. Simul. 2019, 20, 487–509. [Google Scholar] [CrossRef]
- Al-Obaidi, A.R. Detection of Cavitation Phenomenon within a Centrifugal Pump Based on Vibration Analysis Technique in both Time and Frequency Domains. Exp. Tech. 2020, 44, 329–347. [Google Scholar] [CrossRef]


| Parameter | Value |
|---|---|
| Blade tip diameter/mm | 58.8 |
| Hub diameter/mm | 20 |
| Number of blades | 2 |
| Sweepback angle of leading edge/° | 178.9 |
| Axial length/mm | 37.4 |
| No. of Cells | Head/m | Difference in Head/% |
|---|---|---|
| 1,226,030 | 137.56 | 1.4 |
| 1,671,438 | 136.19 | 0.2 |
| 2,536,247 | 136.2 | 0.2 |
| 3,790,004 | 136.22 | 0.2 |
| Domain | Inducer | Impeller | Volute | Inlet Section | Infront Cavity | Outlet Section | Back Cavity |
|---|---|---|---|---|---|---|---|
| No. of cells | 561,306 | 614,600 | 361,840 | 206,976 | 340,470 | 82,555 | 368,500 |
Publisher’s Note: MDPI stays neutral with regard to jurisdictional claims in published maps and institutional affiliations. |
© 2021 by the authors. Licensee MDPI, Basel, Switzerland. This article is an open access article distributed under the terms and conditions of the Creative Commons Attribution (CC BY) license (https://creativecommons.org/licenses/by/4.0/).
Share and Cite
Xu, Z.; Kong, F.; Zhang, H.; Zhang, K.; Wang, J.; Qiu, N. Research on Visualization of Inducer Cavitation of High-Speed Centrifugal Pump in Low Flow Conditions. J. Mar. Sci. Eng. 2021, 9, 1240. https://doi.org/10.3390/jmse9111240
Xu Z, Kong F, Zhang H, Zhang K, Wang J, Qiu N. Research on Visualization of Inducer Cavitation of High-Speed Centrifugal Pump in Low Flow Conditions. Journal of Marine Science and Engineering. 2021; 9(11):1240. https://doi.org/10.3390/jmse9111240
Chicago/Turabian StyleXu, Zhenfa, Fanyu Kong, Hongli Zhang, Kun Zhang, Jiaqiong Wang, and Ning Qiu. 2021. "Research on Visualization of Inducer Cavitation of High-Speed Centrifugal Pump in Low Flow Conditions" Journal of Marine Science and Engineering 9, no. 11: 1240. https://doi.org/10.3390/jmse9111240