Article

Applying Two Active Acoustic Technologies to Document Presence of Large Marine Animal Targets at a Marine Renewable Energy Site

1
Marine Sciences Laboratory, Pacific Northwest National Laboratory, Sequim, WA 98382, USA
2
School of Marine Sciences, University of Maine, Orono, ME 04469, USA
3
Echoview Software, G.P.O. Box 1387, Hobart, TAS 7001, Australia
4
Laboratory of Genetics, University of Wisconsin-Madison, 425-g Henry Mall, Madison, WI 53706, USA
*
Author to whom correspondence should be addressed.
J. Mar. Sci. Eng. 2020, 8(9), 704; https://doi.org/10.3390/jmse8090704
Submission received: 16 July 2020 / Revised: 3 September 2020 / Accepted: 7 September 2020 / Published: 11 September 2020
(This article belongs to the Special Issue Environmental Interactions of Marine Renewable Energy Installations)

Abstract

:
Coastal regions are highly used by humans. The growing marine renewable energy (MRE) industry will add to existing anthropogenic pressures in these regions. Regulatory bodies require animal risk assessment before new industrial activities can progress, and MRE is no exception. Preliminary data of marine mammal use of an MRE device deployment location could be informative to permitting. A combination of downlooking hydroacoustics using an echosounder and acoustic camera (imaging sonar) was used to provide a number of large targets (proxy for large fish and marine mammals) in an area of interest for MRE tidal turbine deployment in Western Passage, Maine, USA. Data were collected in May, June, August, and September of 2010 and 2011. Of the nine large targets confirmed to be animals, eight were porpoises and one was a shark. Few large targets were observed in May and June, with the majority (90%) being present in August and September of both years. The most large targets were observed when tidal current speed was less than 1 m·s−1. These data provide a preliminary assessment of large targets in a single location over sixteen 24-h surveys. The aforementioned methodology could be used for future pre- and post-installation assessments at MRE device deployment locations. Their use in concert with visual and passive acoustic monitoring can provide water depth usage by marine mammals, which is a metric that is difficult to assess with passive acoustic and visual techniques.

1. Introduction

The world’s coastal regions are areas of intense anthropogenic activity, such as housing, recreation, fishing, and energy collection. These activities result in effects on marine ecosystems that range from the direct extraction of natural resources (e.g., fish and currents) to habitat modification. Coastal areas provide several ecosystem services, including easy access to the sea, transportation, sustenance, recreation, and a multitude of uses in the manufacturing industry [1]. In the USA, environmental assessment is required to initiate and to continue various uses of coastal regions. Many industrial uses have occurred for decades, such as water intake for coal burning and nuclear power plants, and there are precedents for permitting and regulation (i.e., Clean Water Act section 316 a & b) and documented effects of these uses on ecosystem processes and services [2]. However, as the US attempts to harness renewable energy derived from the ocean, it will affect the marine ecosystem in different and unknown ways [1,3,4,5,6]. New uses such as this will require different permitting procedures (i.e., Marine Mammal Protection Act, Endangered Species Act, and National Environmental Policy Act) [7] and thus new ecosystem monitoring requirements.
The recent, growing interest in marine renewable energy (MRE) will have implications for the continued use of coastal regions, and moving MRE projects to commercial viability will require permitting and regulatory decision-making. Regulatory agencies and other stakeholders maintain concern about the possible effects and impacts of these projects because of the nascent nature of MRE industries (i.e., offshore wind, wave, and tidal energy). Preliminary survey data are often lacking in locations of interest for MRE development, creating numerous unknowns and burdensome needs for environmental assessments. As such, the engineering challenges associated with the research and development of MRE devices are coupled with additional emerging challenges related to potential effects and impacts on fish and other marine wildlife [4,8]. Locations currently being permitted for MRE deployment are high-energy environments that make data collection difficult [9,10,11,12,13,14] and, at times, dangerous. New methods for observing environmental features are necessary [15,16,17,18] for gathering meaningful preliminary data and providing quantifiable metrics to industry regulators for decision-making.
MRE projects could affect large marine animals that move through tidal ecosystems [4], so understanding marine animal presence before and after MRE device installation is of interest. All MRE devices have underwater components which may affect large marine animals (e.g., sharks and marine mammals) directly or indirectly, including support structures, mooring lines, and turbines. As such, understanding the temporal and spatial distribution of marine animals could aid in predicting and observing interactions with MRE devices. Shark distributions in tidal systems are largely unknown. Typical methods, where applied for shark distributions, use mark recapture techniques [19] and fishery-dependent data [20]. Both methods require animal capture. Marine mammal data collection typically consists of visual surveys of the surface [21]. These observations of large areas provide an index of marine mammal presence at the surface but provide no information about their locations in the water column when submerged. Hydrophone vocalization sampling [22], a form of passive acoustic monitoring, is another method used to assess the presence and identity of certain marine mammals. This method has limitations as well, e.g., not all mammals vocalize all the time and vocalizations can be difficult to link to species or individuals [22]. Hydrophone data also have the additional complication of background noise in energetic environments, such as channels with high-velocity tidal currents, which impedes marine mammal detection [23]. Preliminary empirical data are needed to better understand large animal interactions with MRE devices but collecting such data will require new survey methods.
Western Passage is a constricted waterway at the international boundary between the US and Canada at the southern end of Passamaquoddy Bay, near Eastport, Maine. This area is of interest for tidal energy development [24]. Tidal energy is a form of MRE that uses current energy converter (CEC) devices to convert the kinetic energy of tidally generated water currents to electricity, often with large, open, underwater turbines supported by a bottom-mounted frame or moored in place. Several species of sharks and marine mammals have been visually confirmed in the area of the Western Passage tidal energy site, including great white shark (Carcharodon carcharia; Zydlewski acoustic telemetry detections 2018 and 2019), porbeagle shark (Lamna nasus; personal observation), harbor seal (Phoca vitulina; [25], gray seal (Halichoerus grypus), harbor porpoise (Phocoena phocoena), and minke whale (Balaenoptera acutorostrata) [26].
Downlooking, single beam hydroacoustics have been shown to provide meaningful baseline data for fish vertical distribution and density [11] for use in before–after comparisons near a deployed tidal turbine [27,28]. The authors are aware of no applications of single beam hydroacoustics for shark and marine mammal surveys; however, split beam, imaging, and scanning sonars have been used to collect data on marine mammal presence [29,30,31] and their interactions with prey [32,33]. The large animals present in Western Passage—e.g., sharks [34], marine mammals, and tuna (G. Harris, pers. comm.)—could potentially be detected with hydroacoustics, as well. At this study site, single beam echosounders and acoustic cameras (multibeam echosounders) were originally used to quantify fish biomass and vertical distribution. Follow-on analysis presented here was conducted to estimate the number of large acoustic targets (e.g., seals, porpoises, whales, tuna, or sharks) at three locations near a potential tidal turbine deployment. These methods, along with other mammal surveys in the area, provide preliminary information for the MRE industry and regulators and the framework for a new approach to large pelagic fish species and marine mammal monitoring at MRE sites.

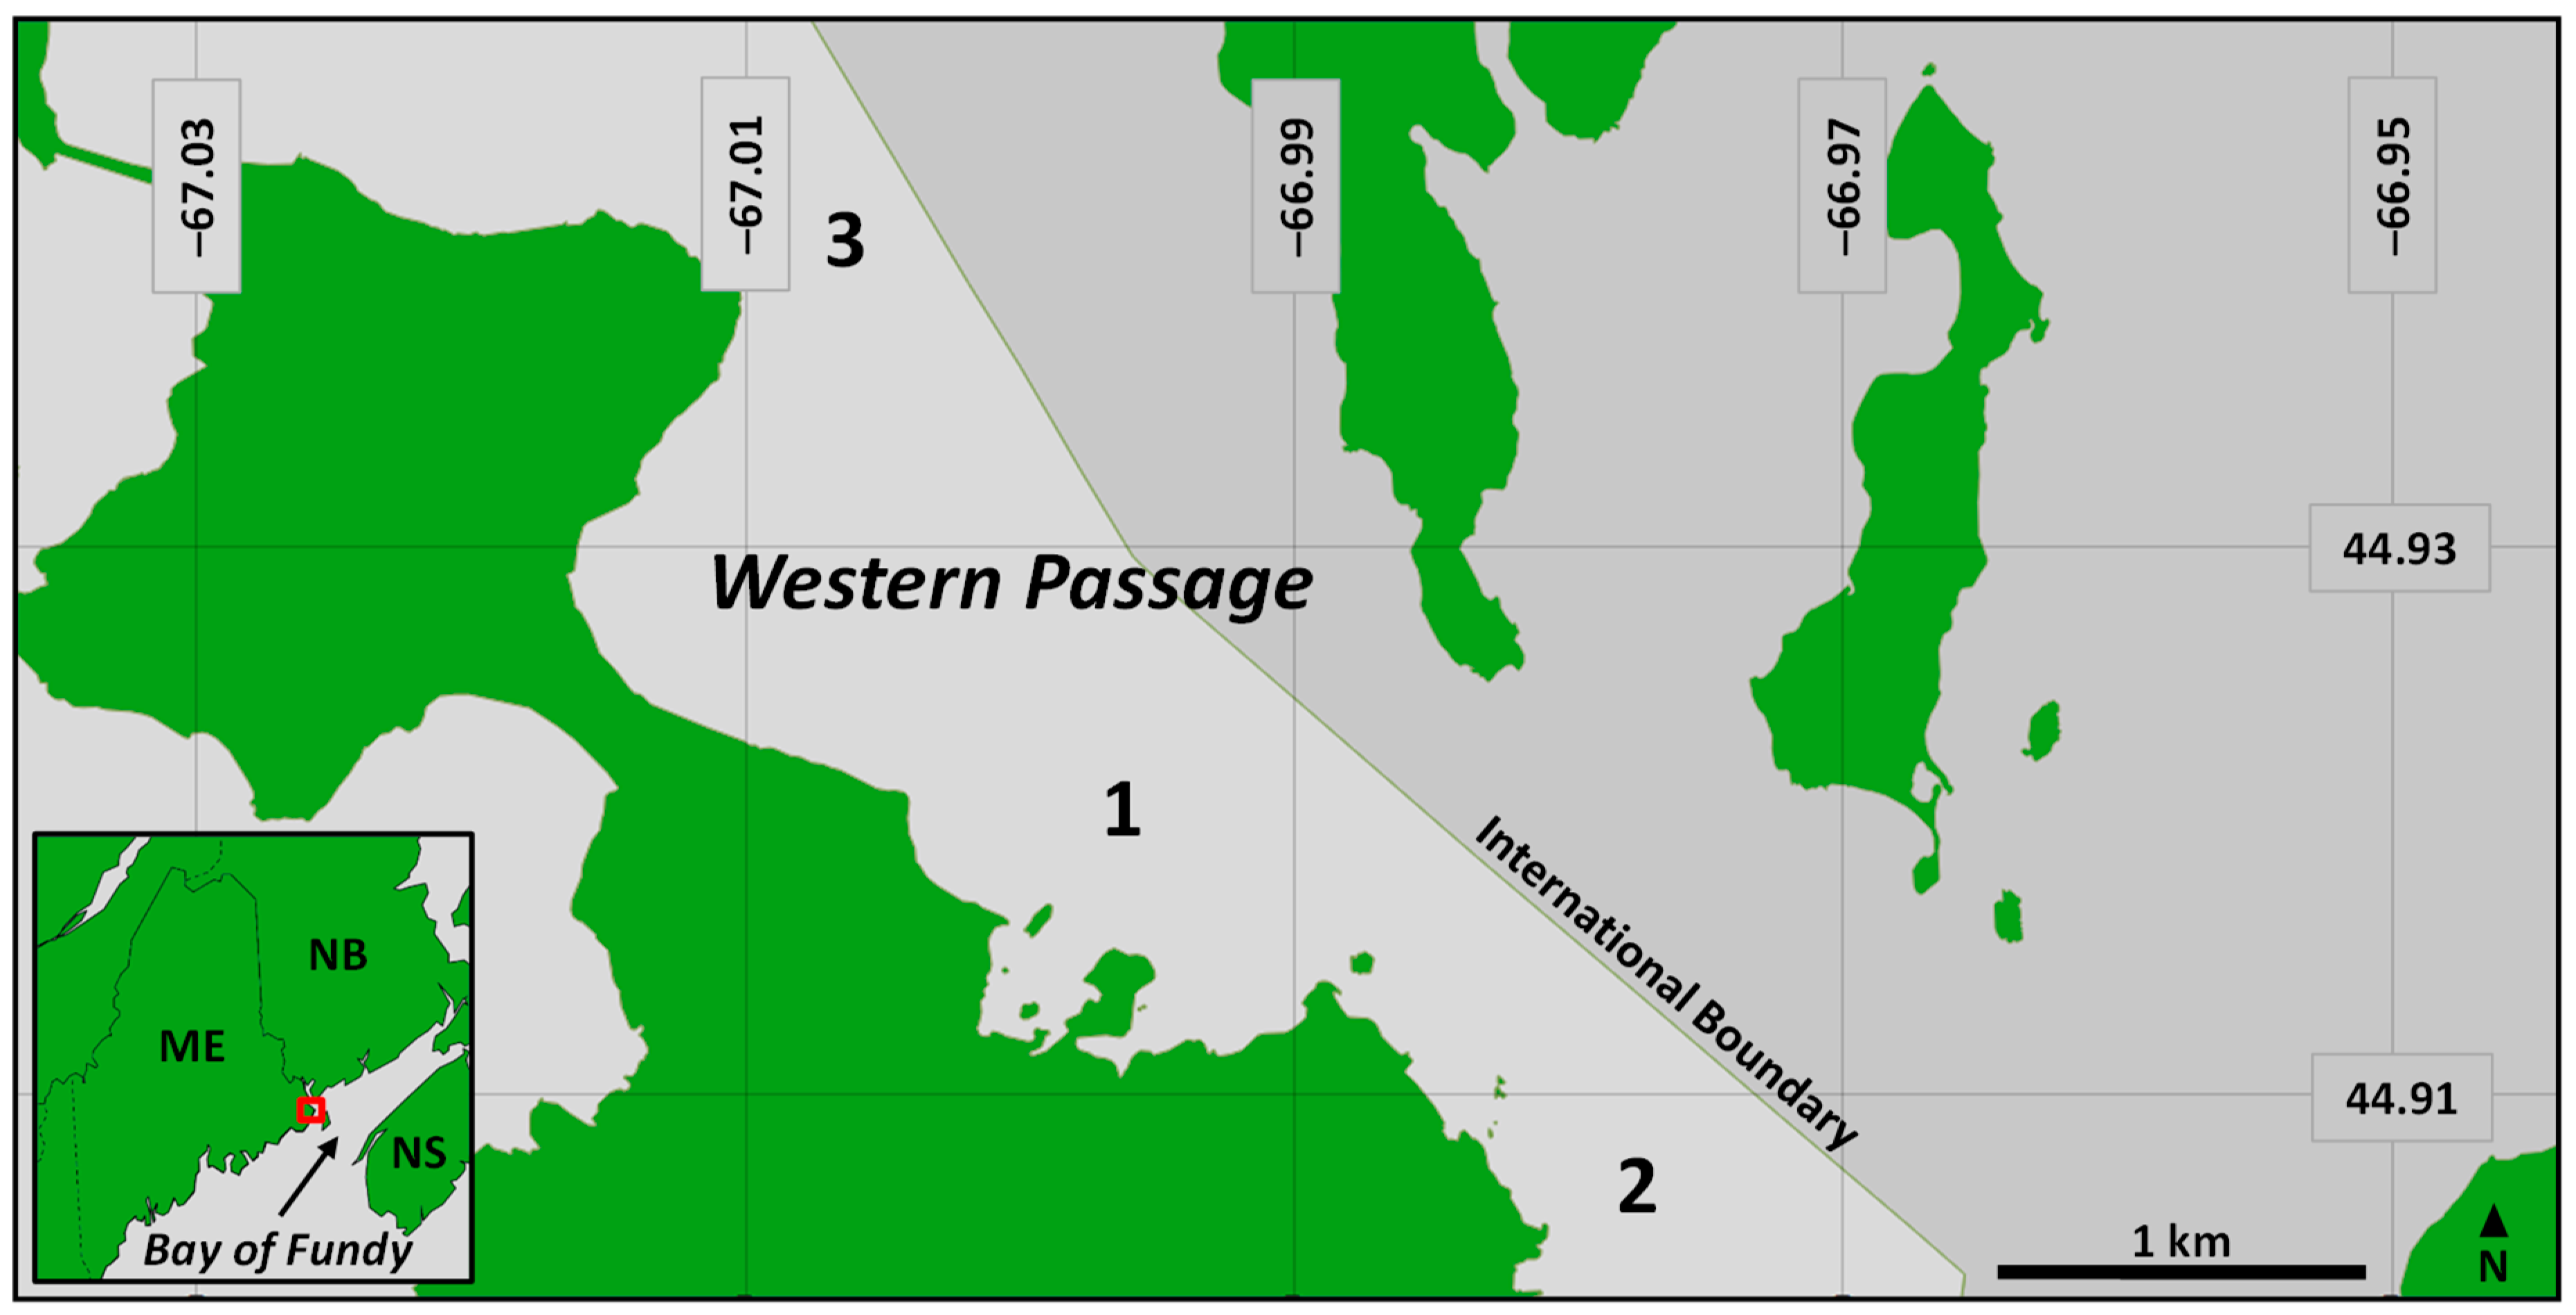
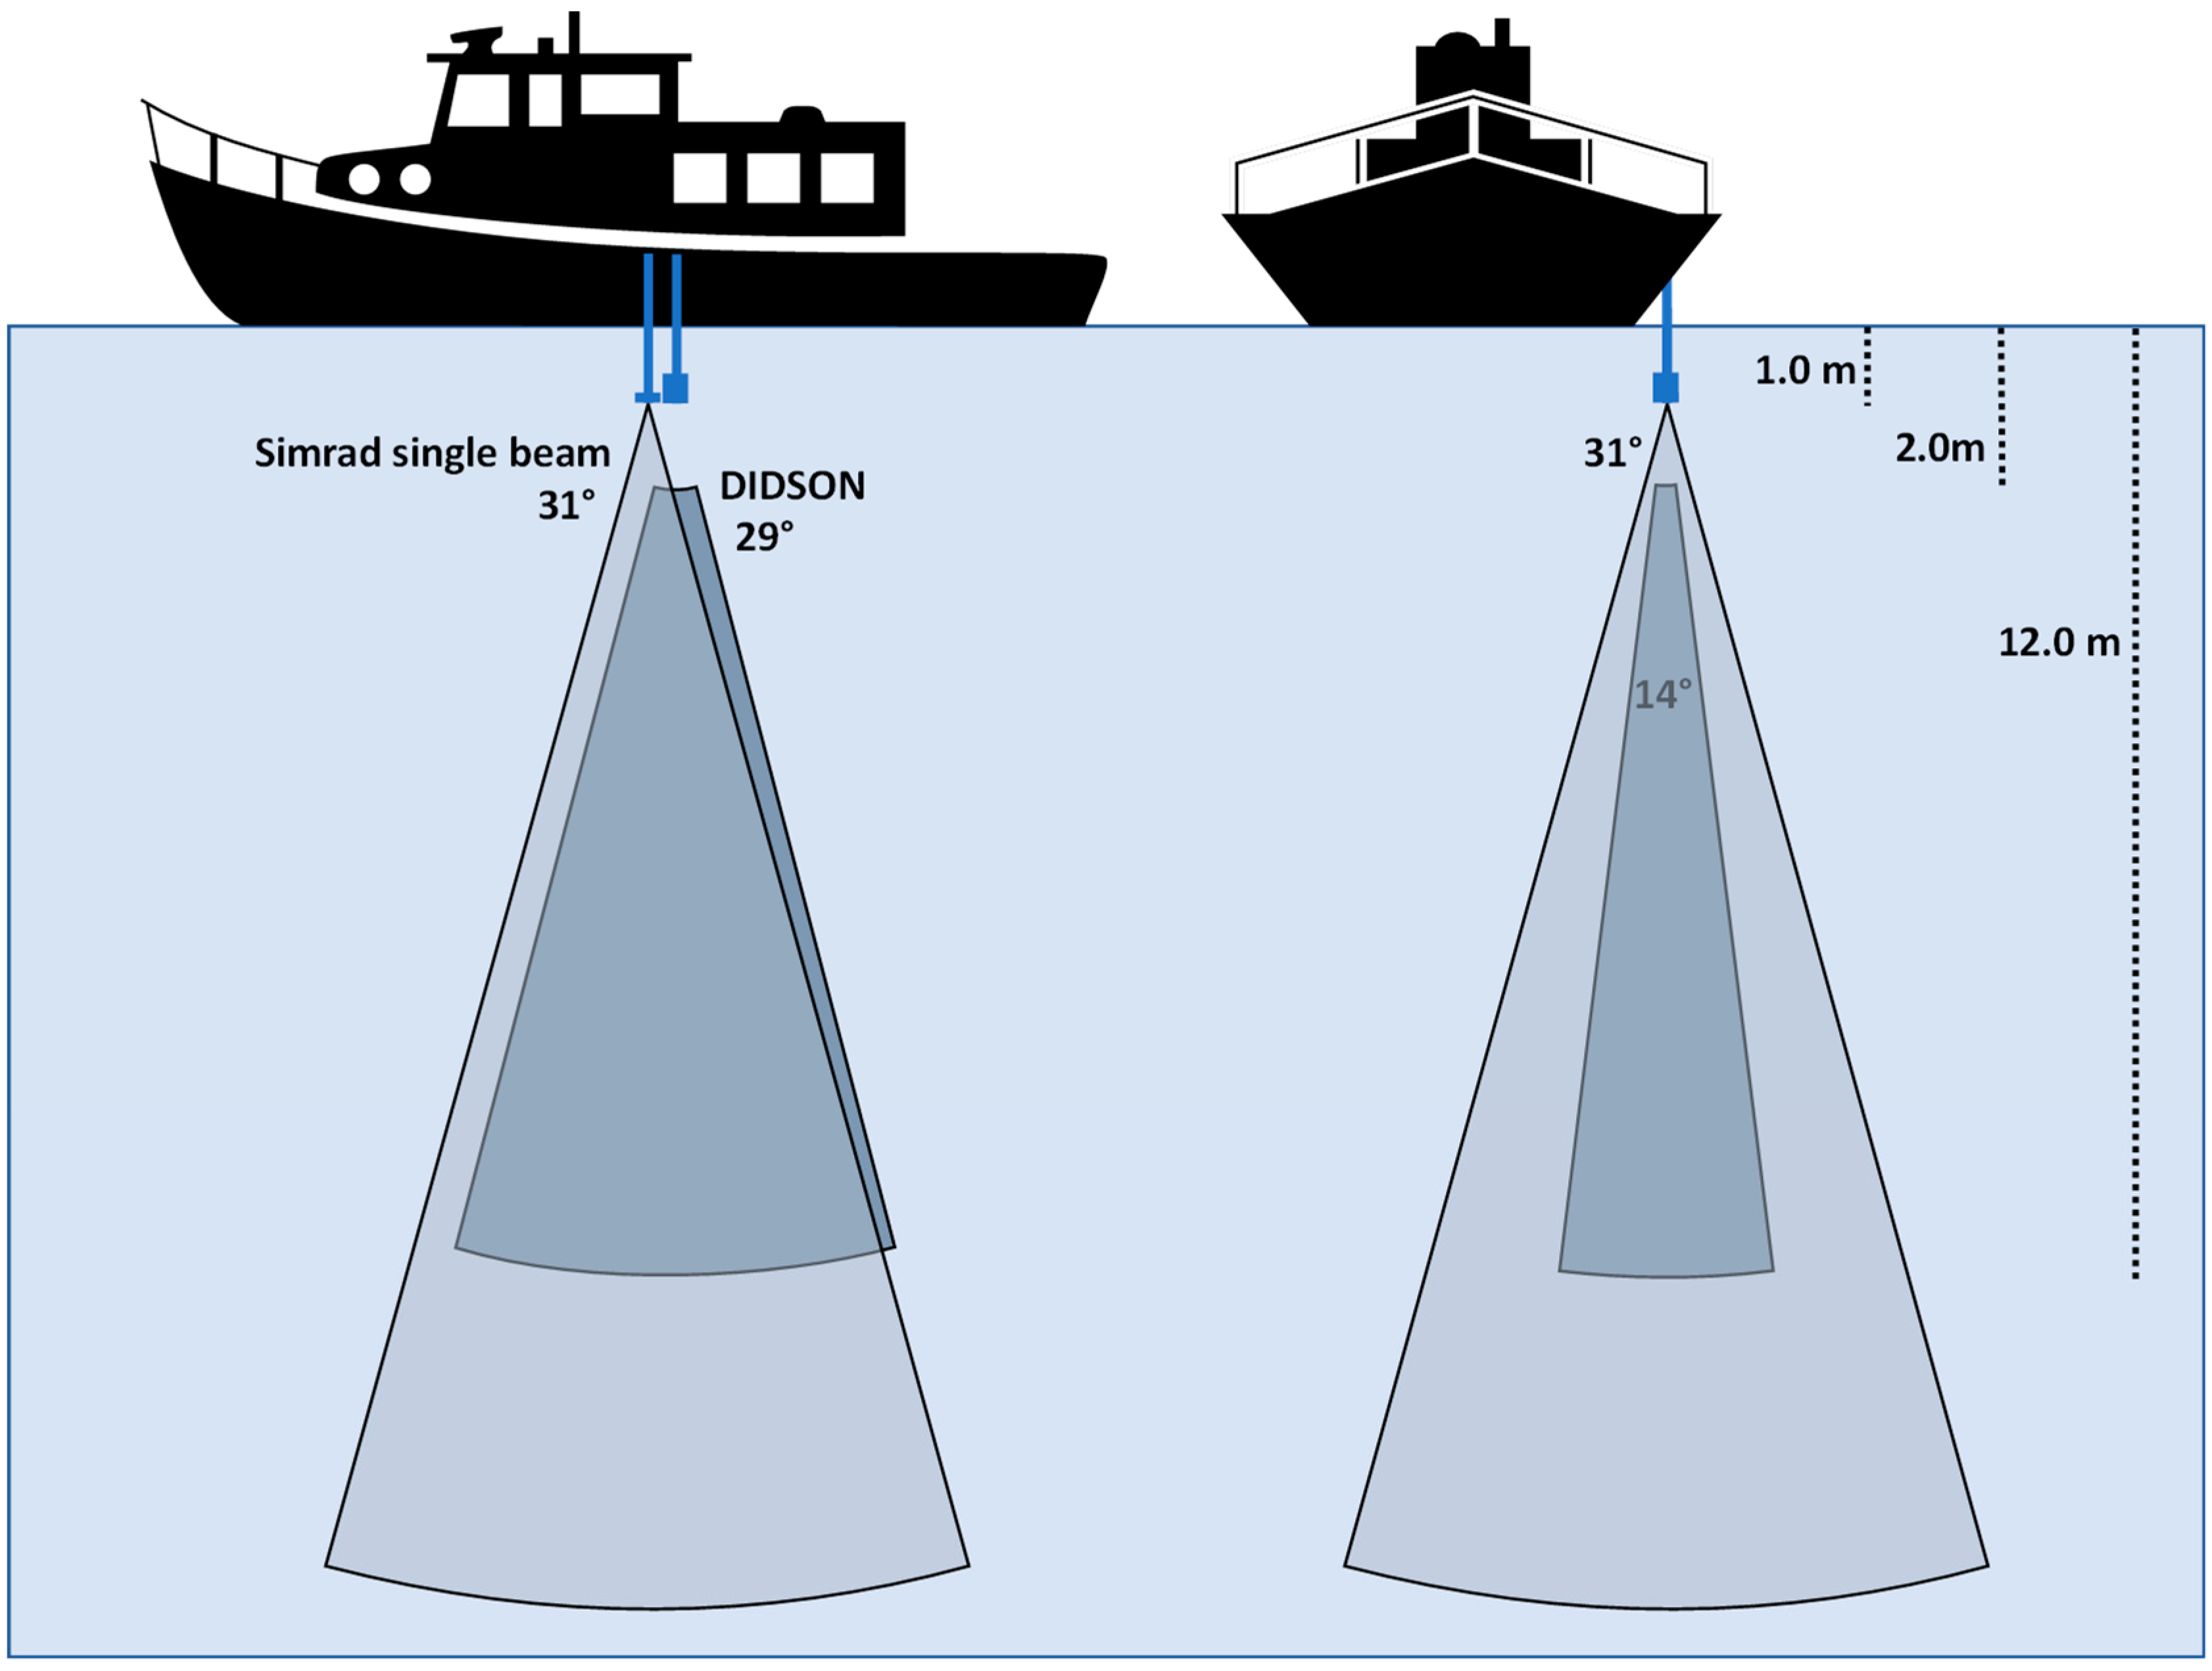
2. Materials and Methods
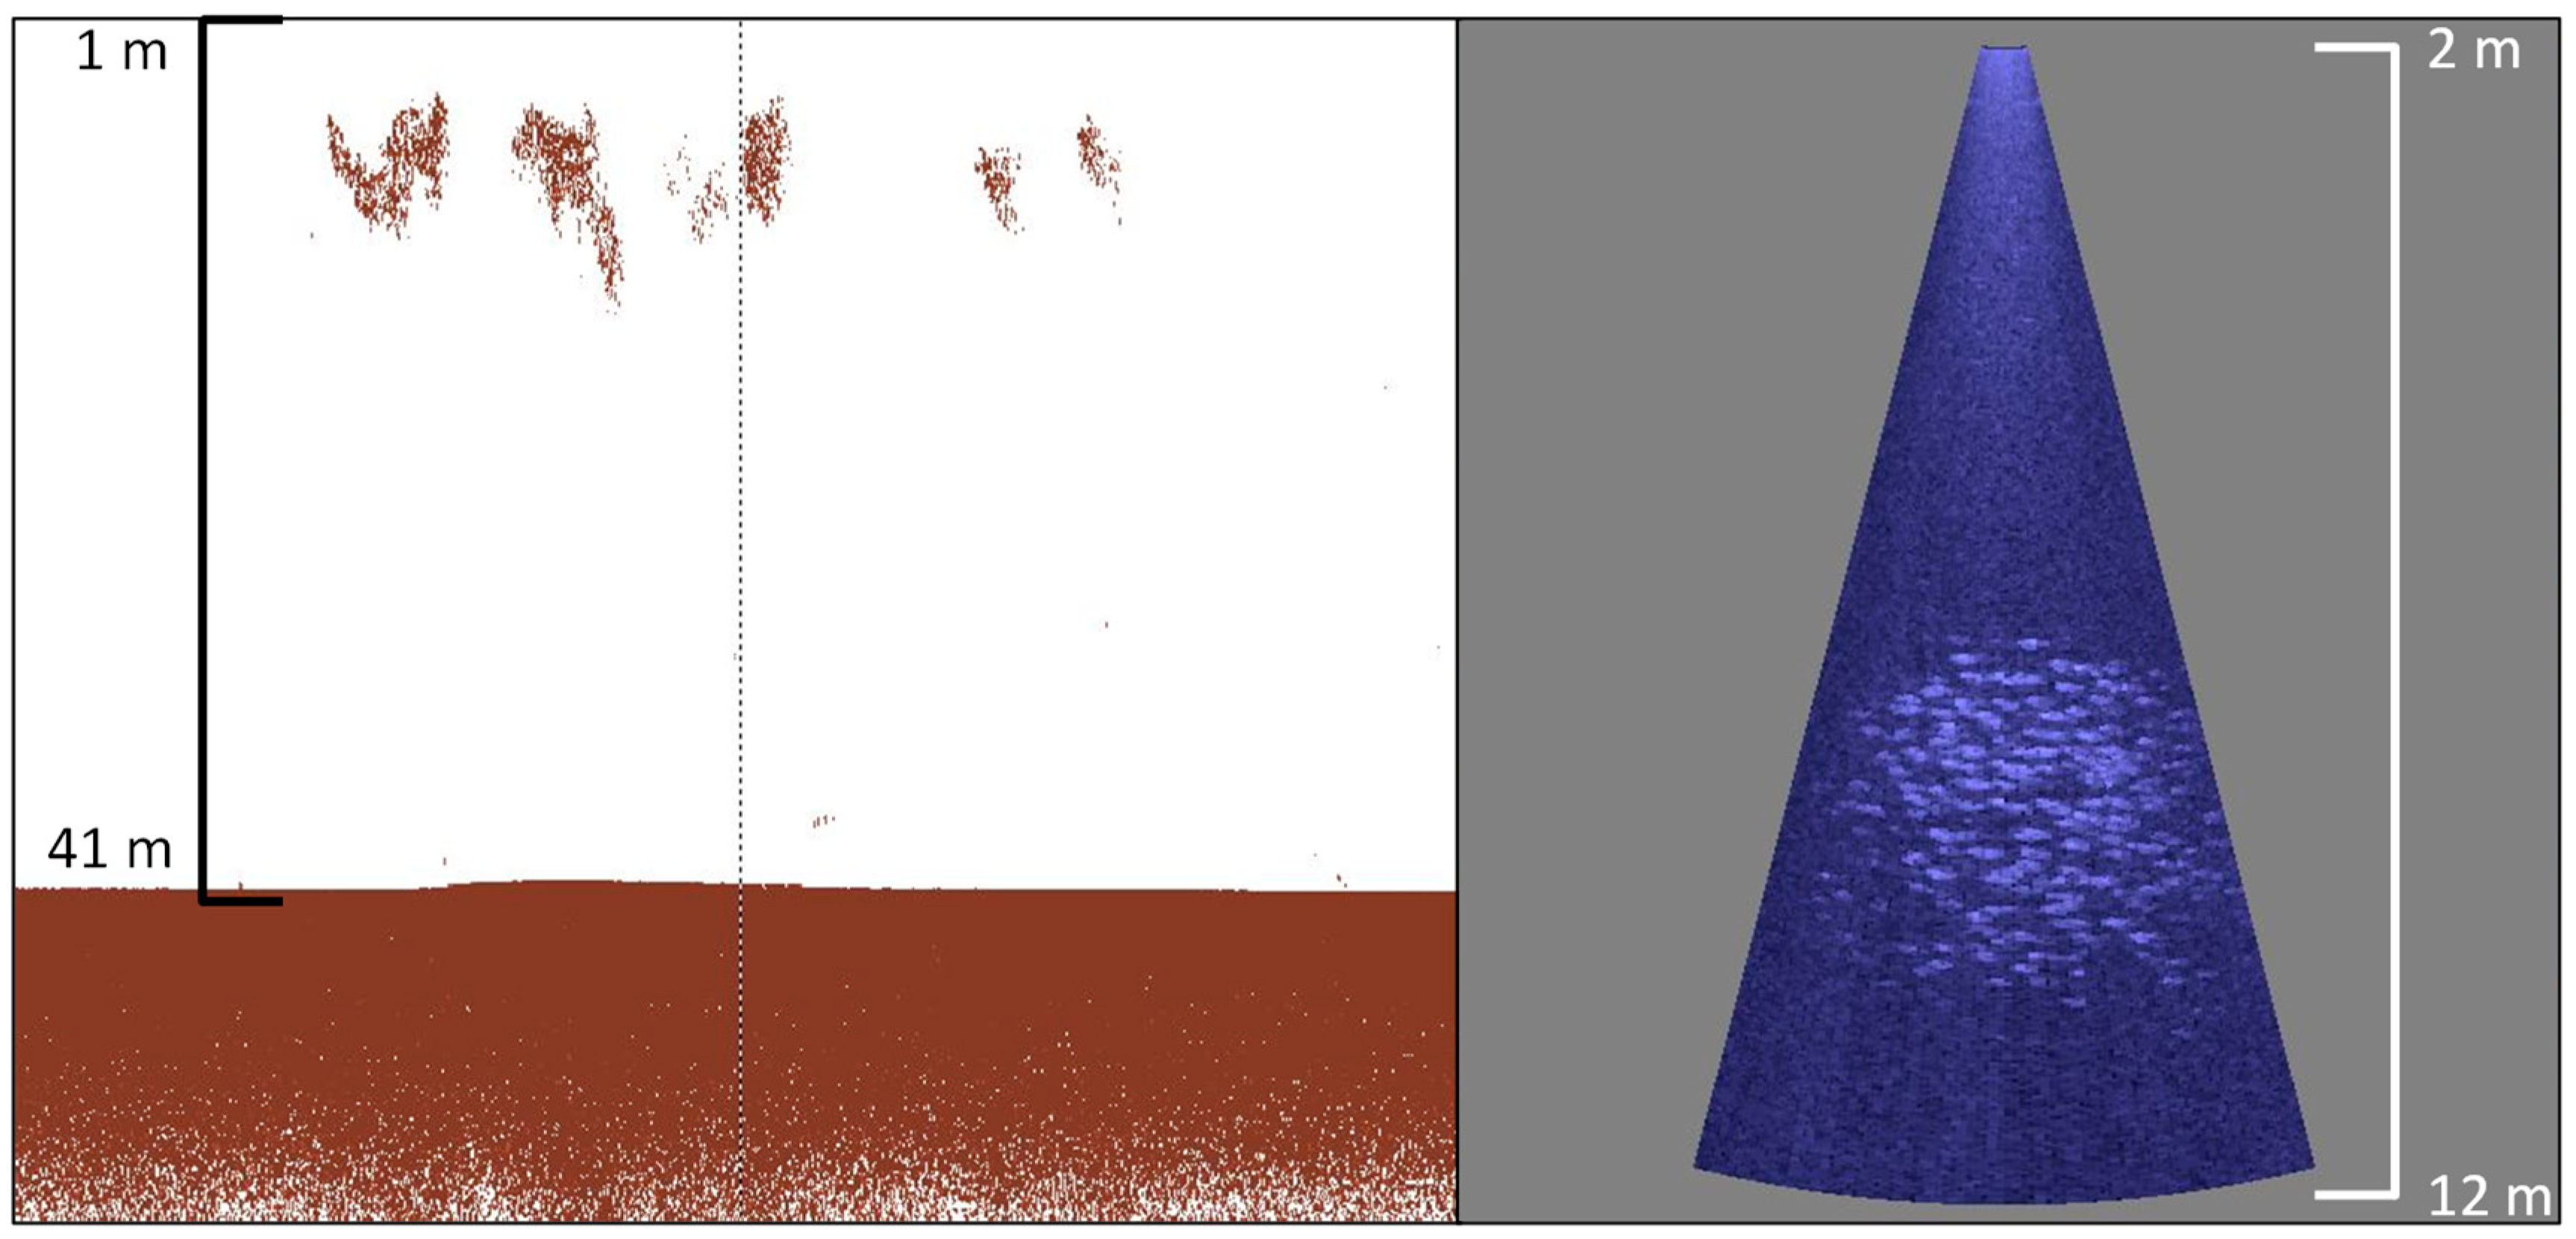
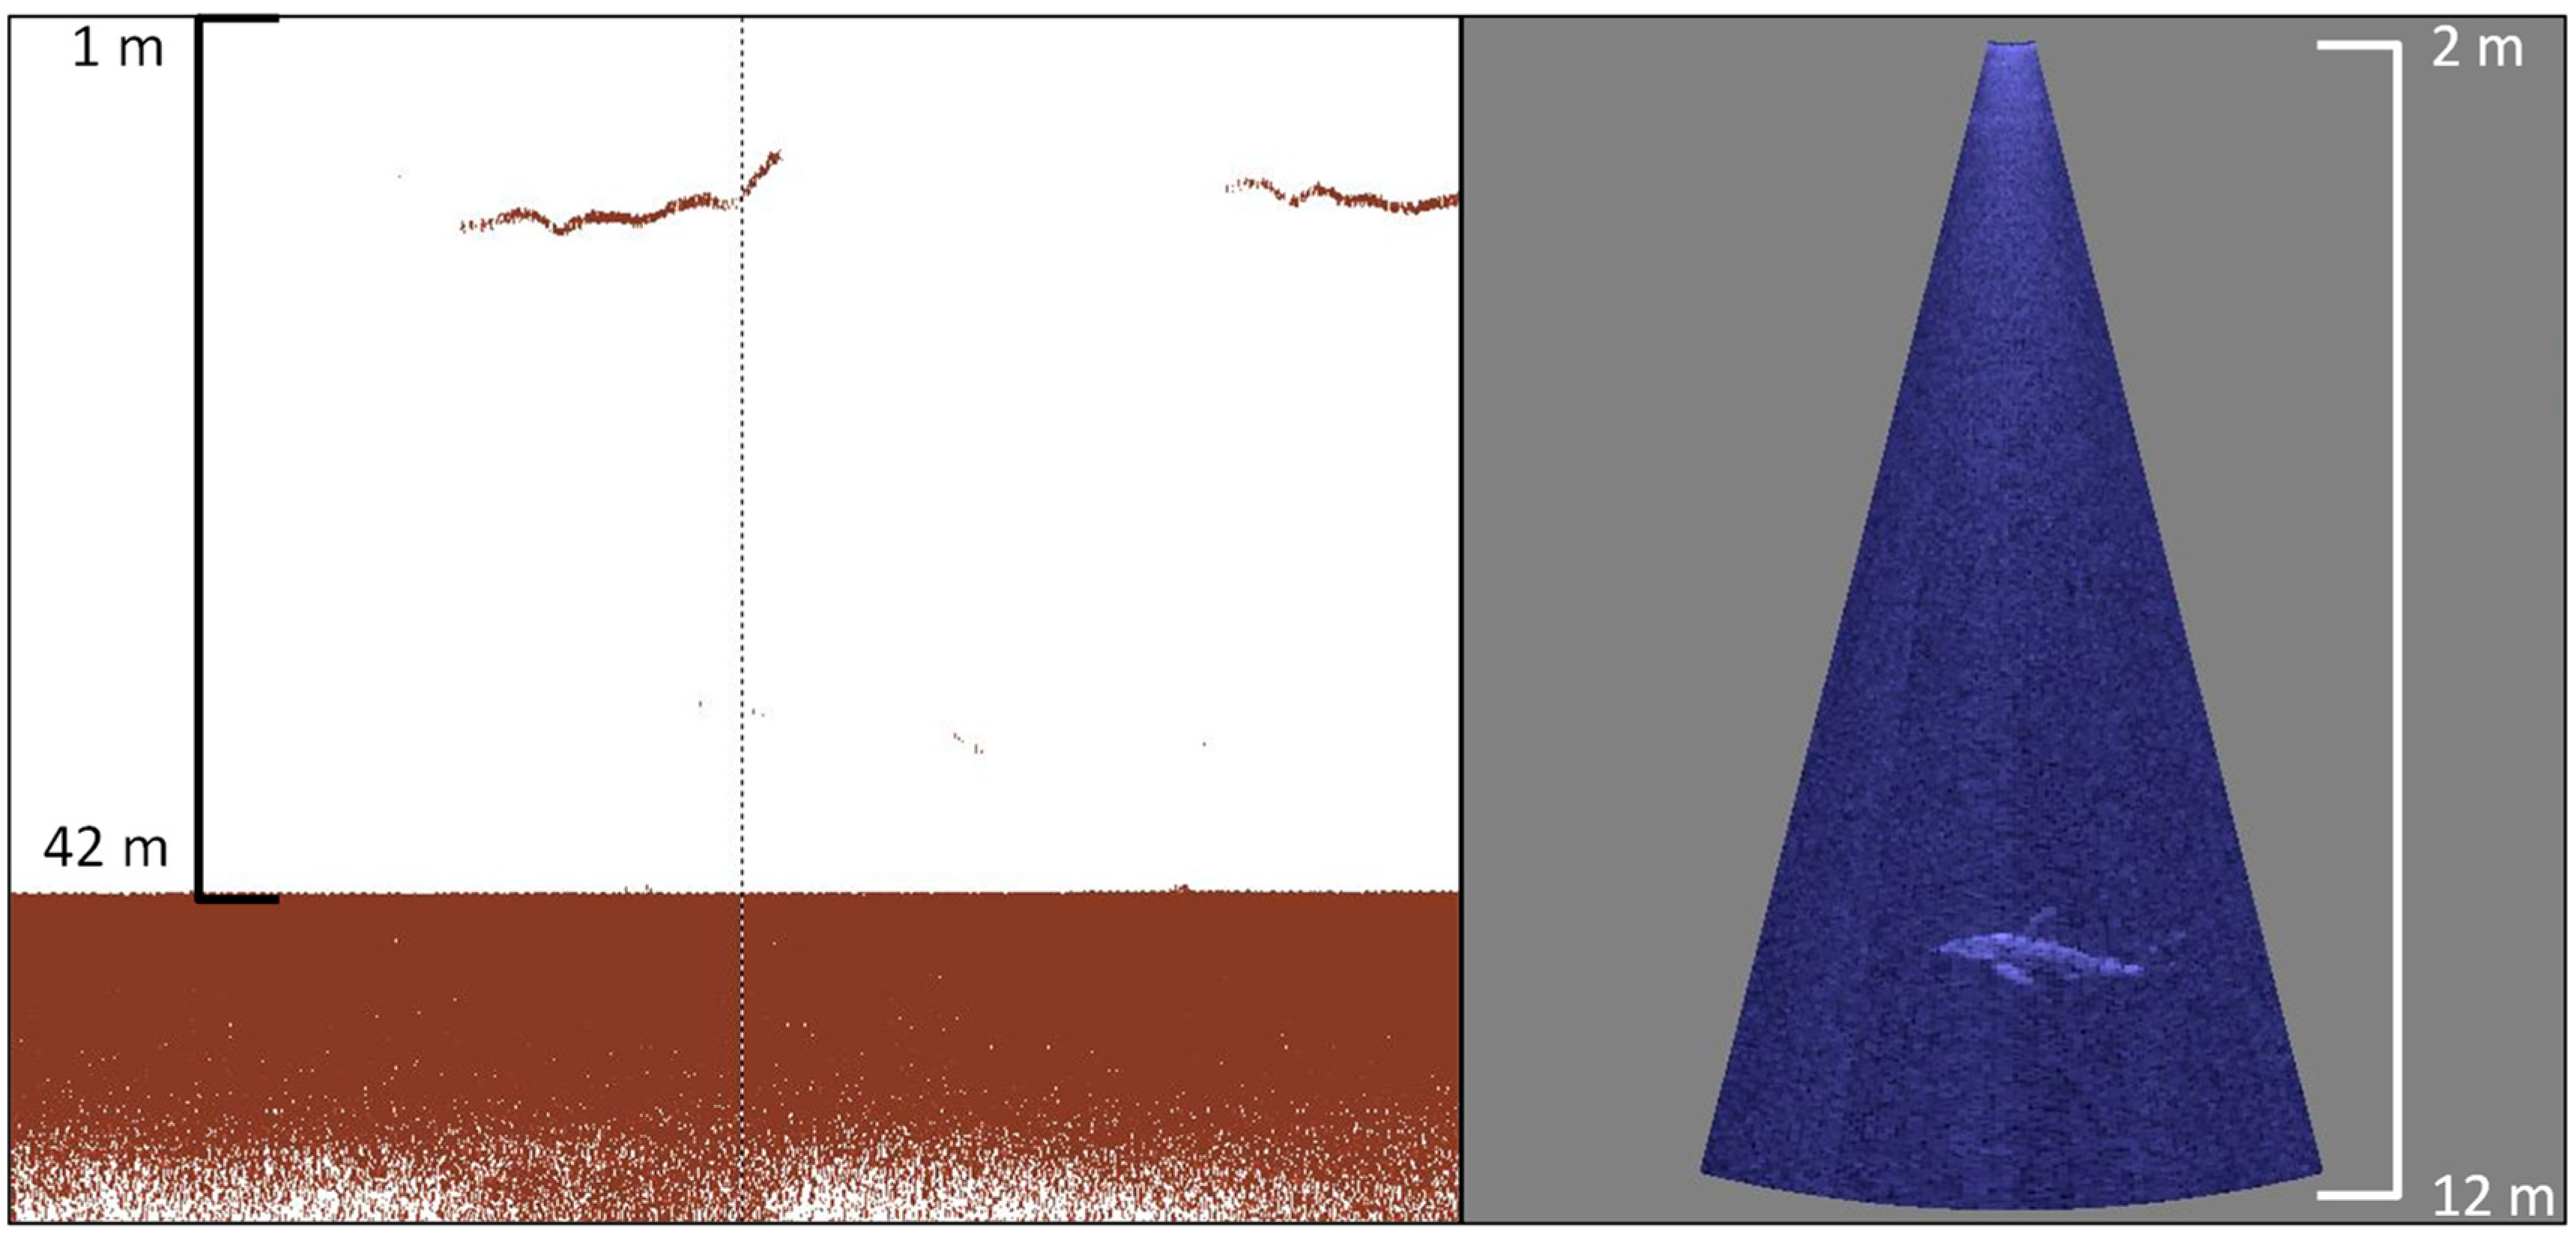
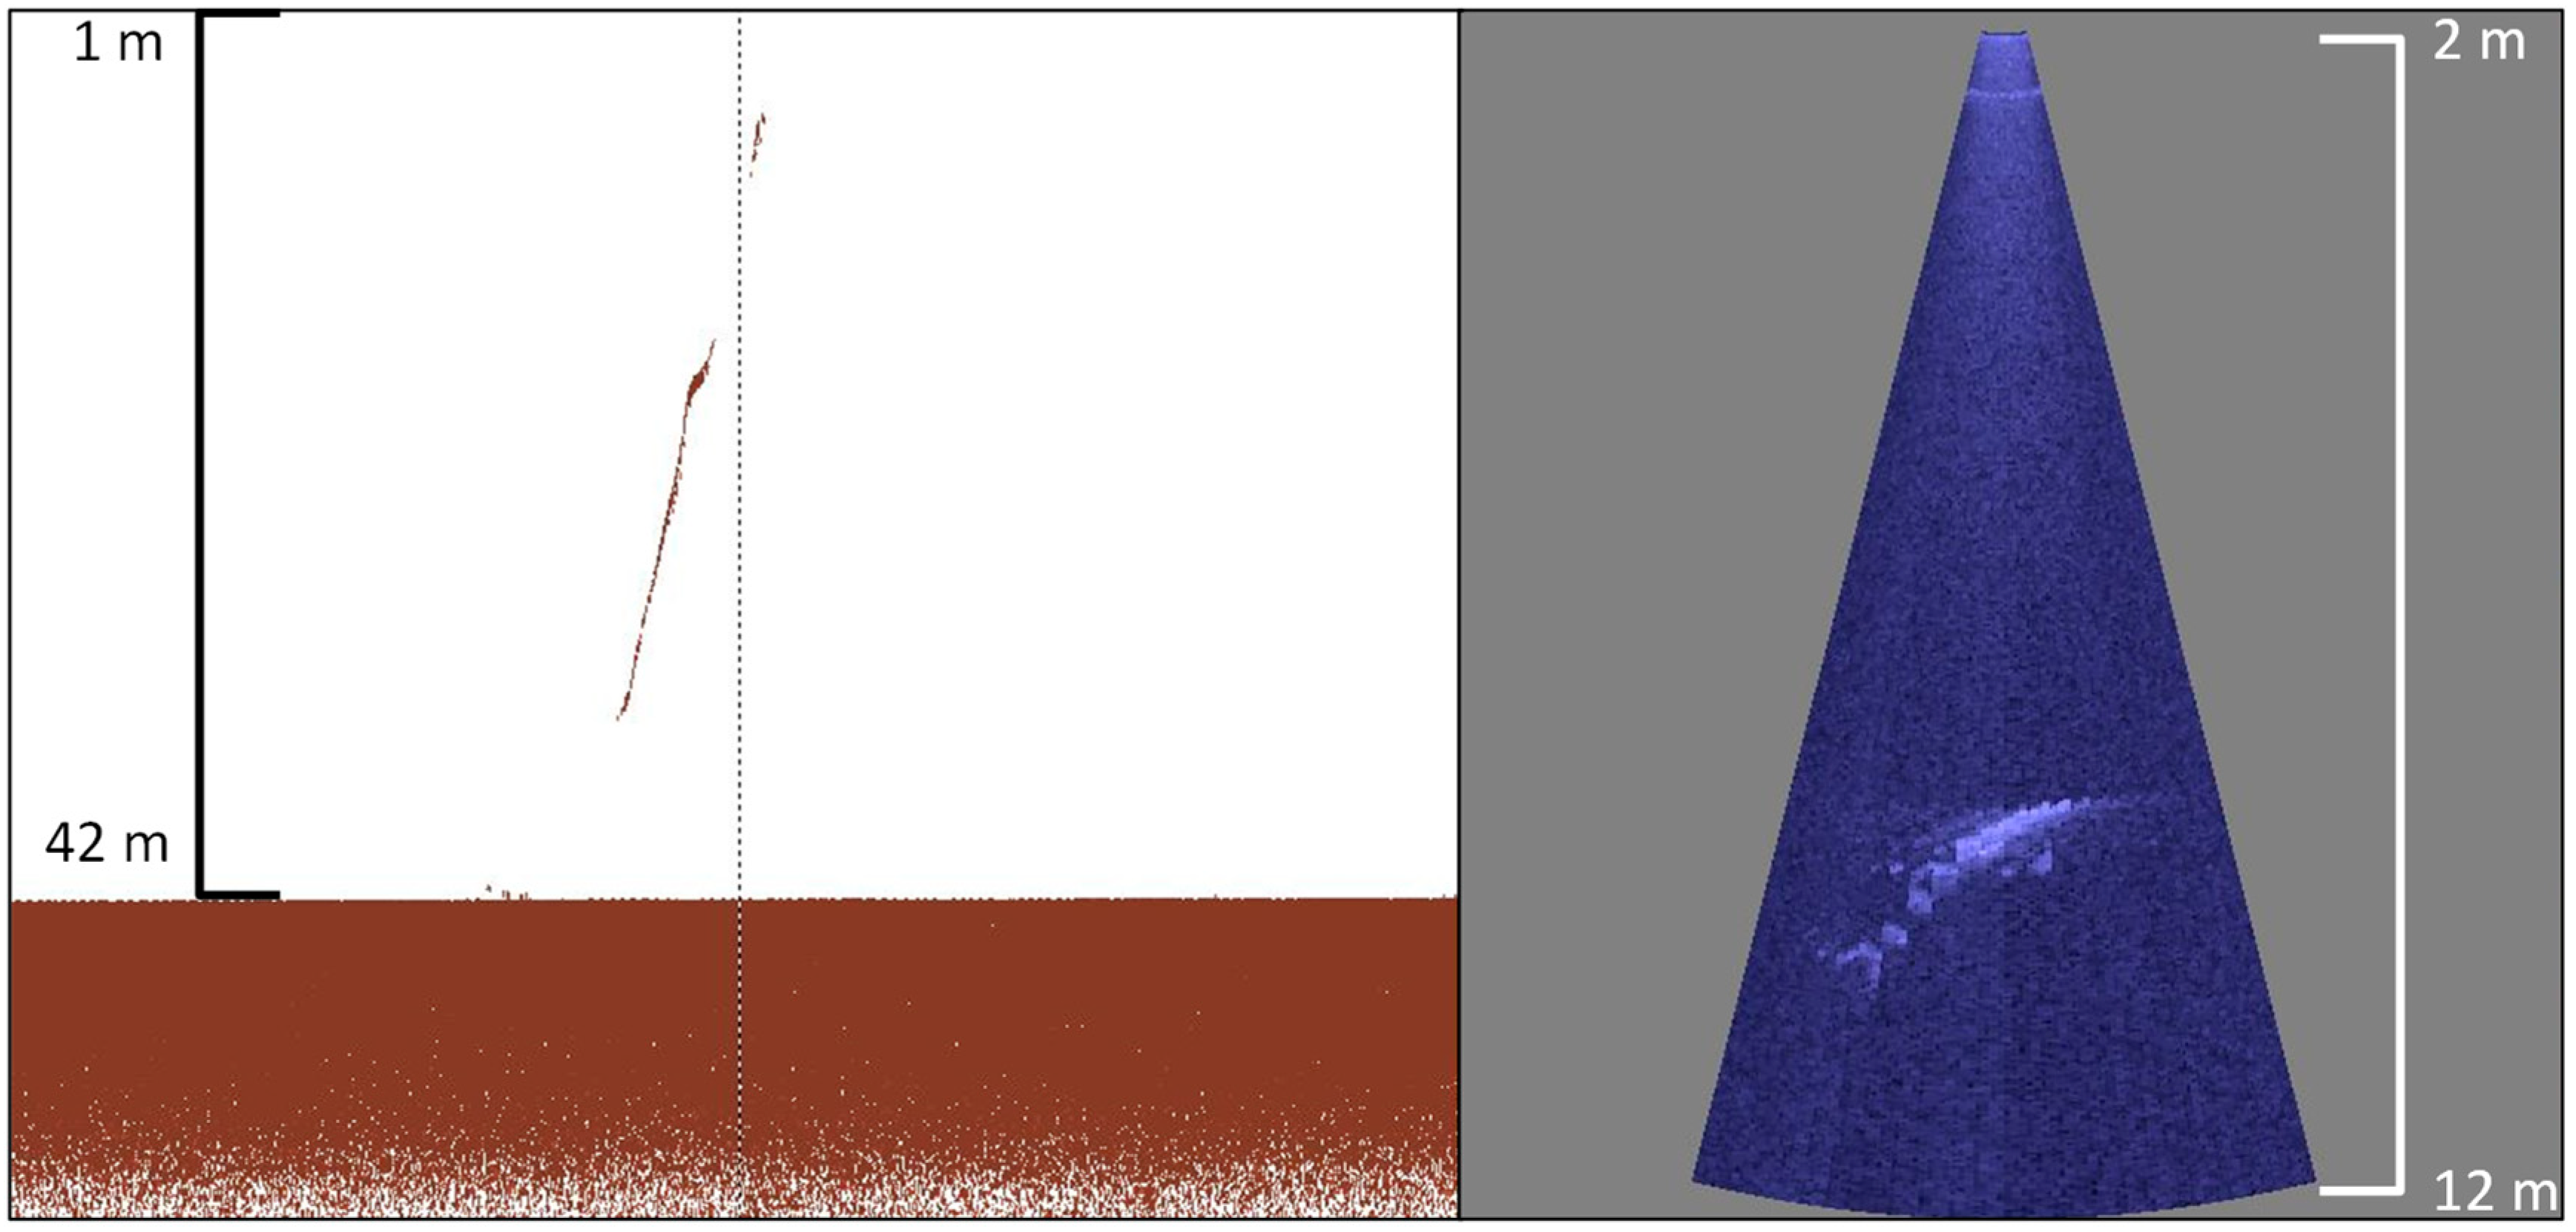
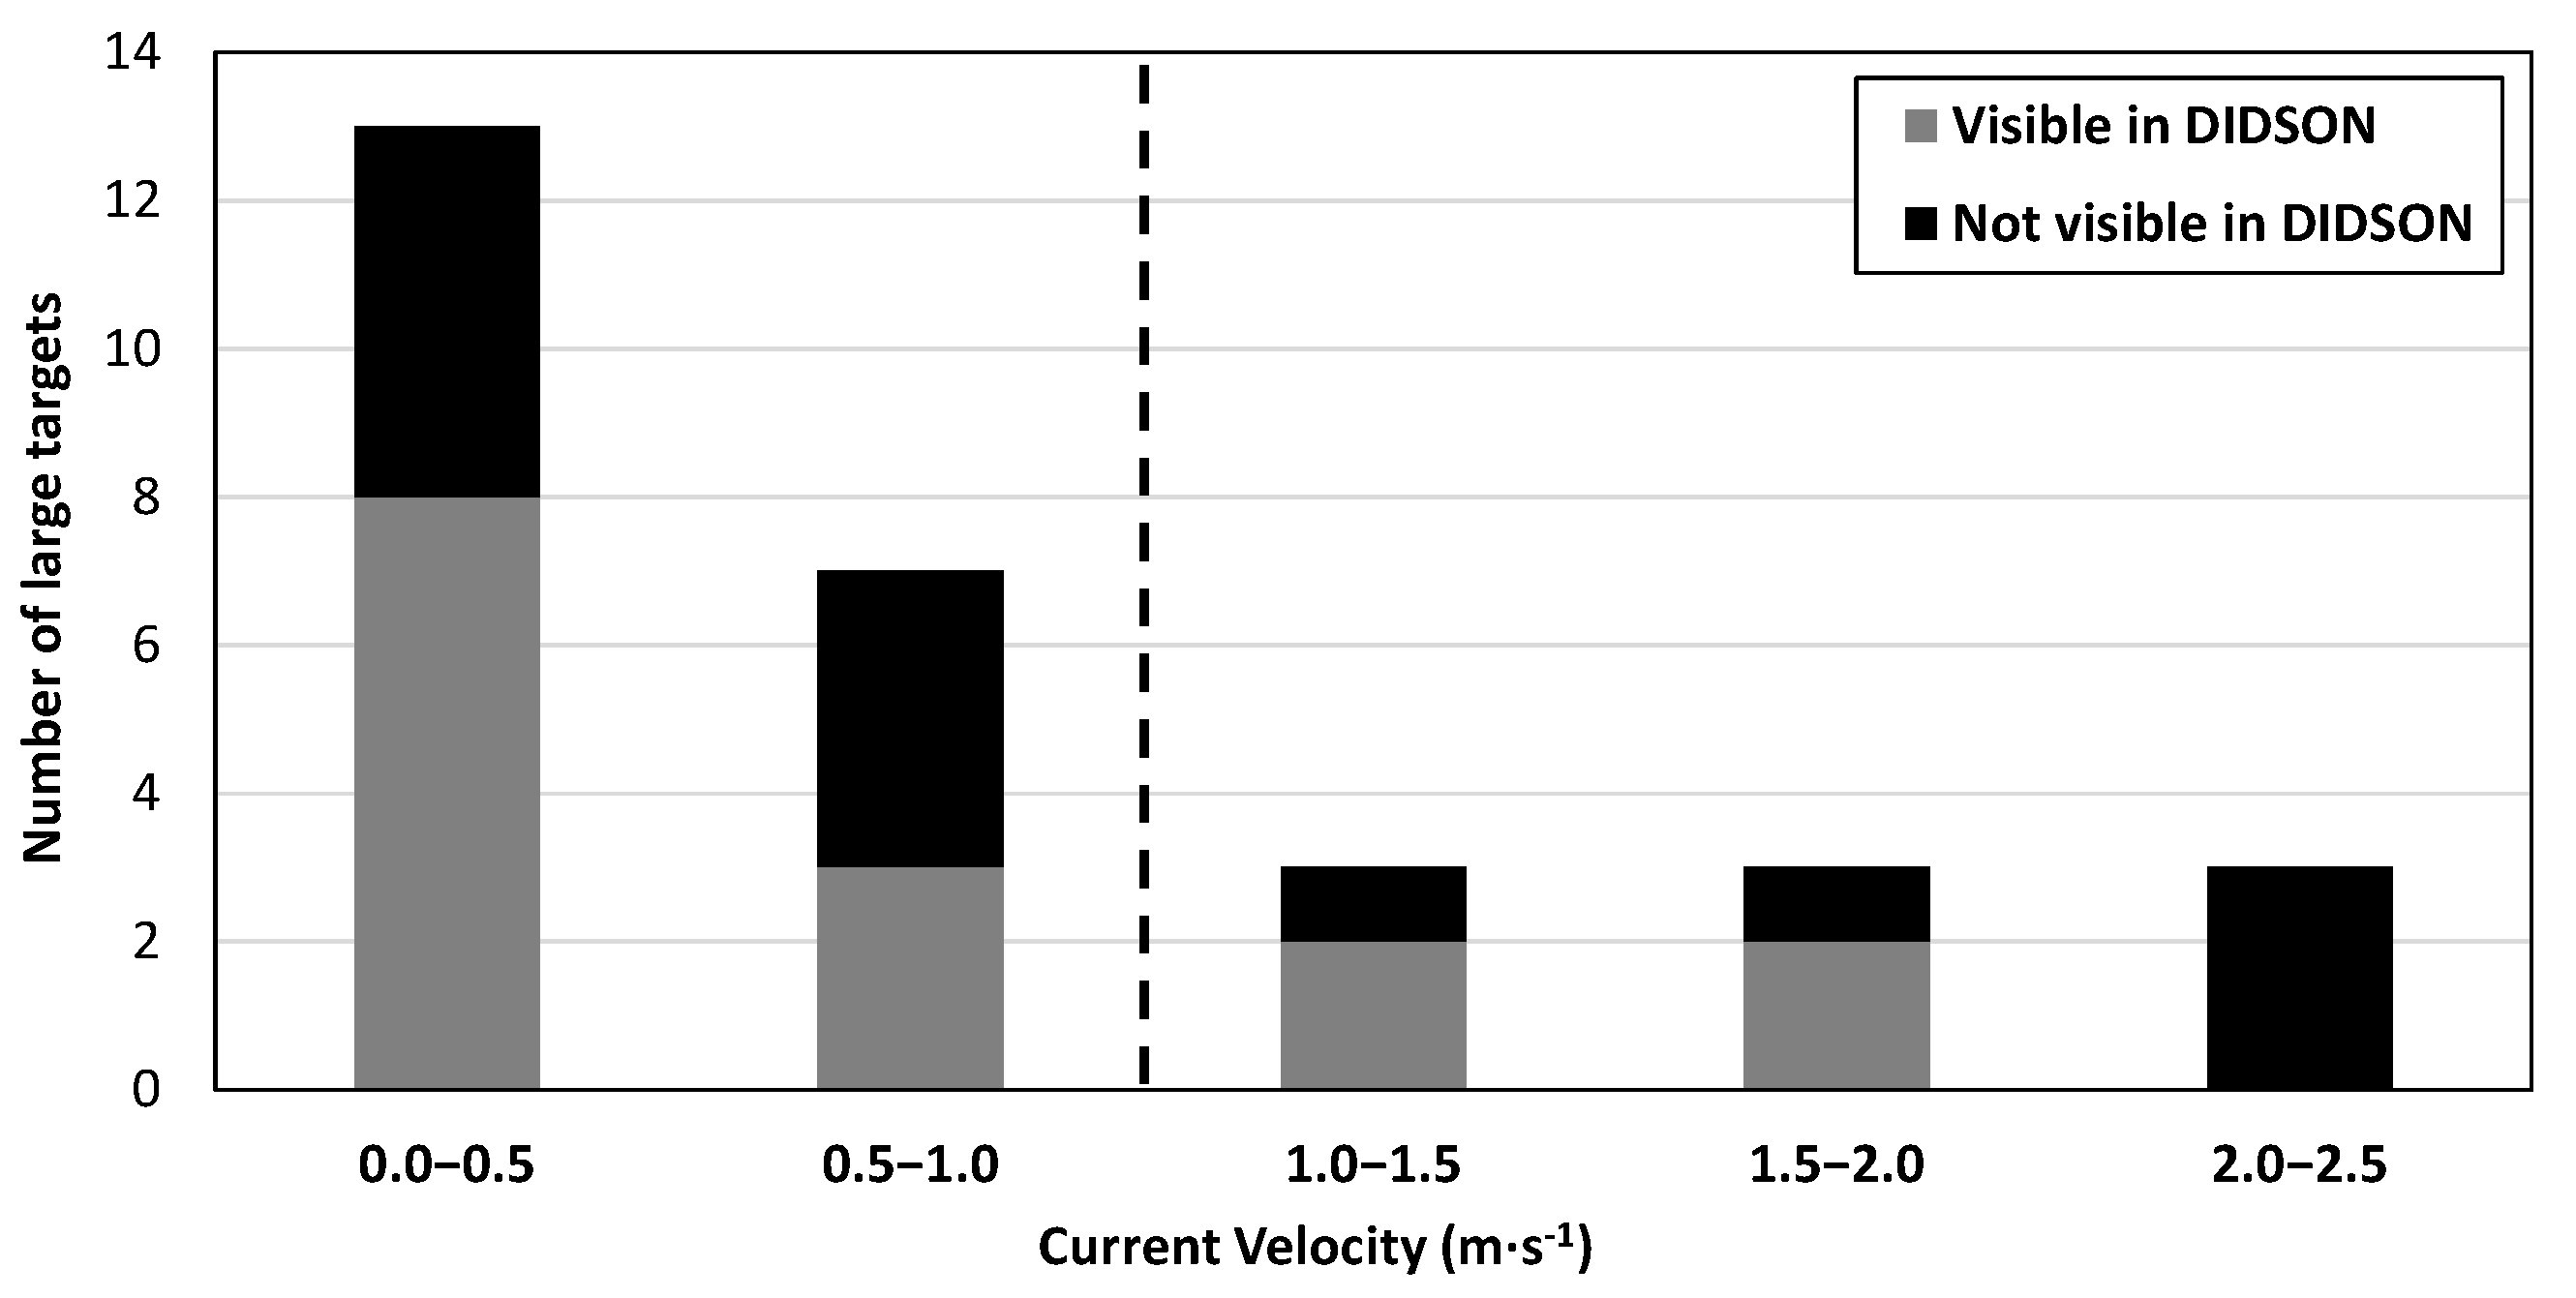
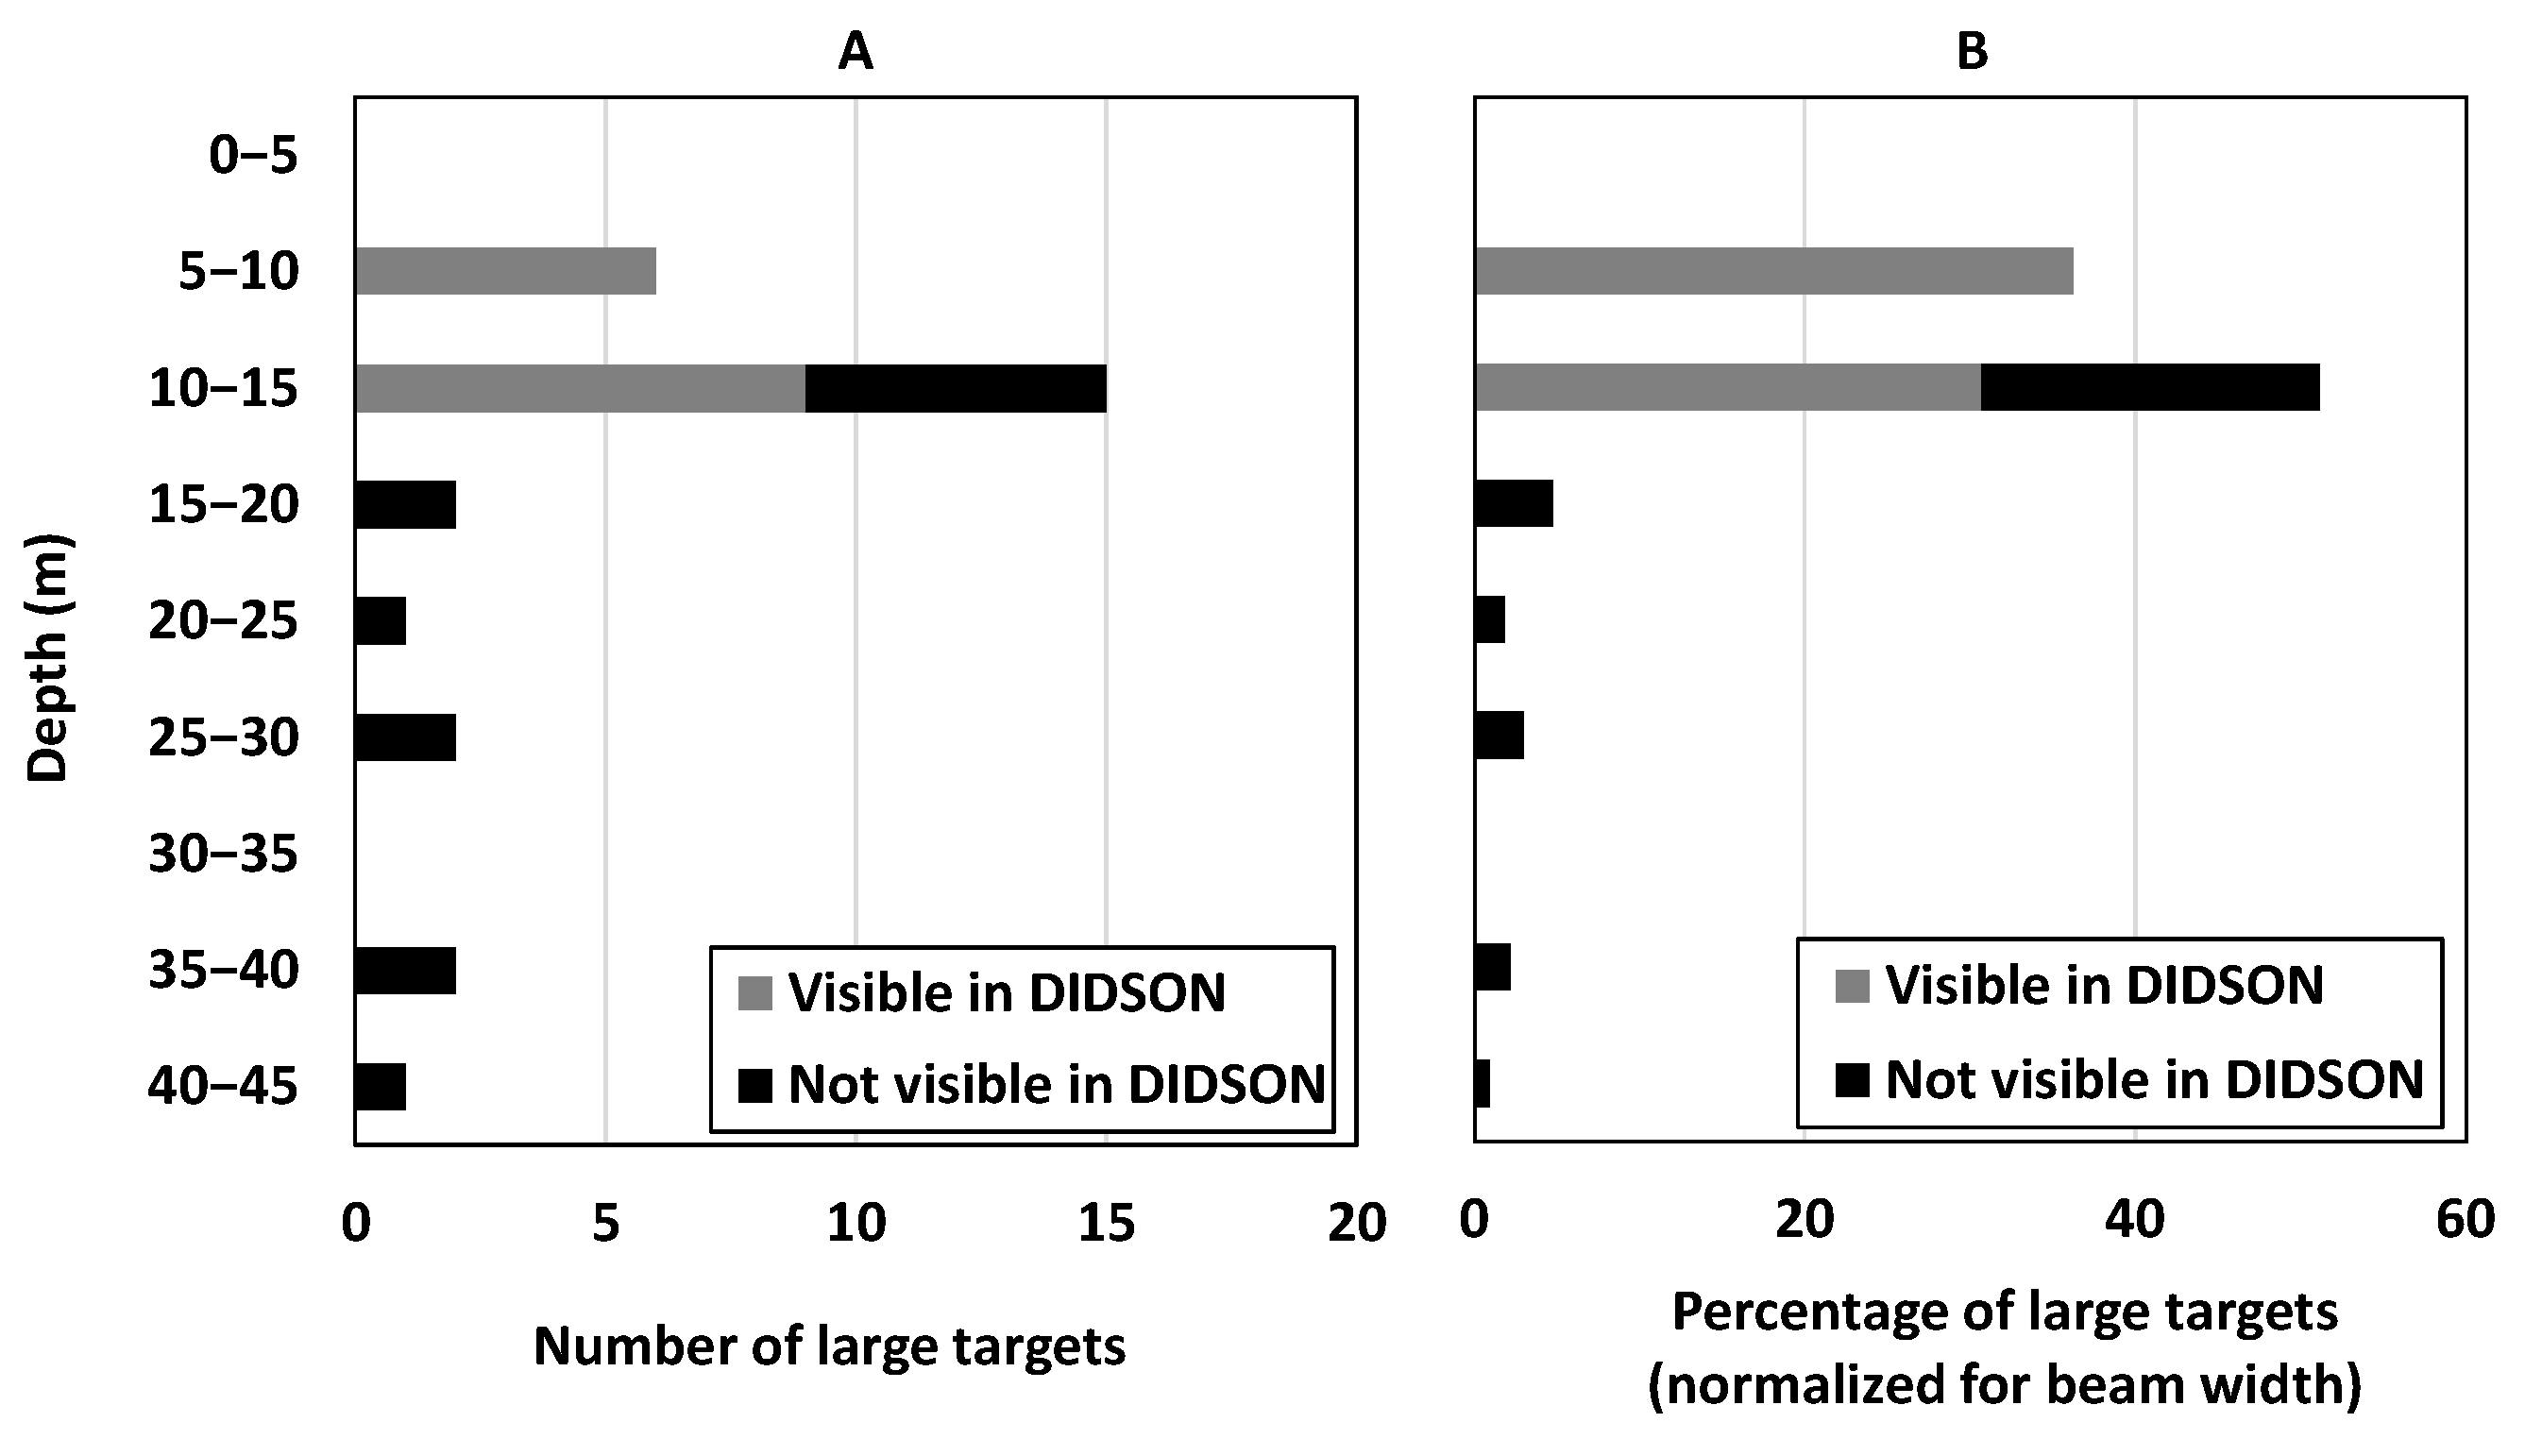
Downlooking echosounder data were collected in Western Passage at three sites (Table 1) close to the international boundary between the USA and Canada (Figure 1) from a 12.2-m vessel moored at each site. Site 2 is closest to the location for a tidal turbine project. Sites 1 and 3 were control sites. Current speeds in the passage can exceed 2 m·s−1 at peak flows [35,36], and the vessel changed positions (<100 m) when it swung on its mooring line during tidal changes.
One echosounder was a Simrad ES60 with a single beam (not split beam) 38/200 Combi W transducer facing downward on the port side of the vessel, 1 m below the surface (Figure 2). The transducer operated simultaneously at 38 and 200 kHz and had a 31° half power beam angle. Both frequencies operated at a rate of 2 pings·s−1 and at a pulse duration of 0.512 ms. Transmit power was 320 W for 38 kHz and 225 W for 200 kHz. The echosounder was characterized annually on a frozen lake prior to each year’s surveys, allowing the data to be calibrated. The frozen lake provided a stable platform that allowed precise placement of the copper calibration spheres (60.0 mm diameter for 38 kHz; 13.7 mm for 200 kHz; see [37]) on the maximum response axis of the acoustic beam, as well as at known angles off-axis for beam pattern characterization. Possible effects of temperature on calibration parameters were assumed to be negligible for this application of large target detection and were not accounted for in data calibration. Additionally, in situ on-axis sphere measurements were collected once every survey during a slack tide. Precise sphere placement could not be ensured in these instances, but in situ data helped to confirm consistent system performance and data collection.
A DIDSON (Dual frequency IDentification SONar, Sound Metrics Corp., Seattle, WA, USA) acoustic camera (multibeam echosounder) was operated simultaneously along with the single beam echosounder, also facing downward on the port side of the vessel and 1 m below the surface. The DIDSON was mounted 0.31 m aft of the Simrad single beam transducer (Figure 2). The DIDSON unit operated in high frequency mode (1.8 MHz), sampling the water column from approximately 2 to 12 m below the surface. The DIDSON’s sampled volume consists of 96 acoustic beams that are each 0.3° by 14°, sampling in total a 29° by 14° volume of water. Data were collected at 8 frames per second.
Surface current speeds were measured with a flowmeter (Marsh McBirney) from May 2010 through June 2011 and an Acoustic Doppler Current Profiler (ADCP) (RD Instruments Workhorse Sentinel) operating at 300 kHz in August and September 2011. The ADCP sampled for 80 s every thirty minutes during each survey, with depth cells of 1 m, which were used to obtain a water column average. These devices were also mounted on the survey vessel, 1 m below the surface on the starboard side. No acoustic interference was encountered between the ADCP and the other sensors.
Each site survey spanned 24 h, capturing diel and tidal changes. All surveys were scheduled close to dates of neap tides to avoid potential confounding effects from the semi-lunar tidal cycle. In total, 384 h of data were collected and analyzed.
Data were processed using Echoview® 6.1 (Echoview Software Pty. Ltd., Hobart, Australia). For the Simrad single beam echosounder data, parameters from the winter calibrations were applied to the raw backscatter data, and sound speed and absorption coefficients were calculated based on in situ water temperature and salinity. A target strength (TS) threshold of −30 dB re 1 m2 was applied to the 38 kHz calibrated TS data (from here on referred to as “Simrad data”) [38]. The Simrad data were viewed alongside concurrently collected footage from the DIDSON (from here on referred to as “DIDSON data”), to which no threshold was applied. The TS threshold removed the majority of backscatter (e.g., entrained air) from the Simrad data except for that from strong scatterers, such as dense schools of fish (Figure 3), large individual fish (e.g., sharks and tuna) (Figure 4), and marine mammals (Figure 5) [30,38,39]. This made it simple to peruse the Simrad data for acoustic scattering that was most likely to be caused by fish schools and the large organisms of interest. Fish schools, which were excluded from analysis, typically appeared as regions of backscatter >1 m in height (Figure 3), whereas backscatter from large individual animals typically appeared as a thin band <1 m thick. If a strong target visible in the Simrad data was between 2 and 12 m from the surface, it could often be seen in the DIDSON data as well (Figure 2). Using the imaging quality of the DIDSON data, the viewer then distinguished large individual animals from thin, dense schools of fish. The sampled volumes of the Simrad and DIDSON overlapped almost completely, making it unlikely that a large target could be in the DIDSON view but not in the Simrad echogram, particularly given that these strong sound scatterers were likely detectable to some degree beyond the Simrad’s half power beam angle.
The measuring tool in Echoview was used to approximate the length of individual large animals seen in the DIDSON data. Each animal was then identified to the lowest taxonomic level possible based on anatomical features and tail-beat movement. Strong acoustic targets in the Simrad data that were beyond the range of the DIDSON could not be verified as belonging to large animals. For each strong target, current speed from the nearest measurement was recorded, along with diel stage (day/night) and tidal stage (ebb/flood). Rates of strong target detection were determined for each survey by dividing the number of detections by the total number of hours surveyed at the site. As the acoustic beams of each echosounder increased with range, the sampled volume (and therefore the detection probability of targets) also increased with range. Therefore, numbers of targets detected in the Simrad data were also inspected after normalizing for athwartship beam width at the midpoint of each depth bin, approximated as width = 2 ∗ range ∗ tan (15.5°). The extent to which strong targets may have been detected outside of the half power beam angle was not accounted for here, as it could not be quantified with the available information.

3. Results

There were 29 large targets evident in the Simrad data in 2010 and 2011. Of these, 15 were visible in the DIDSON data and 14 were not (Table 2). Eight of the 15 visible targets were determined to be from the infraorder Cetacea (most likely porpoises; [26]), one was determined to be from the superorder Selachimorpha (a shark), and six were unidentifiable (still visible in DIDSON) due to poor positioning in the DIDSON sampled volume relative to the animal. Of the 15 animals that were visible in the DIDSON data, 13 were present during daylight and 12 were present during a flooding tide. Of those targets not visible in the DIDSON, 13 of the 14 were present in daylight, and nine of the 14 were present during flood tide. Eleven of the 15 animals visible in the DIDSON were present in current speeds under 1 m·s−1, as were nine of the 14 targets that were not visible in the DIDSON (Figure 6). Twenty-three of the 29 potential large animals (both visible and not visible in the DIDSON data) were at depths less than 20 m (Figure 7A). When normalized for sampled volume, this equates to 92% of targets at less than 20 m depth (Figure 7B). The monthly rates of strong target detection ranged from 0 to 0.25 per hour, or 0 to 6 per day (Table 2).

4. Discussion

Fish and mammals are often cited as major concerns associated with MRE development in coastal areas [4]. The data on large marine animals presented here were collected ancillary to fish assessments in this region [11]. Having preliminary data for both fish and marine mammals in a region is crucial for permitting and regulatory decision-making associated with MRE pilot projects. Planned use of Western Passage for a tidal turbine project provided the means for collecting downlooking hydroacoustic data during two years at three sites. The combined use of a wide-angle single beam echosounder with an acoustic camera allowed us to quickly examine data for stronger sound scatterers than individual fish and most fish schools typical to the area, such as herring and mackerel. The DIDSON acoustic camera provided enough information to identify the taxa of nine of the 15 strong targets that were within its range.
Results of standardized visual surveys from shore are difficult to compare to the results of our hydroacoustic surveys. However, a visual survey [26] between sites 1 and 2 in 2013 had sightings of harbor seals, gray seals, harbor porpoises, and minke whales. Harbor porpoises were dominant in all surveyed months. Visual survey efforts ranged from 18 h in May to 41.5 h in September. Peak abundance of porpoises in 2013 visual surveys was in August, while peak abundance of large animals in our surveys of 2010 and 2011 were in September. Rate of detection for our surveys never exceeded 0.25 h−1, whereas the Ocean Renewable Power Company (OPRC) visual survey had a peak rate of 7.6 porpoises per hour in August. It should be noted that the visual observation area is much larger than the area spanned by the hydroacoustic equipment. The volume sampled by the Simrad single beam echosounder is closer in scale to the volume that would be occupied by a single tidal turbine or similar CEC device, and the area spanned by the visual survey is closer in scale to the footprint of an array of multiple devices. As such, the visual survey is likely an overestimation of the number of animals that may encounter a single deployed device but may be more applicable to an array of them. Similarly, the hydroacoustic surveys likely provide information that is most pertinent to a single device than to an array. The [26] survey also noted harbor seals, gray seals, and minke whales. None of the animals visible in the DIDSON data were large enough to be a minke whale or appeared to be shaped like a seal, but this does not preclude them from having been detected at greater depths, outside of the DIDSON’s sampled volume.
Most (69%) strong target detections (both visible and not visible in the DIDSON data) occurred in currents less than 1 m·s−1. Assuming that a cut-in current speed for a theoretical turbine technology is 1 m·s−1, most animals detected in our surveys would not have overlapped with a rotating turbine. Furthermore, most detections occurred during daylight hours, indicating that larger species found in Western Passage, at the sampled sites, may be most active during the day. Being most active in daylight would likely increase these animals’ ability to avoid a deployed tidal turbine using visual cues, decreasing the probability of negative interactions. Additionally, this information suggests that daytime visual observations may be a good indicator of marine mammal presence in the region [21]. Three-dimensional distribution of animals in the water column is a data gap and a need for regulators. These data also provide information on depth usage by marine animals, which is missing from surface-based observations and often from passive vocalization methods, though some studies do conduct 3D localization [23]. Depth use of monitored organisms will be important in areas where MRE devices are deployed [9,11,37,40,41,42]. All devices have underwater components (e.g., turbines, mooring lines, and support frames) which could interact with marine animals. The depth of these components is known and provides important reference points for evaluating risk to animals. In this study, the Simrad single beam echosounder sampled the full water column, providing information on organism depth from surface to seafloor. Most strong acoustic targets in the Simrad data were less than 20 m deep and were therefore above the minimum depth of the potential tidal turbines that could be deployed in Western Passage (20 m below mean lower low water level (ORPC pers. comm.)). In addition to these data, the DIDSON data provided images with resolution high enough for taxonomic identification of 60% of in-range detections. In high-frequency mode, the DIDSON could not sample the depths coinciding with that of a tidal turbine. However, when operating in low-frequency mode, it can cover a range of up to 30 m. Using the DIDSON in low-frequency mode decreases resolution, but while this is a problem for discriminating small organisms such as fish (i.e., herring and mackerel), it is less of an issue for discriminating large fish and marine mammals and could increase the range of target verification substantially.
Continuous DIDSON surveys result in large data storage requirements and often require extensive manual processing to screen the data for target species [43]. We were able to speed up this process by screening the simultaneously collected Simrad data with a high TS threshold, which removed most backscatter except that of strong acoustic targets. By searching out only backscatter of −30 dB re 1 m2 and greater (a process which may be automated in future studies), we reduced the DIDSON data processing requirement to a small fraction of its total. The time saved in DIDSON processing using these methods can equal significant cost savings for marine animal monitoring if the cost of paying personnel is a factor. A commercial-grade single beam echosounder can be purchased for around 10,000 USD, likely less than the cost of paying for manual processing of large amounts of DIDSON data. There are also cost savings that could be realized by incorporating fish monitoring with these surveys. The data used here were originally collected for preliminary fish surveys associated with the potential installation of the tidal turbine, and these survey methods have become standard protocol for this site [11]. Collecting data for use in both fish and mammal studies simultaneously, in addition to visual mammal surveys during daylight hours, could significantly decrease total vessel time required and reduce monitoring costs.
On the other hand, there are challenges associated with these combined methods. While the single beam echosounder is a low-cost piece of equipment, acoustic cameras like the DIDSON or Adaptive Resolution Imaging Sonar (ARIS) are costly and in the range of 85,000–90,000 USD. The volume of water that can be sampled in downlooking hydroacoustic surveys is limited. The single beam Simrad echosounder can sample hundreds of meters (depending on frequency), but the DIDSON range is limited to 10 to 30 m due to the fast absorption rate of high-frequency sound underwater. Both the Simrad and DIDSON have limited sampling width. These volume restrictions may not be an issue when observing a single MRE device, but an array of devices would cover larger geographic areas and require greater horizontal coverage. Proper survey design could, however, accomplish additional coverage in the form of transects or other types of mobile sampling. When planning a specific survey design, it is also important to consider sample size. This study had a small sample size and thus limited analyses were possible. While this dataset may prove to qualify for a valid pilot study for a proposed MRE site, the goal or consenting requirement of a study is often a relative or absolute density estimate of one or more assemblages or populations of animals. These methods, along with more effort that includes increased survey frequency with mobile survey coverage, may provide a robust density estimate. Lastly, in the event of a situation that involves low overall detection rates, a robust density estimate may be difficult or impossible [44]. These methods may still provide an important dataset for adaptive management and/or cumulative impact assessment [45,46] The US National Marine Fisheries Service introduced anthropogenic sound emission thresholds and guidelines documentation in 2016 (updated in 2018) [47] to quantify and reduce sound emissions in the oceans. Based on these guidelines, we recommend using echosounders that operate with a nominal frequency above 160 kHz to reduce potential effects to marine mammals.
While the individual use of a DIDSON acoustic camera or Simrad echosounder has certain limitations, the simultaneous use of both allows the detection of strong acoustic targets, such as large fish and marine mammals, throughout the water column as well as the identification of those within DIDSON range. Additionally, hydroacoustic surveys are not dependent on good visibility, unlike surface-based visual surveys, nor do they rely on vocalizations, like passive acoustic monitoring. A hydroacoustic survey such as the one presented here, used in conjunction with visual surveys at the surface and/or passive acoustic monitoring, could provide a more holistic view of marine mammal use of the water column at MRE sites.

5. Conclusions

The initial stages of the developing MRE industries and their associated environmental monitoring require the implementation of new technologies and new ways of processing data from existing technologies. The methods presented here contribute to the challenge of observing and measuring marine mammals and other large marine animals at potential MRE sites. They are a viable means to efficiently monitor a single device-specific area for large fish and marine mammals by analyzing hydroacoustic data from single beam echosounders and acoustic cameras simultaneously. This study demonstrated the utility of this method at a potential tidal energy site in Western Passage, Maine, and provided preliminary information on the large animals that were present. Combined with existing technologies and methods, this methodology could improve baseline and monitoring datasets. These methods may be adapted to other MRE sites around the world.

Supplementary Materials

The following are available online at https://www.mdpi.com/2077-1312/8/9/704/s1, Video S1: Marine Mammal, Video S2: Fish School Video, Video S3: Shark Video.

Author Contributions

Conceptualization, G.S.; methodology, G.S., R.K.; validation, G.S., R.K., H.A.V.; formal analysis, H.A.V., G.S.; investigation, G.B.Z., H.A.V.; resources, G.B.Z.; data curation, G.S., R.K., H.A.V.; writing—original draft preparation, G.S.; writing—review and editing, G.S., H.A.V., R.K., G.B.Z.; visualization, R.K., H.A.V.; supervision, G.B.Z., G.S.; project administration, G.B.Z.; funding acquisition, G.B.Z. All authors have read and agreed to the published version of the manuscript.

Funding

This research was funded by United States Department of Energy: DE-EE0000298.

Acknowledgments

We thank Ocean Renewable Power Company for contributing resources and their cooperation to make this research possible. The views expressed herein are those of the authors and do not necessarily reflect the views of Ocean Renewable Power Company or any of its subagencies. Thanks to the Maine Tidal Power Initiative and the University of Maine for their contributions and to Captain George Harris, Jr. and crew for their assistance in the field. This project was supported by the USDA National Institute of Food and Agriculture, Hatch Project Number MEO-031716, through the Maine Agricultural and Forest Experiment Station, Publication Number 3768. We appreciate the assistance of Aurélie Daroux in creating supplementary video materials of DIDSON footage.

Conflicts of Interest

The authors declare no conflict of interest. The funders had no role in the design of the study; in the collection, analyses, or interpretation of data; in the writing of the manuscript, or in the decision to publish the results.

References

  1. Papathanasopoulou, E.; Beaumont, N.; Hooper, T.; Nunes, J.; Queirós, A.M. Energy systems and their impacts on marine ecosystem services. Renew. Sustain. Energy Rev. 2015, 52, 917–926. [Google Scholar] [CrossRef]
  2. Hau, J.L.; Bakshi, B.R. Expanding exergy analysis to account for ecosystem products and services. Environ. Sci. Technol. 2004, 38, 3768–3777. [Google Scholar] [CrossRef] [PubMed]
  3. Soukissian, T.H.; Denaxa, D.; Karathanasi, F.; Prospathodpoulos, A.; Sarantakos, K.; Iona, A.; Georgantas, K.; Mavrakos, S. Marine Renewable Energy in the Mediterranean Sea: Status and Perspectives. Energies 2017, 10, 1512. [Google Scholar] [CrossRef] [Green Version]
  4. Boehlert, G.W.; Gill, A.B. Environmental and ecological effects of ocean renewable energy development: A current synthesis. Oceanography 2010, 23, 68–81. [Google Scholar] [CrossRef] [Green Version]
  5. Shields, M.A.; Woolf, D.K.; Grist, E.P.; Kerr, S.A.; Jackson, A.C.; Harris, R.E.; Bell, M.C.; Beharie, R.; Want, A.; Osalusi, E. Marine renewable energy: The ecological implications of altering the hydrodynamics of the marine environment. Ocean Coast. Manag. 2011, 54, 2–9. [Google Scholar] [CrossRef]
  6. Gill, A.B. Offshore renewable energy: Ecological implications of generating electricity in the coastal zone. J. Appl. Ecol. 2005, 42, 605–615. [Google Scholar] [CrossRef] [Green Version]
  7. Jansujwicz, J.S.; Johnson, T.R. Understanding and informing permitting decisions for tidal energy development using an adaptive management framework. Estuaries Coasts 2015, 38, 253–265. [Google Scholar] [CrossRef] [Green Version]
  8. Cada, G.; Ahlgrimm, J.; Bahleda, M.; Bigford, T.; Stavrakas, S.D.; Hall, D.; Moursund, R.; Sale, M. Potential impacts of hydrokinetic and wave energy conversion technologies on aquatic environments. Fisheries 2007, 32, 174–181. [Google Scholar] [CrossRef]
  9. Scherelis, C.; Penesis, I.; Marsh, P.; Cossu, R.; Hemer, M.; Wright, J. Relating fish distributions to physical characteristics of a tidal energy candidate site in the Banks Strait, Australia. In Proceedings of the 13th European Wave and Tidal Energy Conference (EWTEC2019), Naples, Italy, 1–6 September 2019. [Google Scholar]
  10. Viehman, H.A.; Boucher, T.; Redden, A. Winter and summer differences in probability of fish encounter (spatial overlap) with MHK devices. Int. Mar. Energy J. 2018, 1, 9–18. [Google Scholar] [CrossRef]
  11. Viehman, H.A.; Zydlewski, G.B.; McCleave, J.D.; Staines, G.J. Using hydroacoustics to understand fish presence and vertical distribution in a tidally dynamic region targeted for energy extraction. Estuaries Coasts 2015, 38, 215–226. [Google Scholar] [CrossRef]
  12. Polagye, B.; Copping, A.; Suryan, R.; Kramer, S.; Brown-Saracino, J.; Smith, C. Instrumentation for Monitoring Around Marine Renewable Energy Converters: Workshop Final Report; PNNL-23110 for the U.S. Department of Energy: Washington, DC, USA, 2014. [Google Scholar]
  13. O’Connor, M.; Lewis, T.; Dalton, G. Weather window analysis of Irish west coast wave data with relevance to operations & maintenance of marine renewables. Renew. Energy 2013, 52, 57–66. [Google Scholar]
  14. Kofoed, J.P.; Frigaard, P.; Friis-Madsen, E.; Sørensen, H.C. Prototype testing of the wave energy converter wave dragon. Renew. Energy 2006, 31, 181–189. [Google Scholar] [CrossRef] [Green Version]
  15. Francisco, F.; Sundberg, J. Detection of visual signatures of marine mammals and fish within marine renewable energy farms using multibeam imaging sonar. J. Mar. Sci. Eng. 2019, 7, 22. [Google Scholar] [CrossRef] [Green Version]
  16. Williamson, B.J.; Blondel, P.; Armstrong, E.; Bell, P.S.; Hall, C.; Waggit, J.J.; Scott, B.E. A self-contained subsea platform for acoustic monitoring of the environment around marine renewable energy devices—Field deployments at wave and tidal energy sites in Orkney, Scotland. IEEE J. Ocean Eng. 2016, 41, 67–81. [Google Scholar]
  17. Fraser, S.; Williamson, B.; Scott, B.E.; Nikora, V. Active acoustic monitoring in extreme turbulence around marine renewable energy devices. J. Acoust. Soc. Am. 2016, 139, 2174. [Google Scholar] [CrossRef]
  18. Stein, P.J.; Edson, P. Underwater Active Acoustic Monitoring Network for Marine and Hydrokinetic Energy Projects; Final Technical Report for the US Department of Energy: Washington, DC, USA, 2013. [Google Scholar]
  19. Cameron, L.W.; Roche, W.K.; Houghton, J.D.; Mensink, P.J. Population structure and spatial distribution of porbeagles (Lamna nasus) in Irish waters. ICES J. Mar. Sci. 2019, 76, 1581–1590. [Google Scholar] [CrossRef]
  20. Kiilu, B.K.; Kaunda-Arara, B.; Oddenyo, R.M.; Thoya, P.; Njiru, J.M. Spatial distribution, seasonal abundance and exploitation status of shark species in Kenyan coastal waters. Afr. J. Mar. Sci. 2019, 41, 191–201. [Google Scholar] [CrossRef]
  21. Kinzey, D.; Olson, P.; Gerrodette, T. Marine Mammal Data Collection Procedures on Research Ship Line-Transect Surveys; Administrative Report LJ-00-08; Southwest Fisheries Science Center: San Diego, CA, USA, 2000. [Google Scholar]
  22. Mellinger, D.K.; Stafford, K.M.; Moore, S.E.; Dziak, R.P.; Matsumoto, H. An overview of fixed passive acoustic observation methods for cetaceans. Oceanography 2007, 20, 36–45. [Google Scholar] [CrossRef] [Green Version]
  23. Gillespie, D.; Palmer, L.; Macaulay, J.; Sparling, C.; Hastie, G. Passive acoustic methods for tracking the 3D movements of small cetaceans around marine structures. PLoS ONE 2020, 15, e0229058. [Google Scholar] [CrossRef]
  24. ORPC; Maine LLC. 156 FERC ¶ 62,032, Order Issuing Preliminary Permit; Project No. P-14743; ORPC: Portland, ME, USA, 2016. [Google Scholar]
  25. Kovacs, K.M.; Jonas, K.M.; Welke, S.E. Sex and age segregation by Phoca vitulina concolor at haul-out sites during the breeding season in the Passamaquoddy Bay region, New Brunswick. Mar. Mammal. Sci. 1990, 6, 204–214. [Google Scholar] [CrossRef]
  26. ORPC. FERC Project Progress Report No. 6; Western Passage Tidal Energy Project (P-12680); ORPC: Portland, ME, USA, 2013; p. 67. [Google Scholar]
  27. Staines, G.J.; Zydlewski, G.B.; Viehman, H.A. Changes in Relative Fish Density Around a Deployed Tidal Turbine During on-water Activities. Sustainability 2019, 11, 6262. [Google Scholar] [CrossRef] [Green Version]
  28. Staines, G.; Zydlewski, G.; Viehman, H.; Shen, H.; McCleave, J. Changes in vertical fish distributions near a hydrokinetic device in Cobscook Bay, Maine, USA. In Proceedings of the 11th European Wave and Tidal Energy Conference (EWTEC2015), Nantes, France, 6–11 September 2015; pp. 6–11. [Google Scholar]
  29. Benoit-Bird, K.J.; Southall, B.L.; Moline, M.A. Dynamic foraging by Risso’s dolphins revealed in four dimensions. Mar. Ecol. Prog. Ser. 2019, 632, 221–234. [Google Scholar] [CrossRef]
  30. Geoffroy, M.; Rousseau, S.; Knudsen, F.R.; Fortier, L. Target strengths and echotraces of whales and seals in the Canadian Beaufort Sea. ICES J. Mar. Sci. 2016, 73, 451–463. [Google Scholar] [CrossRef]
  31. Au, W.L. Acoustic reflectivity of a dolphin. J. Acoust. Soc. Am. 1996, 99, 3844–3848. [Google Scholar] [CrossRef] [PubMed]
  32. Benoit-Bird, K.J.; Au, W.W. Phonation behavior of cooperatively foraging spinner dolphins. J. Acoust. Soc. Am. 2009, 125, 539–546. [Google Scholar] [CrossRef]
  33. Benoit-Bird, K.J.; Au, W.W. Cooperative prey herding by the pelagic dolphin, Stenella longirostris. J. Acoust. Soc. Am. 2009, 125, 125–137. [Google Scholar] [CrossRef] [Green Version]
  34. Athearn, K.; Bartlett, C. Saltwater Fishing in Cobscook Bay: Angler Profile and Economic Impact; The University of Maine: Orono, ME, USA, 2008; Volume 6. [Google Scholar]
  35. Brooks, D.A. The tidal-stream energy resource in Passamaquoddy—Cobscook Bays: A fresh look at an old story. Renew. Energy 2006, 31, 2284–2295. [Google Scholar] [CrossRef]
  36. Brooks, D.A. Tides and tidal power in Passamaquoddy Bay: A numerical simulation. Cont. Shelf Res. 1992, 12, 675–716. [Google Scholar] [CrossRef]
  37. Viehman, H.A. Fish in a Tidally Dynamic Region in Maine: Hydroacoustic Assessments in Relation to Tidal Power Development. Master’s Thesis, University of Maine, Orono, ME, USA, 2012. [Google Scholar]
  38. Doksæter, L.; Godø, O.R.; Olsen, E.; Nøttestad, L.; Patel, R. Ecological studies of marine mammals using a seabed-mounted echosounder. ICES J. Mar. Sci. 2009, 66, 1029–1036. [Google Scholar] [CrossRef]
  39. Lieber, L.; Nimmo-Smith, W.A.M.; Waggitt, J.J.; Kregting, L. Fine-scale hydrodynamic metrics underlying predator occupancy patterns in tidal stream environments. Ecol. Indic. 2018, 94, 397–408. [Google Scholar] [CrossRef] [Green Version]
  40. Shen, H.; Zydlewski, G.B.; Viehman, H.A.; Staines, G. Estimating the probability of fish encountering a marine hydrokinetic device. Renew. Energy 2016, 97, 746–756. [Google Scholar] [CrossRef] [Green Version]
  41. Broadhurst, M.; Barr, S.; Orme, C.D.L. In-Situ ecological interactions with a deployed tidal energy device; an observational pilot study. Ocean Coast. Manag. 2014, 99, 31–38. [Google Scholar] [CrossRef]
  42. Fraser, S.; Williamson, B.J.; Nikora, V.; Scott, B.E. Fish Distributions in a tidal channel indicate the behavioural impact of a marine renewable energy installation. Energy Rep. 2018, 4, 65–69. [Google Scholar] [CrossRef]
  43. Viehman, H.A.; Zydlewski, G.B. Fish interactions with a commercial-scale tidal energy device in the natural environment. Estuaries Coasts 2015, 38, 241–252. [Google Scholar] [CrossRef]
  44. Benjamins, S.; Macleod, A.; Greenhill, L.; Wilson, B. Surveying marine mammals in nearby tidal energy development sites: A comparison. In Proceedings of the 11th European Wave and Tidal Energy Conference, Nantes, France, 6–11 September 2015; pp. 6–11. [Google Scholar]
  45. Halpern, B.S.; Fujita, R. Assumptions, challenges, and future directions in cumulative impact analysis. Ecosphere 2013, 4, 1–11. [Google Scholar] [CrossRef]
  46. Smit, B.; Spalding, H. Methods for cumulative effects assessment. Environ. Impact Assess. Rev. 1995, 15, 81–106. [Google Scholar] [CrossRef]
  47. National Marine Fisheries Service. 2018 Revisions To: Technical Guidance for Assessing the Effects of Anthropogenic Sound on Marine Mammal Hearing (Version 2.0): Underwater Thresholds for Onset of Permanent and Temporary Threshold Shifts; NOAA Technical Memorandum NMFS-OPR-59; U.S. Department of Commerce, NOAA: Washington, DC, USA, 2018; p. 167. [Google Scholar]
Figure 1. Map of the hydroacoustic sampling sites in Western Passage. Inset map shows Maine, USA and the red square represents the large-scale map. Site 2 was a tidal turbine project site and sites 1 and 3 were control sites for fish biomass and vertical distribution comparisons. The town of Eastport, Maine is just south of site 2. Dark gray indicates Canada and light gray indicates the US. Coordinate grid is latitude and longitude in decimal degrees.
Jmse 08 00704 g001
Figure 2. Schematic of the deployment of the Simrad single beam echosounder and the DIDSON acoustic camera. Both units were 1 m below the surface and the DIDSON was 0.31 m aft of the Simrad. The DIDSON unit begins data collection 1 m deeper than the location of the instrument. The single beam echosounder has a circular, roughly conical beam of 31°, while the DIDSON has a roughly rectangular frustum beam that is 14° by 29°.
Jmse 08 00704 g002
Figure 3. Simultaneous views of a fish school collected with the Simrad single beam echosounder and −30 dB re 1 m2 threshold applied. A DIDSON data frame is on right, has no threshold applied, and corresponds in time to vertical dashed line in the Simrad echogram. Time on the Simrad single beam echosounder is from left to right. Time on the DIDSON is frame by frame like a video. See supplementary file for video.
Jmse 08 00704 g003
Figure 4. Simultaneous views of a shark collected with the Simrad single beam echosounder and the DIDSON acoustic camera. Simrad TS data are shown in the echogram on the left, which has a −30 dB re 1 m2 threshold applied. A DIDSON data frame is on right, has no threshold applied, and corresponds in time to vertical dashed line in the Simrad echogram. Time on the Simrad single beam echosounder is from left to right. Time on the DIDSON is frame by frame like a video. See supplementary file for video.
Jmse 08 00704 g004
Figure 5. Simultaneous views of a porpoise collected with the Simrad single beam echosounder and the DIDSON acoustic camera. Simrad TS data are shown in the echogram on the left, which has a −30 dB re 1 m2 threshold applied. A DIDSON data frame is on right, has no threshold applied, and corresponds in time to vertical dashed line in the Simrad echogram. Time on the Simrad single beam echosounder is from left to right. Time on the DIDSON is frame by frame like a video. See supplementary file for video.
Jmse 08 00704 g005
Figure 6. Distribution of current speeds at the time of occurrence for all large targets detected in Western Passage. Gray indicates those that were visible in the DIDSON and black indicates those that were not visible in the DIDSON. Vertical dashed line indicates the speed at which an assumed tidal turbine would begin to rotate (1 m·s−1) based on depth-averaged current velocity from ADCP data.
Jmse 08 00704 g006
Figure 7. (A) Vertical distribution of all potential large animals detected in Western Passage. Gray indicates those that were visible in the DIDSON and black indicates those that were not visible in the DIDSON; (B) Vertical distribution of all potential large animals detected in Western Passage, normalized for acoustic beam width that increases with range. Gray indicates those that were visible in the DIDSON and black indicates those that were not visible in the DIDSON.
Jmse 08 00704 g007
Table 1. Characteristics of each sampling site and months of 24-h hydroacoustic surveys. Depth variation is due to tidal stage, bathymetry, and vessel movement.
SiteLongitudeLatitudeAvg. Depth (m)2010 Survey Months2011 Survey Months
167.99844.92235May, Jun, Aug, SepMay, Jun, Aug, Sep
266.97944.91231May, Jun, Aug, Sep-
367.00444.93742-May, Jun, Aug, Sep
Table 2. All detections of strong acoustic targets with TS greater than −30 dB re 1 m2 and less than 1 m in height in the Simrad data. When a valid length measurement was not possible, a dash was entered. Each survey month represents a single 24-h survey.
YearMonthSiteDetection Rate (h−1)Visible in DIDSON (Yes/No)Day or NightFlood or Ebb TideDepth (m)Current Speed (m·s−1)Length (m)Taxon
2010May10.08NDF28.50.31-unknown
NDF40.30.70-unknown
Jun20.04NDE39.40.39-unknown
Aug10.04YDF10.40.262.10Cetacea
20.08YDE11.00.222.45Cetacea
YNE10.10.172.47Cetacea
Sep10.04YDE10.80.36-unknown
20.17YDE9.60.33-unknown
YDE8.60.182.10Cetacea
YDE10.20.65-Cetacea
YDF6.91.61-unknown
2011May10.00
Jun30.00
Aug10.13YDE10.90.472.03Cetacea
NDE15.80.45-unknown
YDF10.20.38-unknown
30.17NDE14.21.18-unknown
YDE7.61.202.77Cetacea
YDE9.21.102.21Selachii
NDE38.30.92-unknown
Sep10.21NNE24.80.35-unknown
YDF9.90.882.15Cetacea
NDF15.20.88-unknown
NDF11.90.87-unknown
NDF13.50.36-unknown
30.25YDE11.81.57-unknown
YDE11.60.81-unknown
NDF25.51.81-unknown
NDF13.62.22-unknown
NDF13.02.20-unknown
NDF12.32.20-unknown

