1. Introduction
Marine propulsion systems have witnessed rapid improvements owing to the development of ultra-long-stroke diesel engines such as the MAN Energy Solutions (MAN ES) G-type (Green) [
1,
2] and Winterthur & Gas Diesel (WinGD) X-type models [
3,
4], which offer lower maximum revolution rates. These engines afford enhanced propulsion efficiencies as well as low repair and maintenance costs, which has contributed to their wide usage. However, such engines afford higher powers at lower speeds, which results in higher torsional vibrations that can adversely affect the fatigue strength of the shafting system. Solutions and techniques to control torsional vibrations include the installation of a torsional damper or turning wheel [
5,
6,
7,
8], changing the fillet design of the shaft flange from single-radius to multi-radius [
9,
10], and the application of the dynamic limiter function [
11] proposed by MAN ES or Delta Bypass tuning [
12] by WinGD.
Meanwhile, comparisons between the designs of 5- to 7-cylinder engines have indicated that diesel engines with fewer cylinders afford a lower speed and a wider barred speed range (BSR) owing to high torsional vibrations [
13]. Increased torsional vibrations during BSR passage can adversely affect the ship’s safety. In particular, the BSR passage time for a “fewer-cylinder engine” is longer than those of engines with more cylinders. Moreover, the torsional vibration during BSR passage depends on the ship maneuvering conditions and engine operation settings. Additionally, the presence of higher torsional vibrations necessitates one or both shafts to be large in size and made of higher-tensile-strength material. Torsional vibration dampers are also increasingly required for vessels equipped with ultra-long-stroke engines.
It is well known that every machine part eventually fails owing to fatigue after a certain number of loading cycles. As per Miner’s rule [
14], the fractional fatigue damage is linearly proportional to the torsional vibration stress amplitude (when both are expressed in the log scale). Thus, the fatigue fracture of shafts due to BSR passage is a matter of concern. The torsional fatigue lifetime of the shafting system can be estimated by calculating the accumulated fractional damage during each passage. This can prevent accidents and ensure the safety and reliability of the entire propulsion system.
Against this backdrop, in this study, we carried out a series of BSR passage experiments to evaluate the shaft performance under different engine operation patterns. The fractional damage accumulations due to transient torsional vibration stresses were calculated to estimate the fatigue lifetime of the shafting system. Consequently, we determined the optimal engine operation conditions to ensure optimal BSR passage.
2. Materials and Methods
2.1. Calculation of Accumulated Fractional Fatigue Damage
Miner’s rule is one of the most widely used methods to calculate failures caused by cyclic/time-variant loading [
14,
15]. The rule is based on a linear damage accumulation model that uses a load time history and the stress-life (S–N) curve as inputs to calculate the damage. The S–N curve refers to the plot of the magnitude of alternating stress as the function of the number of cycles leading to failure for a given structure. Both the stress and number of cycles are plotted on a logarithmic scale. Here, we consider the situation wherein a rotating shaft is subjected to n
1 cycles at torsional vibration stress level
,
n2 cycles at torsional vibration stress level
, …, and
nN* cycles at torsional vibration stress level
.
Figure 1 shows the S–N curve in log-log scale for a given shaft, from which the number of torsional vibration cycles leading to failure at each stress level can be determined, i.e.,
N1 cycles at stress level
,
N2 cycles at stress level
, …,
NN* cycles at stress level
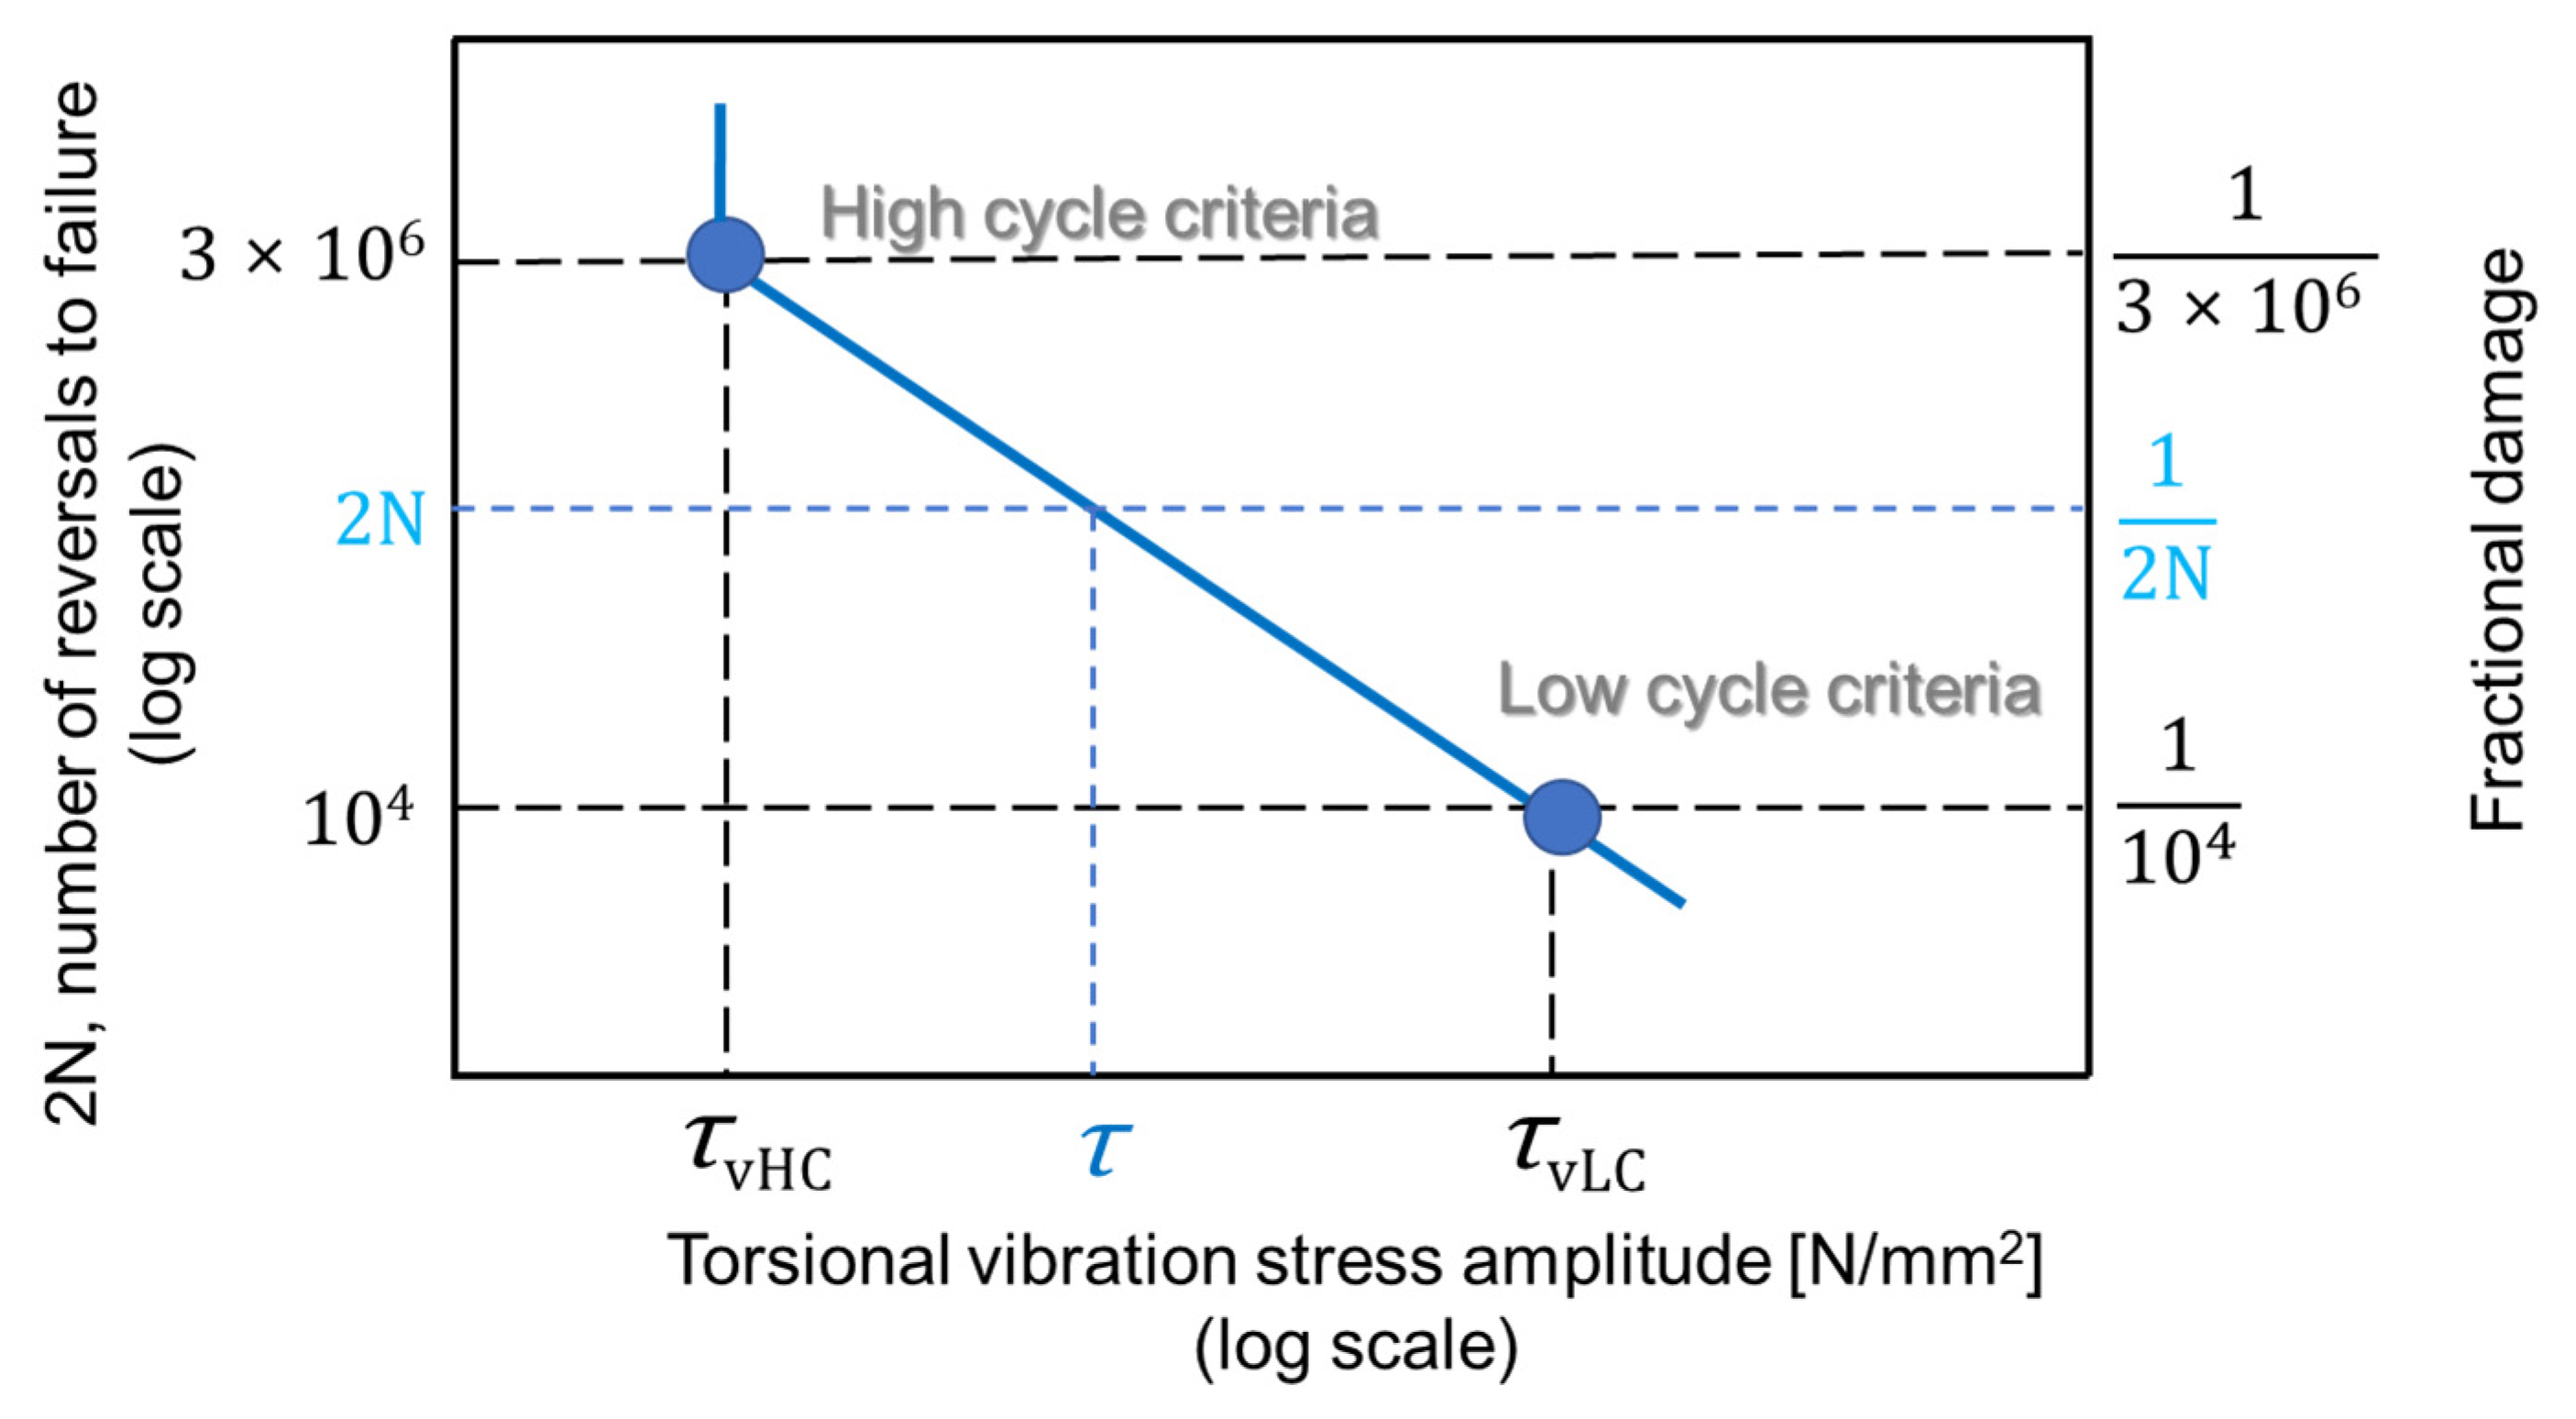
. In S–N testing, the number of cycles to failure is converted to the number of reversals to failure (
Figure 2). Here, one cycle includes two stress reversals, and the symbol (2
N) is used to indicate this cycle. Miner’s rule states that failure occurs when the accumulated fractional damage reaches the value of 1.
Here, (2ni) denotes the number of reversals and (2Ni) the number of reversals leading to failure at stress level . The fractional damage caused by one loading reversal at stress level is 1/(2Ni).
The most important aspect of the calculation is the estimation of the low-cycle and high-cycle criteria corresponding to each specific torque. For transient torsional vibration during BSR quick passage, Det Norske Veritas (DNV) classification recommends choosing the number of reversals for low-cycle and high-cycle fatigue as 10
4 and 3 × 10
6, respectively [
16].
Figure 3 shows the relationship between the torsional vibration stress amplitude and fractional damage. From the figure, based on the vibration measurement, we can obtain the fractional damage due to each reversal of torsional stress to calculate the accumulated fatigue damage of the intermediate shaft during BSR passage.
2.2. Low- and High-Cycle Criteria Determination
In this study, we considered a propulsion system of a 160,000-DWT oil tanker fitted with the WinGD W6 × 72 diesel main engine. The specifications of the engine and shafting system are listed in
Table A1,
Appendix A. The low- and high-cycle criteria of the torsional fatigue strength were calculated by means of the following procedure and settings:
Engine maximum continuous power rating, P0 = 16,300 kW
Maximum continuous rate, n0 = 73.0 r/min
Intermediate shaft diameter, d = 530 mm
Intermediate shaft tensile strength, σb = 800 N/mm2
Yield strength, σy = 0.7σb = 560 N/mm2
Surface roughness at the edge of the slot, Ra = 1.6 µm, Ry ~ 9.6 µm
Torque at maximum continuous power:
Shear stress at maximum continuous power:
2.2.1. Low-Cycle Criteria
The permissible low-cycle torsional vibratory stress can be calculated as [
16]
where,
τ = mean torsional stress at variety of shaft speed;
S = safety factor = 1.25, as recommended by DNV for low-cycle criteria [
9];
KL = component influence factor for low-cycle fatigue.
The first component (term 1) refers to the notch influence for low-cycle fatigue including notch sensitivity, where
Here, αt = geometrical stress concentration factor. For multi-radii transition fillet design of the shaft flange, αt = 1.05.
Substituting this value in Equation (6), we obtain fL(αt, σy) = 0.04
The second component refers to the surface condition influence term for low-cycle fatigue, where,
In this equation, surface roughness Ry = 9.6.
Upon substitution of the two terms in Equation (5), we have
The mean torsional stress, τ, is defined as the average torsional stress, and it can be estimated from the measured vibration data. Moreover, the engine power and shaft speed exhibit a quadratic relation. In certain cases, the mean torsional stress can be calculated as
where,
λ = speed ratio =
n/n0 =
τ/τ0.
2.2.2. High-Cycle Criteria
The permissible high-cycle torsional stress can be calculated as [
16]
where,
KHτ = component influence factor for high-cycle torsional fatigue,
The first term denotes the notch influence term for high-cycle torsional fatigue, with
where,
mt = notch sensitivity coefficient for high-cycle torsional fatigue, calculated as:
In general, r = notch radius = 100 mm. If r > 100, r is set to 100.
Upon substituting Equation (14) in Equation (13), we obtain fHτ = 1.044.
The second component refers to the size (statistical) influence term for high-cycle fatigue:
Finally, the third component refers to the surface condition influence term for high-cycle torsional fatigue, where,
Upon substituting these values in Equation (12), we have
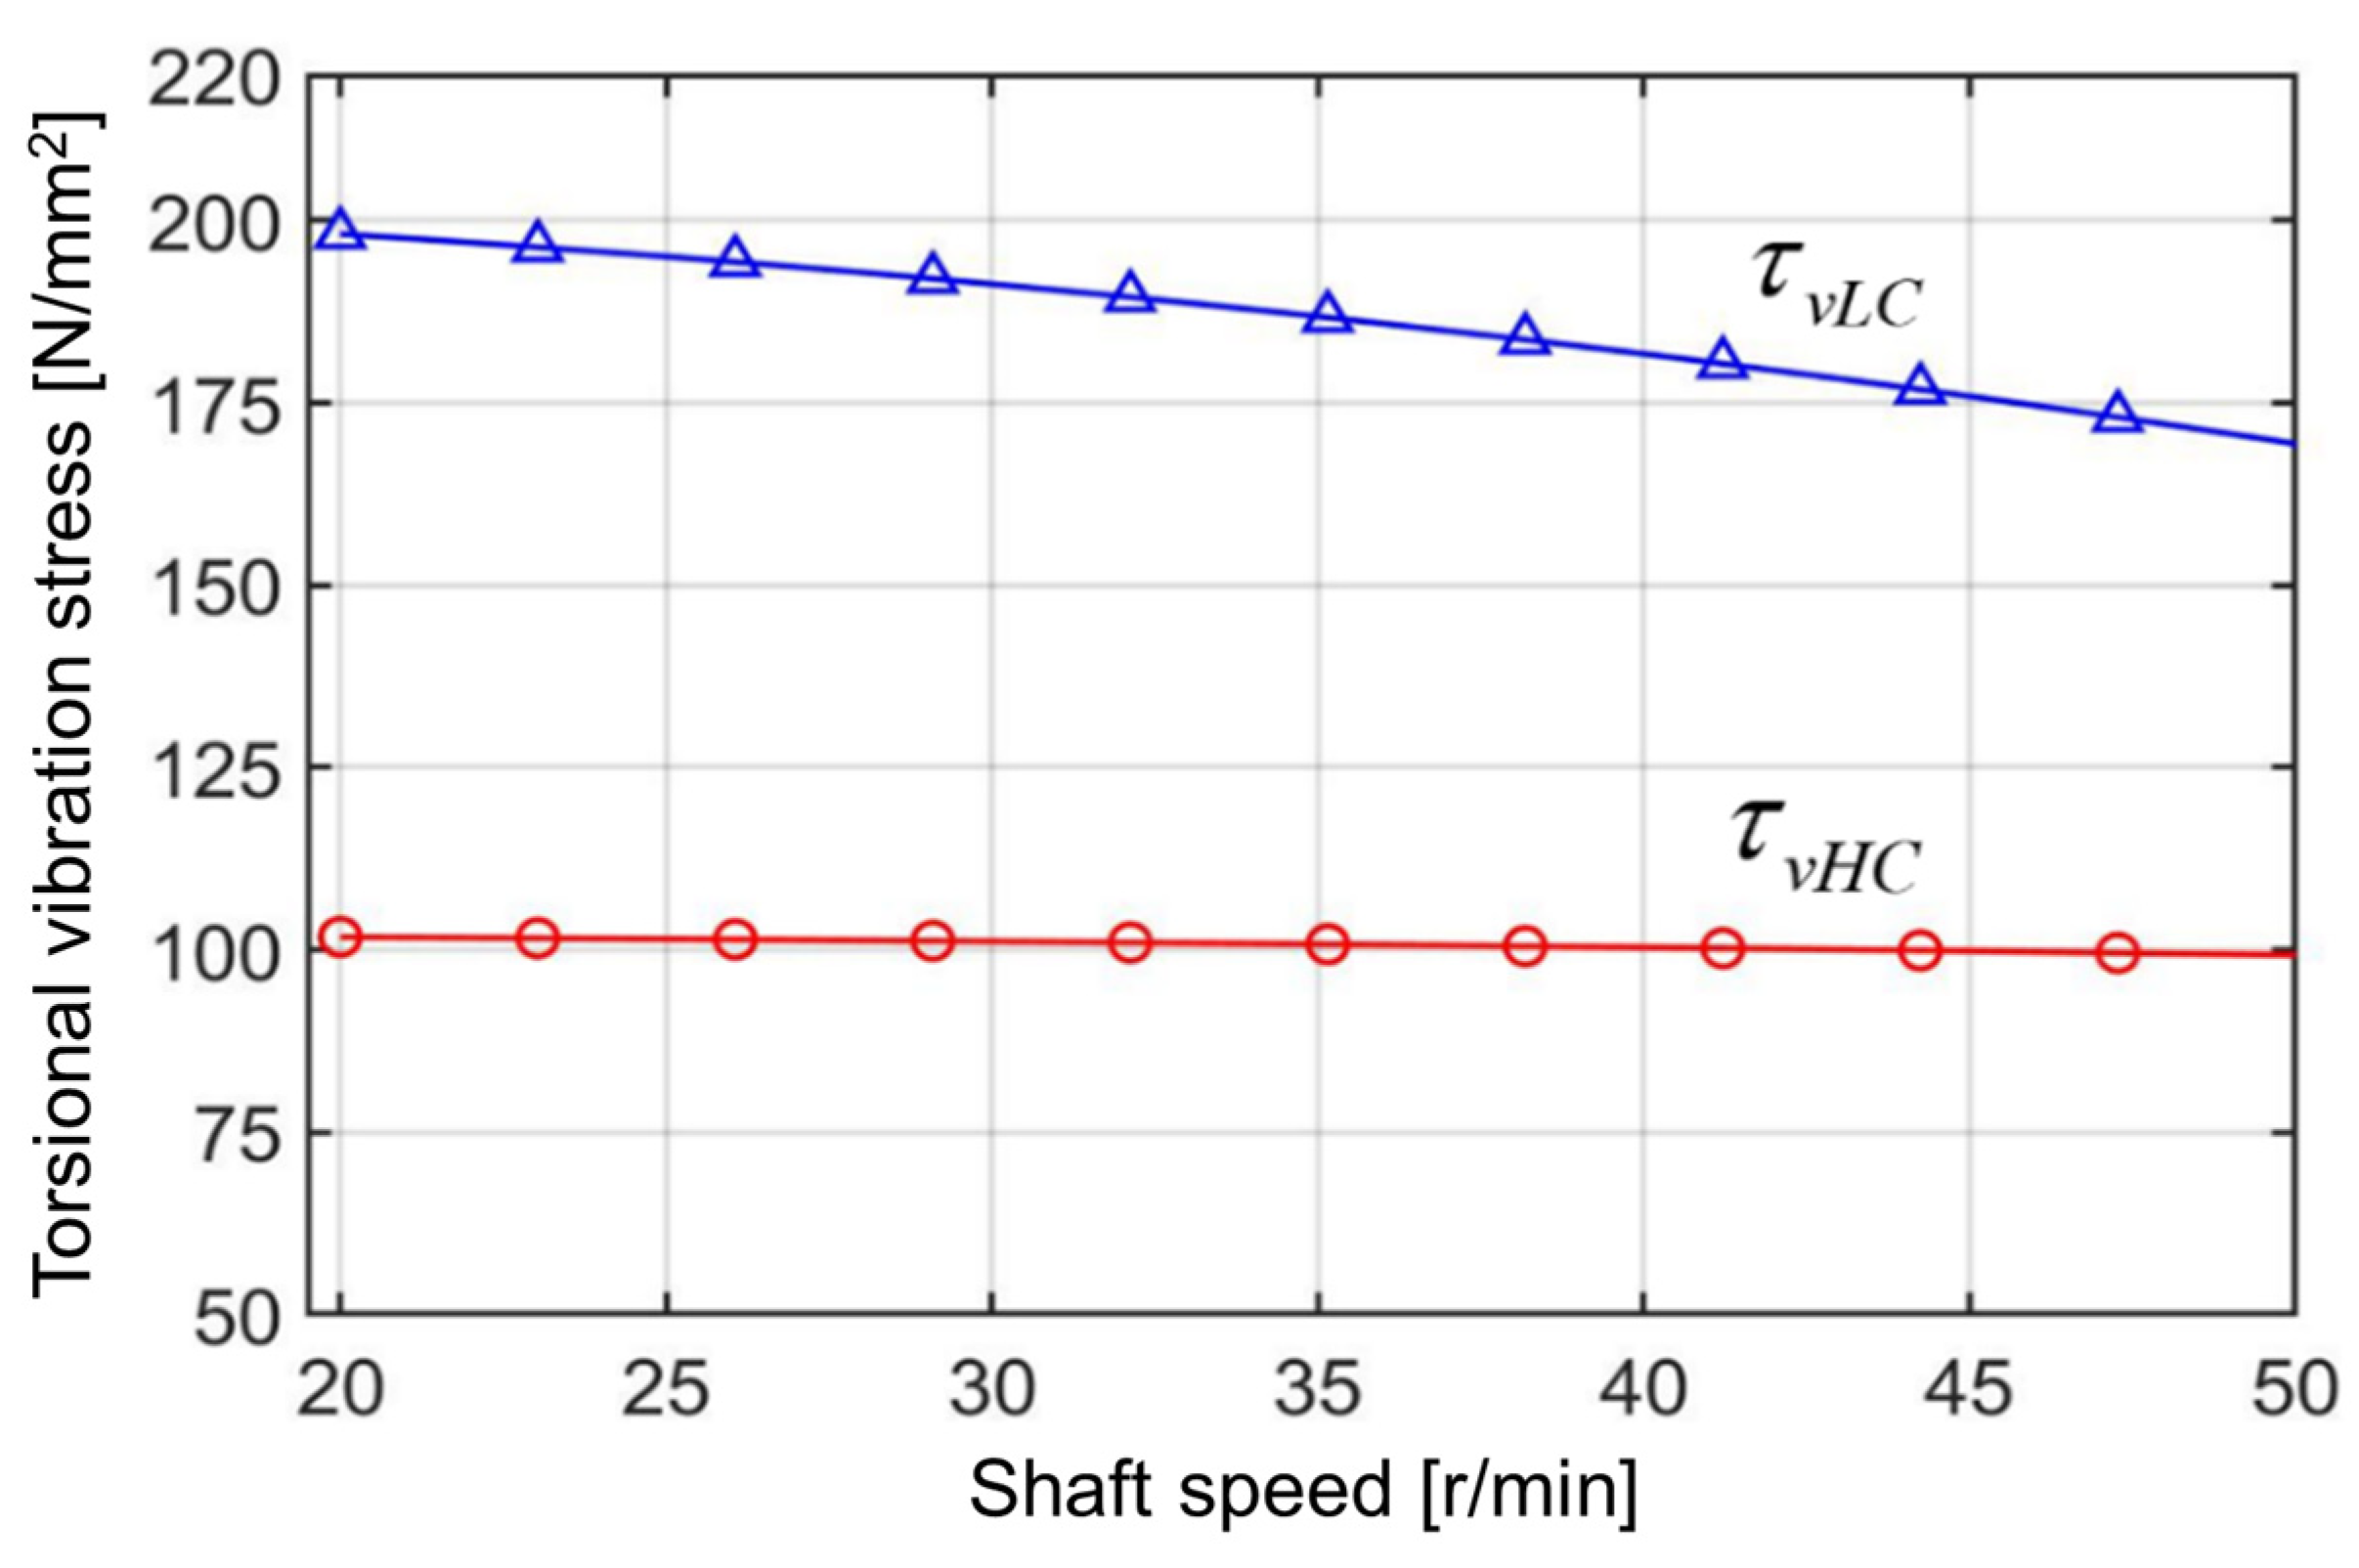
In this calculation, the mean torsional stress is determined based on the corresponding speed as per the relationship with shear stress at maximum continuous power via Equation (10). Finally, the low- and high-cycle criteria over the whole operation speed range are plotted as shown in
Figure 4. For each specific value of the mean torsional stress corresponding to a certain speed, the slope of the S–N curve can be obtained as
As mentioned earlier,
Figure 3 shows the linear relationship between the number of reversals and the failure and amplitude of torsional stress vibration; this relationship can be expressed as the following equation:
or
where,
3. Results and Discussion
We performed a series of torsional vibration measurement experiments with different engine operation patterns during BSR passage to evaluate the performance of each setting based on the calculated fatigue damage.
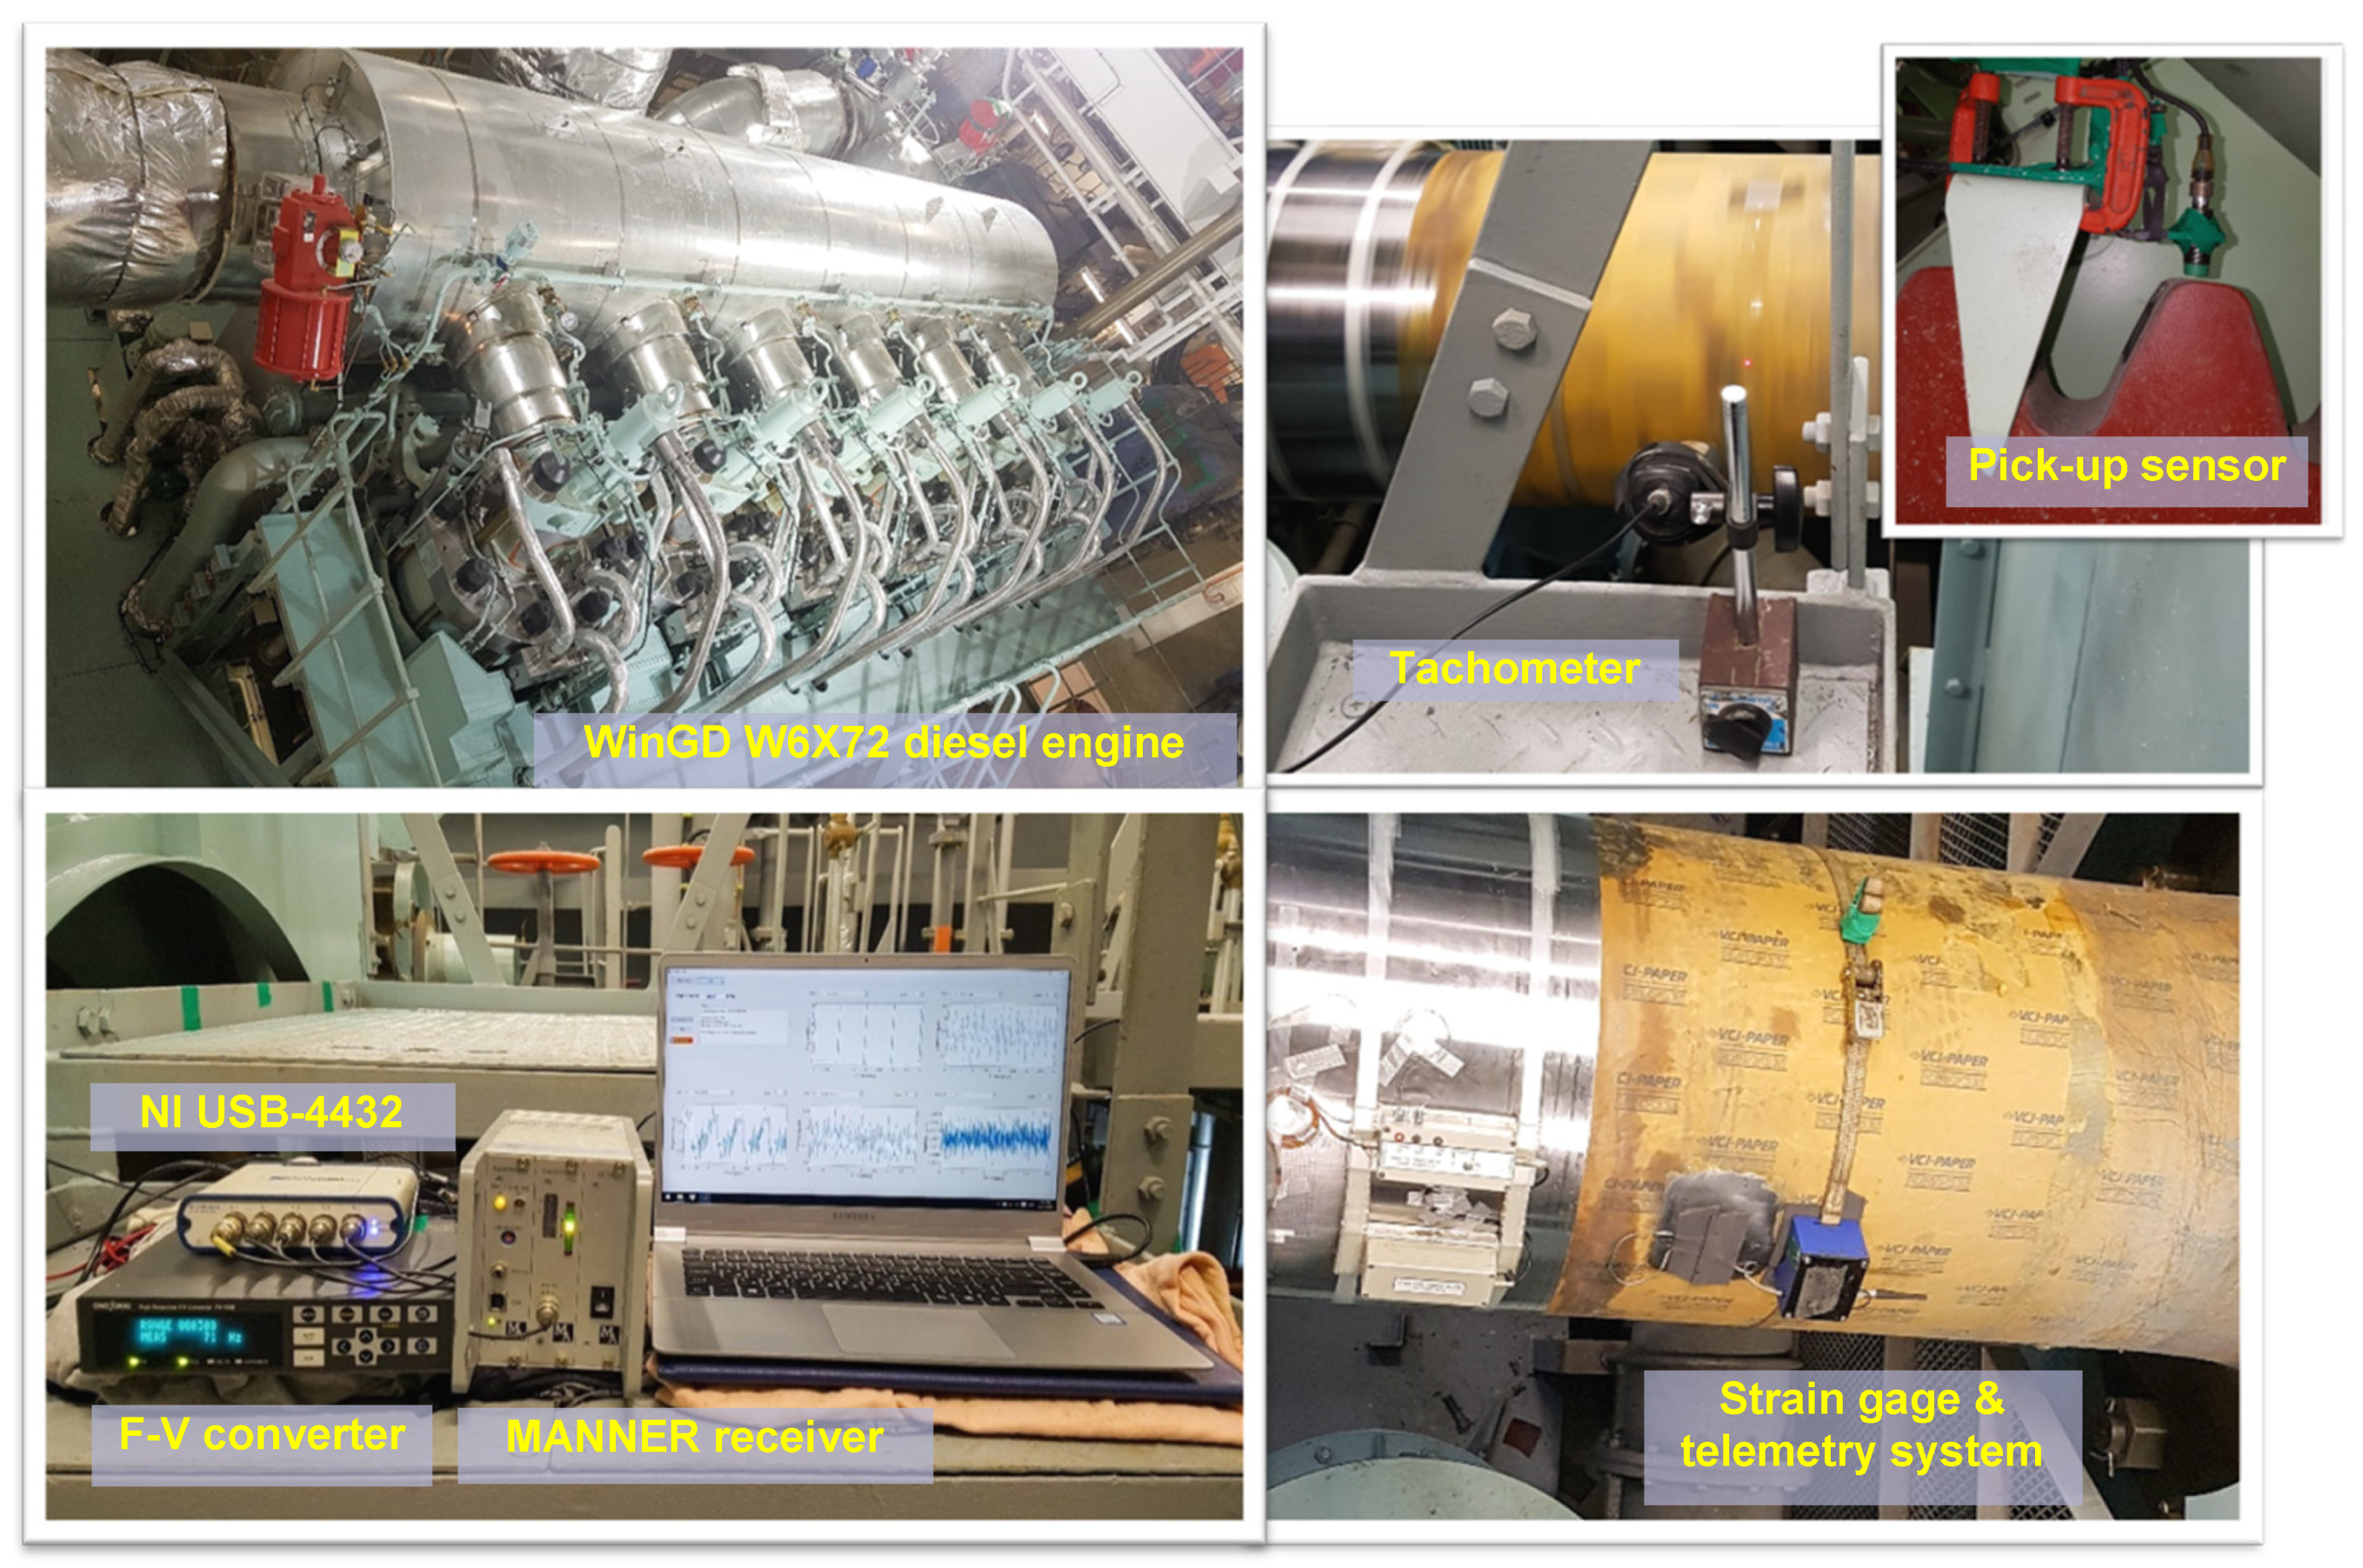
Figure 5 displays the schematic of the torsional vibration measurement system, and the setup of the computer and device installation for measurements is shown in
Figure 6. All vibration data were measured using the EvamosM software [
17,
18,
19] developed by the Dynamics Lab of the Mokpo National Maritime University. In the experiments, we used three operation modes for BSR quick passage tests. The condition and engine control setting of each test is described in
Figure 7. The torsional vibration stresses corresponding to the engine speed and time in each test are shown in
Figure 8a–c.
From the measurement results, we note that in the BSR deceleration passages, the torsional vibration amplitudes are small and negligible; however, the vibration during BSR accelerations is a matter of concern. Upon comparing the results of the three BSR acceleration tests, we note that the torsional vibration stresses are smallest when the vessel reaches a certain speed and the starting point of the engine rpm is higher.
The calculated fractional fatigue damage during BSR passage for each test is listed in
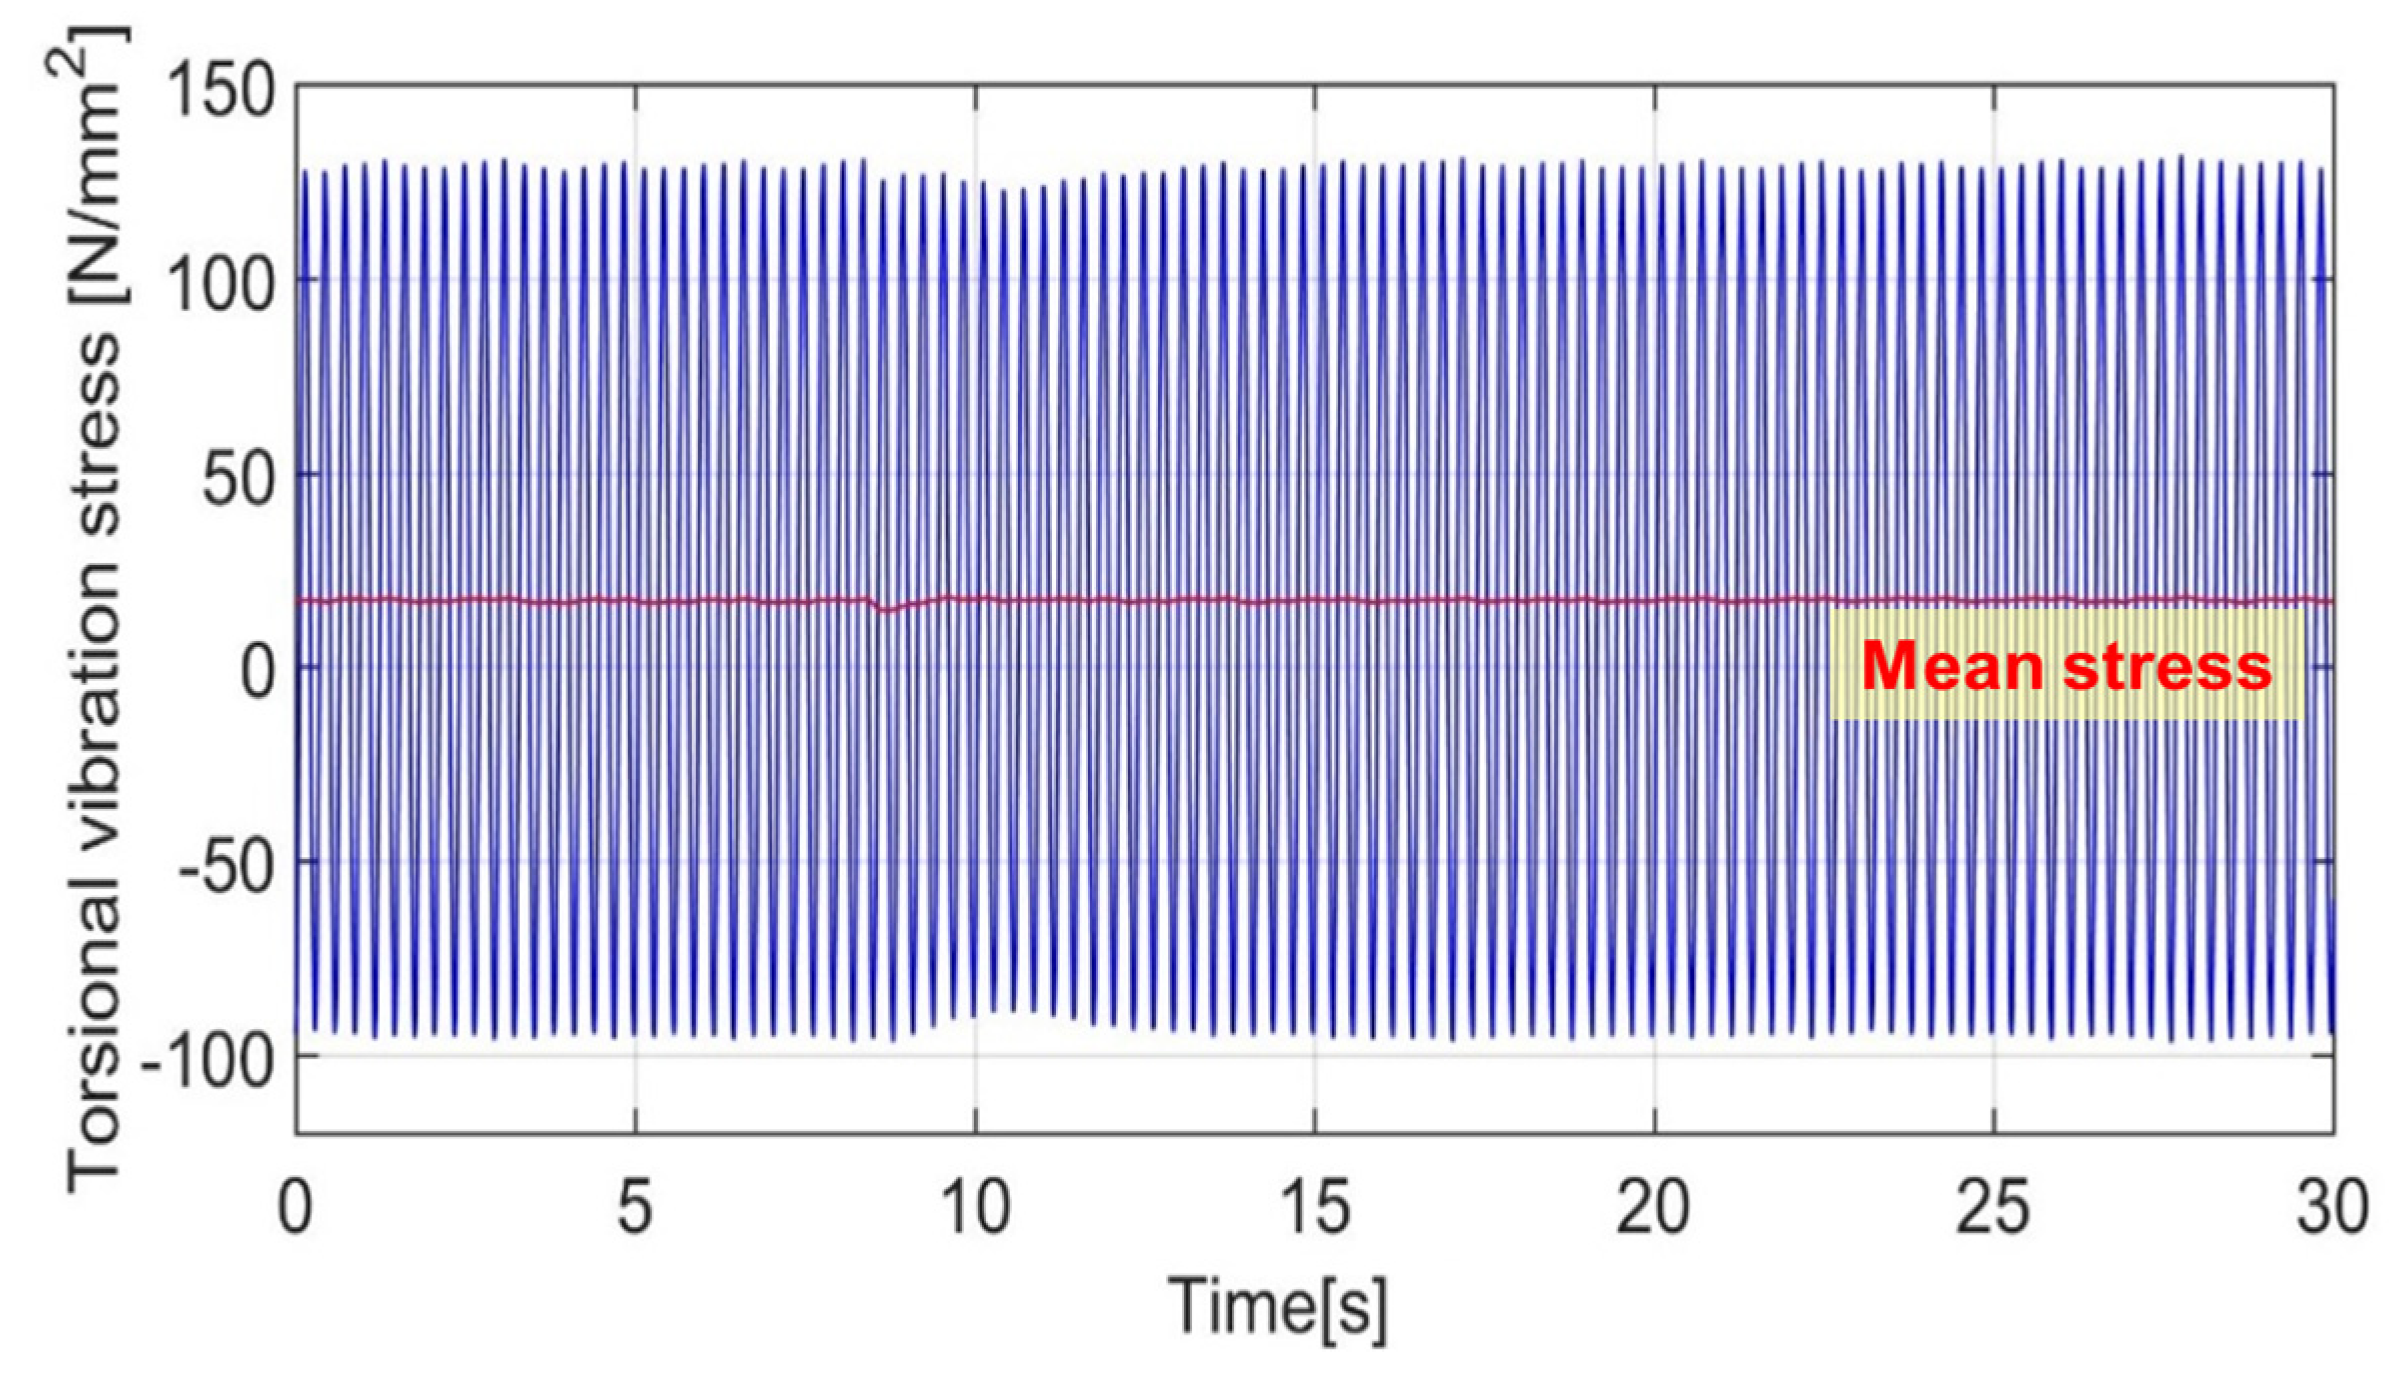
Table 1. Here, we note that the intermediate shaft will break when the accumulated fractional damage reaches the value of 1 (Equation (1)). According to the measurement results, for the settings corresponding to test no. 3, the fatigue damage is reduced by nearly 128 times that of test no. 1 and ~24 times that of test no. 2. Obviously, smaller fraction damage indicates that the fatigue life increases. In the case of engine operation in the BSR steady-state normal firing condition (
Figure 9), the accumulated fractional damage reaches a value of 26.5 × 10
−5 after 30 s. This result indicates shaft breakage after 31 h under this condition. In general, after many years of ship operation, the operating condition of the whole propulsion system degrades to relative to that of a new vessel. In this case, the damping of the torsional vibration damper may change, and the turbocharging system exhibits a poor performance due to age. In this situation, if we assume that the torsional vibration level increases by 20%, the fatigue lifetime for this shaft is just 2.5 h.
Based on the above-mentioned results, to reduce the torsional vibration stresses amplitude, we recommend the following operating procedure corresponding to test no. 3 for BSR acceleration (
Figure 10):
Step 1: Start main engine (point nos. 1, 2), set engine speed to 28 r/min, immediately below BSR (point no. 3); wait until vessel reaches a certain speed corresponding to the engine speed (point no. 4).
Step 2: Set engine speed to 38 r/min—right above BSR (point No. 5); wait until engine speed reaches setting speed (point no. 6).
Step 3: Set desired speed (point nos. 7, 8).
4. Conclusions
The ultra-long-stroke engine affords a higher power at slower shaft speeds; however, the trade-off is the resulting higher torsional vibration, which can affect the fatigue strength of the shafting system. In this study, we investigated the torsional vibration characteristics of the intermediate shaft of a marine propulsion system with the WinGD-W6X72 main engine during BSR passage. To evaluate how different engine operation patterns affect BSR acceleration, we conducted a series of experiments. Our results can be summarized as follows:
- (1)
Fatigue failure can occur after a certain number of loading reversals (or number of loading cycles). The fractional fatigue damage varies linearly with the torsional stress amplitude (when both are represented in the log scale). Additionally, it is important to determine the low- and high-cycle criteria to calculate the accumulated fractional damage for each passage. Consequently, the fatigue lifetime of the shafting system can be estimated.
- (2)
It is necessary to calculate the accumulated fatigue damage for marine propulsion systems, particularly during BSR passing. Consequently, the fatigue lifetime can be estimated to evaluate the optimal working conditions of the diesel engine and predict and avoid structural failure. In our case, optimization of the operation pattern reduced the fatigue damage by a factor of 128. Furthermore, such optimization ensures that BSR steady-state conditions are avoided. Otherwise, BSR passage can damage the shaft after only 31 h or even 2.5 h of operation in the worst-case scenario (assuming that the torsional vibration level increases by 20%).
- (3)
The fatigue lifetime of the shafting system can be extended as follows: the shaft size can be increased, a multi-radii-shaped design can be applied to the fillet, and materials with higher tensile strengths can be used. The dynamic characteristics of the torsional vibration can be improved by installing a torsional damper or tuning wheel. Newer techniques such as the dynamic limiter function (MAN ES) and Delta Bypass (WinGD) are also available. These methods can be combined to improve the engine acceleration torsional vibration behavior at a reasonable cost.
- (4)
The torsional vibration during BSR passage depends on the engine operation patterns. To improve the torsion behavior during BSR acceleration and thereby extend the operation lifetime of the shafting system, it is recommended to set the engine speed right below the BSR lower limit and then wait for the ship speed to increase before acceleration to reduce the torsional vibration amplitude during BSR passage.
The ultra-long-stroke engine propulsion system is the future of large vessels, such as “supertankers” including very large and ultra-large crude carriers (VLCCs and ULCCs). All new techniques used to improve the engine acceleration capacity achieved by more power generated should be tested for torsional vibration to evaluate the fractional damage during BSR quick passage. The ultimate purpose is to prevent the risk of fatigue fracture during the entire vessel life expectancy (25–30 years).
Author Contributions
Conceptualization, M.-H.S.; Methodology, M.-H.S., X.D.P., and Q.D.V.; Software, M.-H.S.; Validation, X.D.P., and Q.D.V.; Formal Analysis, X.D.P.; Investigation, M.-H.S.; Resources, M.-H.S.; Data Curation, X.D.P.; Writing-Original Draft Preparation, M.-H.S.; Writing-Review and Editing, X.D.P. and Q.D.V.; Visualization, M.-H.S.; Supervision, Q.D.V.; Project Administration, M.-H.S.; Funding Acquisition, M.-H.S. All authors have read and agreed to the published version of the manuscript.
Funding
This study did not receive external funding.
Conflicts of Interest
The authors declare that there is no conflict of interest.
Nomenclature
| Τ | shear stress (Pa) |
| n | number of cycles |
| N | number of cycles leading to failure |
| 2n | number of reversals |
| 2N | number of reversals leading to failure |
| P0 | engine maximum continuous power rating (kW) |
| n0 | maximum continuous rate (r/min) |
| d | shaft diameter (mm) |
| σb | shaft tensile strength (N/mm2) |
| σy | shaft yield strength (N/mm2) |
| Ra | surface roughness, arithmetical mean deviation of the profile (μm) |
| Ry | surface roughness, maximum height of the profile (peak to valley) (μm) |
| T0 | torque at maximum continuous power (kN·m) |
| n | shaft speed (r/min) |
| τvLC | permissible low-cycle torsional vibratory stress (N/mm2) |
| λ | speed ratio |
| S | safety factor |
| KL | component influence factor for low-cycle fatigue |
| fL(αt, σy) | notch influence term for low-cycle fatigue |
| αt | geometrical stress concentration factor |
| fL(Rt, σb) | surface condition influence term for low-cycle fatigue |
| τvHC | permissible high-cycle torsional vibratory stress (N/mm2) |
| KHτ | component influence factor for high-cycle torsional fatigue |
| FHτ(αt, mt) | notch influence term for high-cycle torsional fatigue |
| mt | notch sensitivity coefficient for high-cycle torsional fatigue |
| r | notch radius (mm) |
| FH(r) | size (statistical) influence term for high-cycle fatigue |
| FHσ(Ry, σb) | surface condition influence term for high-cycle torsional fatigue. |
Appendix A
Table A1.
Specifications of engine and propulsion shafting system (courtesy of shipyard).
Table A1.
Specifications of engine and propulsion shafting system (courtesy of shipyard).
| Main engine | Type | WinGD W6 × 72 |
| Power | 16,300 kW × 73.0 r/min |
| No. of cylinders | 6 |
| Bore | 700 mm |
| Stroke | 3086 mm |
| Torsional vibration damper | Type | Geislinger D290/36/V/M |
| Outer inertia | 15,400 kg × m2 |
| Inner inertia | 853 kg × m2 |
| Torsional stiffness | 13 MN × m/rad |
| Relative damping | 230 kN × m × s/rad |
| Weight | 12,900 kg |
| Flywheel | Moment of inertia (MOI) | 15,300 kg × m2 |
| Weight | 5970 kg |
| Propulsion shafting system | Intermediate shaft | Φ530 mm × 9241 mm |
| Propeller shaft | Φ690 mm × 9456 mm |
| IS and PS material | TS ≥ 800/600 N/mm2 |
| Propeller | No. of blades | 4 |
| Diameter | 9.0 m |
| MOI in water | 195,570 kg × m2 |
| Weight | 44,056 kg |
References
- MAN Energy Solutions. MAN B&W G-Engines-Green Ultra Long Stroke Engines; MAN Energy Solutions: Copenhagen, Denmark, 2016. [Google Scholar]
- MAN Energy Solutions. G-Type Engine-Revolutionary Ultra-Long-Stroke; MAN Energy Solutions: Copenhagen, Denmark, 2012. [Google Scholar]
- Winterthur Gas & Diesel. Engine Selection for Very Large Container Vessels; WinGD: Winterthur, Switzerland, 2016. [Google Scholar]
- Winterthur Gas & Diesel. Low-Speed Engines 2020; WinGD: Winterthur, Switzerland, 2020. [Google Scholar]
- Nippon Kaiji Kyokai Research Committee. Guide to Ship Vibration; Nippon Kaiji Kyokai: Tokyo, Japan, 1984. [Google Scholar]
- Venczel, M.; Veress, Á. Introduction to Design and Analysis of Torsional Vibration Dampers in Vehicle Industry. Int. J. Eng. Manag. Sci. (IJEMS) 2019, 4, 310–324. [Google Scholar] [CrossRef]
- Lee, D.C.; Barro, R. A Study on the Torsional Vibration Characteristics of Super Large Two Stroke Low Speed Diesel Engines with Tuning Damper. Trans. Korean Soc. Noise Vib. Eng. 2009, 19, 64–75. [Google Scholar] [CrossRef]
- Tan, X.; Hua, L.; Lu, C.; Yang, C.; Wang, Y.; Wang, S. A New Method for Optimizing the Parameters of Torsional Vibration Dampers. J. Vibroeng. 2017, 19, 4155–4171. [Google Scholar] [CrossRef]
- DNV-GL. Calculation of Shafts in Marine Applications; DNV-GL AS: Høvik, Norway, 2015. [Google Scholar]
- Taylor, D.; Kelly, A.; Toso, M.; Susmel, L. The variable-radius notch: Two new methods for reducing stress concentration. Eng. Fail. Anal. 2011, 18, 1009–1017. [Google Scholar] [CrossRef]
- MAN Energy Solutions. Dynamic Limiter Function—New Engine Control Technology for Faster Ship Acceleration; MAN Energy Solutions: Copenhagen, Denmark, 2018. [Google Scholar]
- Winterthur Gas & Diesel. Low-Speed Engines 2018; WinGD: Winterthur, Switzerland, 2018. [Google Scholar]
- Vuong, Q.D.; Song, M.H.; Lee, D.C. The Torsional Vibration Characteristics for 5–7 Cylinders Marine Diesel Engines thru Design and Operation. In Proceedings of the Korean Society for Noise and Vibration Engineering Conference, Jeju, Korea, 25–27 April 2018. [Google Scholar]
- Miner, M.A. Cumulative Damage in Fatigue. J. Appl. Mech. 1945, 67, A159–A164. [Google Scholar]
- Campbell, F.C. Fatigue. Elements of Metallurgy and Engineering Alloys; ASM International, 2008. Chapter 14. Available online: https://www.researchgate.net/publication/267401423_Elements_of_Metallurgy_and_Engineering_Alloys (accessed on 15 August 2020).
- DNV-GL. Rules for Classification, Ships, Part 4 System and Components, Chapter 4 Rotating Machinery—Power Transmission; DNV-GL AS: Høvik, Norway, 2018. [Google Scholar]
- Song, M.H.; Vuong, Q.D.; Lee, D.C. Acoustic Emission Signal Monitoring Software for Marine Diesel Engine using MATLAB. Trans. Korean Soc. Noise Vib. Eng. 2019, 29, 571–576. [Google Scholar] [CrossRef]
- Lee, D.C.; Joo, K.S.; Nam, T.K.; Kim, E.S.; Kim, S.H. Development of Engine Vibration Analysis and Monitoring System (EVAMOS) for Marine Vessels. Trans. Korean Soc. Noise Vib. Eng. 2009, 19, 155–161. [Google Scholar] [CrossRef] [Green Version]
- Vuong, Q.D. The Transient Torsional Vibration and Fatigue Strength of 2-Stroke Low Speed Diesel Engine Propulsion Shafting System during Barred Speed Range Passage. Ph.D. Thesis, Mokpo National Maritime University, Mokpo, Korea, 2019. [Google Scholar]
© 2020 by the authors. Licensee MDPI, Basel, Switzerland. This article is an open access article distributed under the terms and conditions of the Creative Commons Attribution (CC BY) license (http://creativecommons.org/licenses/by/4.0/).


