Article

Tetracycline Photocatalytic Degradation under CdS Treatment

by
Momoka Nagamine
1,†,
Magdalena Osial
2,†,
Krystyna Jackowska
2,
Pawel Krysinski
2,* and
Justyna Widera-Kalinowska
1,*
1
Department of Chemistry, Adelphi University, One South Avenue, Garden City, NY 11530, USA
2
Faculty of Chemistry, University of Warsaw, Pasteur Street 1, 02-093 Warsaw, Poland
*
Authors to whom correspondence should be addressed.
These authors contributed equally to this work.
J. Mar. Sci. Eng. 2020, 8(7), 483; https://doi.org/10.3390/jmse8070483
Submission received: 22 June 2020 / Accepted: 26 June 2020 / Published: 30 June 2020
(This article belongs to the Special Issue Nanomaterials Applied in Water Treatments)

Abstract

:
Industrialization and the growing consumption of medicines leads to global aquatic contamination. One of the antibiotics widely used against bacterial infections in both human and veterinary medicine is tetracycline. Despite its positive antibiotic action, tetracycline is resistant against degradation, and therefore it accumulates in the environment, including the aquatic environment, creating great health hazards, possibly stimulating antibiotic resistance of pathogenic organisms. In this research, aqueous suspensions of semiconductor nanoparticles CdS were used for photocatalytic activity studies in the presence of methylene blue as a model compound, and finally, in the presence of tetracycline, a broad-spectrum antibiotic widely used against bacterial infections, as well as a live-stock food additive. The mechanism and kinetic rate constants of photocatalytic degradation processes of methylene blue and tetracycline were described in correlation with the energy diagram of CdS nanoparticles.

Graphical Abstract

1. Introduction

Various human activities like industrialization, oil drilling, mining, and transportation have been used for the modernization of society and well-being. These activities, however, cause major pollution of the environment, such as in the soil, groundwater, rivers, and oceans [1]. The effects of aquatic pollution are enormous, ranging from impairment of surface water quality, disruption of aquatic growth, and affecting human health. The main sources of marine environment pollution from shipping related activities are oily-water discharge from ships, tanker accidents, accidental spillage during terminal loading, direct discharge of sewage and industrial waste, wastewater discharged from ships, garbage and other solid waste, ballast-water discharged from ships at ports, marine machinery exhaust, anti-fouling paints [2,3]. The discharged hazardous substances contain polycyclic aromatic compunds, organic molecules with condensed aromatic rings that are toxic, carcinogenic, mutagenic and have increased environmental pollution and risks to human health several fold [4].
A particularly good example of large organic molecules with condensed aromatic rings are antibiotics that can damage the ocean shelf through the estuaries that bring them to the oceans from agriculture, and densely populated areas, such as great cities, typically located at the rivers. In the 21st century, humanity is facing great problems due to the considerable environmental pollution caused by pharmaceuticals. Antibiotics are widely used for both humans and livestock, and their presence in the environment poses great concern, because of their adverse effects and antibiotic-stimulated development of antimicrobial resistance [5,6]. These chemicals persist in the water that is bioavailable to diffuse across biological membranes, and enter organisms and the food web. Over the last few years, several largely used pharmaceuticals were introduced to the pollutants’ list by several environmental protection agencies in North America and Europe [7,8].
For that reason, various techniques of contaminants’ removal or degradation are studied. The removal of PAHs from industrial wastewater can be attained by many physical, chemical, and biological treatment methods, including adsorption, membrane filtration [9], flocculation [10], prechlorination [11], and coagulation [12], aerobic and anaerobic biological degradation, filtration, etc. [13,14,15]. Nonetheless, the application of these traditional methods for on-board treatment on ships and offshore platforms are constrained because of limited space, low efficiency, long duration, and high requirements of cost and maintenance [16]. On the contrary, UV-vis irradiation has been recently a scientist’s focus as a promising solution, because of its relatively small footprint, low cost, high efficiency, and chemical-free properties. The photocatalytic degradation of petrochemical wastes containing mono-aromatic and poly-aromatic hydrocarbons has been studied, using various heterogeneous photocatalysts [17,18]. The established methods of environmental and wastewater treatment have demonstrated that numerous organic pollutants, such as antibiotics, are not effectively removed, and therefore remain in the aquatic environment [5,19,20]. Therefore, there is an essential need for developing innovative wastewater treatment, alleviating the problems of environmental pollution caused by pharmaceuticals like tetracycline. Such medicine is widely found in drinking water and soil, affecting living organisms by their long-term exposure to it. For that reason, various techniques of contaminants’ removal or degradation are being studied. Among many possible novel techniques, photodegradation, combined with the application of chemical substances, such as on TiO2 and ZnO suspensions, is a promising method for the fast degradation of tetracycline [21,22,23,24]. However, TiO2 or ZnO have a wide bandgap and work under UV light, which constitutes only a small part of the solar spectrum.
The development of photocatalytic materials capable of efficiently utilizing entire solar energy for environmental remediation has been recently a major focus for the scientific community. Semiconductor nanoparticles, or quantum dots (QD) are found to be effective materials for photocatalytic [25,26,27] applications, due to their unique properties, such as high light absorption coefficient, size, and controlled tunable energy bandgap, and carrier multiplication effect, etc. Numerous articles have been published regarding the heterogeneous photocatalysis and other advanced oxidation technologies (AOT) for air and water purification treatment [28,29,30,31,32,33,34,35,36,37,38,39,40]. Generally, the semiconductor sensitizer is expected to be photoactive, able to absorb light (visible in particular), biologically and chemically inert, photostable, and inexpensive. Currently, semiconductor sensitizers, such as metal oxides (eg. Fe2O3) and II-VI semiconducting chalcogenides (eg. CdS), are being intensively studied, because they absorb light in the visible range, which constitutes the majority of the solar spectrum [38,39,40,41,42,43,44,45,46].
Cadmium chalcogenides semiconductors (CdS, CdSe, and CdTe) in particular are widely studied, due to their low cost and facile synthesis process [47,48]. CdS is one of these important II-VI semiconducting materials, with a 2.42 eV direct bandgap corresponding to the visible part of the electromagnetic spectrum [49]. As a result of this, it is widely used in photovoltaics [50,51] and photocatalysis [52,53]. The maximum reported efficiency of the pure CdS nanoparticles coatings for photocatalysis of tetracycline were reported in the presence of radical scavengers. These coatings were formed by electrophoretic deposition (EPD) of CdS nanoparticles that were first synthesized under microwave irradiation of aqueous solutions containing the cadmium and sulfur precursors at stoichiometric amounts, and by using trisodium citrate as a stabilizer. The authors of the cited work report only 71% maximum efficiency of their best system CdS600 [54].
In our research, pristine cadmium sulfide nanoparticles, with determined bandgap energy 2.3 eV, were used for UV-vis induced degradation of tetracycline. Cadmium sulfide semiconductor nanoparticles were successfully synthesized by a simple co-precipitation method, and their suspension was initially used to test their photocatalytic properties towards the degradation of the methylene blue (MB) dye. Methylene blue dye was chosen as a model compound, due to its increasing pharmacological use [55]. Finally, CdS nanoparticles were applied towards the degradation of tetracycline (TC), a widely used antibiotic accumulation of which in the environment creates a health hazard to humans and livestock, particularly due to its reproductive toxicity and long-term aquatic hazard [56]. The mechanism and kinetic rate constants of photocatalytic degradation processes of methylene blue and tetracycline were described in correlation with the energy diagram of CdS nanoparticles. Our photocatalytic CdS nanoparticles are not only prepared in a simple method and used without any further modification, but they can also be applied under visible light conditions, due to their narrow bandgap. The photocatalytic efficiency reaches up to almost 80% TC degradation in 1-hour exposure to our CdS NP, which is higher than previously reported for pure CdS NP [54]. Other photocatalytic systems are reported in the literature for tetracycline degradation [57,58,59,60,61,62,63,64,65,66], however, they are either using UV light or they are more complex, involving heterogeneous composite/hybrid system formation (for example RGO/CdS/ZnS, ZnO/ g-C3N4, FeNi3/SiO2/ZnO, CdS-TiO2), and are less efficient than the simple system that we present in this work.

2. Experimental

2.1. Materials, Reagents and Instrumentation

Cadmium acetate (Cd(CH3COO)2), sodium sulfate nonahydrate (Na2S · 9H2O), sodium sulfate (Na2SO4), and sodium sulfite (Na2SO3), ethanol, methylene blue (MB), and tetracycline of analytical grade were purchased from Sigma-Aldrich. Ethanol, 96% analytical grade, was purchased from POCH. All chemicals were used without further purification. Deionized water with resistivity 18.2 MΩ cm at 25 °C was obtained using the Milli-Q ultra-pure water filtering system from Merck. The prepared solutions were irradiated for 90 min with a 280 W UV mercury quartz lamp (POLAM, Poland). The emission spectrum of the lamp is presented in the supplementary data. UV-Vis absorption spectra were recorded with obtained using a Perkin Elmer Lambda 35. The photolouminescence (PL) spectra were recorded at RT in the 420–620 nm range, using a Raman spectrometer (Labram 800 HR, Horiba Jobin Yvon, 405 nm excitation wavelength). Photocurrent, photopotential, and electrochemical impedance spectroscopy (EIS, see Supplementary Data), were recorded with CHI 660C electrochemical workstation (CH Instruments, Inc., USA), with glassy carbon (GC) as a working electrode, Pt mesh as auxiliary, and Ag,AgCl/3M KClaq as a working electrode. In the photoelectrochemical experiments, the electrode was illuminated by a 1000 W tungsten lamp (LEO435VP).
EIS experiments were carried out using the glassy carbon electrode with CdS deposited film by dropcasting as a working electrode immersed in 0.1 M sodium sulfate solution in the dark and under illumination of 300 W quartz mercury lamp as in the case of photodegradation experiments.
The fluorescence images were acquired with a Nikon Eclipse LV 100 wide field microscope.

2.2. Synthesis of CdS Hydrophilic Nanoparticles

CdS was prepared by the co-precipitation technique at 80 °C from 0.1 M Cd(CH3COO)2 dissolved in 100 mL of 1:1 water-ethanol mixture. The solution was mechanically stirred at 1000 rpm, and then 100 mL of 0.1 M Na2S dissolved in 1:1 water-ethanol mixture was slowly added. As a result, the yellow precipitate was created (Figure 1). The suspension was heated for 2 h at 80 °C with constant stirring. The obtained precipitate was washed with water and ethanol four times to remove impurities. Finally, the suspension was centrifuged for 30 min at 13000 rpm, and the settled nanoparticles were collected and dried overnight in a hot air oven at 50 °C. After drying, NPs were ground mechanically and used for photocatalysis.

2.3. CdS Nanoparticles Characterization

The morphology of the synthesized nanoparticles was examined using a scanning electron microscope (SEM), Merlin, manufactured by Zeiss. The shape and size of SPIONs were studied with transmission electron microscopy (TEM)—EF-TEM, Zeiss Libra 120 Plus, Stuttgart, Germany—operating at 120 kV. For XRD, the Bruker D8 Discover diffractometer with Debye-Scherrer geometry was used at room temperature, using Cu Kα radiation (λ = 1.540598 Å) at a scan rate of 1°/min in 0.012° steps, 2Θ from 20° to 130°. The Malvern Instruments Zetasizer Nano ZS apparatus was used to evaluate the hydrodynamic size via dynamic light scattering (DLS) measurements and zeta potential of the nanoparticles. The samples were prepared by suspending the as-synthesized nanoparticles in 6 mL of deionized water and sonicated for 15 min.
UV-Vis absorption spectra of the synthesized nanoparticles were recorded using a Perkin Elmer Lambda 35 to estimate the bandgap of the nanoparticles.

2.4. Photocatalysis Study

A total of 10 mg of the as-prepared CdS hydrophilic powder was added to 40 mL of 10 mM methylene blue (MB) aqueous solution or 83 μM tetracycline (TC) in a 50 mL beaker and stirred for 30 min at 600 rpm under dark. The resulting solution was irradiated for 90 min with a 280 W UV-vis mercury quartz lamp (POLAM, Poland). Every defined time period, a sample of this solution was taken, and its UV-vis spectrum was recorded to evaluate the changes in the MB or TC concentration, respectively.

3. Results and Discussion

3.1. Morphology, Size, and Zeta-Potential Analysis.

A representative SEM image of hydrophilic CdS nanoparticles is shown in Figure 2. This image shows aggregates of small nanoparticles, essentially uniform in size. As can be seen in Figure 2, the prepared semiconductor particles have a grainy shape, aggregating up to 100 nm agglomerates. However, closer inspection of the SEM image in Figure 2 and the TEM image in Figure 3 reveals grains of ca. 10 nm and smaller.
The size and zeta-potential of the as-synthesized CdS nanoparticles were determined by dynamic light scattering (DLS) measurement, indicating that the hydrodynamic diameter of sonicated nanoparticles is about 100 nm, and zeta potential ca. 0 V, confirming that CdS nanoparticles tend to sediment in aqueous media, which makes it possible to remove them easily from the solution after their application. As-synthesized nanoparticles were filtered with a membrane of 100 nm pore size, and diluted with water to prepare them for further measurements. The DLS results show polydispersity, good stability, and a small tendency for aggregation of the CdS nanoparticles.

3.2. Structural Studies

The structural characterization of as-synthesized CdS nanoparticles was performed with powder X-ray diffractometer (PXRD) Bruker D8 Discover, Massachusets, USA operating with Debye-Scherrer geometry with Cu Kα radiation with λ = 1.540598 Å and a scan rate of 1° per minute in 0.012° steps covering the 2θ angle in the range from 20° to 60°. Measurements were performed at room temperature. As can be seen in Figure 4, presenting diffraction patterns, three peaks characteristic to cubic phase CdS (JCPDS card 96-900-8840) were recorded. The first peak at 26.5° corresponds to the (111) plane. The pattern about 43.3° can be ascribed to the (220) plane and the peak at 52.1° is related to the (311) plane. The synthesized nanoparticles have good crystallinity, and these results are in good agreement with the literature data [67].

3.3. Optical Absorption Studies

The UV-vis spectroscopy (Figure 5A) was used to characterize the optical properties of as-synthesized nanoparticles. The optical absorption spectra, which are related to electrons’ transition from the valence band (VB) to the conduction band (CB), were recorded to evaluate the optical bandgap energy (Eg) of the prepared nanoparticles. Following the Tauc’s equation, the energy of the optical bandgap Eg of CdS nanoparticles can be estimated:
αhν = K(Eg)n
where α is the absorption coefficient of semiconductor, K is the frequency-independent material constant, and exponent n depends on the nature of transition in the semiconductor, i.e., = ½ for allowed direct transition [68]. In Figure 5A, the Tauc plot constructed based on the UV-vis spectrum of CdS nanoparticles (inset) is presented. Based on these graphs, the band bandgap value obtained for CdS is about 2.3 eV, which is in good agreement with previous reports [69,70].
For further characterization of the optical properties of CdS nanostructures, we carried out photoluminescence (PL) spectroscopy studies. They were used to characterize the optical quality of the synthesized nanostructures, because PL spectrum is affected by quantum confinement (band gap energy), defect states, and crystallinity. The photoluminescence (PL) spectrum of CdS nanoparticles recorded at an excitation wavelength 405 nm is shown in Figure 5B. It displays a peak at ca. 525 nm that corresponds to the near-band edge (green) emission (NBE) [71,72]. Its relatively low intensity and broad full width at a half-maximum of ca. 50 nm, suggests a quite large size-distribution of nanoparticles [73], most probably due to their aggregation upon drying (compare also Figure 3). The fluorescence microscopy images of CdS nanoparticles dropcast on quartz plate recorded under white light (Figure 5C), and under 530 nm illumination (Figure 5D) support these conclusions by visualizing the luminescing CdS nanoparticles.

3.4. Basic Photoelectrochemical Studies

In order to prepare the CdS thin film on the electrode substrate, a few microliters of 5 mg/mL CdS nanoparticles suspension in water were deposited on the surface of the glassy carbon electrode of the area of 0.28 cm2 and left to dry. The basic photoelectrochemical characterization of the CdS thin film was recorded in the 0.1 M polysulfides solution vs. Ag/AgCl reference electrode under dark and solar light illumination is presented in Figure 6A,B.
Photopotential and photocurrent are the parameters providing information on the electronic condition of the studied sample. The measured photopotential is proportional to the number of photogenerated charge carriers. The value of the photopotential is a verification of the conditions allowing for the separation of the photogenerated charge, such as: band bending, band gap width, as well as concentration, and type of bulk states. The magnitude of the photocurrent depends on the availability and proper relation of the electronic states at the semiconductor/solution interface, the rate of diffusion, and interfacial charge transfer rate.
The curve in Figure 6A presents the transient of open circuit potential (OCP) in time, under subsequent on/off illumination. When the electrode is immersed in the solution some state of pseudo-equilibrium is attained in dark characterized by a stationary open circuit potential (OCP) at ca. −0.55 V vs. Ag,AgCl/3M KClaq reference electrode (Figure 6). Since the CdS is a n-type semiconductor, during the illumination at the OPC, the potential shifts toward more negative values (in the direction of the flat band potential), by ca. −0.2 V. This effect should be fast and reversible upon switching the light off. The sharp decay of the OCP value is observed when the light is switched on.
When the CdS hydrophilic drop-cast nanoparticles were illuminated under chronoamperometric conditions, the instantaneous, sharp increase of current is observed, as shown in Figure 6B, which also presents the current transients in time under the subsequent on/off illumination. The observed photocurrent value is about 110 μA/cm2. The obtained photoresponse is typical for the n-type semiconductor in the presence of the appropriate redox couple. Upon illumination, the electron-hole pairs are created and separated in the electric field, leading to the changes in total concentration of electrons and holes. This effect can be qualitatively followed with the electrochemical spectroscopy (EIS) experiments as a decrease of total impedance of the studied system [72] (see Supporting Information). All the above experiments confirm the applicability of the CdS suspension for photocatalytic studies.
The separated electrons are moving to the bulk of the semiconductor nanoparticles and further to the cathode through the external circuit and the holes are transferred to the electrode surface and they are involved in the oxidation process with the redox system present in the solution at the electrode-solution junction. This is causing the increase of the oxidation current. The values of the photopotential and the photocurrent are stabilized in time, suggesting good quality of the CdS nanoparticles. More information about recombination and competition between recombination and charge transfer process at the CdS/solution interface can be obtained analyzing the photocurrent response to the chopped illumination (Figure 6B) at constant potential (chronoamperometry). The absence of the characteristic spikes in the current density (j/mA/cm2) vs. time (t/s) plot also suggests that the occurring electron-hole recombination process is minimal and negligible, compared to the interfacial charge transfer to the redox electrolyte.

3.5. Photocatalytic Activity of CdS Nanoparticles

3.5.1. Photocatalytic Discoloration/Decomposition of a Model Compound: Methylene Blue (MB) Dye

The synthesized CdS hydrophilic nanoparticles were used as photocatalysts for the degradation of methylene blue (MB), as a model compound, under UV-vis light. The UV-Vis absorption spectra of MB solution were measured every 15 min to examine the changes in concentration of MB (see Figure 7A,B for irradiation of MB in the presence and absence of CdS, respectively). As may be seen, the intensity of the absorption spectra of MB in the presence of CdS nanoparticles decreases significantly with the increase of the irradiation time (Figure 7A). Additionally, the minor decrease in MB concentration is observed in the absence of CdS (Figure 7B) as a result of the autooxidation of MB under the irradiation. As may be seen, as the irradiation time increases the absorption peaks at 615 nm and 660 nm, ascribed respectively to MB dimer and electron transition in MB monomer, [74] decrease in both cases, however, the changes are significant only for the system of MB solution with CdS nanoparticles. The irradiation results in discoloration of MB solution caused by the degradation of MB’s auxochrome groups. Additionally, the absorption peaks at 248 nm and 292 nm decrease, and no new bands appear in the spectrum, which shows that both the conjugated system of phenothiazine species and the benzene ring structure decomposed. It can be acknowledged that the degradation of a benzene ring and solution discoloration occurs at the same time, and methylene blue can decompose completely [75].
The plots presented in Figure 8 allow for determination of the degradation efficiency of CdS by using the equation: (C0 − Ct )/C0 × 100, where Ct and C0 are the MB concentration at time t and the initial MB concentration, respectively. The kinetics analysis results of MB degradation for the 292 nm peak are shown in Figure 8A–C.
After correction of MB concentration for the autophotodegradation, the −ln(C0/Ct) vs. irradiation time plot can be constructed (Figure 8C). Since this plot shows linear behavior, it can be concluded that the photodegradation of MB catalyzed CdS nanoparticles proceeds through the first order kinetics. Considering this, one can determine the photodegradation rate constant for MB dye to be equal to 1.03 ± 0.02 × 10⁻² min−1, a value comparable with the literature report [76].

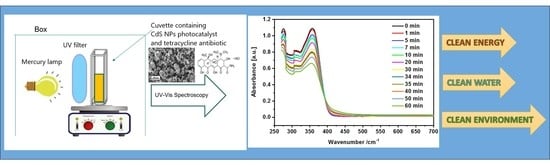
3.5.2. Photocatalytic Activity of CdS Towards Tetracycline (TC)

The following experiments were carried out for tetracycline aqueous solutions, with the same amount of CdS nanoparticles as in the case of MB photodegradation. Additionally, these experiments were performed at two different conditions: (1) one set under the illumination of the full light spectrum of mercury quartz lamp (see Figure 9A,B), and (2) the second set with 2 mm thick glass plate between the reaction vessel and mercury quartz lamp, filtering off (at least partially) the UV wavelength range of illuminating light (see Figure 9C,D). Similar to the case of the MB dye, a slight autophotodegradation of tetracycline under illumination and in the absence of CdS nanoparticles is also observed here, as presented by spectra in Figure 9B,D. Tetracycline has three characteristics absorption bands in its UV–visible spectrum at 250, 275, and 357 nm. They correspond to π→π* transitions of C=C [77].
It is evident, that the full spectrum of mercury quartz lamp radiation (Figure 9A) causes a much faster and more complete photocatalytic degradation of tetracycline (measured at 360 nm band) within the same time-frame, as compared to spectrum with UV cut-off filter (Figure 9C). Normalizing the above spectra to null absorbance at 600 nm, we were able to extract the photodegradation parameters of TC under the effect of semiconducting CdS nanoparticles. The CdS density (10 mg/ml) and the antibiotic concentrations (83 μM) were kept constant. Consequently, Figure 10A shows a normalized concentration change of TC, due to the photodegradation in the absence of CdS nanoparticles (autodegradation) in the case of glass plate filter between the lamp and the sample suspension (black curve) and in the full UV-Vis spectrum of mercury quartz lamp (blue curve). It is important to note that the photodegradation of TC in the absence of semiconductor is insensitive to the presence or absence of glass filter as presented by the small difference between black and blue curves in Figure 10A. This observation can be explained by the fact that the direct photolysis of TC does not involve the formation of OH hydroxyl radicals [78].
The situation is different when CdS semiconductor nanoparticles, acting as photocatalysts, are present in the reaction vessel. It should be intuitively expected that their efficiency for TC photocatalytic decomposition should be greater if the light of higher energy is used, to overcome the CdS bandgap energy of ca. 2.3 eV and to create sufficient amount of the electron-hole pairs ready to participate in the decomposition of tetracycline. Indeed, as Figure 10B shows, such efficiency reaches up to almost 80% TC degradation in 1 hour (green curve) exposure to CdS NP and full-spectrum irradiation, whereas, when a glass “cut-off filter” is placed between the reaction vessel and mercury quartz lamp, this efficiency drops down to slightly below 20% of the initial TC concentration (red curve). Our results can be compared with 83% degradation efficiency obtained in the case of a more complex system of composite materials based on nitrogen-doped carbons and cadmium sulfide semiconductors (CdS/NC-T), reposted by Cao et al. [79].
Similar to the MB case, after correction of TC concentration for the autodegradation, the −ln(C0/Ct) vs. irradiation time plot can be constructed (Figure 10C). Since this plot shows the linear behavior, it can be concluded that the photodegradation of tetracycline antibiotics by hydrophilic CdS nanoparticles proceeds through the first-order kinetics. Taking this into account, one can determine the photocatalytic degradation rate constant for TC antibiotic catalyzed by CdS NPs to be equal to 2.4 ± 0.02 × 10⁻² min−1 for full spectrum and 5.6 ± 0.4 × 10⁻³ min−1 for visible range only irradiation. This value is quite comparable with the literature report, in which the H2O2 of various doses were used for photocatalytic de−gradation of tetracycline under the effect of photogenerated hydroxyl radicals [78,79].

3.5.3. Mechanism of Photocatalytic Decomposition of MB and TC

The mechanism of photocatalytic decomposition of both organic molecules: the MB dye and TC antibiotic, can be described based on the energy/potential diagram showing the correlation between the positions of the energy of conduction (CB) and valence band (VB) levels and the redox potentials of different redox couples that can participate in the photocatalytic degradation process (see Figure 11).
The value of energy (potential) of the bottom of CB (ECB) can be estimated based on the flat band potential value (Efb, ϕfb) of CdS in a neutral solution. Unfortunately, this value is very sensitive to the experimental conditions and the state of CdS samples [80]. We arbitrarily used the value ϕfb given for polycrystalline CdS in neutral solution equal to −0.67 V (NHE) [81], but the value −0.46 V (NHE) can also be applied [79,82]. As can be seen, the bottom of the conduction band (ECB) is located at a more negative potential value (−0.67 V) than the redox potential of H+/H2 (−0.41 V, pH 7) and O2/O2 couple (−0.28 V, pH 7). At the same time, the top level of the valence band (EVB) is slightly more positive than the redox potential of OHad/OHad (1.6 V), and much more positive than the potential of the O2/H2O couple (0.82 V, pH 7). Therefore, under the irradiation of CdS, the electrons (eCB) generated in the conduction band can be transferred to O2 molecules and cause the formation of superoxide radicals,
eCB + O2 → O2 (step 1)
which are further involved in the formation of H2O2 and hydroxyl radical OH:
O2•− + H2O → HOO + OH (step 2)
HOO + H2O → H2O2 + OH (step 3)
H2O2 → OH (step 4)
At the same time, the photogenerated holes in the valence band can participate in the oxidation reaction of water molecules to hydroxyl radical,
h+VB + H2O → OH + H+
which is energetically more favorable than the reaction.
h+VB + OHad → OHad
Finally, photodegradation of both organic compounds, MB and TC, can occur as a result of their reaction with hydroxyl radicals:
MB + OH→ (intermediate compounds) → CO2 + H2O
TC + OH→ (intermediate compounds) → CO2 + H2O
The pathway of TC photodegradation shown in equation (9) can proceed as follows [79]: TC molecules are first oxidized by dominant radicals, OH, triggering a ring-opening reaction, followed then by a detachment of carbonyl and amino groups and further oxidation. Alternative degradation pathways might exist, as noted in several publications [83,84]. Finally, small molecular weight intermediates were completely decomposed to form end products CO2 and H2O [79]. However, we are aware that some of the intermediate compounds can be quite stable, as well as toxic [78,85]. At this point we need to stress that the photodegradation of tetracycline, as proposed by equation (9), is an ideal situation, yet as of now, apparently far from being achieved. On the contrary, it can proceed through various pathways with various efficiencies, as reported in the above references.
One should also take into account that the holes in VB can be involved in photocorrosion of the semiconductor nanoparticles under illumination. In a typical photocorrosion reaction, the CdS decomposes to sulfur and cadmium ions [86,87]:
CdS + 2h+VB → Cd+2 + S (redox potential E0 = −0.4 V vs. NHE)
In the presence of oxygen in solution, yet another reaction is possible (E0 = +0.5 V vs. NHE) [78]:
CdS + 4h+VB + 2H2O + O2 → Cd2+ + SO42− + 4H+ (photocorrosion)
Although the CdS nanoparticles show a major advantage of effectively driving the photocatalytic degradation process of the tetracycline antibiotic in visible light, further investigations are planned to minimize the CdS photocorrosion process, to increase the long-term stability of the photocatalyst, and lessen the risk of a possible release of heavy metal Cd2+ ions. Preliminary studies were already performed using similar photocatalytic systems, and proved to be efficient [88,89].

4. Conclusions

A simple co-precipitation method was used to synthesize CdS nanoparticles. SEM images of hydrophilic nanoparticles show aggregates of small nanoparticles, essentially uniform in size. EDS results suggest 1:1 ratio of Cd:S. (data not shown). Their hydrodynamic size determined by dynamic light scattering was ca. 100 nm with the crystalline core of ca. 10 nm, as judged from the SEM image, while the zeta potential was ca. 0.0 mV. UV-Vis spectroscopy was used to determine their bandgap of 2.3 eV.
Photodegradation of methylene blue was carried out by semiconducting CdS nanoparticles proceeds through the first-order kinetics, with the rate constant k = 1.03 ± 0.02 × 10⁻² min−1, whereas the TC photocatalytic degradation experiments yielded the value of 2.4 ± 0.02 × 10⁻² min−1 for full-spectrum, and 5.6 ± 0.4 × 10⁻³ min−1 for visible range only irradiation. The mechanism of this process was described as a result of the reaction of the organic pollutants, with hydroxyl radicals generated due to the photocatalytic behavior of CdS nanoparticles in an aqueous environment, which is particularly advantageous for environmental aquatic systems.

Supplementary Materials

The following are available online at https://www.mdpi.com/2077-1312/8/7/483/s1, Figure S1: Emission spectra of the quartz mercury lamp used for photocatalysis, Figure S2: Electrochemical Impedance Spectroscopy graph of CdS nanoparticles deposited on glassy carbon electrode in 0.1 M sodium sulfate solution recorded under potential bias 0.5 V; red dots—GC/CdS system under dark and blue dots—GC/CdS system under illumination.

Author Contributions

Conceptualization, J.W.-K., K.J. and P.K.; methodology, M.O.; formal analysis, M.N., J.W.-K.; investigation, M.N, M.O.; resources, P.K.; data curation, M.N., M.O., J.W.-K.; writing—original draft preparation, K.J., J.W.-K., P.K., M.O.; writing—review and editing, P.K., J.W.-K., M.O.; supervision, P.K.; project administration, J.W.-K.; funding acquisition, P.K., J.W.-K. All authors have read and agreed to the published version of the manuscript.

Funding

This work was supported by the National Science Centre NCN (grant no. UMO-2016/21/B/ST4/02133 – OPUS). M.N. and J.W.-K. would like to thank McDonell Summer Research Fellowship and Landesberg’s Family Summer Research Fellowship for supporting this research with generous funds.

Acknowledgments

The authors would like to thank Marcin Strawski from Faculty of Chemistry, Warsaw University for help with XRD analysis and Maciej Mazur from Faculty of Chemistry, Warsaw University for help with photoluminescence analysis.

Conflicts of Interest

The authors declare no conflict of interest. The funders had no role in the design of the study; in the collection, analyses, or interpretation of data; in the writing of the manuscript, or in the decision to publish the results.

References

  1. Yoon, S.J.; Hong, S.; Kim, S.; Lee, J.; Kim, T.; Kim, B.; Kwon, B.-O.; Zhou, Y.; Shi, B.; Liud, P.; et al. Large-scale monitoring and ecological risk assessment of persistent toxic substances in riverine, estuarine, and coastal sediments of the Yellow and Bohai seas. Environ. Int. 2020, 137, 105517–105529. [Google Scholar] [CrossRef] [PubMed]
  2. Iduk, U.; Samson, N. Effects and Solutions of Marine Pollution from Ships in Nigerian Waterways. Int. J. Sci. Eng. Res. 2015, 9, 81–90. [Google Scholar]
  3. Shahidul Islam, M.S.; Tanaka, M. Impacts of pollution on coastal and marine ecosystems including coastal and marine fisheries and approach for management: A review and synthesis. Mar. Pollut. Bull. 2004, 48, 624–649. [Google Scholar] [CrossRef] [PubMed]
  4. Abdel-Shafy, H.I.; Mansour, M.S.M. A review on polycyclic aromatic hydrocarbons: Source, impact, effect on human health and remediation. Egypt. J. Pet. 2016, 25, 107–123. [Google Scholar] [CrossRef] [Green Version]
  5. Dahrir, R.; Drogui, P. Tetracycline antibiotics in the environment: A review. Environ. Chem. Lett. 2013, 11, 209–227. [Google Scholar] [CrossRef]
  6. Daughton, C.G.; Ternes, T.A. Pharmaceuticals and personal care products in the environment: Agents of subtle change? Environ. Health Perspect. 1999, 107 (Suppl. 6), 907–938. [Google Scholar] [CrossRef]
  7. Kolpin, D.W.; Furlong, E.T.; Meyer, M.T.; Thurman, E.M.; Zaugg, S.D.; Barber, L.B.; Buxton, H.T. Pharmaceuticals, hormones, and other organic wastewater contaminants in US streams. 1999–2000: A national reconnaissance. Environ. Sci. Technol. 2002, 36, 1202–1211. [Google Scholar] [CrossRef] [Green Version]
  8. Letteri, T.; Napierska, D.; Loos, R.; Martinov, D.; Sanseverino, I. Review of the 1st Watch List Under the Water Framework Directive and Recommendations for the 2nd Watch List; Publication Office of the European Union: Luxembourg, 2018.
  9. Jeong, Y.; Kim, Y.; Jin, Y.; Hong, S.; Park, C. Comparison of filtration and treatment performance between polymeric and ceramic membranes in anaerobic membrane bioreactor treatment of domestic wastewater. Sep. Purif. Technol. 1999, 199, 182–188. [Google Scholar] [CrossRef]
  10. Agunbiade, M.O.; Van Heerden, E.; Pohl, C.H.; Ashafa, A.T. Flocculation performance of a bioflocculation by Arthrobacter humicola in sewage waste treatment. BMC Biotechnol. 2017, 17, 1–9. [Google Scholar] [CrossRef]
  11. Yu, W.; Xu, L.; Graham, N.; Qu, J. Pre-treatment for ultrafiltration: Effect of pre-chlorination on membrane fouling. Sci. Rep. 2014, 4, 1–8. [Google Scholar] [CrossRef]
  12. Kuznetsov, G.V.; Strizhak, P.A. Coagulation and splitting of droplets of coal-water slurry containing petrochemicals and their effect on ignition characteristics. Appl. Therm. Eng. 2017, 116, 266–277. [Google Scholar] [CrossRef]
  13. Haritash, A.K.; Kaushik, C.P. Biodegradation aspects of polycyclic aromatic hydrocarbons (PAHs): A review. J. Hazard. Mater. 2009, 169, 1–15. [Google Scholar] [CrossRef] [PubMed]
  14. Bernal-Martinez, A.; Patureau, D.; Delgenès, J.-P.; Carrère, H. Removal of polycyclic aromatic hydrocarbons (PAH) during anaerobic digestion with recirculation of ozonated digested sludge. J. Hazard. Mater. 2009, 162, 1145–1150. [Google Scholar] [CrossRef] [PubMed]
  15. Tian, W.J.; Bai, J.; Liu, K.K.; Sun, H.M.; Zhao, Y.G. Occurrence and removal of polycyclic aromatic hydrocarbons in the wastewater treatment process. Ecotoxicol. Environ. Saf. 2012, 82, 1–7. [Google Scholar] [CrossRef] [PubMed]
  16. Smol, M.; Włodarczyk-Makuła, M. The Effectiveness in the Removal of PAHs from Aqueous Solutions in Physical and Chemical Processes: A Review. Polycycl. Aromat. Compd. 2007, 37, 292–313. [Google Scholar] [CrossRef]
  17. Singh, P.; Ojha, A.; Borthakur, A.; Singh, R.; Lahiry, D.; Tiwary, D.; Mishra, P.K. Emerging trends in photodegradation of petrochemical wastes: A review. Environ. Sci. Pollut. Res. 2016, 23, 22340–22364. [Google Scholar] [CrossRef]
  18. Hsu, Y.-Y.; Hsiung, T.-L.; Wang, H.P.; Fukushima, Y.; Wei, Y.-L.; Chang, J.-E. Photocatalytic degradation of spill oils on TiO2 nanotube thin films. Mar. Pollut. Bull. 2008, 57, 873–876. [Google Scholar] [CrossRef]
  19. Kümmerer, K. Antibiotics in the aquatic environment—A review—Part I. Chemosphere 2009, 75, 417–434. [Google Scholar] [CrossRef]
  20. Homem, V.; Santos, L. Degradation and removal methods of antibiotics from aqueous matrices—A review. J. Environ. Manag. 2011, 92, 2304–2347. [Google Scholar] [CrossRef]
  21. Palominos, R.A.; Mondaca, M.A.; Giraldo, A.; Peñuela, G.; Pérez-Moya, M.; Mansilla, H.D. Photocatalytic oxidation of the antibiotic tetracycline on TiO2 and ZnO suspensions. Catal. Today 2009, 144, 100–105. [Google Scholar] [CrossRef]
  22. Reyes, C.; Fernandez, J.; Freer, J.; Mondaca, M.A.; Zaror, C.; Malato, S.; Mansilla, H.D. Degradation and inactivation of tetracycline by TiO2 photocatalysis. J. Photochem. Photobiol. A Chem. 2006, 184, 141–146. [Google Scholar] [CrossRef]
  23. Zhu, X.-D.; Wang, Y.-J.; Sun, R.-J.; Zhou, D.-M. Photocatalytic degradation of tetracycline in aqueous solution by nanosized TiO2. Chemosphere 2013, 92, 925–932. [Google Scholar] [CrossRef]
  24. Soltani, R.D.C.; Mashayekhi, M.; Naderi, M.; Boczkaj, G.; Jorfi, S.; Safari, M. Sonocatalytic degradation of tetracycline antibiotic using zinc oxide nanostructures loaded on nano-cellulose from waste straw as nanosonocatalyst. Ultrason. Sonochem. 2019, 55, 117–124. [Google Scholar] [CrossRef] [PubMed]
  25. Alivisatos, A.P. Semiconductor clusters, nanocrystals, and quantum dots. Science 1996, 271, 933–937. [Google Scholar] [CrossRef] [Green Version]
  26. Huang, L.; Wang, X.; Yang, J.; Liu, G.; Han, J.; Li, C. Dual cocatalysts loaded type I CdS/ZnS core/shell nanocrystals as effective and stable photocatalysts for H2 evolution. J. Phys. Chem. C 2013, 117, 11584–11591. [Google Scholar] [CrossRef]
  27. Khan, Z.R.; Zulfequar, M.; Khan, M.S. Chemical synthesis of CdS nanoparticles and their optical and dielectric studies. J. Mater. Sci. 2011, 46, 5412–5416. [Google Scholar] [CrossRef]
  28. Schiavello, M. Photocatalysis and Environment; Kluwer Academic Publishers: Dordrecht, The Netherlands, 1988. [Google Scholar]
  29. Serpone, M.; Pelizzeti, E. Photocatalysis, Fundamentals and Applications; Wiley: New York, NY, USA, 1989. [Google Scholar]
  30. Ollis, D.F.; Al-Ekabi, H. Photocatalytic Purification, and Treatment of Water and Air; Elsevier: Amsterdam, The Netherlands, 1993. [Google Scholar]
  31. Legrini, O.; Oliveros, E.; Braun, A. Photochemical processes for water treatment. Chem. Rev. 1993, 93, 671–698. [Google Scholar] [CrossRef]
  32. Herrman, J.M.; Guillard, C.; Pichat, P. Heterogeneous Photocatalysis: An emerging technology for water treatment. Catal. Today 1993, 17, 7–20. [Google Scholar] [CrossRef]
  33. Bahnemann, D.W.; Cunningham, J.; Fox, M.A.; Pelizzetti, E.; Pichat, P.; Serpone, N.; Helz, G.R.; Zepp, R.G.; Crosby, D.G. Aquatic and Surface Photochemistry; Lewis: Boca Raton, FL, USA, 1994. [Google Scholar]
  34. Blake, D.M. Bibliography of Work on Photocatalytic Removal of Hazardous Componds from Water and Air; National Renewable Energy Laboratory: Golden, CO, USA, 1997.
  35. Herrmann, J.M. Heterogeneous photocatalysis: Fundamentals and applications to the removal of various types of aqueous pollutants. Catal. Today 1999, 53, 115–129. [Google Scholar] [CrossRef]
  36. Hoffman, M.R.; Martin, S.T.; Choi, W.Y.; Bahnemann, D.W. Environmental applications of semiconductor photocatalysis. Chem. Rev. 1995, 95, 69–96. [Google Scholar] [CrossRef]
  37. Linsebigler, A.L.; Lu, G.Q.; Yates, J.T. Photocatalysis on TiO2 surfaces: Principles, mechanisms, and selected results. Chem. Rev. 1995, 95, 735–758. [Google Scholar] [CrossRef]
  38. Mills, A.; LeHunte, S. An overview of semiconductor photocatalysis. J. Photochem. Photobiol. A Chem. 1997, 108, 1–35. [Google Scholar] [CrossRef]
  39. Zhao, J.; Yang, X.D. Photocatalytic oxidation for indoor air purification: A literature review. Build. Environ. 2003, 38, 645–654. [Google Scholar] [CrossRef]
  40. Bahnemann, D. Photocatalytic water treatment: Solar energy applications. Sol. Energ. 2004, 77, 445–459. [Google Scholar] [CrossRef]
  41. Zhang, H.; Chen, G.; Bahnemann, D.W. Photoelectrocatalytic Materials for Enviornmental Applications. J. Mater. Chem. 2009, 19, 5089–5121. [Google Scholar] [CrossRef]
  42. Fujishima, A.; Honda, K. Electrochemical photolysis of water at a semiconductor electrode. Nature 1972, 238, 37–38. [Google Scholar] [CrossRef] [PubMed]
  43. Ohtani, B. Photocatalysis A to Z: What we know and what we do not know in a scientific sense. J. Photochem. Photobiol. C 2010, 11, 157–178. [Google Scholar] [CrossRef] [Green Version]
  44. Khan, A.; Khan, R.; Waseem, A.; Iqbal, A.; Shah, Z.H. CdS nanocapsules and nanospheres as efficient solar light-driven photocatalysts for degradation of Congo red dye. Inorg. Chem. Commun. 2016, 72, 33–41. [Google Scholar] [CrossRef]
  45. Atabaev, T.S. Facile hydrothermal synthesis of flower-like hematite microstructure with high photocatalytic properties. J. Adv. Ceram. 2015, 4, 61–64. [Google Scholar] [CrossRef] [Green Version]
  46. Biao, L.; Dan, L.; Lei, M.; Sung, Y.I. One-pot synthesis of Cu2O octahedron particles and their catalytic application. Bull. Korean Chem. Soc. 2017, 38, 499–502. [Google Scholar]
  47. Rao, C.N.R.; Vivekchand, S.R.C.; Biswas, K.; Govindaraj, A. Synthesis of inorganic nanomaterials. Dalton Trans. 2007, 34, 3728–3749. [Google Scholar] [CrossRef] [PubMed]
  48. Miao, J.-J.; Jiang, L.-P.; Liu, C.; Zhu, J.-M.; Zhu, J.-J. General sacrificial template method for the synthesis of cadmium chalcogenide hollow structures. Inorg. Chem. 2007, 46, 5673–5677. [Google Scholar] [CrossRef]
  49. Pham, L.Q.; Van, T.-K.; Cha, H.G.; Kang, Y.S. Controlling crystal growth orientation and crystallinity of cadmium sulfide nanocrystals in aqueous phase by using cationic surfactant. Cryst. Eng. Comm. 2012, 14, 7888–7890. [Google Scholar] [CrossRef]
  50. Wu, Y.; Wadia, C.; Ma, W.; Sadtler, B.; Alivisatos, A.P. Synthesis and photovoltaic application of copper [I] sulfide nanocrystals. Nano Lett. 2008, 8, 2551–2555. [Google Scholar] [CrossRef]
  51. Guo, Q.; Ford, G.M.; Yang, W.-C.; Walker, B.C.; Stach, E.A.; Hillhouse, H.W.; Agrawal, R. Fabrication of 7.2% efficient CZTSSe solar cells using CZTS nanocrystals. J. Am. Chem. Soc. 2010, 132, 17384–17386. [Google Scholar] [CrossRef] [PubMed]
  52. Guo, Y.; Wang, J.; Yang, L.; Zhang, J.; Jiang, K.; Li, W.; Wang, L.; Jiang, L. Facile additive-free solvothermal synthesis of cadmium sulfide flower-like three dimensional assemblies with unique optical properties and photocatalytic activity. Cryst. Eng. Comm. 2011, 13, 5045–5048. [Google Scholar] [CrossRef]
  53. Arora, M.K.; Sahu, N.; Upadhyay, S.N.; Sinha, A.S.K. Activity of cadmium sulfide photocatalysts for hydrogen production from water: Role of support. Ind. Eng. Chem. Res. 1999, 38, 2659–2665. [Google Scholar] [CrossRef]
  54. Vázquez, A.; Hernández-Uresti, D.B.; Obregón, S. Electrophoretic deposition of CdS coatings and their photocatalytic activities in the degradation of tetracycline antibiotic. Appl. Surf. Sci. 2016, 386, 412–417. [Google Scholar] [CrossRef]
  55. Prashant, J.; Ginimuge, R.; Jyothi, S.D. Methylene Blue: Revisited. Anaesthesiol. Clin. Pharmacol. 2010, 26, 517–520. [Google Scholar]
  56. Farombi, E.O.; Ugwuezunmba, M.C.; Ezenwadu, T.T.; Oyeyemi, M.O.; Ekor, M. Tetracycline-induced reproductive toxicity in male rats: effects of vitamin C and N-acetylcysteine. Exp. Toxicol. Pathol. 2008, 60, 77–85. [Google Scholar] [CrossRef]
  57. He, X.; Nguyen, V.; Jiang, Z.; Wang, D.; Zhu, Z.; Wang, W.-N. Highly-Oriented One-Dimensional MOF-Semiconductor Nanoarrays for Efficient Photodegradation of Antibiotics. Catal. Sci. Technol. 2018, 8, 1–8. [Google Scholar] [CrossRef]
  58. Bera, R.; Kundu, S.; Patra, A. 2D Hybrid Nanostructure of Reduced Graphene Oxide−CdS Nanosheet for Enhanced Photocatalysis. ACS Appl. Mater. Interfaces 2015, 7, 13251–13259. [Google Scholar] [CrossRef] [PubMed]
  59. Li, Z.; Zhu, L.; Wu, W.; Wang, S.; Qiang, L. Highly efficient toward tetracycline under simulated solar-light by Ag+-CDs-Bi2WO6: Synergistic effects of silver ions and carbon dots. Appl. Catal. B Environ. 2016, 192, 277–285. [Google Scholar] [CrossRef]
  60. Xiao, T.; Tang, Z.; Yang, Y.; Tangb, L.; Zhoub, Y.; Zoub, Z. In situ construction of hierarchical WO3/g-C3N4 composite hollow microspheres as a Z-scheme photocatalyst for the degradation of antibiotics. Appl. Catal. B Environ. 2018, 220, 417–428. [Google Scholar] [CrossRef]
  61. Safari, G.H.; Hoseini, M.; Seyedsalehi, M.; Kamani, H.; Jaafari, J.; Mahvi, A.H. Photocatalytic degradation of tetracycline using nanosized titanium dioxide in aqueous solution. Int. J. Environ. Sci. Technol. 2015, 12, 603–616. [Google Scholar] [CrossRef] [Green Version]
  62. Chen, T.-S.; Tsai, R.-W.; Chen, Y.-S.; Huang, K.-L. Electrochemical Degradation of Tetracycline on BDD in Aqueous Solutions. Int. J. Electrochem. Sci. 2014, 9, 8422–8434. [Google Scholar]
  63. Jin, C.; Li, W.; Chen, Y.; Li, R.; Huo, J.; He, Q.; Wang, Y. Efficient Photocatalytic Degradation and Adsorption of Tetracycline over Type-II Heterojunctions Consisting of ZnO Nanorods and K-Doped Exfoliated g-C3N4 Nanosheets. Ind. Eng. Chem. Res. 2020, 59, 2860–2873. [Google Scholar] [CrossRef]
  64. Li, W.; Ding, H.; Ji, H.; Dai, W.; Guo, J.; Du, G. Photocatalytic Degradation of Tetracycline Hydrochloride via a CdS-TiO2 Heterostructure Composite under Visible Light Irradiation. Nanomaterials 2018, 8, 415. [Google Scholar] [CrossRef] [Green Version]
  65. Nasseh, N.; Panahi, A.H.; Esmati, M.; Daglioglud, N.; Asadi, A.; Rajati, H.; Khodadoost, F. Enhanced photocatalytic degradation of tetracycline from aqueous solution by a novel magnetically separable FeNi3/SiO2/ZnO nano-composite under simulated sunlight: Efficiency, stability, and kinetic studies. J. Mol. Liq. 2020, 301, 112434–112442. [Google Scholar] [CrossRef]
  66. Tang, T.; Liu, X.; Ma, C.; Zhou, M.; Huo, P.; Yu, L.; Pan, J.; Shi, W.; Yan, Y. Enhanced photocatalytic degradation of tetracycline antibiotics by reduced graphene oxide–CdS/ZnS heterostructure photocatalysts. New J. Chem. 2015, 7, 1–37. [Google Scholar] [CrossRef]
  67. Suresh, S. Studies on the dielectric properties of CdS nanoparticles. Appl. Nanosci. 2014, 4, 325–329. [Google Scholar] [CrossRef] [Green Version]
  68. Kundu, J.; Pradhan, D. Controlled synthesis and catalytic activity of copper sulfide nanostructured assemblies with different morphologies. Appl. Mater. Interfaces 2014, 6, 1823–1834. [Google Scholar] [CrossRef] [PubMed]
  69. Kundu, J.; Khilari, S.; Pradhan, D. Shape-dependent photocatalytic activity of hydrothermally synthesized cadmium sulfide nanostructures. ACS Appl. Mater. Interfaces 2017, 9, 9669–9680. [Google Scholar] [CrossRef] [PubMed]
  70. Cardona, M.; Weinstein, M.; Wolff, G.A. Ultraviolet reflection spectrum of cubic CdS. Phys. Rev. 1965, 140, 633–637. [Google Scholar] [CrossRef]
  71. Kapoor, S.; Ahmad, H.; Julien, C.M.; Islam, S.S. Improved ion-diffusion assisted uniform growth of 1D CdS nanostructures for enhanced optical and energy storage properties. Appl. Surf. Sci. 2020, 512, 145654–145665. [Google Scholar] [CrossRef]
  72. Rajbongshi, H.; Kalita, D. Morphology-Dependent Photocatalytic Degradation of Organic Pollutant and Antibacterial Activity with CdS Nanostructures. J. Nanosci. Nanotechnol. 2020, 20, 5885–5895. [Google Scholar] [CrossRef]
  73. Han, G.; Wang, L.; Pei, C.; Shi, R.; Liu, B.; Zhao, H.; Yang, H.; Liu, S. Size-dependent optical properties and enhanced visible light photocatalytic activity of wurtzite CdSe hexagonal nanoflakes with dominant {001} facets. J. Alloys Compd. 2014, 610, 62–68. [Google Scholar] [CrossRef]
  74. Bergmane, K.; O’konski, T. A spectroscopic study of methylene blue, dimer, and complexes with montmorillonite. J. Phys. Chem. 1963, 67, 2169–2177. [Google Scholar] [CrossRef]
  75. Yang, C.; Dong, W.; Cui, G.; Zhao, Y.; Shi, X.; Xia, X.; Tang, B.; Wang, W. Highly efficient photocatalytic degradation of methylene blue by P2ABSA-modified TiO2 nanocomposite due to the photosensitization synergetic effect of TiO2 and P2ABSA. RSC Adv. 2017, 7, 23699–23708. [Google Scholar] [CrossRef] [Green Version]
  76. Reddy, C.V.; Shim, J.; Cho, M. Synthesis, structural, optical and photocatalytic properties of CdS/ZnS core/shell nanoparticles. J. Phys. Chem. Solids 2017, 103, 209–217. [Google Scholar] [CrossRef]
  77. Khurana, C.; Vala, A.K.; Andhariya, N.; Pandey, O.P.; Chudasama, B. Influence of antibiotic adsorption on biocidal activities of silver nanoparticles. IET Nanobiotechnol. 2016, 10, 69–74. [Google Scholar] [CrossRef]
  78. Cao, H.-L.; Cai, F.-Y.; Yu, K.; Zhang, Y.-Q.; Lü, J.; Cao, R. Photocatalytic Degradation of Tetracycline Antibiotics over CdS/Nitrogen-Doped-Carbon Composites Derived from in Situ Carbonization of Metal-Organic-Frameworks. ACS Sustain. Chem. Eng. 2019, 7, 10847–10854. [Google Scholar] [CrossRef]
  79. López-Peñalver, J.J.; Sánchez-Polo, M.; Gómez-Pacheco, C.V.; Rivera-Utrilla, J. Photodegradation of tetracyclines in aqueous solution by using UV and UV/H2O2 oxidation processes. J. Chem. Technol. Biotechnol. 2010, 85, 1325–1333. [Google Scholar] [CrossRef]
  80. Meissner, D.; Memming, R.; Kastening, B. Photoelectrochemistry of cadmium sulfide. 1. reanalysis of photocorrosion and flat-band potential. J. Phys. Chem. 1988, 92, 3476–3483. [Google Scholar] [CrossRef]
  81. Dewitt, R.; Mesmaeker, A.K.D. Capacitance characteristics of the polycrystalline CdS/NaOH and CdS/cysteine interfaces. J. Electrochem. Soc. 1983, 130, 1995–1998. [Google Scholar] [CrossRef]
  82. Minoura, H.; Tsuiki, M. Anodic reactions of several reducing agents on illuminated cadmium sulfide electrode. Electrochim. Acta 1978, 23, 1377–1382. [Google Scholar] [CrossRef]
  83. Li, S.; Hu, J. Photolytic and photocatalytic degradation of tetracycline: Effect of humic acid on degradation kinetics and mechanisms. J. Hazard. Mater. 2016, 318, 134–144. [Google Scholar] [CrossRef]
  84. Jeong, J.; Song, W.; Cooper, W.J.; Jung, J.; Greaves, J. Degradation of tetracycline antibiotics: Mechanisms and kinetic studies for advanced oxidation/reduction process. Chemosphere 2010, 78, 533–540. [Google Scholar] [CrossRef]
  85. Han, C.-H.; Park, H.-D.; Kim, S.-B.; Yargeau, V.; Choi, J.-W.; Lee, S.-H.; Park, J.-A. Oxidation of tetracycline and oxytetracycline for the photo-Fenton process: Their transformation products and toxicity assessment. Water Res. 2020, 172, 115514. [Google Scholar] [CrossRef]
  86. Boonserm, A.; Chaiyaput, K.; Varinrumpai, S. Photoelectrochemical response and corrosion behavior of CdS/TiO2 nanocomposite films in an aerated 0.5 M NaCl solution. Appl. Surf. Sci. 2017, 419, 933–941. [Google Scholar] [CrossRef]
  87. Hu, Y.; Gao, X.; Yu, L.; Wang, Y.; Ning, J.; Xu, S.; Lou, X.W. Carbon-coated CdS petalous nanostructres with enhanced photostability and photocatalytic activity. Angew. Chem. Int. Ed. Engl. 2013, 52, 5636–5639. [Google Scholar] [CrossRef] [PubMed]
  88. Aragon, A.G.; Kierulf-Vieira, W.; Łęcki, T.; Zarębska, K.; Widera-Kalinowska, J.; Skompska, M. Synthesis and application of N-doped TiO2/CdS/poly(1,8-diaminocarbazole) composite for photocatalytic degradation of 4-chlorophenol under visible light. Electrochim. Acta 2019, 314, 73–80. [Google Scholar] [CrossRef]
  89. Maranowski, B.; Dulovic, S.; Casto, S.; Strawski, M.; Widera-Kalinowska, J.; Szklarczyk, M. Preparation and Characterization of CdSe/POMA Photoactive Composites Electrochemically Grown on HOPG Surfaces. J. Electroanal. Chem. 2020. [Google Scholar] [CrossRef]
Figure 1. Equipment for CdS NP synthesis.
Jmse 08 00483 g001
Figure 2. Scanning electron microscope (SEM) image of dropcast CdS nanoparticles (scale bar is 200 nm).
Jmse 08 00483 g002
Figure 3. TEM image of drop-cast CdS nanoparticles.
Jmse 08 00483 g003
Figure 4. XRD pattern of cadmium sulfide nanoparticles.
Jmse 08 00483 g004
Figure 5. (A) The Tauc plot presenting (αhν)2 vs. dependence based on inset, showing UV-vis spectra obtained for CdS nanoparticles; (B) photoluminescence (PL) spectrum of dry CdS nanoparticles drop-cast on a fused silica substrate; (C) optical microscopy image under white light; and (D) fluorescence microscopy image under 530 nm illumination of CdS NP dropcast on quartz glass. Scale bar is 5 µm on both C and D.
Jmse 08 00483 g005aJmse 08 00483 g005b
Figure 6. (A) Open circuit potential of the CdS nanoparticles film deposited onto glassy carbon electrode substrate, recorded in the 0.1 M polysulfides solution vs. Ag,AgCl/3M KClaq reference electrode; (B) photocurrent density of the CdS nanoparticles film deposited onto glassy carbon electrode substrate, recorded in the 0.1 M polysulfides solution and applied potential of −0.5 V vs. Ag,AgCl/3M KClaq reference electrode.
Jmse 08 00483 g006
Figure 7. Absorption spectra of methylene blue (MB) (A) in the presence and (B) in the absence of CdS nanoparticle suspension, both recorded during the irradiation with mercury quartz lamp.
Jmse 08 00483 g007
Figure 8. Kinetics analysis of degradation efficiency of MB: (A) plot of Ct/C0 vs. irradiation time; (B) plot of (C0−Ct)/C0 × 100 vs. irradiation time; (C) plot of ln(C0/Ct) vs. irradiation time, respectively for the MB degradation in the presence of CdS nanoparticles (green) and without CdS nanoparticles (black).
Jmse 08 00483 g008aJmse 08 00483 g008b
Figure 9. Absorption spectra of tetracycline (TC) (A,C) in the presence and (B,D) in the absence of CdS nanoparticle suspension, recorded during the irradiation with mercury quartz lamp; (A,B) without, while (C,D) with a UV filter, respectively.
Jmse 08 00483 g009aJmse 08 00483 g009b
Figure 10. Degradation efficiency of TC: (A) plot of Ct/C0 vs. irradiation time; (B) plot of (C0−Ct)/C0 × 100 vs. irradiation time; (C) plot of ln(C0/Ct) vs. irradiation time. Black and blue curves correspond to TC degradation without CdS, while red and green curves are related to TC degradation in the CdS presence. Blue and green curves recorded with the full spectrum of the lamp, while red and black curves were recorded with the use of a UV filter.
Jmse 08 00483 g010
Figure 11. Scheme presenting energy and potential diagram correlating the conduction band (CB) and valence band (VB) levels of CdS and different redox couples that can be responsible for photocatalytic decomposition of MB and TC, pH = 7.
Jmse 08 00483 g011

