Article

Severe Coastal Hypoxia Interchange with Ocean Acidification: An Experimental Perturbation Study on Carbon and Nutrient Biogeochemistry

by
Natalia Kapetanaki
1,*,
Evangelia Krasakopoulou
2,
Eleni Stathopoulou
1,
Manos Dassenakis
1 and
Michael Scoullos
1
1
Laboratory of Environmental Chemistry, Department of Chemistry, University of Athens, 15771 Athens, Greece
2
Department of Marine Sciences, University of the Aegean, University Hill, 81100 Mytilene, Greece
*
Author to whom correspondence should be addressed.
J. Mar. Sci. Eng. 2020, 8(6), 462; https://doi.org/10.3390/jmse8060462
Submission received: 25 May 2020 / Revised: 17 June 2020 / Accepted: 22 June 2020 / Published: 23 June 2020

Abstract

:
Normally atmospheric CO2 is the major driver of ocean acidification (OA); however, local discharge/degradation of organic matter (OM) and redox reactions can exacerbate OA in coastal areas. In this work we study the response of nutrient and carbon systems to pH decrease in relation to hydrographically induced intermittent characteristics and examine scenarios for future ocean acidification in a coastal system. Laboratory microcosm experiments were conducted using seawater and surface sediment collected from the deepest part of Elefsis Bay; the pH was constantly being monitored while CO2 gas addition was adjusted automatically. In Elefsis Bay surface pCO2 is already higher than global present atmospheric values, while near the bottom pCO2 reaches 1538 μatm and carbonate saturation states were calculated to be around 1.5. During the experiment, in more acidified conditions, limited alkalinity increase was observed and was correlated with the addition of bicarbonates and OM. Ammonium oxidation was decelerated and a nitrification mechanism was noticed, despite oxygen deficiency, paralleled by reduction of Mn-oxides. Phosphate was found significantly elevated for the first time in lower pH values, without reprecipitating after reoxygenation; this was linked with Fe(II) oxidation and Fe(III) reprecipitation without phosphate adsorption affecting both available dissolved phosphate and (dissolved inorganic nitrogen) DIN:DIP (dissolved inorganic phosphate)ratio.

1. Introduction

Hypoxia constitutes the condition of low dissolved oxygen (DO); in most cases, hypoxia is associated with a semi-enclosed hydrogeomorphology that, combined with water-column stratification, restricts water exchange [1]. Many thresholds for hypoxic conditions in various units have been used, the most prominent one being ~60 μmol O2 kg−1 [2]. Waters with DO less than 15 μmol O2 kg−1 are subcategorized as severe hypoxic [1], while others [2] set this limit at 22 μmol O2 kg−1. “Anoxia” is defined as the true zero dissolved oxygen state. In the situation where DO levels are so low that microbes begin to turn to nitrate as an alternative electron acceptor a cascade of redox reactions begins to appear; this “suboxic” limit is typically set at around 10 μmol O2 kg−1 [2].
Coastal regions occupy only 7% of the world ocean surface area but constitute a major global carbon cycle component with still virtually undefined impacts on the marine carbonate system and air-sea CO2 exchange [3,4]. While elevated atmospheric CO2 levels is the most significant driver of ocean acidification (OA) at a global scale, local degradation of organic matter consumes oxygen leading to hypoxic/anoxic conditions, increasing CO2 levels and lowering pH [5]. Various studies have related low oxygen with high CO2 partial pressure (pCO2) in both coastal and open ocean systems [6] often reaching an order of magnitude greater values than those predicted for ocean surface later this century (>1000 μatm; [7,8]). Even under current conditions, maximum pCO2 values of 1700–3200 μatm can easily be reached in coastal waters where oxygen is depleted, e.g., [9,10]. Compared to the open ocean, shallow coastal sites exhibit natural variability in carbonate chemistry over multiple time frames [11,12], complicating the detection and relevance of OA in open ocean when approached in isolation of other processes (e.g., primary production, respiration, net calcification) [13,14]. In a future scenario when atmospheric pCO2 increases to 800 parts per million (ppm) and buffering capacity of waters subjected to hypoxia will be further reduced, the result is expected to be an overall pH drop of 0.74 units between oxygenated offshore water of today and oxygen-depleted subpycnocline water in the future [15]. Additionally, coastal eutrophication has been found to strongly affect pH patterns [9,16]. Through time series regarding several coastal regions globally, pH changes not always experience similar trends with OA; coastal pH is decreasing faster or more significantly than OA in many sites with seasonal and interannual variability as high as 1.4 and 1.6 [16]. Changes in nutrient availability and the related biogeochemical processes have been identified as possible drivers of pH variability in coastal waters [17]. Additionally, according to model simulations, a possible primary production increase due to eutrophication could poise ocean acidification effects on surface water carbonate chemistry in coastal environments [18]. Thus, such coastal environments offer good case studies to better comprehend and possibly foresee potential interchanges between oxygen depletion, nutrient discharge and ocean acidification.
Elefsis Bay is a typical, restricted coastal system (68 km2 with a mean and maximum depth of 20 m and 35 m, respectively), in the Aegean Sea (Eastern Mediterranean Sea; Figure 1). It is located near the highly-populated city of Athens and is the seafront of Thriassion plain that is a densely industrialized area where also two crude oil refineries operate, emitting significant loads of CO2 and other acidifying gases.
Freshwater inputs in Elefsis bay are minimal all year round, being higher during autumn and winter months when episodic rain events provide freshwater into the bay through ephemeral streams, a small lake communicating via a narrow channel, as well as via submarine groundwater [19]. However, these freshwater discharges are heavily loaded in nutrients due to the aforementioned anthropogenic activities, leading to increased primary productivity [20]. Phytoplankton biomass and primary production rates measured in Elefsis bay are one order of magnitude higher of those measured in open Aegean waters [21]. Intermittent anoxic conditions are developed between May and October due to elevated surface temperature and oxygen depletion resulting from microbial degradation of organic matter (OM) in the deeper waters [20,22,23]. Organic matter remineralization (e.g., ammonification) is the main process under such conditions with concomitant silicate, phosphate and ammonium increase (against nitrite and nitrate) near the sediment–water interface. During stratified periods, denitrification occurs within the water column and the upper few millimeters of surface sediments; nitrate converts to nitrite and subsequently to nitrogen gases, which are released from the system, representing a sink of nitrate and decreasing eventually the DIN:DIP ratio [20]. The ratio is affected also by solubilization of iron phosphate due to the iron reduction of Fe(III) to Fe(II) resulting in emanation of phosphate not all of which is reprecipitated after reoxygenation [24]. The Gulf of Elefsis is also characterized as eutrophic based on the application of the eutrophication index developed by [25] although there has been a significant improvement of the ecological status the last 30 years [26].
Individual studies within the warm period report pH fluctuations of 8.4–7.9 from surface to bottom, already during the 1970s, with decreased bottom pH values ranging between 7.5 and 7.9 [22,27]. Despite these findings, only one experimental study has been conducted to evaluate possible biogeochemical alterations due to pH decline during hypoxic conditions in the enclosed embayment of Elefsis Bay [28].
This research aims in examining how further oxygen depletion and the establishment of severe hypoxic conditions/anoxic, due to enhanced OM degradation and concomitant nutrient accumulation, would act as a positive or negative feedback to bottom to surface acidification [28] and pointing out possible shifts in complex biogeochemical processes established in the area.

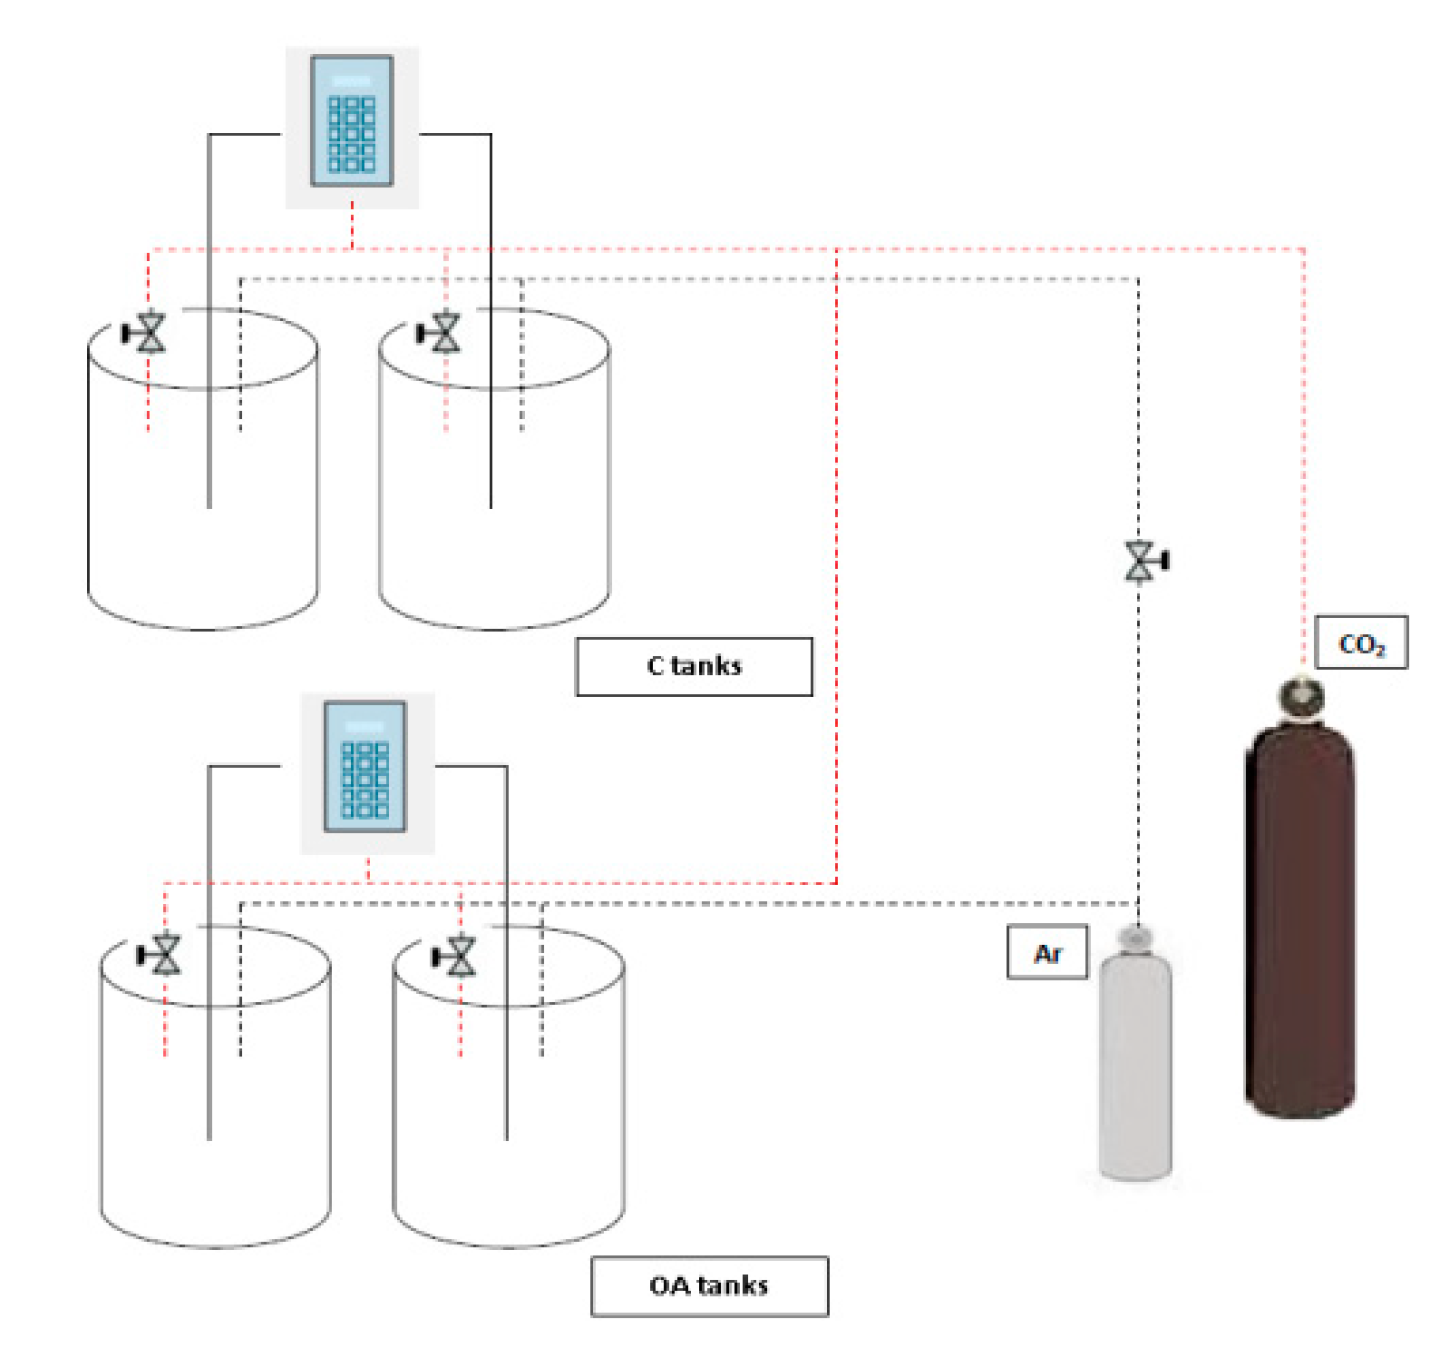
2. Materials and Methods

Field sampling was performed at the deepest western part of Elefsis Bay (Longitude: 23°25′48″ E; Latitude: 38°03′ N, Depth: 33 m; Figure 1) in September 2014, when the pycnocline was well developed, with the R/V Aegaeo (Hellenic Centre for Marine Research, HCMR). Hydrographic properties (salinity, temperature and depth) were recorded through a Sea Bird Electronics CTD instrument (SBE-9) associated with a General Oceanic rosette sampler, equipped with twelve 10 L Niskin bottles. Samples of seawater from every 10 m were collected and measured immediately for pH and Redox potential with a laboratory pH meter and Redox potential probe (Jenway 3310). Samples from each depth were also collected for the immediate determinations of dissolved oxygen (DO) and total alkalinity (AT). Sediments were collected using a 0.1 m2 box corer.
The experimental setup follows a similar previous setup for the area [28]. Seawater from the deepest part (33 m) was collected unfiltered and untreated surface sediment (0–10 cm), which were then carefully transferred into four 25 L Nalgene Polycarbonate bottles (at a proportion 80% and 20%, respectively) in a thermostated room. The seawater–sediment systems were kept in the dark, at in situ temperature (17.5 °C) and were left to equilibrate under controlled Ar supply for a week (instead of air supply used in the previous setup [28]), in order to maintain minimum DO conditions (Day-1 in all diagrams presented here suggests field values for maximum depth, 33 m). Subsequently, a 33 day-experimental period of CO2 aeration followed, using a continuous flow system (IKS Aquastar, IKS Computer Systeme GmbH); Ar gas was supplied in parallel to avoid oxygen penetration. On the 25th day, the Ar supply was seized and the tanks were left to reoxygenate naturally during the last 7 days of the experiment duration; this was attempted as a rough simulation of the naturally occurring reoxygenation when the pycnocline collapses. Each tank was monitored constantly (every 5 min) through the IKS System (temperature; accuracy: ±0.3 °C, pH; accuracy ±0.05 and DO; accuracy ±12 μmol kg−1). IKS probes were calibrated daily, using certified buffers to avoid drifting; potentiometric probes (pH and DO) were also used in order to prevent possible drifts of the IKS probes. The measured pH values by the IKS system were corrected with the parallel use of a laboratory pH meter (Jenway 3310) calibrated on NBS scale (pH accuracy ±0.02) equipped with an additional probe for DO measurements (±8 μmol kg−1); the pH values were then converted to the total scale (pHT; [29]).
The nominal pH values selected for the two experiment conditions (treatments) were: (i) the pH value found in situ (7.75, NBS) as the control factor conditions/treatment (C), and (ii) the pH value predicted for the year 2300 (6.80 NBS), which corresponds to the highest total cumulative future CO2 emission scenario, for latitudes corresponding to the Mediterranean Sea [30] for the ocean acidification conditions/treatment (OA). The 2300 prediction for the pH value was chosen because in situ pH measurements below the pycnocline Elefsis’ waters already exceeded the future projections for the year 2100 (data from present study; [22,27,28]). Each experimental condition was applied in two replicate tanks (Figure 2); seemingly, all results regarding seawater samples for both conditions refer to the mean value of the two replicates (including their standard deviation bars). The attempt to maintain the in situ physicochemical properties of the natural system (untreated seawater and sediment, temperature, pH and DO) was fixated for the closest possible simulation of the naturally occurring mechanisms. Therefore, the C condition tanks are considered to represent naturally evolving alterations, in order to investigate and fully comprehend the effects of acidification and consequent interchanges on the selected area.
Seawater sampling from the microcosms was performed approximately every 3 days and analyzed immediately for dissolved oxygen (DO) and total alkalinity (AT). Additional water subsamples were collected and filtered through 0.45 μm polycarbonate membranes for storage in −18 °C and further analyses of dissolved organic carbon (DOC), nitrate (NO3), nitrite (NO2), ammonia (NH4+), total dissolved nitrogen (TDN), phosphate (PO43−), total dissolved phosphorus (TDP) and silicate (SiO44−). The methods of determination as well as the analytical errors of all the above chemical parameters are described in detail in [28]. Dissolved organic nitrogen (DON) and phosphorus (DOP) were calculated by subtraction of dissolved inorganic nitrogen forms (DIN) from TDN and of phosphate from TDP. The rest of carbonate system parameters, pCO2, CO2 concentration, dissolved inorganic carbon (DIC), bicarbonates (HCO3), carbonates (CO32−), aragonite’s and calcite’s saturation states (Ωar and Ωcalc respectively) were calculated through the CO2SYS (v.2.1) software package [31] based on pHT and AT values. Phosphate, silicate and ammonia concentrations were used as well for this computation; NH3 concentrations were calculated through NH4+ and pH values according to [32]. The CO2SYS calculations were performed using the apparent dissociation constants of carbonic acid (K1 and K2) of [33], the equilibrium constant of hydrogen fluoride of [34], the stability constant of hydrogen sulfate ion of [35] and the boron to chlorinity ratio of [36].
Sampling procedure for sediments involved the collection of two surface subsamples (approximately the first 1–2 cm) from each tank on the 18th day and on the 33rd day of the experiment. The organic carbon (OC), the total carbon (TC) and total nitrogen (ΤΝ) were determined as described by [37] with a Thermo Scientific FLASH 2000 CHNS elemental analyzer. Sedimentary carbonates were calculated (CaCO3) through inorganic carbon, after the subtraction of organic carbon from total carbon. X-ray fluorescence (XRF) was used for the analysis of total phosphorus.
Through SPSS software package, a one-way ANOVA was performed to test the statistical significance of variation between the two experimental conditions for seawater and sediment [38]. Data were first checked to ensure they conformed to the assumptions of ANOVA (normality: Kolmogorov–Smirnov test and homogeneity of variance test). Additionally, a principal components analysis (PCA) was applied in order to evaluate the effects of the selected pH treatments on the biogeochemical parameters of the experimental microcosms; A Promax with Kaiser Normalization was used for rotation method, converged in three iterations. In PCA analysis, Ω-values were excluded from data reduction since they are directly affected by CO32−; CO2 concentrations were also excluded and only pCO2 values were used.

3. Results

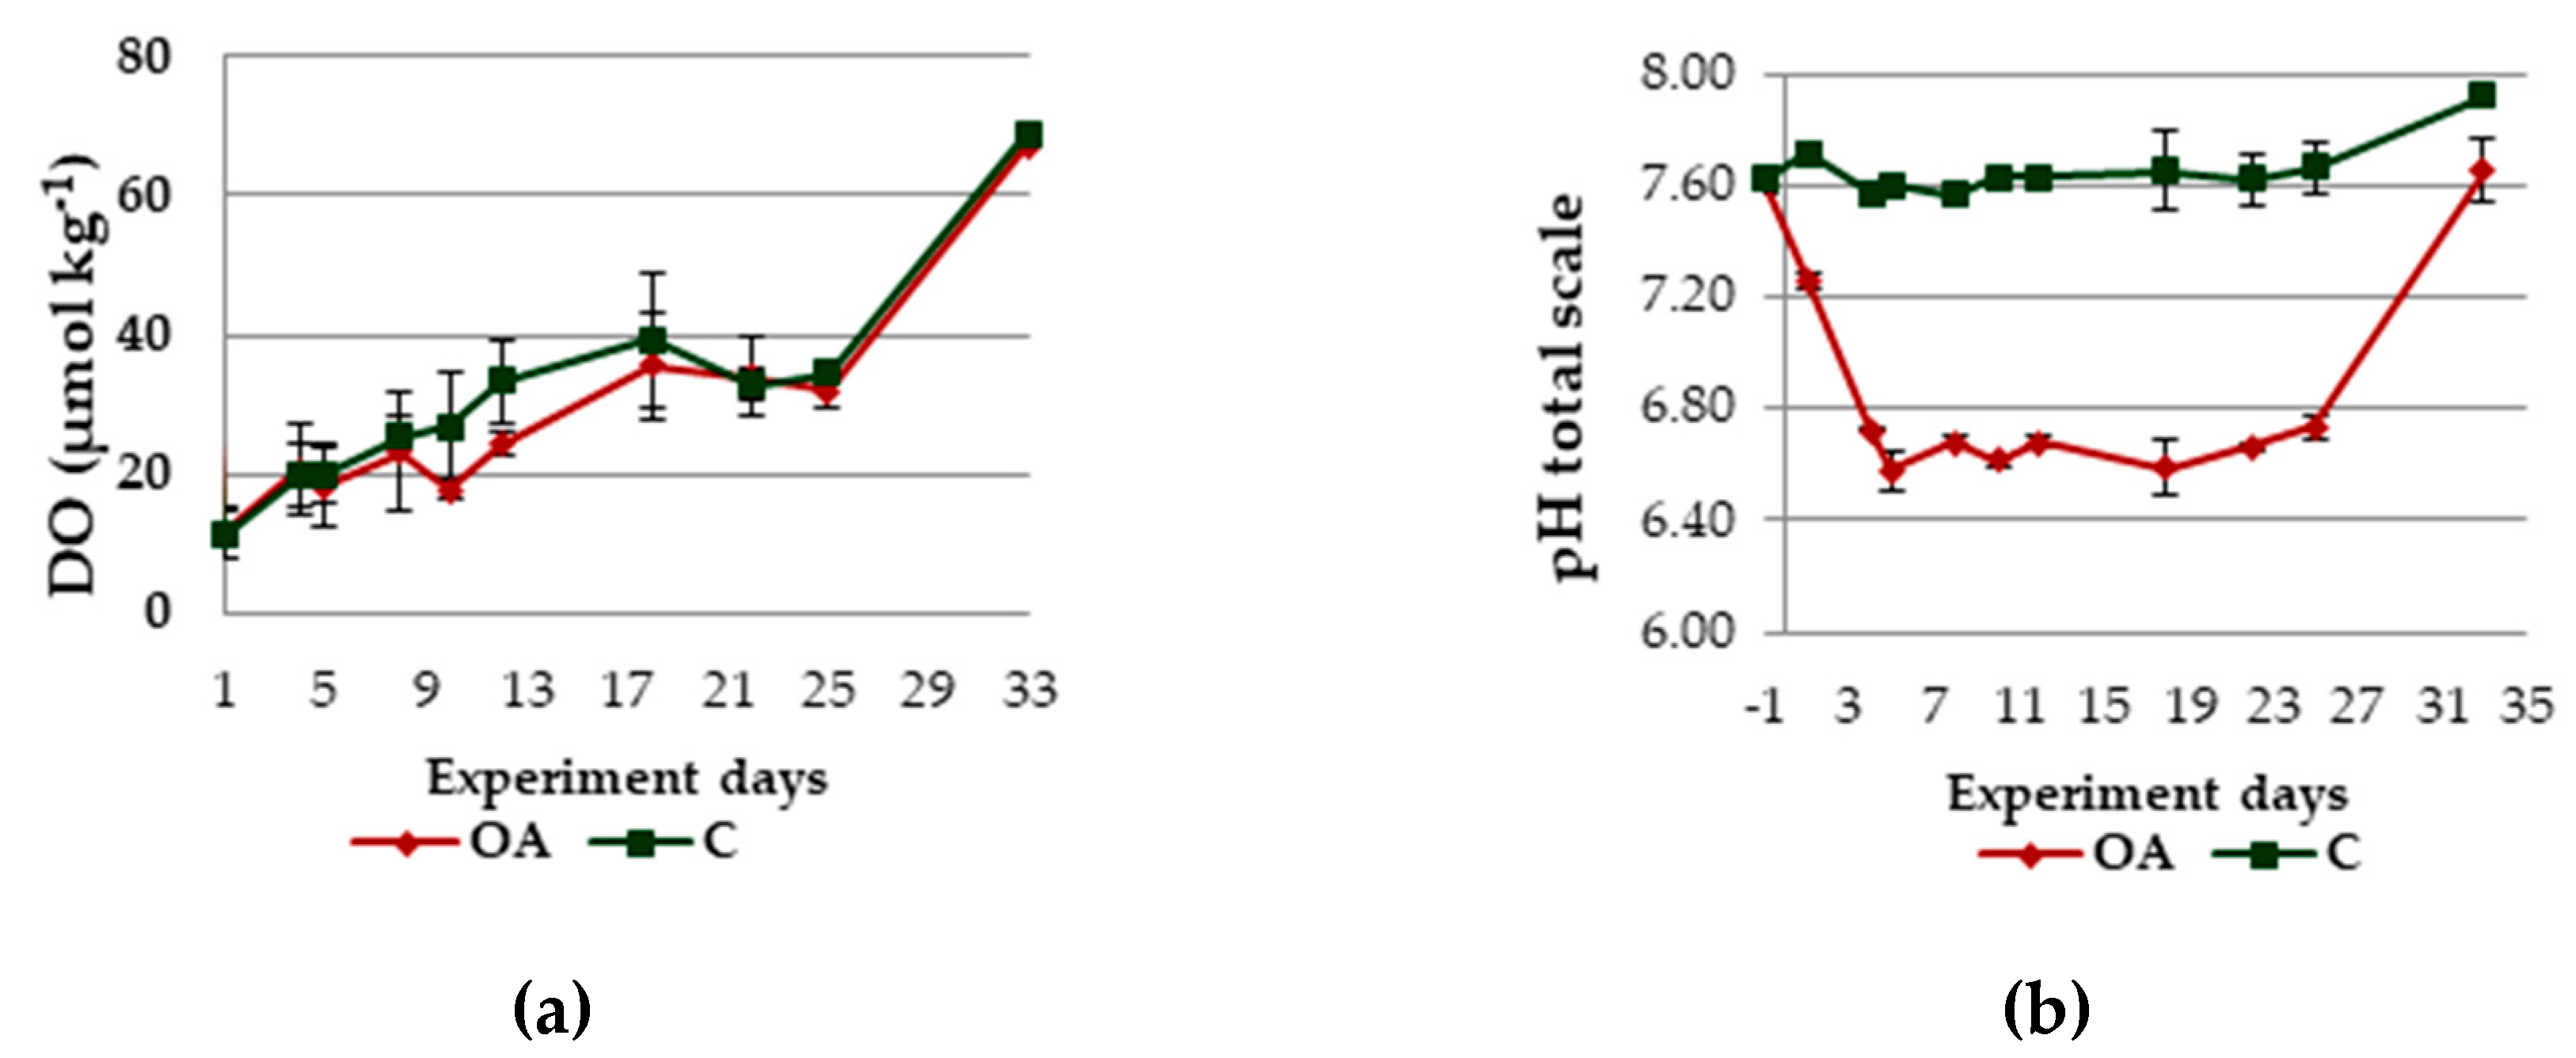
3.1. Physicochemical Parameters

Measurements recorded through CTD indicated a temperature decline from 26.7 °C in the surface to 17.5 °C in the bottom; salinity decreased from 38.67 to 38.39 psu in 33 m (Figure 3a). Negative redox potential values in the bottom suggest reducing conditions. DO determinations showed a well oxygenated upper part until the first 10 m (140 μmol kg−1); in 20 m depth, DO was found 33 μmol kg−1 suggesting severe hypoxia (Figure 3b; [2]). In the deepest part, complete oxygen depletion was found, indicating full anoxic conditions. Significantly elevated ammonium, DON (Figure 4a), phosphate and silicate concentrations (Figure 4b) were also detected in the bottom due to anoxia while nitrite and nitrate were found minimum (Figure 4a). These results agree with earlier observations [20,22], indicating the long term character of these phenomena.
During the experiment, temperature was measured 17.70 ± 0.21 °C inside the incubator room. pH (NBS) fluctuated slightly in both treatments (6.79 ± 0.06 units for OA and 7.76 ± 0.03 pH units for C treatment; Table 1; Figure 5b). DO (Figure 5a) fluctuated between 11 and ~40 μmol kg−1 presenting no statistical difference between the treatments (F = 0.015, p = 0.903) suggesting severe hypoxic conditions [2]. After Ar supply was seized and the systems were left to reoxygenate naturally, DO increased to 70 μmol kg−1 still maintaining hypoxic conditions in both treatments [2].

3.2. Carbonate System Parameters

3.2.1. Field Observations

The pCO2 calculated in the surface water was 522.6 μatm with a significant increase in the deeper parts, reaching eventually 1538.4 μatm in the bottom of Elefsis Bay (Table 1). Total alkalinity (AT; Figure 6), in the field, was not significantly affected by the pycnocline, with its value being relatively steady (2975–2990 μmol kg−1) at all depths. Bicarbonates and DIC (Figure 6) presented similar vertical distributions, increasing below 10 m depth (pycnocline formation); carbonates (Figure 5) and carbonate saturation states (Table 1) decreased significantly with depth; surface CO32− from 307 μmol kg−1 diminished to 100 μmol kg−1 near the bottom while Ωar was found also declining from 4.80 in the surface to 1.51 in the bottom waters.

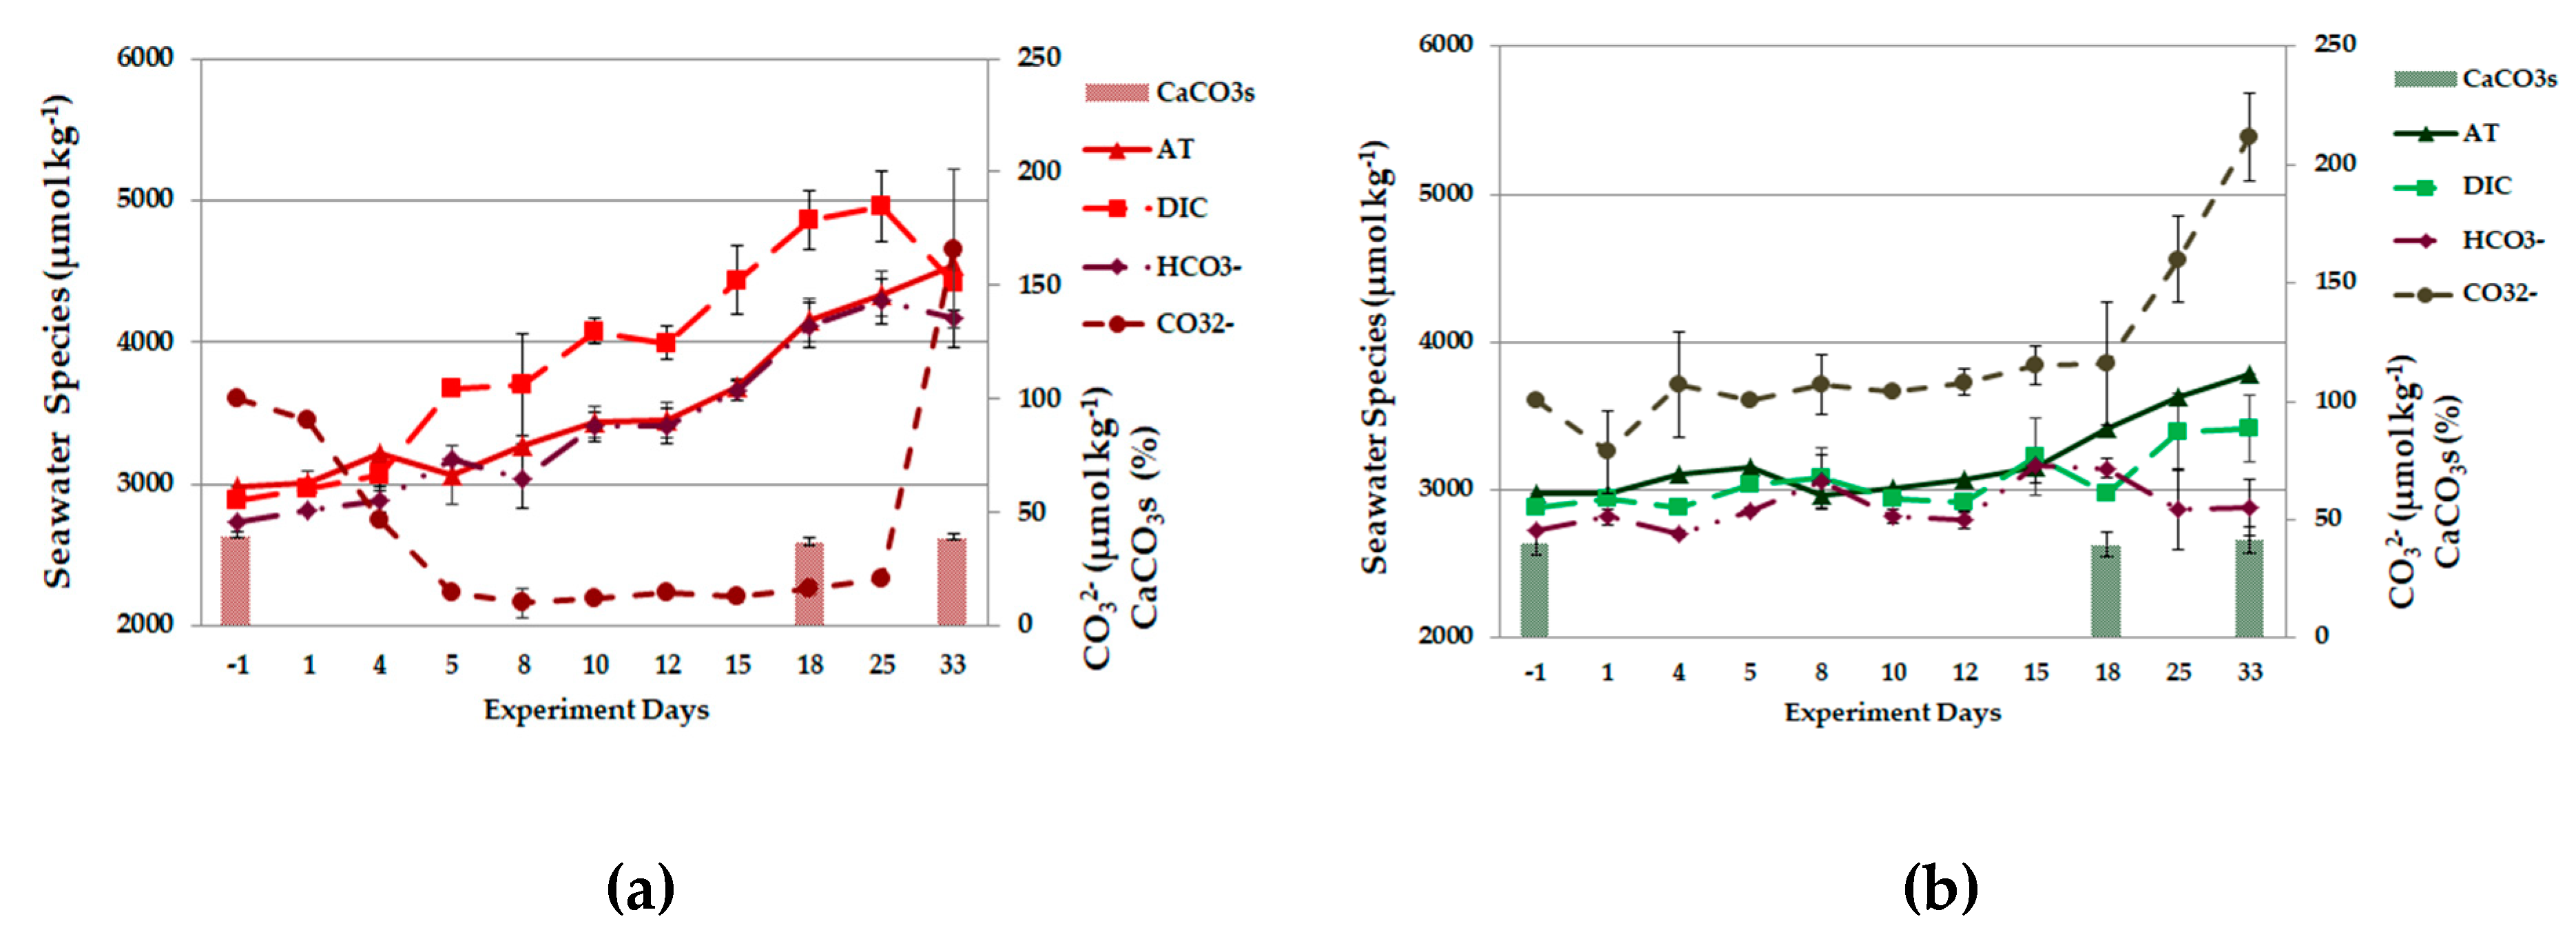
3.2.2. Experiment Observations

The contribution of phosphate and silicate concentrations in the computation of the carbonate parameters via the CO2SYS was checked. Their inclusion in the calculations did not alter significantly the computed carbonate system parameters neither for C or OA conditions (overestimation of about 0.01–0.5%) as was previously stated [28]. The results presented from now on include nutrients.
Total alkalinity increased after the 5th day, during OA conditions (Figure 7a), and remained constantly elevated compared to C conditions (Figure 7b); the reoxygenation led to increased final AT values for both conditions (F = 3.910, p = 0.066). Bicarbonates and DIC fluctuated slightly during C conditions (Figure 7b); during OA conditions they were found significantly higher throughout the experiment (F = 13.001, p = 0.002 and F = 21.139, p = 0.000 respectively; Figure 7a) while during the reoxygenation phase a decrease in both parameters was observed. Carbonates remained steady throughout the experiment until the 21st day in C conditions (Figure 7b); on the 21st day an increase was found that could be attributed to sediment sampling and turbation, which was amplified by the reoxygenation to final values of 231.2 μmol kg−1. In OA conditions, carbonates initially decreased from 46.4 to 14.8 μmol kg−1 and remained steady until the 25th day (Figure 7a); after the reoxygenation, carbonates increased dramatically to 165.9 μmol kg−1 (F = 11.097, p = 0.004). Aragonite and calcite saturation states also followed the same trend with carbonates in both conditions (Table 1; F = 11.097, p = 0.004 for both).

3.3. Nutrient Species and Carbon Analyses

3.3.1. Field Observations

Nitrate, nitrite (Figure 5a) and DOC (Figure 6) concentrations in Elefsis Bay were found at maximum in 20 m depth. In the bottom, ammonium (Figure 5a), phosphate and silicate (Figure 5b) were found significantly higher than in shallower depths along with elevated DON concentrations; on the contrary nitrate, nitrite and DOC concentrations, were found at minimum in maximum depth.

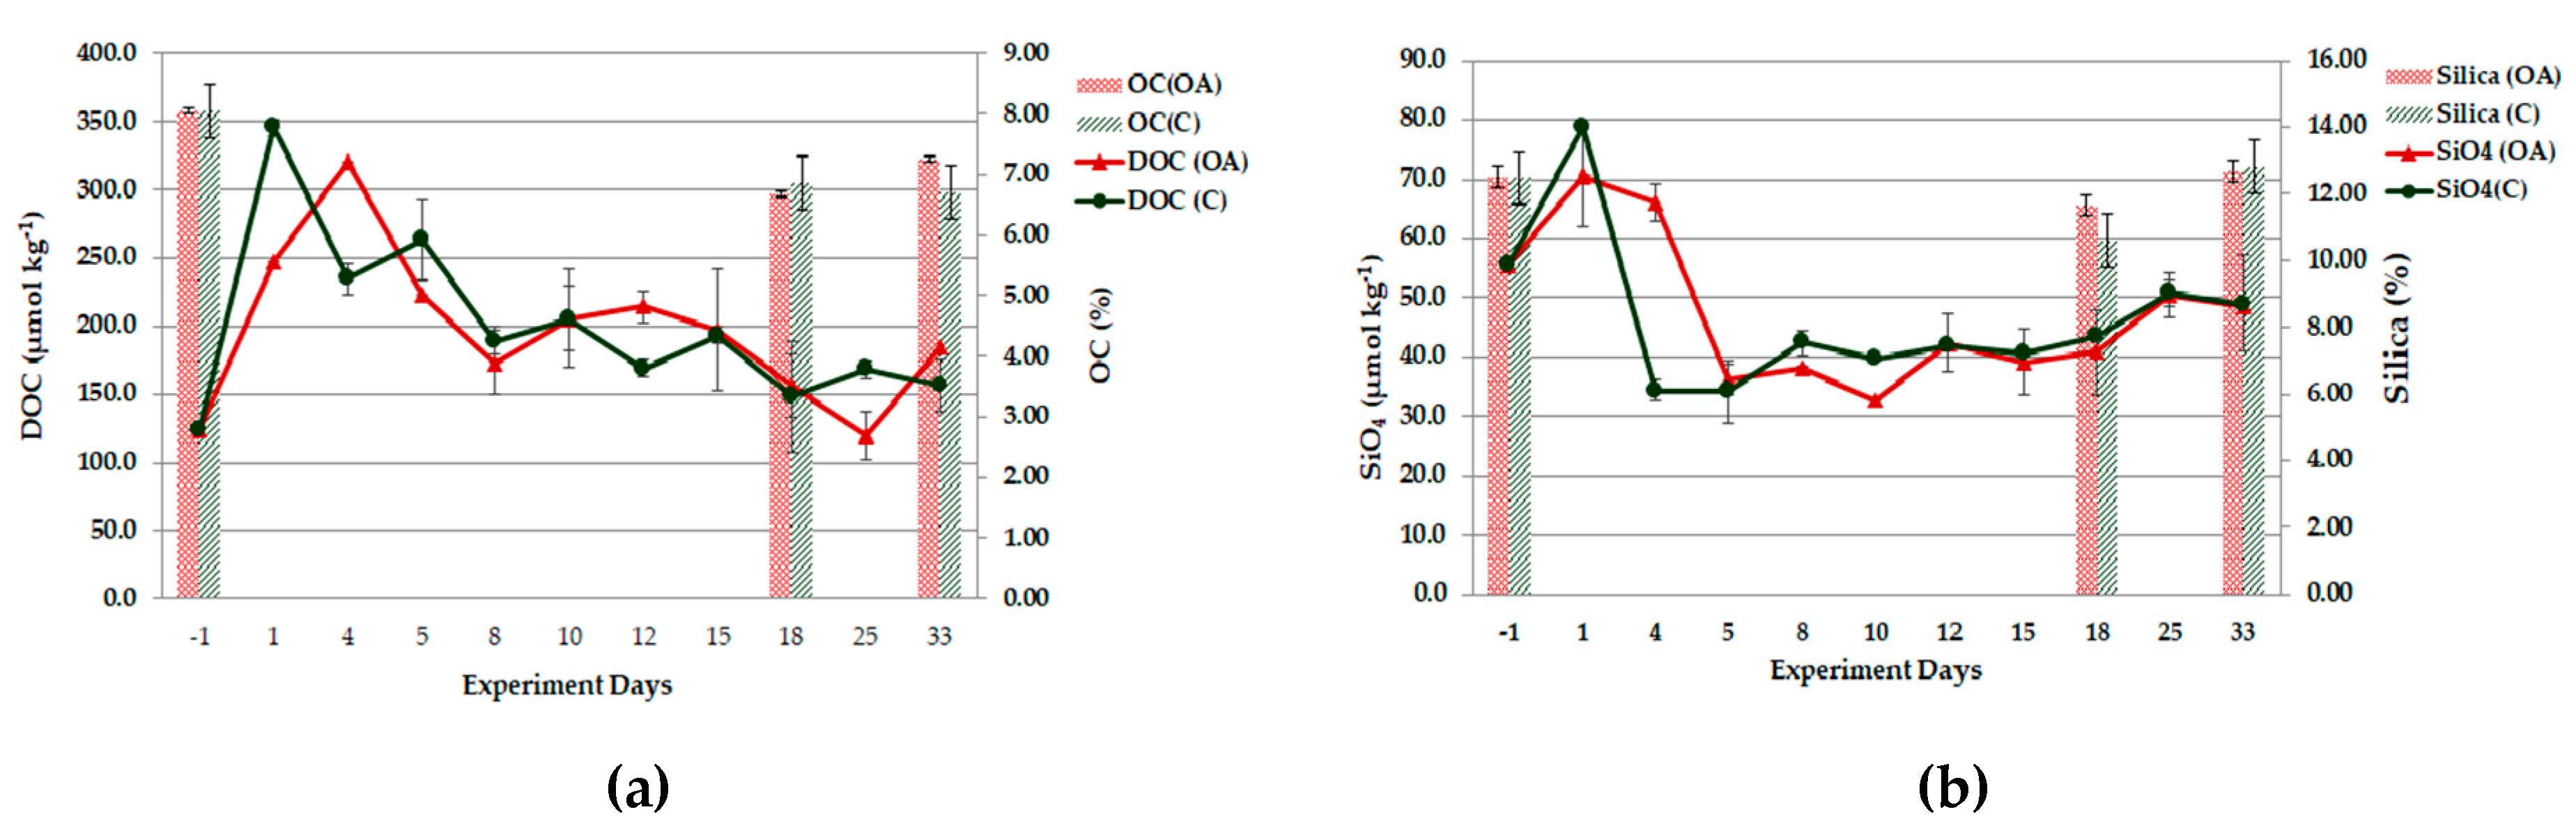
3.3.2. Experiment Observations

Nitrate during the experiment, showed similar trends in both treatments until the 21st day; subsequently, while in C condition (Figure 8a) they remained relatively stable, in OA condition they were found to increase significantly until the 33rd day (Figure 8b; F = 0.141, p = 0.712). Nitrite on the contrary, were found to increase in C condition until the 15th day and then they decreased to minimal values until the end of the experiment (Figure 8a); in OA condition, nitrite showed a steady increase throughout the experiment, especially after the reoxygenation (Figure 8b; F = 4.078, p = 0.061). Ammonium, in C treatment, declined throughout the experiment to minimum values (Figure 8a); in OA treatment, ammonium was found steady during the first 15 days while their concentrations declined in the end of the experiment (Figure 8b; F = 2.841, p = 0.111). DON in OA condition (Figure 8b) presented a significant increase until the 12th day and remained higher than C condition throughout the experiment (Figure 8a; F = 7.662, p = 0.014). Phosphate (Figure 9a,b) showed the same trend in both conditions, but with significantly elevated concentrations in OA condition (F=18.981, p = 0.000). DIN:DIP ratio (Figure 9c) decreased gradually in C condition while in OA condition it remained constant throughout the experiment (F = 0.823, p = 0.378). DOP and DOC (Figure 9 and Figure 10) also presented respective trends in both conditions, with slightly elevated final values for OA condition (F = 1.402, p = 0.254 and F = 1.423, p = 0.250 respectively). Silicate (Figure 10b) presented the same trend in both conditions as well (F = 0.126, p = 0.728).

3.4. Sediment Analyses

Sediment granulometry showed that the Elefsis Bay is characterized by fine surface sediments of < 63 μm, in a percentage between 95 and 100%. The main sediment minerals found were calcite (CaCO3) and quartz (SiO2), followed by aragonite (CaCO3) and cinochlore (Mg5Al)(AlSi3)O10(OH)8, sediment phases rich in carbonates and silica, along with aluminum and magnesium [28]. Elefsis Bay sedimentary carbonates were found 34.57% ± 0.95%. For C treatment, CaCO3 were 33.84% ± 1.26% and after the reoxygenation they were found 35.61% ± 1.26%. In OA treatment, during anoxia, carbonates were found 39.48% ± 2.60% while after reoxygenation they decreased to 35.80% ± 2.60% (all presented in Figure 7). The field OC content was 3.22% ± 0.15%; during both OA and C conditions, it was found similar (2.17% ± 0.26% and 2.28% ± 0.24% respectively) while after the systems reoxygenation, OC decreased to 1.89% ± 0.26% and 1.94% ± 0.24% respectively for the two conditions (Figure 10a). TN in the field was 0.39% ± 0.04%. In OA conditions TN content was 0.25% ± 0.03% and 0.18% ± 0.03% before and after the oxygenation respectively; in C conditions TN was 0.27% ± 0.03% and 0.31% ± 0.03% respectively (Figure 8) TP in the field was 0.05% ± 0.01%; in OA conditions, TP was found 0.08% ± 0.02% initially while after the reoxygenation it decreased to 0.05% ± 0.02%. In C conditions, TP was constant in 0.06% ± 0.01% (Figure 9).

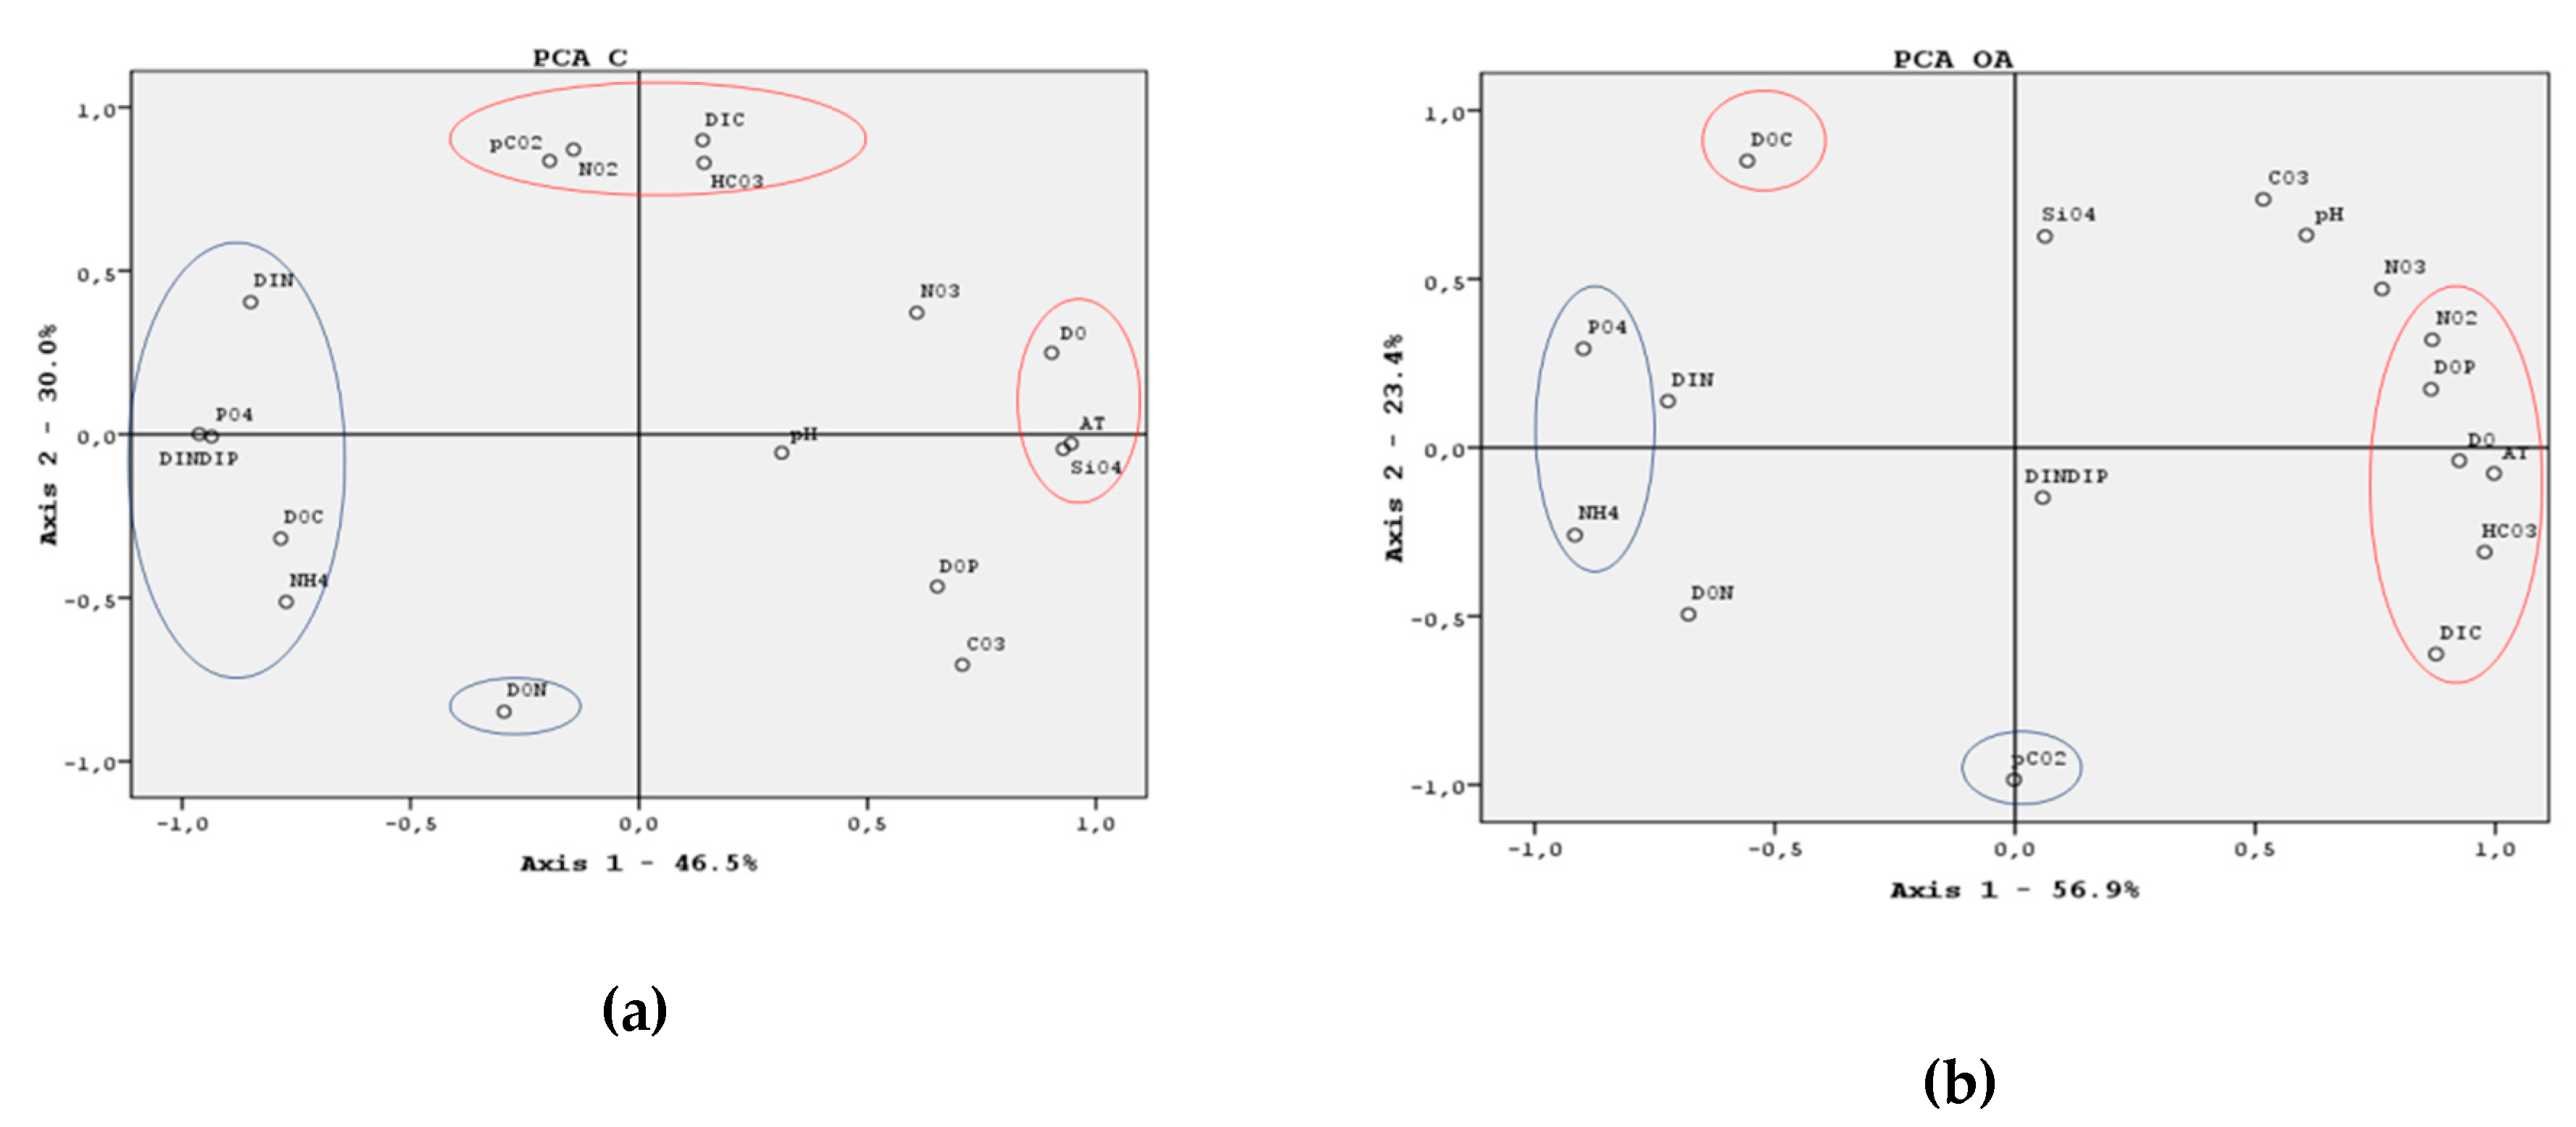
3.5. ANOVA Test and Principal Components Analysis (PCA)

The one-way ANOVA test for the evaluation of the statistical significance of variation between the two experimental conditions for seawater is shown in Table 2. For sediments the ANOVA test indicated no statistical significance for none of the parameters analyzed between the two conditions.
PCA analysis for C condition explained 76.6% of variation in the first two principal components, (Figure 11a). The first axis (PC1) explained 46.5% of total variance and was positively related to AT (0.95), SiO4 (0.93) and DO (0.90) and was negatively related to DIN:DIP (−0.96), PO43 (−0.94), DOC (−0.78) and NH4+ (−0.77). PC2 explained 30.0% of total variation and was positively correlated with DIC (0.90), NO2 (0.87), pCO2 (0.84) and HCO3 (0.83) and was negatively correlated with DON (−0.85).
PCA analysis for OA condition explained 80.4% of variation in the first two principal components (Figure 11b). The first axis (PC1) explained 56.9% of total variance and was positively related with AT (1.00), HCO3 (0.98), DO (0.93), DIC (0.88), NO2 (0.87) and DOP (0.87) and was negatively related to NH4+ (−0.92) and PO43 (−0.90). The second axis (PC2) explained 23.4% of total variance and was positively associated with DOC (0.85) and was negatively correlated with pCO2 (−0.99).

4. Discussion

This work follows and contributes additionally to a previous experimental set-up for the emerging effects of future projected acidification in addition to coastal hypoxia in the restricted marine system of Elefsis Bay [28]. This intermittent characteristic, prevailing in several coastal areas, has been shown to implicate major biogeochemical processes (e.g., nitrification, ammonium oxidation and inhibition of OM remineralization; [28]). This study was focused on the further oxygen depletion in the bottom waters of Elefsis Bay (typical during the summer period; [22]) known to trigger even more acidified conditions (e.g., [7]), and whether this process in addition to OA could favor an interchange in the habitual process sequence. This experimental simulation could highlight possible processes alterations, which might have been neglected until now for the better understanding and foresight of such special system future evaluations/perspectives.

4.1. Carbonate System and Related Processes

During sampling, complete depletion of oxygen (anoxia) was found (Figure 4b); however, during the experiment despite the controlled Ar gas supply for maintaining this condition, DO levels ranged between suboxic to severe hypoxic conditions for both treatments ([1,2]; Figure 5a). Due to the seawater oxygenation during transport and experimental set-up, complete absence of oxygen could not be reachieved despite the continuous Ar gas supply. After the cessation of the Ar gas supply during the last 7-days of the experiment duration, the systems were left to reoxygenate naturally through oxygen molecular diffusion, however DO did not reach normal oxidizing conditions remaining within the range of hypoxia. Full reoxygenation was not achieved possibly due to oxygen demand for the ongoing oxidative processes surpassing the oxygen supply through the air–water interface. It has been shown that high concentrations of DOM affect the interface properties inhibiting the gas transfer [39] retarding thus the complete oxygenation of the experimental tanks.
Elefsis Bay vertical distribution of bicarbonates and DIC appear similar (Figure 6), increasing below the pycnocline. Bicarbonates trend reinforces the hypothesis that apart from sedimentary carbonate dissolution, anaerobic processes (e.g., sulfate reduction, ammonium prevalence due to OM remineralization, etc.) produce significant amounts of HCO3 [28]. What was found here is that DIC and AT seem to associate with different processes; apart from bicarbonate production, which augment both parameters, sedimentary carbonate dissolution contributes more notably to AT than to DIC (by definition of AT; [40]) and possibly organic substances and nutrient species also significantly contribute (positively or negatively) in AT content.
Carbonates, in C condition, were only affected by sediment sampling, which was then augmented by system reoxygenation (Figure 7b); this suggests carbonate dissolution from sediments, which, however, was not depicted in decreased sedimentary carbonates. Total alkalinity and bicarbonates followed similar patterns (Figure 7b), with HCO3 being the main constituent of AT. Carbonates seem to contribute significantly in AT especially after reoxygenation. AT and DIC concentrations did not diverge; however, the processes affecting each of these parameters seem to be decoupled in this case (Figure 7b). This also became evident through PCA (Figure 11a); besides HCO3, substances originating from OM degradation and nutrient species transformations seem to strongly affect AT. Carbonate minerals saturation states (Ωar and Ωcal) followed the carbonate ions trend. Even for C condition in the absence of oxygen Ωar varies between 1.48 and 1.62 (Table 1), which is in close proximity to system undersaturation for the specific mineral; after reoxygenation, Ωar increased again suggesting that oxygen availability buffers increased acidity.
In OA condition, total alkalinity increased substantially comparing with C condition with no statistical difference, however, between the treatments (Figure 7a). The enhanced AT in more acidified conditions is normally attributed to carbonate minerals dissolution from sediment [41,42], which was not apparent in this case. This has been previously pointed out for Elefsis Bay [28]; Since sedimentary carbonate content reaches 40%, the respective AT increase (ΔAT = 1500 μmol kg−1) would account for <0.0001% w/w dissolution in sediment carbonates, a variation that cannot be detected regarding the methodological error of the particulate inorganic carbon determination. Additionally, AT increases to a lesser extent considering the previous experiment with hypoxic conditions (4500 μmol kg−1 and 5300 μmol kg−1 respectively; [28]); since AT can act as a negative feedback to elevated pCO2 [42,43,44,45,46], oxygen depletion seems to intercept this buffering mechanism. Bicarbonates also increase coinciding with DIC and alkalinity trend, suggesting that this is the decisive carbonate species contributing to both DIC and alkalinity budget (Figure 7a). Carbonates were significantly lower than in C condition; carbonate mineral saturation states followed carbonate trend as well (Figure 7a), with both Ωar and Ωcal calculated below 1.0 suggesting system undersaturation (Table 1). During reoxygenation, bicarbonates were slightly affected while DIC decreased 10%. Carbonates increased substantially 90%, suggesting sediment carbonate dissolution due to oxygen penetration alongside with Ωar and Ωcal increase well above 1.0, indicating that despite the high CO2 concentration, oxygen availability buffered acidification mechanisms to some point; AT also increased by 10% after reoxygenation possibly attributed to carbonate increase (Figure 7a). After the reoxygenation phase, rather stable bicarbonate ions content was preserved in both treatments; it is suggested that anaerobic processes trigger HCO3 production, which are maintained even when oxygen becomes available again. During anaerobic degradation, bicarbonates are released through several processes such as denitrification, manganese, iron and sulfate reduction producing both AT and DIC, [9,43,45,47], which has been also suggested previously for the same area under hypoxic conditions [28]. In this case, OM degradation products are released in both treatments, augmenting alkalinity, but in more acidified conditions these products are either solubilized more rapidly or become more stable, still maintained dissolved despite the DO increase.
PCA performed on the C treatment results (Figure 11a) revealed the oxygen unavailability impact on AT through anaerobic organic matter degradation products (PC1). As OM was consumed, ammonium, phosphate and silicate were produced and accumulated near the sediment–water interface with significantly higher concentrations than usual. The dissolved oxygen along with silicate concentration contributed positively to the system’s AT while inorganic N and P species contributed negatively to AT. Furthermore, coupled redox processes were revealed with organic nitrogen oxidation to inorganic forms on one side and reduction mechanisms producing significant amount of bicarbonates, which increased DIC on the other side (PC2). What was remarked here is that apart from bicarbonates that contribute to both AT and DIC, there was a decoupling in the processes designating AT and DIC; this was also evident through in situ AT and DIC vertical distribution, with DIC coinciding with HCO3 trend while in AT other substances/processes seemed to contribute additionally to its final content (e.g., organic constituents and nutrient species) below the pycnocline.
PCA performed in OA condition results (Figure 11b) showed the strong consistency of AT, DIC and bicarbonates with DO (PC1). In the absence of available oxygen, bicarbonate generation through reduction processes in addition to organic matter degradation are indicated, as was previously suggested [28]; denitrification, manganese, iron and sulfate reduction on the continental shelves all generate alkalinity despite the dissolution of CaCO3 [43]. It was also pointed out that apart from phosphate, dissolved organic carbon also contributed negatively to AT. Additionally, a strong coherence between dissolved organic content with pCO2 values was found, suggesting the continuous coupling of OM degradation with CO2 production despite the steep experimental CO2 addition (PC2).

4.2. Nutrients and Carbon—Evidence of Nitrification under Low DO

In C condition, nitrite increased throughout the first 15 days while ammonium oxidation was observed after the 5th day of the experiment. Organic N initially increased and began to decompose on the 12th day; after sediment sampling on the 18th day, DON increased while ammonium was maintained minimum (Figure 8a). Sediment irrigation seemed to trigger organic N release in the overlying water with parallel inhibition of the decomposition processes. Nitrite increased and was the main product up to the 15th day, with parallel nitrate increase, while ammonium constantly reduced indicating nitrification processes. After the 15th day both ammonium and nitrite are consumed, with nitrate being the main DIN form, finally. The reoxygenation phase, slightly affected nitrate and ammonium concentrations, while nitrite, DON (Figure 8a) and DIN:DIP ratio decreased (Figure 9c).
DON in the OA condition as well increased after sediment sampling up to the 12th day; this organic input, after degradation preserved an elevated ammonium budget. As the experiment continued, DON degraded to inorganic forms with significant ammonium decrease after the 15th day, and subsequent nitrate and nitrite release, with nitrate being the main final DIN product (Figure 8b); despite the considerable decrease, DON exceeded all DIN forms at the end of the experiment. TDN was inextricably coupled with DON in OA conditions, suggesting this was the main form featuring N availability in the system.
It has been demonstrated that under lower pH values (7–6.5), ammonium oxidation decreases significantly, up to 50–90% respectively [32,48,49]. This was found in consistency with the previous experiment, under hypoxic and acidified conditions, with ammonium accumulation instead of ammonium conversion to nitrite and nitrate [28]. During severe hypoxia here, acidified conditions correspond to pH values of 6.80 suggesting an expected decreased ratio of ammonium oxidation greater than 50% [32]. However, there is strong evidence here that more of a deceleration rather than a suppression mechanism of ammonia oxidation was observed, which utterly converted ammonium to nitrite and nitrate in turn, leading in nitrate being the final dominant inorganic N-species. In more acidified conditions, a nitrification mechanism was observed from the 15th day onwards despite the oxygen deficiency, as was pointed out for C conditions as well. N-enriched organic matter degraded leading in ammonium accumulation, which was then oxidized to nitrite and furthermore to nitrate (Figure 8a). It has been shown that in anoxic regions, the introduction of Mn-oxides from oxidized surface sediments result in anoxic nitrification, and net production of nitrate and nitrite [47]. Within organic and Mn-rich sediments where O2 is absent, NO3 can be produced during Mn-oxide reduction with the rate of anoxic nitrification being directly proportional to the quantity of Mn-oxide available. In Elefsis Bay, in the absence of O2, Mn(IV) mainly present as MnO2 in sediment is reduced to dissolved Mn(II) eluding from sediment to the overlying water [50]. Preliminary data from the specific study regarding trace metals [51] show that in Elefsis bottom water, Mn appeared elevated in soluble forms (4.27 μmol L−1), which in addition to the accumulation of NO3 and NO2 below 20 m depth could be an indication for anoxic nitrification process [47,52]; Mn significance in Elefsis’ water column biogeochemistry has been previously suggested [20], with its actual role not being fully assessed yet. This Mn behavior is also reinforced through PCA (Figure 11b) where redox processes coupled with organic nitrogen oxidation to inorganic forms seem to appear on one hand and reduction mechanisms (including denitrification, sulfate and Fe/Mn reduction) being indicated on the other hand.
Phosphate presented the same trend in both C (Figure 9b) and OA conditions (Figure 9a) but was found significantly higher in OA, being the dominant phase against organic P. In previous studies [28,49,53,54] and references within [55], no impact of CO2 enrichment on phosphate was suggested. In addition, under lower pH values, system reoxygenation slightly affected the PO43− concentrations, indicating restricted particular phase reprecipitation as it is normally expected. Dissolution of Fe-oxyhydroxides and associated phosphate is accomplished through the reduction of Fe(III) to Fe(II) and eventually Fe(II) eludes in soluble forms, with the parallel release of dissolved phosphate in the water column. When oxygen supply increases, dissolved Fe(II) oxidizes in Fe(III) and reprecipitates without incorporating the whole amount of phosphate within the newly formed Fe-oxides [24,56,57]. Here, it appears that in lower pH values in combination with the lack of oxygen, phosphate solubility is favored at all times against reprecipitation even when the water column is reoxygenated. DOP also presented similar trends in both conditions, with higher (but not statistically different) concentrations in the OA condition. For silicate, no significant acidification impact was observed as has it been previously reported [28,49,55]. DIN:DIP fluctuated between 10 and 2 in the C treatment, with minimum values at the end of the experiment after the reoxygenation while in the OA treatment (Figure 9c), the ratio was between 6 and 7 with negligible variations; in both cases N-limitation was maintained.
Sedimentary OC dropped by 28% in the C condition after the reoxygenation phase leading to a DOC increase of 58%; this could implicate the release of sedimentary organic compounds in the overlying water, which being in excess were accumulated and could not be decomposed (Figure 10). The respective sedimentary OC decrease in OA condition was 22% with a subsequent 49% increase in DOC suggesting that acidification had a lesser impact on the fate of OC and oxygen availability favored organic matter degradation/accumulation (Figure 10). Sediment TN decreased in both conditions in relation to field values but increased again in the C condition after reoxygenation (Figure 8a). In the OA condition a further decrease was observed after reoxygenation with final TN 50% lower than field values (Figure 8b). It has been previously found that in Elefsis Bay, nitrate and DO follow common distribution trends suggesting that oxygen concentration influences nitrogen flux through the sediments [58]. In this case, this behavior was possibly associated with DON release from the sediment rather than inorganic N forms in the water column.

4.3. Implications and Interchanges of Intermittent Hypoxia/Anoxia and Coastal Acidification

Elefsis surface pCO2 was calculated at 522 μatm and was approximately stable throughout the first 10 m; in 20 m depth, however, the pCO2 doubles, reaching values of 1538 μatm in the deepest part (Table 1). The surface values found here were already 100 ppm higher than the pCO2 values for the study period (399 μatm, September 2014; [59]); the deepest part was already acidified with values exceeding OA surface water predictions for the end of the century. The Elefsis Bay surface layer (down to 10 m) presented pH values similar to the midsummer values recorded at 4 m below sea surface in the adjacent Outer Saronikos Gulf over the period September 2013–October 2014 [60]; Elefsis bottom, however, was found already acidified (7.75) in relation to surface values (8.16; Figure 3). As was mentioned previously, Elefsis Bay has been subjected to a pH decline since the late 70s, with bottom values of 7.5–7.9 [22,27] even under hypoxic conditions. In Elefsis Bay, the pycnocline is an intermittent feature (see Introduction), which after collapse could enrich shallower depths with CO2 originating from bottom waters. Elefsis Bay is the waterfront of the Thriassion plain that has been a heavily industrialized, urban area for several decades [61]. In consequence, high CO2 air produced by anthropogenic activities near the coast can be advected via atmospheric circulation over the surface of Elefsis Bay and therefore increase the flux of CO2 into surface waters. Indeed, nearshore areas with significant CO2 emissions from land based sources have been found to impact a territory of 100 km from the coast with contribution to air-sea fluxes causing an increase of about 20%, despite the habitual oceanographic processes [62]. Τhe pCO2 value of 1538.4 μatm of Elefsis bottom is typical for coastal hypoxic regions [7,8,9,10], with future projections of combined acidification effects with hypoxia appearing to follow a non-linear pattern [9]. Additionally, oceanic anoxic zones are expected to encounter acidification-enhanced pCO2 with transit times varying between decades to a century depending on the time needed for the CO2-enriched surface waters to arrive in the bottom anoxic zone. Regarding coastal areas with seasonal hypoxia, this time delay varies between months to 1 year [9]. Ocean acidification in a bottom to surface direction could also impact food webs and carbon cycling involving various pH-dependent nutrients and metals’ species, thus altering species composition and primary productivity processes [48]. Water circulation or sea surface–atmosphere gas exchange appears to be considerably less important than primary productivity cycles, however, apart from the bottom to surface acidification due to OM degradation, increased atmospheric CO2 over Elefsis Bay could already be increasing surface water pCO2 penetrating towards deeper waters to a lesser extent but acting cumulatively with unknown future perspectives.
Total alkalinity in Elefsis Bay was also found higher than earlier in the same year (between 2974–2990 μmol kg−1 and 2769 μmol kg−1 respectively; [28]); the maximum AT value was identified at 10 m depth (Figure 6) coinciding with the maximum values of DOC (Figure 6) and DOP (Figure 4b). A seasonal variability of AT has been also found in the coastal Levantine Sea (2595 μmol kg−1 in winter and 2617 μmol kg−1 in autumn [63]), which is related to salinity variations. In any case, AT is widely considered as a conservative seawater property and when biological activity is omitted, the variations of this parameter should be directly related to salinity changes when dilution or evaporation occurs in the ocean [64]. In Elefsis Bay, temperature and salinity in the upper 15 m of the water column increase fast in summer due to atmospheric heating and evaporation [20], which can justify the higher AT values of this period. In general, Elefsis Bay AT values were found higher than other Mediterranean coastal areas [3,7,61,63] although all of them receive freshwater discharges of rivers and streams crossing watersheds composed mainly of carbonate rocks resulting in significant alkalinity inputs. Elefsis Bay receives surface runoff originating from the surrounding calcareous mountains [61] and its AT is higher even from the adjacent Saronikos Gulf [65]. Additionally, it has been pointed out for areas with restricted mixing and/or characterized by significant inputs of DOM from land that organic bases contribute remarkably in AT [66,67]. Elefsis Bay also poses such a system and its higher AT could also be attributed in its high organic load. As a result Elefsis Bay is definitely prone to absorb higher atmospheric CO2 quantities in relation to adjacent areas of Mediterranean, being even more sensitive regarding carbonate system variables.
In Elefsis Bay, Ωar was calculated 4.80 in the surface while in the bottom it decreased dramatically to 1.51 (Table 1); previous studies for a coastal site in the Ligurian Sea (Western Mediterranean; [68]) show that during 1967−2003, the estimated Ωar ranged between 4.3 in 1968 and 3.1 in 2003. Even if carbonate saturation states are mostly well above 1 throughout the year, a seasonal significant decrease related with dissolved oxygen availability could already impact calcareous organisms, which require Ω values much higher than 1 [7], with unpredictable alterations for the specific ecosystem.
Under low oxygen conditions, in Elefsis Bay, denitrification normally occurs near the sediment–water interface [20] removing most of the nitrate; the ammonium, phosphate and silicate accumulate due to organic matter oxidation followed by MnO2 reduction. Trace metal analyses from the specific study [51] show that total dissolvable Mn (dissolved and particulate Mn) varies between 2.7 and 3.1 μg L−1 in the first 10 m and increased to 234.7 μg L−1 near the bottom. Such findings are not uncommon, with previous reports of elevated dissolved (112 μg L−1) and particulate Mn (171 μg L−1) during anoxic periods [20]. In combination with the findings in [47], suggesting Mn induced anoxic nitrification, the available Mn in dissolved forms could be responsible for triggering nitrification phenomena under anoxic conditions. It is likely that a complex biogeochemical coupling of all nitrogen, sulfur, carbon, oxygen and manganese is established rather than a simple redox reaction succession in Elefsis water column and surface sediments.
In addition when oxygen concentration diminishes in Elefsis Bay, phosphate dissolution occurs from sediments to pore waters from host Fe-oxyhydroxides; then, phosphate escapes via diffusional transport, resuspension or irrigation by benthos [20] becoming available in dissolved forms. In this study, in more acidified conditions, the sediment irrigation and reoxygenation did not cause phosphate reprecipitation, maintaining a high P content in the system. As a consequence, an invariable DIN:DIP ratio around 7 was observed during OA conditions (Figure 9c), significantly lower than earlier in the same year (the ratio varied between 10 and 30; [28]). DIN:DIP usually varied between 13 (surface) and 4 (bottom) during stratified periods [20], leading in near-bottom N-deficit. Under lower pH values, it seems that N was not depleted as usual but a constant N-budget was obtained with also unpredictable pathways for the system’s biology.

5. Conclusions

This study was closely associated with previous work concerning the area of Elefsis Bay [28] under hypoxic conditions coming after a previous preliminary experiment on the specific area [24]. Following those primary findings, the present work focused on the different alterations that severe hypoxia could implicate in the already high CO2 Elefsis bottom. In coastal areas similar to the Elefsis Bay, characterized by certain hydrometeorological conditions and anthropogenic activities, more acidified conditions have already been pointed out. These acidification phenomena originating from the aforementioned specific characteristics are already of high scale, implementing as an additive or a negative feedback to OA resulting from atmospheric inputs. The last decades, OA has become an environmental challenge of great significance especially for coastal oceans; for this reason, the Elefsis Bay could present a great natural example and first indication of possible alterations due to synergistic effects of oxygen depletion and future expected OA.
Organic matter elevated input with its subsequent degradation in combination with the very stable seasonal temperature-driven pycnocline, increases the CO2 concentration at the sediment–water interface and results in high pCO2 values similar to those predicted for the surface ocean for the end of the 21st century. This intermittent phenomenon has been well investigated for the past 40 years; when the pycnocline gradually breaks, the bottom enriched CO2 waters gradually reach shallower depths. Furthermore, Elefsis surface water pCO2 was already found elevated and the mixing of these “acidic” waters in combination with the restricted circulation could obstruct CO2 reinstatement to normal values for the entire water column. A two-direction acidification mechanism might already be present; a bottom to surface acidification due to OM degradation and a surface to bottom acidification related to the increased atmospheric CO2 in Elefsis Bay marine air that promotes the supply of CO2 enriched surface water towards the deeper parts of the bay. The latter might affect the area to a lesser extent but act with cumulative impacts and unknown future perspectives. Since these findings have never been included in long term observations or correlated with nutrient or biological indicators before, a significant factor may have been excluded until now for the Elefsis Bay evaluation.
Total alkalinity in the Elefsis Bay was found to be affected by organic matter constituents such as DOC and organic phosphorus. A total alkalinity increase under lower pH was limited (relatively to hypoxic and more acidified conditions previously studied in [28]) with bicarbonates being the dominant constituent; only after the reoxygenation of the waters, carbonates significantly contributed to its final concentration, thus suggesting that OM degradation and related processes were the main factors affecting AT. Despite that none of the carbonate minerals saturation states were calculated below 1.0, the significant decline calculated from surface to bottom and the intermittent variation in Ω-values could be significant as it concerns calcifying organisms.
In more acidified conditions, ammonium oxidation is not prevented but was achieved with deceleration. It was also indicated that a nitrification mechanism prevailed despite the absence of oxygen, which could possibly be attributed to the high dissolved Mn found in the anoxic bottom water; these observations come in contrast with previous findings under hypoxic conditions, where an interception of ammonium oxidation along with a decline in nitrification process were indicated [28].
Simulated acidification in the Elefsis Bay suggest a significant increase in phosphate concentrations tightly linked to the switch between oxic formation and reductive dissolution of enriched with phosphate Fe(III) oxyhydroxides, depending on the DO availability. After the reoxygenation of the system, phosphate do not quantitatively coprecipitate with the newly formed Fe(III) oxides maintaining both high dissolved phosphate and a constant decreased DIN:DIP ratio in the water column (considering respective DIN:DIP values in hypoxic conditions [28]). Release of phosphate through this process in the shallow Elefsis Bay may enhance phosphate availability stimulating consequently primary production and creating a positive feedback loop that may exacerbate anoxic and “acidified” conditions on both short and long time scales.

Author Contributions

Methodology, E.S.; Writing—original draft, N.K.; Writing—review and editing, E.K., M.D. and M.S. Authorship must be limited to those who have contributed substantially to the work reported. All authors have read and agreed to the published version of the manuscript.

Funding

Part of this research was funded by the EU Research Project “ARISTEIA- EXCELLENCE 640” (2012–2015) entitled “Integrated Study of Trace Metals Biogeochemistry in the Coastal Marine Environment (ISMETCOMAREN)”. Part of this project is implemented under the Operational Program “Education and Lifelong Learning” and funded by European Social Fund and national resources.

Acknowledgments

The authors wish to thank HCMR for providing its facilities and hosting the experimental set-up. The authors also thank the GIS Lab of HCMR for preparing the manuscript map. The support and assistance of the officers and crew of the R/V Aegaeo during sampling is highly appreciated.

Conflicts of Interest

The authors declare no conflict of interest. The funders had no role in the design of the study; in the collection, analyses, or interpretation of data; in the writing of the manuscript, or in the decision to publish the results.

References

  1. Diaz, R.; Rosenberg, R. Spreading Dead Zones and Consequences for Marine Ecosystems. Science 2008, 321, 926–929. [Google Scholar] [CrossRef] [PubMed]
  2. Hofmann, A.; Peltzer, E.; Walz, P.; Brewer, P. Hypoxia by degrees:Establishing definitions for a changing ocean. Deep Sea Res. Part I Oceanogr. Res. Pap. 2011, 58, 1212–1226. [Google Scholar] [CrossRef]
  3. Ingrosso, G.; Giani, M.; Cibic, T.; Karuza, A.; Krajl, M.; Del Negro, P. Carbonate chemistry dynamics and biological processes along a river–sea gradient (Gulf of Trieste, northern Adriatic Sea). J. Mar. Syst. 2016, 155, 35–49. [Google Scholar] [CrossRef]
  4. Liu, J.; Weinbauer, M.G.; Maier, C.; Dai, M.; Gattuso, J.-P. Effect of ocean acidification on microbial diversity and on microbe-driven biogeoschemistry and ecosystem functioning. Aquat. Microb. Ecol. 2010, 61, 291–305. [Google Scholar] [CrossRef]
  5. Chan, F.; Boehm, A.B.; Barth, J.A.; Chornesky, E.A.; Dickson, A.G.; Feely, R.A.; Hales, B.; Hill, T.M.; Hofmann, G.; Ianson, D.; et al. The West Coast Ocean Acidification and Hypoxia Science Panel: Major Findings, Recommendations, and Actions; California Ocean Science Trust: Oakland, CA, USA, 2016; p. 40. [Google Scholar]
  6. Justic, D.; Rabalais, N.N.; Turner, R.E. Effects of climate change on hypoxia in coastal waters: A doubled CO2 scenario for the northern Gulf of Mexico. Limnol. Oceanogr. 1996, 41, 992–1003. [Google Scholar] [CrossRef]
  7. Cantoni, C.; Luchetta, A.; Celio, M.; Cozzi, S.; Raicich, F. Carbonate system variability in the Gulf of Trieste (North Adriatic Sea). Estuar. Coast. Shelf Sci. 2012, 115, 51–62. [Google Scholar] [CrossRef]
  8. Gobler, C.J.; DePasquale, E.L.; Griffith, A.W.; Baumann, H. Hypoxia and Acidification Have Additive and Synergistic Negative Effects on the Growth, Survival, and Metamorphosis of Early Life Stage Bivalves. PLoS ONE 2014, 9, e83648. [Google Scholar] [CrossRef] [Green Version]
  9. Melzner, F.; Thomsen, J.; Koeve, W.; Oschlies, A.; Gutowska, M.A.; Bange, H.W.; Hansen, H.P.; Kortzinger, A. Future ocean acidification will be amplified by hypoxia in coastal habitats. Mar. Biol. 2013, 160, 1875–1888. [Google Scholar] [CrossRef]
  10. Wallace, R.B.; Baumann, H.; Grear, J.S.; Aller, R.C.; Gobler, C.J. Coastal ocean acidification: The other eutrophication problem. Estuar. Coast. Shelf Sci. 2014, 148, 1–13. [Google Scholar] [CrossRef]
  11. Hofmann, G.E.; Smith, J.E.; Johnson, K.S.; Send, U.; Levin, L.A.; Micheli, F.; Paytan, A.; Price, N.N.; Peterson, B.; Takeshita, Y.; et al. High frequency dynamics of ocean pH: A multi-ecosystem comparison. PLoS ONE 2011, 6, e28983. [Google Scholar] [CrossRef] [Green Version]
  12. Waldbusser, G.G.; Salisbury, J.E. Ocean Acidification in the Coastal Zone from an Organism’s Perspective: Multiple System Parameters, Frequency Domains, and Habitats. Annu. Rev. Mar. Sci. 2014, 6, 221–247. [Google Scholar] [CrossRef] [PubMed]
  13. Duarte, C.M.; Hendriks, I.E.; Moore, T.S.; Olsen, Y.S.; Steckbauer, A.; Ramajo, L.; Carstensen, J.; Trotter, J.A.; McCulloch, M. Is Ocean Acidification an Open-Ocean Syndrome? Understanding Anthropogenic Impacts on Seawater pH. Estuaries Coast. 2013, 36, 221–236. [Google Scholar] [CrossRef] [Green Version]
  14. Kapsenberg, L.; Alliouane, S.; Gazeau, F.; Mousseau, L.; Gattuso, J.-P. Coastal ocean acidification and increasing total alkalinity in the northwestern Mediterranean Sea. Ocean Sci. 2017, 13, 411–426. [Google Scholar] [CrossRef] [Green Version]
  15. Cai, W.; Hu, X.; Huang, W.; Murrel, M.; Lehrter, J.; Lohrenz, S.; Chou, W.; Zhai, W.; Hollibaugh, J.; Wang, Y.; et al. Acidification of subsurface coastal waters enhanced by eutrophication. Nat. Geosci. 2011, 4, 766–770. [Google Scholar] [CrossRef]
  16. Carstensen, J.; Duarte, C.M. Drivers of pH Variability in Coastal Ecosystems. Environ. Sci. Technol. 2019, 53, 4020–4029. [Google Scholar] [CrossRef]
  17. Provoost, P.; Van Heuven, S.; Soetaert, K.; Laane, R.W.P.M.; Middelburg, J.J. Seasonal and long-term changes in pH in the Dutch coastal zone. Biogeosciences 2010, 7, 3869–3878. [Google Scholar] [CrossRef] [Green Version]
  18. Borges, A.V.; Gypens, N. Carbonate chemistry in the coastal zone responds more strongly to eutrophication than to ocean acidification. Limnol. Oceanogr. 2010, 55, 346–353. [Google Scholar] [CrossRef] [Green Version]
  19. Paraskevopoulou, V.; Zeri, C.; Kaberi, H.; Chalkiadaki, O.; Krasakopoulou, E.; Dassenakis, M.; Scoullos, M. Trace metal variability, background levels and pollution status assessment in line with the water framework and Marine Strategy Framework EU Directives in the waters of a heavily impacted Mediterranean Gulf. Mar. Pollut. Bull. 2014, 87, 323–337. [Google Scholar] [CrossRef]
  20. Pavlidou, A.; Kontoyiannis, H.; Anagnostou, C.; Siokou-Frangou, I.; Pagou, K.; Krasakopoulou, E.; Assimakopoulou, G.; Zervoudaki, S.; Zeri, C.; Chatzianestis, J.; et al. Biogeochemical Characteristics in the Elefsis Bay (Aegean Sea, Eastern Mediterranean) in Relation to Anoxia and Climate Changes. In Chemical Structure of Pelagic Redox Interfaces. The Handbook of Environmental Chemistry; Yakushev, E., Ed.; Springer: Berlin/Heidelberg, Germany, 2013; Volume 22, pp. 161–201. [Google Scholar] [CrossRef]
  21. Ignatiades, L. Scaling the trophic status of the Aegean Sea, eastern Mediterranean. J. Sea Res. 2005, 54, 51–57. [Google Scholar] [CrossRef]
  22. Scoullos, M.; Rilley, J. Water circulation in the Gulf of Elefsis, Greece. Thalassia Jugosl. 1978, 14, 357–370. [Google Scholar]
  23. Scoullos, M. Chemical Studies of the Gulf of Elefsis, Greece. Ph.D. Thesis, Depterment of Oceanography, University of Liverpool, Liverpool, UK, 1979; p. 328. [Google Scholar]
  24. Scoullos, M.; Zeri, C.; Dassenakis, M.; Tsamaki, E. Experiments on the reversibility of transfer—Deposition processes of metal under intermittently anoxic conditions. Rapp. Comm. Int. Mer. Medit. 1986, 30, 122. [Google Scholar]
  25. Primpas, I.; Tsirtsis, G.; Karydis, M.; Kokkoris, G.D. Principal component analysis: Development of a multivariate index for assessing eutrophication according to the European water framework directive. Ecol. Indic. 2010, 10, 178–183. [Google Scholar] [CrossRef]
  26. Pavlidou, A.; Pagou, K.; Assimakopoulou, G.; Rousselaki, E. Evolution over the last 30 years of the trophic conditions in the Gulf of Elefsis. In Sustainable Mediterranean, Issue No 71. In Proceedings of the International Conference: Environmental Perspectives of the Gulf of Elefsis, A Mediterranean Case Study Where Science Meets the Society, Elefsis, Greece, 11–12 September 2015; pp. 20–22. [Google Scholar]
  27. Friligos, N. Some consequences of the decomposition of organic matter in the Elefsis bay, an anoxic basin. Mar. Pollut. Bull. 1982, 13, 103–106. [Google Scholar] [CrossRef]
  28. Kapetanaki, N.; Krasakopoulou, E.; Stathopoulou, E.; Pavlidou, A.; Zervoudaki, S.; Dassenakis, M.; Scoullos, M. Simulation of Coastal Processes affecting pH with Impacts on Carbon and Nutrient Biogeochemistry. Mediterr. Mar. Sci. 2018, 19, 290–304. [Google Scholar] [CrossRef] [Green Version]
  29. Dickson, A.G.; Sabine, C.L.; Christian, J.R. (Eds.) Guide to Best Practices for Ocean CO2 Measurements; PICES Special Publication 3: Darby, PA, USA, 2007; p. 191. [Google Scholar]
  30. Caldeira, K.; Wickett, M. Ocean Model predictions of chemistry changes from carbon dioxide emissions to the atmosphere and ocean. J. Geophys. Res. Oceans 2005, 110, 1–12. [Google Scholar] [CrossRef] [Green Version]
  31. Pierrot, D.; Lewis, E.; Wallace, D.W.R. MS Excel Program Developed for CO2 System Calculations. ORNL/CDIAC-105a. In Carbon Dioxide Information Analysis Center, Oak Ridge National Laboratory; U.S. Department of Energy: Oak Ridge, TN, USA, 2006. [Google Scholar] [CrossRef]
  32. Beman, M.J.; Chow, C.-E.; King, A.L.; Feng, Y.; Fuhrman, J.A.; Andersson, A.; Bates, N.R.; Popp, B.N.; Hutchins, D.A. Global declines in oceanic nitrification rates as a consequence of ocean acidification. Proc. Natl. Acad. Sci. USA 2011, 108, 208–213. [Google Scholar] [CrossRef] [Green Version]
  33. Lueker, T.J.; Dickson, A.G.; Keeling, C.D. Ocean pCO2 calculated from dissolved inorganic carbon, alkalinity, and equations for K1 and K2: Validation based on laboratory measurements of CO2 in gas and seawater at equilibrium. Mar. Chem. 2000, 70, 105–119. [Google Scholar] [CrossRef]
  34. Perez, F.F.; Fraga, F. Association constant of fluoride and hydrogen ions in seawater. Mar. Chem. 1987, 21, 161–168. [Google Scholar] [CrossRef]
  35. Dickson, A.G. Standard potential of the reaction: AgCI(s) + 1/2H2(g) = Ag(s) + HCI(aq), and the standard acidity constant of the ion HSO4 in synthetic sea water from 273.15 to 318.15 K. J. Chem. Thermodyn. 1990, 22, 113–127. [Google Scholar] [CrossRef]
  36. Lee, K.; Tae-Wook, K.; Byrne, R.H.; Millero, F.J.; Feely, R.A.; Liu, Y.-M. The universal ratio of the boron to chlorinity for the North Pacific and North Atlantic oceans. Geochim. Cosmochim. Acta 2010, 74, 1801–1811. [Google Scholar] [CrossRef]
  37. Karageorgis, A.P.; Katsanevakis, S.; Kaberi, H. Use of enrichment factors for the assessment of heavy metal contamination in the sediments of Koumoundourou Lake, Greece. Water Air Soil Pollut. 2009, 204, 243–258. [Google Scholar] [CrossRef]
  38. Riebesell, U.; Fabry, V.J.; Hansson, L.; Gattuso, J.-P. Guide to Best Practices for Ocean Acidification Research and Data Reporting; Publications Office of the European Union: Luxembourg, 2010; p. 259. [Google Scholar]
  39. Frew, N.M. The role of organic films in air-sea gas exchange. In The Sea Surface and Global Change; Liss, P.S., Duce, R.A., Eds.; Cambridge University Press: Cambridge, UK, 1997; pp. 121–172. [Google Scholar]
  40. Dickson, A.G. An exact definition of total alkalinity and a procedure for the estimation of alkalinity and total inorganic carbon from titration data. Deep Sea Res. Part A Oceanogr. Res. Pap. 1981, 28, 609–623. [Google Scholar] [CrossRef]
  41. Andersson, A.J.; Bates, N.R.; Mackenzie, F.T. Dissolution of Carbonate Sediments under Rising pCO2 and Ocean Acidification: Observations from Devil’s Hole, Bermuda. Aquat. Geochem. 2007, 13, 237–264. [Google Scholar] [CrossRef]
  42. Krumins, V.; Gehlen, M.; Arndt, S.; Van Cappellen, P.; Regnier, P. Dissolved inorganic carbon and alkalinity fluxes from coastal marine sediments: Model estimates for different shelf environments and sensitivity to global change. Biogeosciences 2013, 10, 371–398. [Google Scholar] [CrossRef] [Green Version]
  43. Chen, C.-T.A. Shelf-vs. dissolution-generated alkalinity above the chemical lysocline. Deep Sea Res. Part II Top. Stud. Oceanogr. 2002, 49, 5365–5375. [Google Scholar] [CrossRef]
  44. Chen, C.-T.A.; Liu, K.K.; Macdonald, R. Continental Margin Exchanges. In Ocean Biogeochemistry. Global Change—The IGBP Series; Fasham, M.J.R., Ed.; Springer: Berlin/Heidelberg, Germany, 2003; pp. 53–97. [Google Scholar] [CrossRef]
  45. Thomas, H.; Schiettecatte, L.-S.; Suykens, K.; Kone, Y.J.M.; Shadwick, E.H.; Prowe, A.E.E.; Bozec, Y.; de Baar, H.J.W.; Borges, A.V. Enhanced ocean carbon storage from anaerobic alkalinity generation in coastal sediments. Biogeosciences 2009, 6, 267–274. [Google Scholar] [CrossRef] [Green Version]
  46. Hu, X.; Cai, W.J. An assessment of ocean margin anaerobic processes on oceanic alkalinity budget. Glob. Biogeochem. Cycles 2011, 25, GB3003. [Google Scholar] [CrossRef]
  47. Hulth, S.; Aller, R.C.; Gilbert, F. Coupled anoxic nitrification/manganese reduction in marine sediments. Geochim. Cosmochim. Acta 1999, 63, 49–66. [Google Scholar] [CrossRef] [Green Version]
  48. Huesemann, M.H.; Skillman, A.D.; Crecelius, E.A. The inhibition of marine nitrification by ocean disposal of carbon dioxide. Mar. Pollut. Bull. 2002, 44, 142–148. [Google Scholar] [CrossRef]
  49. Widdicombe, S.; Dashfield, S.L.; McNeil, C.L.; Needham, H.R.; Beesly, A.; McEvoy, A.; Oxnevad, S.; Clarke, K.R.; Berge, J.A. Effects of CO2 induced seawater acidification on infaunal diversity and sediment nutrient fluxes. Mar. Ecol. Prog. Ser. 2009, 379, 59–75. [Google Scholar] [CrossRef] [Green Version]
  50. Scoullos, M. Trace Metals in a landlocked intermittently anoxic basin. In Trace Metals in Sea Water; Wong, C.S., Boyle, E., Bruland, K.W., Burton, J.D., Goldberg, E.D., Eds.; Plenum Press: New York, NY, USA, 1983; pp. 351–366. [Google Scholar]
  51. Kapetanaki, N.; Stathopoulou, E.; Karavoltsos, S.; Katsouras, G.; Krasakopoulou, E.; Dassenakis, E.; Scoullos, M. Biogeochemical processes under anoxic conditions affecting Arsenic (As) distribution in Elefsis Gulf: Possible alterations due to simulated ocean acidification conditions—A preliminary assessment. In Sustainable Mediterranean, Issue No 71. In Proceedings of the International Conference: Environmental Perspectives of the Gulf of Elefsis, A Mediterranean Case Study Where SCIENCE Meets the Society, Elefsis, Greece, 11–12 September 2015; pp. 74–78. [Google Scholar]
  52. Bartlett, R.; Mortimer, R.J.G.; Morris, K. Anoxic nitrification: Evidence from Humber Estuary sediments (UK). Chem. Geol. 2008, 250, 29–39. [Google Scholar] [CrossRef]
  53. Louis, J.; Guieu, C.; Gazeau, F. Nutrient dynamics under different ocean acidification scenarios in a low nutrient low chlorophyll system: The Northwestern Mediterranean Sea. Estuar. Coast. Shelf Sci. 2016, 186, 30–44. [Google Scholar] [CrossRef] [Green Version]
  54. Hutchins, D.A.; Mulholland, M.R.; Fu, F. Nutrient Cycles and Marine Microbes in a CO₂-Enriched Ocean. Oceanography 2009, 22, 128–145. [Google Scholar] [CrossRef] [Green Version]
  55. Tanaka, T.; Thingstad, T.F.; Løvdal, T.; Grossart, H.-P.; Larsen, A.; Allgaier, M.; Meyerhöfer, M.; Schulz, K.G.; Wohlers, J.; Zöllner, E.; et al. Availability of phosphate for phytoplankton and bacteria and of glucose for bacteria at different pCO2 levels in a mesocosm study. Biogeosciences 2008, 5, 669–678. [Google Scholar] [CrossRef] [Green Version]
  56. Gunnars, A.; Blomqvist, S.; Johansson, P.; Andersson, C. Formation of Fe(III) oxyhydroxide colloids in freshwater and brackish seawater, with incorporation of phosphate and calcium. Geochim. Cosmochim. Acta 2002, 66, 745–758. [Google Scholar] [CrossRef]
  57. Skoog, A.C.; Arias-Esquivel, V.A. The effect of induced anoxia and reoxygenation on benthic fluxes of organic carbon, phosphate, iron, and manganese. Sci. Total Environ. 2009, 407, 6085–6092. [Google Scholar] [CrossRef]
  58. Rousselaki, E.; Pavlidou, A.; Michalopoulos, P.; Dassenakis, M.; Scoullos, M. Nutrient benthic fluxes and porewater concentrations in the Gulf of Elefsis. In Sustainable Mediterranean, Issue No 71. In Proceedings of the International Conference: Environmental Perspectives of the Gulf of Elefsis, A Mediterranean Case Study Where Science Meets the Society, Elefsis, Greece, 11–12 September 2015; pp. 36–39. [Google Scholar]
  59. NASA—Global Climate Change. Available online: https://climate.nasa.gov/ (accessed on 21 November 2018).
  60. González-Dávila, M.; Santana-Casiano, J.M.; Petihakis, G.; Ntoumas, M.; Suárez de Tangil, M.; Krasakopoulou, E. Seasonal pH variability in the Saronikos gulf: A year-study using a new photometric pH sensor. J. Mar. Syst. 2016, 162, 37–46. [Google Scholar] [CrossRef]
  61. Mentzafou, A.; Dimitriou, E.; Zogaris, S. Integrated ecological assessment and restoration planning in a heavily modified peri-urban Mediterranean lagoon. Environ. Earth Sci. 2016, 75, 983. [Google Scholar] [CrossRef]
  62. Northcott, D.; Sevadjian, J.; Sancho-Gallegos, D.A.; Wahl, C.; Friederich, J.; Chavez, F.P. Impacts of urban carbon dioxide emissions on sea-air flux and ocean acidification in nearshore waters. PLoS ONE 2019, 14, e0214403. [Google Scholar] [CrossRef]
  63. Hassoun, A.; Fakhri, M.; Raad, N.; Abboud-Abi Saab, M.; Gemayel, E.; De Carlo, E.H. The carbonate system of the Eastern-most Mediterranean Sea, Levantine Sub-basin: Variations and drivers. Deep Sea Res. Part II Top. Stud. Oceanogr. 2019, 164, 54–73. [Google Scholar] [CrossRef]
  64. Wolf-Gladrow, D.A.; Zeebe, R.E.; Klaas, C.; Kortzinger, A.; Dickson, A.G. Total alkalinity: The explicit conservative expression and its application to biogeochemical processes. Mar. Chem. 2007, 106, 287–300. [Google Scholar] [CrossRef] [Green Version]
  65. Zervoudaki, S.; Frangoulis, C.; Giannoudi, L.; Krasakopoulou, E. Effects of low pH and raised temperature on egg production, hatching and metabolic rates of a Mediterranean copepod species (Acartia clausi) under oligotrophic conditions. Mediterr. Mar. Sci. 2014, 15, 74–83. [Google Scholar] [CrossRef] [Green Version]
  66. Wimart-Rousseau, C.; Lajaunie-Salla, K.; Marrec, P.; Wagener, T.; Raimbault, P.; Lagadec, V.; Lafont, M.; Garcia, N.; Diaz, F.; Pinazo, C.; et al. Temporal variability of the carbonate system and air-sea CO2 exchanges in a Mediterranean human-impacted coastal site. Estuar. Coast. Shelf Sci. 2020, 236, 106641. [Google Scholar] [CrossRef]
  67. Kulinski, K.; Schneider, B.; Hammer, K.; Machulik, U.; Schulz-Bull, D. The influence of dissolved organic matter on the acid–base system of the Baltic Sea. J. Mar. Syst. 2014, 132, 106–115. [Google Scholar] [CrossRef]
  68. Howes, E.L.; Stemmann, L.; Assailly, C.; Irisson, J.O.; Dima, M.; Bijma, J.; Gattuso, J.-P. Pteropod time series from the North Western Mediterranean (1967–2003): Impacts of pH and climate variability. Mar. Ecol. Prog. Ser. 2015, 531, 193–206. [Google Scholar] [CrossRef] [Green Version]
Figure 1. Bathymetric map of Elefsis Bay (Saronikos Gulf, Eastern Mediterranean Sea). The location of the sampling site is also shown [28].
Jmse 08 00462 g001
Figure 2. Design of the experimental set-up. Two tanks for each pH treatment (ocean acidification conditions/treatment (OA) and control factor conditions/treatment (C)), the IKS system monitoring the CO2 gas supply and Ar supply.
Jmse 08 00462 g002
Figure 3. Vertical distribution of physicochemical characteristics. (a) Temperature in °C, salinity in psu and (b) pH in the NBS scale, Redox potential in mV, DO in μmol kg−1, during field sampling (September 2014).
Jmse 08 00462 g003
Figure 4. Vertical distribution of nutrients. (a) NO3, NO2, NH4+, dissolved organic nitrogen (DON) and total dissolved nitrogen (TDN) in μmol kg−1 and (b) PO43−, dissolved organic phosphorus (DOP), total dissolved phosphorus (TDP) and SiO44− in μmol kg−1 and DIN:DIP ratio during field sampling (September 2014).
Jmse 08 00462 g004
Figure 5. DO concentrations (in μmol kg−1; (a)) and pHT (b) for the duration of the experiment; mean values and standard deviations for the two replicates of each treatment (OA: Ocean acidification condition, C: control condition).
Jmse 08 00462 g005
Figure 6. Vertical distribution of carbonate system parameters (AT, DIC, HCO3 and CO32−) and DOC (in μmol kg−1) in Elefsis Bay during field sampling (September 2014).
Jmse 08 00462 g006
Figure 7. Total alkalinity, DIC, HCO3 and CO32− concentrations (in μmol kg−1) and sedimentary CaCO3s (in %) for the duration of the experiment for (a) OA and (b) C conditions (x-axis: days of the experiment; mean values and standard deviations for the two replicates of each treatment).
Jmse 08 00462 g007
Figure 8. Nitrate, nitrite, ammonium, DON concentrations (in μmol kg−1) and sedimentary TN (in %) for the duration of the experiment for (a) C and (b) OA conditions (x-axis: days of the experiment; mean values and standard deviations for the two replicates of each treatment.
Jmse 08 00462 g008
Figure 9. Phosphate, DOP concentrations (in μmol kg−1) and sedimentary TP (in %) for the duration of the experiment for C (a) and OA (b) conditions; DIN:DIP ratio for both conditions (c); (x-axis: days of the experiment; mean values and standard deviations for the two replicates of each treatment).
Jmse 08 00462 g009
Figure 10. DOC concentrations (in μmol kg−1) and sedimentary OC (in %; (a)); silicate (in μmol kg−1) and sedimentary silica (in %; (b)) for the duration of the experiment for OA and C conditions (x-axis: days of the experiment; mean values and standard deviations for the two replicates of each treatment).
Jmse 08 00462 g010
Figure 11. Principal component analyses (PCA) graphs for (a) C and (b) OA treatments. Red circles indicate positive significant correlations while blue circles indicate negative significant correlations.
Jmse 08 00462 g011
Table 1. Seawater carbonate system parameters, as calculated by the ‘CO2SYS’ package for field (absolute values) and the OA and C experimental microcosms (mean values, standard deviations, minimum and maximum values). Calculation of AT, DIC, HCO3, CO32 and CO2 in μmol kg−1, and of pCO2 in μatm was based on AT, pHT, salinity and nutrients.
Field/
Condition
pHTATpCO2CO2HCO3CO32−DICΩar.Ωca
Field2 m8.032974.0522.613.72237.3306.82557.84.807.19
10 m8.052990.9504.215.12334.4274.12623.64.186.38
20 m7.762978.61089.036.02644.4139.72820.12.113.24
32 m7.622974.91538.452.32726.1100.52879.01.512.33
OAmean6.653622.218,867.8641.13586.115.14242.40.220.34
St. dev.0.06475.42810.394.9469.52.7523.80.050.08
max6.734340.922,525.8766.34292.320.34956.90.310.47
min6.583062.414,103.0479.83039.112.43667.50,150.24
Cmean7.623143.181660.4356.492893.69107.063057.231.612.49
St. dev.0.03107.34117.343.99162.2912.67176.140.190.29
max7.663308.521812.7761.673201.87132.533394.522.003.08
min7.583064.521525.9251.912759.0198.252914.681.482.29
Table 2. One way ANOVA results (F, p) for all experiment parameters regarding seawater analyses (p values < 0.05 are marked in bold, which indicate statistical significance between the two treatments).
ParameterFpParameterFp
DO0.0150.903NO30.1410.712
AT3.9100.066NO24.0780.061
HCO313.0010.002NH4+2.8410.111
CO32−11.0970.004DON7.6620.014
DIC21.1390.000PO43−18.9810.000
Ωar.11.0970.004DOP1.4020.254
Ωcalc.11.0970.004SiO44−0.1260.728
DOC1.4230.250DIN:DIP0.8230.378

