1. Introduction
The wind energy sector has over the past decades shown a continuous reduction in costs [
1], and now both the onshore and offshore wind turbines provide a commercially viable alternative to conventional CO
-emitting power generation in northwestern Europe and along the North American east coast.
In Europe, the rapid expansion of new sites is massively dominated by bottom-fixed turbines at water depths between 20 and 40 m [
2], despite the fact that 80% of the total wind resource is located at sites of +60 m of water [
1]. This vast resource remains mostly untapped due to the fact that conventional bottom-fixed turbines become unfeasible at around 50 m. Floating offshore wind turbines (FOWT) foundations can reach these locations, but have until now been prohibited by high levelized cost of energy (LCoE). Many technologies applied to FOWTs need further research and development [
3], with e.g., mooring and anchors deemed high priority.
Mooring of offshore floating foundations has a broad spectrum of components and combinations. Despite possible solutions, the catenary mooring has been the main choice in the design of the spar type floating offshore wind turbines. The main reason is the long experience from the oil and gas industry. The relation between the anchor and the mooring line is a key point for catenary mooring, where a significant part of the chain lays horizontally along the seabed to prevent vertical anchor loads. This length is, therefore, a considerable contribution to the total footprint, as the prevention of vertical lift is designed based on ultimate limit state (ULS) load cases. The footprint is defined as the radius from the FOWT center to the anchor points. With this in mind, some negative aspects for the catenary mooring system exists, including the design, environment and material costs:
The resting chain at the seafloor can suffer from overlaying soil over time. As a consequence, the intended restoring response could be changed.
The sea bed gets disrupted by the chain movement, changing the habitat for marine life.
High cost when assuming cost proportional to the amount of mooring line material.
Hence, alternative mooring solutions can improve the above-mentioned challenges and still maintain the important compliant characteristics of the catenary mooring system. Alternatives have been studied during the last two decades, and low weight synthetic mooring lines have proven long-term durability, high residual strength and compliance [
4]. Furthermore, a model of a scaled wave energy converter has been tested with compliant taut mooring lines of different stiffness, and the result implies that satisfying dynamic response is obtainable [
5], while [
6] illustrated that also a cost reduction can be expected. It is relevant to investigate whether similar results are observable for FOWTs and investigate which parameters are important to consider in the design process.
This paper presents the dynamic behavior and the line loads of a FOWT, using the TetraSpar concept as case study. The study uses physical experiments and numerical codes to investigate the mooring and floater response when moored with elastic mooring lines. The response is compared with numerical results from the original catenary mooring system, defined in [
7], to investigate the differences of the two mooring systems in terms of natural periods, response amplitude operators (RAOs) and line loads. Also, as a part of the physical model tests, a parameter study was done focusing on pretension,
T and the angle,
between line and seabed (cf.
Figure 1), at a constant water depth to give a better understanding of how they influence the mooring line stiffness. The study tends to investigate the potential of a taut synthetic mooring system for a FOWT and investigate which and how parameters are influencing its dynamic behavior.
Catenary Versus Taut Mooring Fairlead Forces
FOWTs moored with either catenary or elastic mooring lines are designed so the natural frequencies are lower than the wave frequencies to avoid resonance in both operational and extreme environmental conditions. The main difference between the systems is how they achieve their compliant behavior. The mooring stiffness for the catenary system is mainly dependent on the weight and geometry of the chain system, whereas the taut mooring is highly dependent on the material properties
[
8].
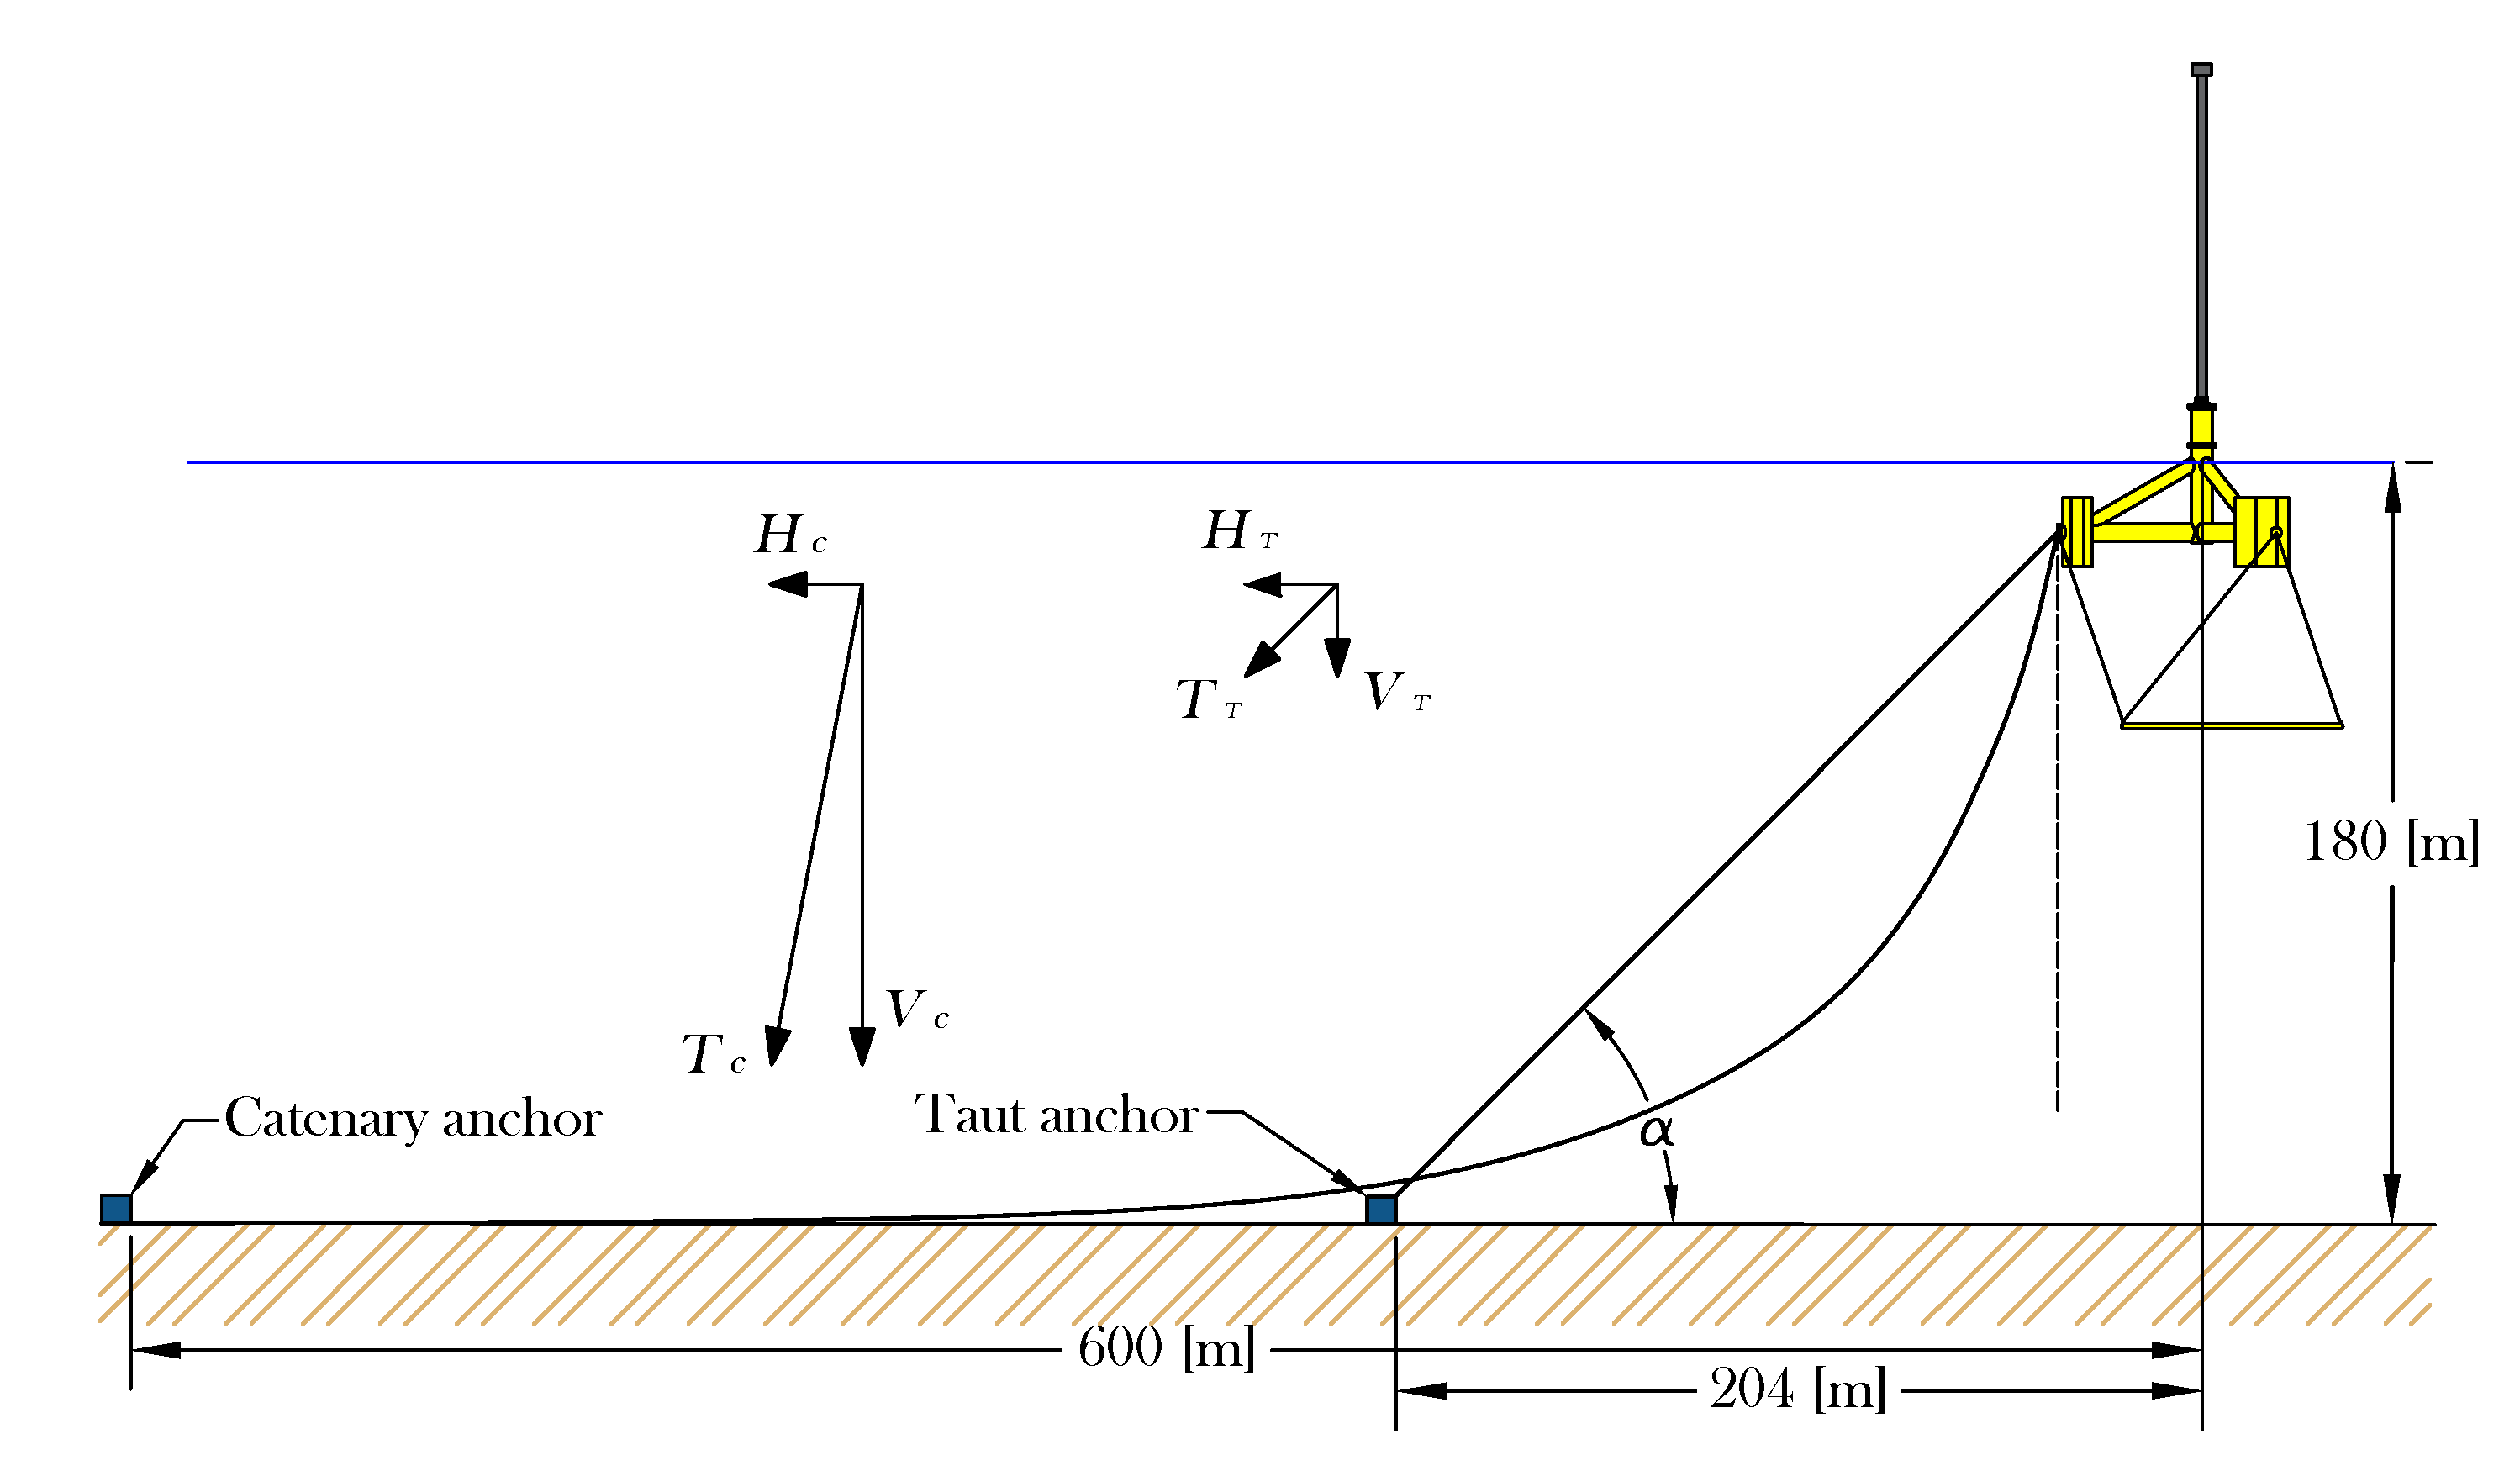
The geometry of the catenary mooring system leads to a different relationship between the horizontal and vertical force component at the fairlead compared to the taut configuration illustrated in
Figure 1. The illustration shows a typical example of the force components at the fairlead with the same magnitude of horizontal restoring force for the catenary and taut configuration,
and
, respectively. The fairlead angle is steeper for the catenary configuration leading to a higher vertical force component, thus a smaller part of the pretension contributes to the horizontal restoring force. Therefore, higher natural frequencies in surge and sway will be expected for the taut set-up due to the increased horizontal mooring stiffness given the same pretension. This illustrates how the angle influences the dynamic response. A high vertical force component will increase stiffness in pitch, roll and heave degrees of freedom (DOFs). This will result in smaller displacement amplitudes. Large displacement amplitudes are not necessarily problematic for FOWTs, which are rather limited by turbine accelerations.
Many parameters are influencing the mooring and floater response such as line stiffness, mass, length etc. However, this study will only focus on the mooring line angle and the pretension, as these are expected to highly influence the taut mooring system. Further studies should investigate the influence of the other parameters.
2. Methodology
The experiment was performed in the wave basin at The Ocean and Coastal Engineering Laboratory, Aalborg University, Denmark during two weeks in February 2018. This section will provide an overview of the wave conditions, mooring layout, mooring material and the numerical model.
2.1. Test Program and Procedure
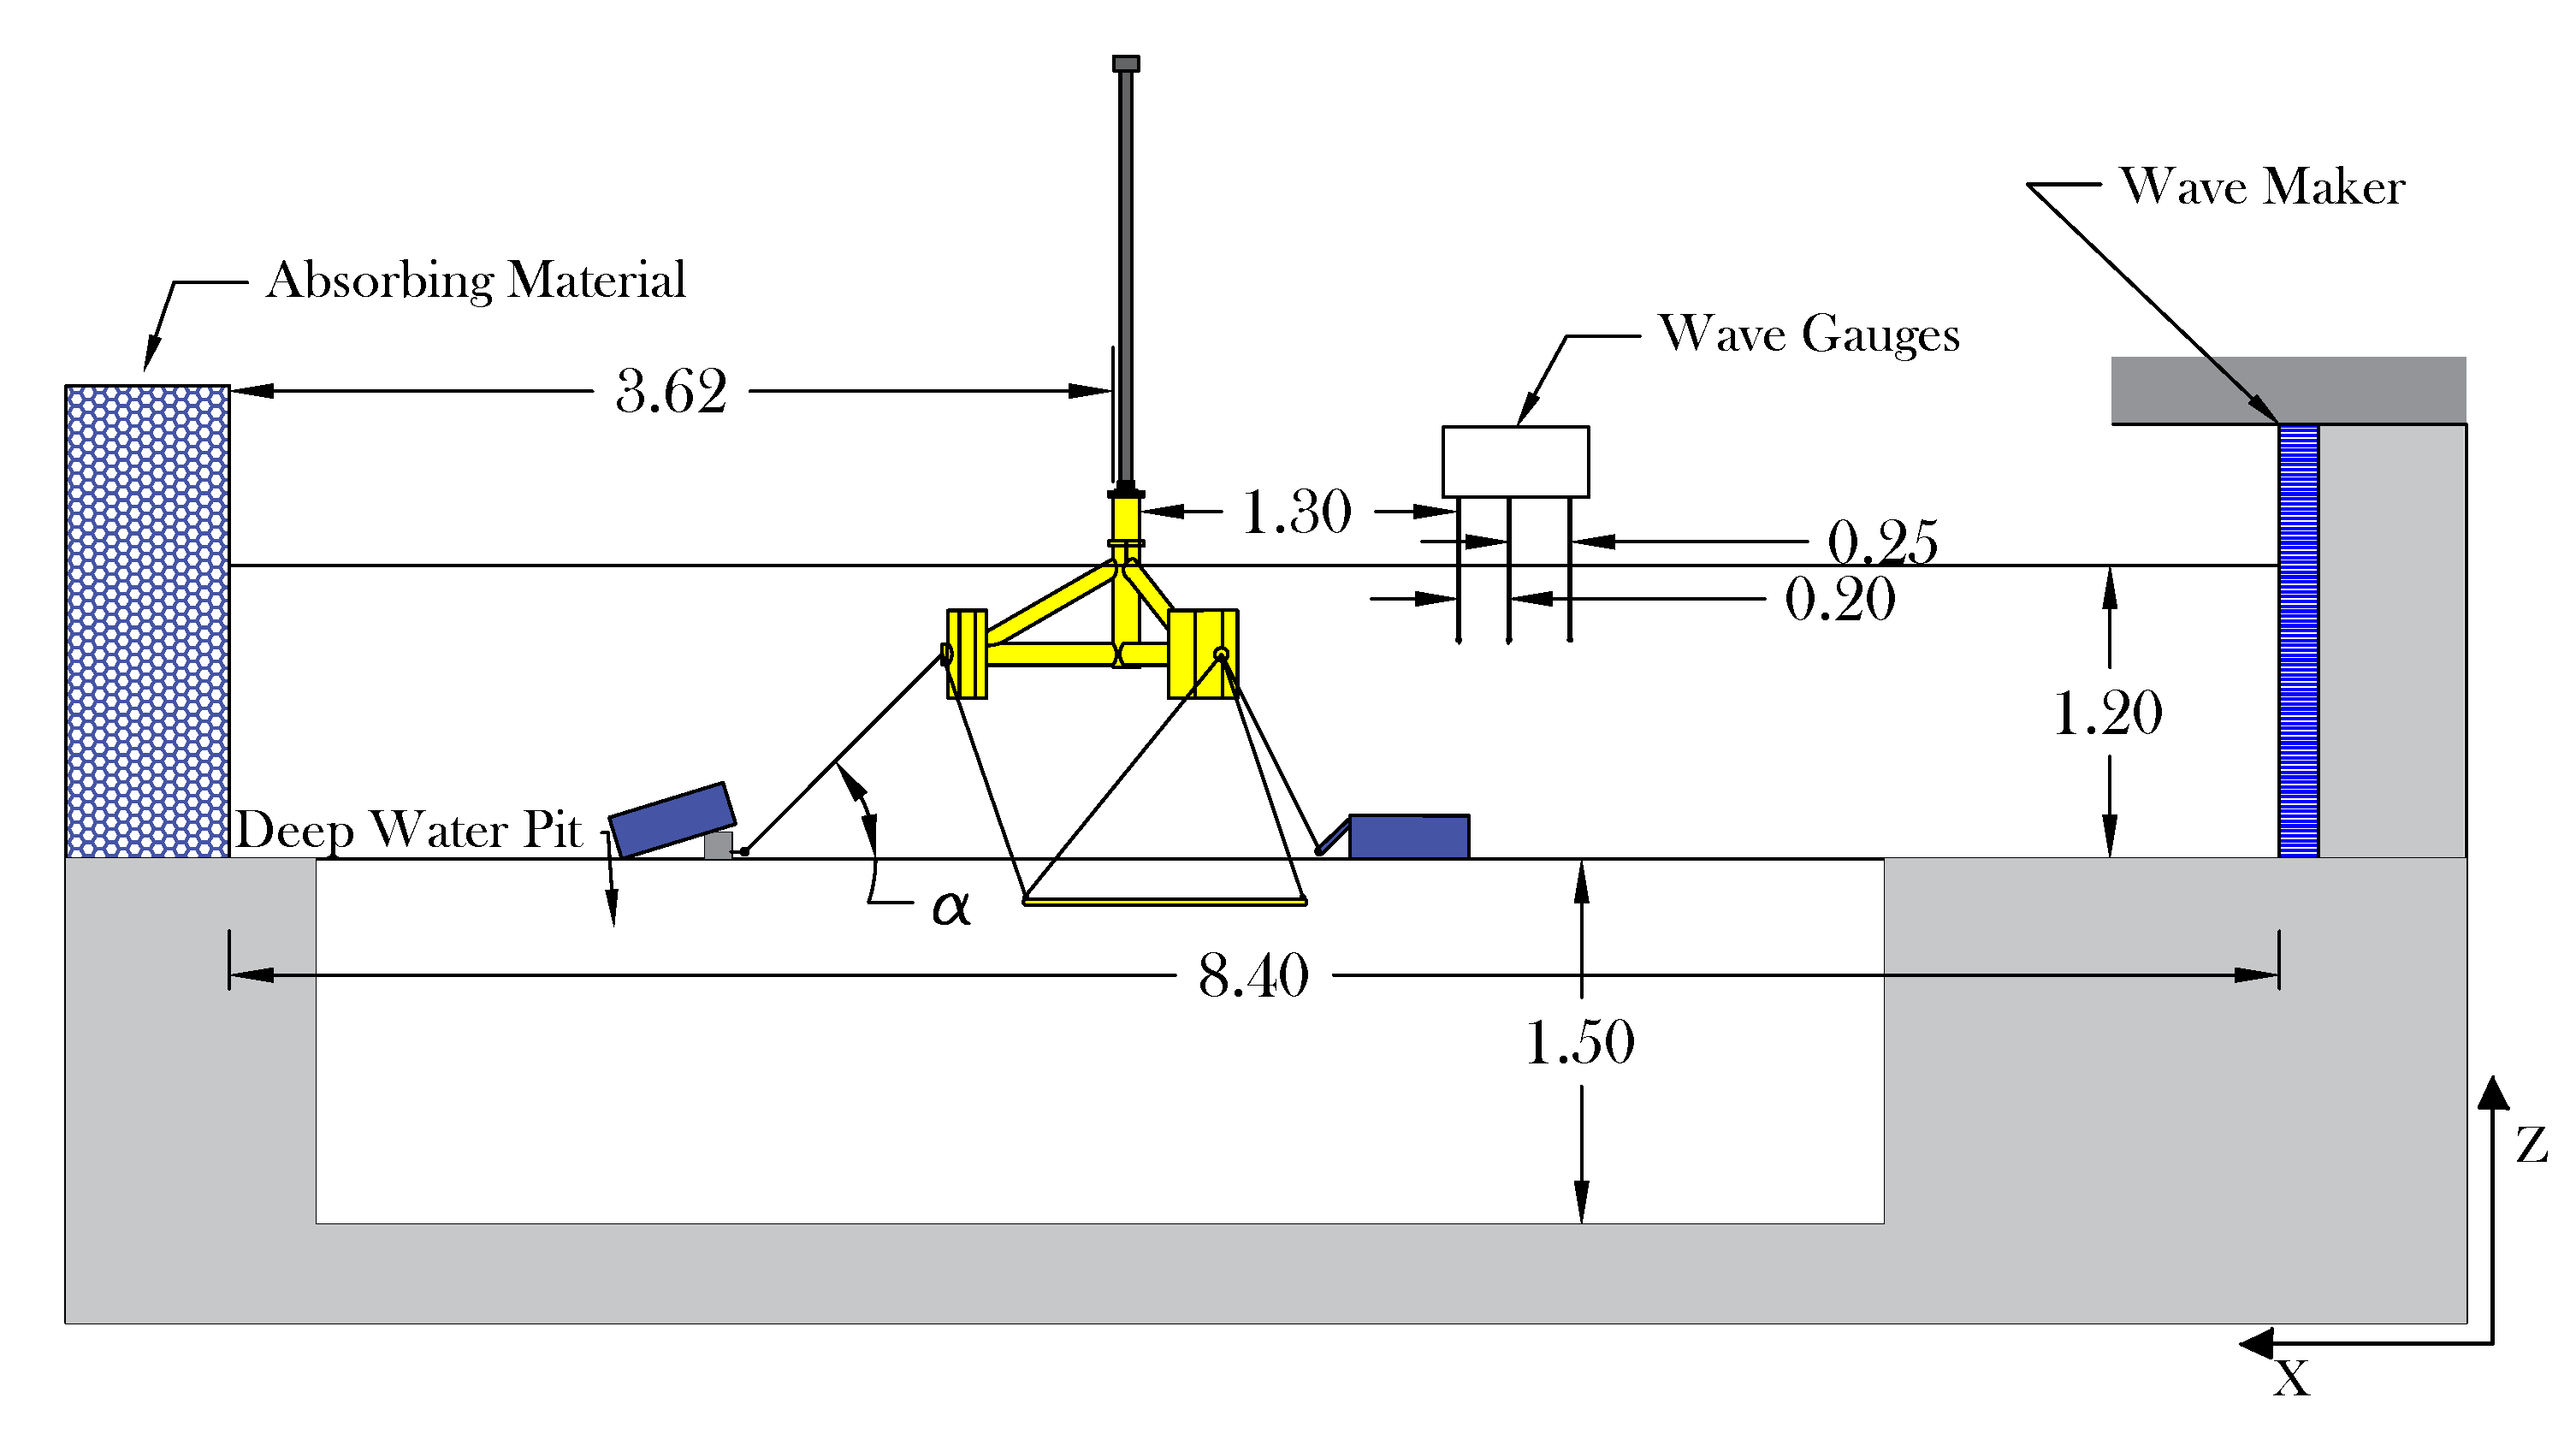
The wave basin had a water depth,
= 1.2 m, and was equipped with a long-stroke segmented piston wave maker with active absorption [
9,
10]. A passive vertical wave absorber was located at the other end of the basin, see
Figure 2. A deep water pit was located in the middle of the wave basin, and during the test campaign it was lowered to 1.5 m below the basin floor, giving a total water depth in the pit,
of 2.7 m (162 m in full-scale for scale 1:60 using Froude Scaling). The floating foundation was placed above the deep-water pit and the global coordinate origin was set to the center of the center column at the waterline.
Three different mooring configurations were tested in the physical test campaign, see
Table 1 for investigated parameters.
The regular and irregular waves were generated by the AwaSys [
11] software and measured by three wave gauges located above the deep-water pit. Wave data acquisition was performed with WaveLab [
12] and reflection analysis was performed during the tests [
13,
14]. The reflection was measured to be in the range of 0.1–0.15. Prior to the tests, the waves were generated without the model in place, to evaluate the reflection in the basin.
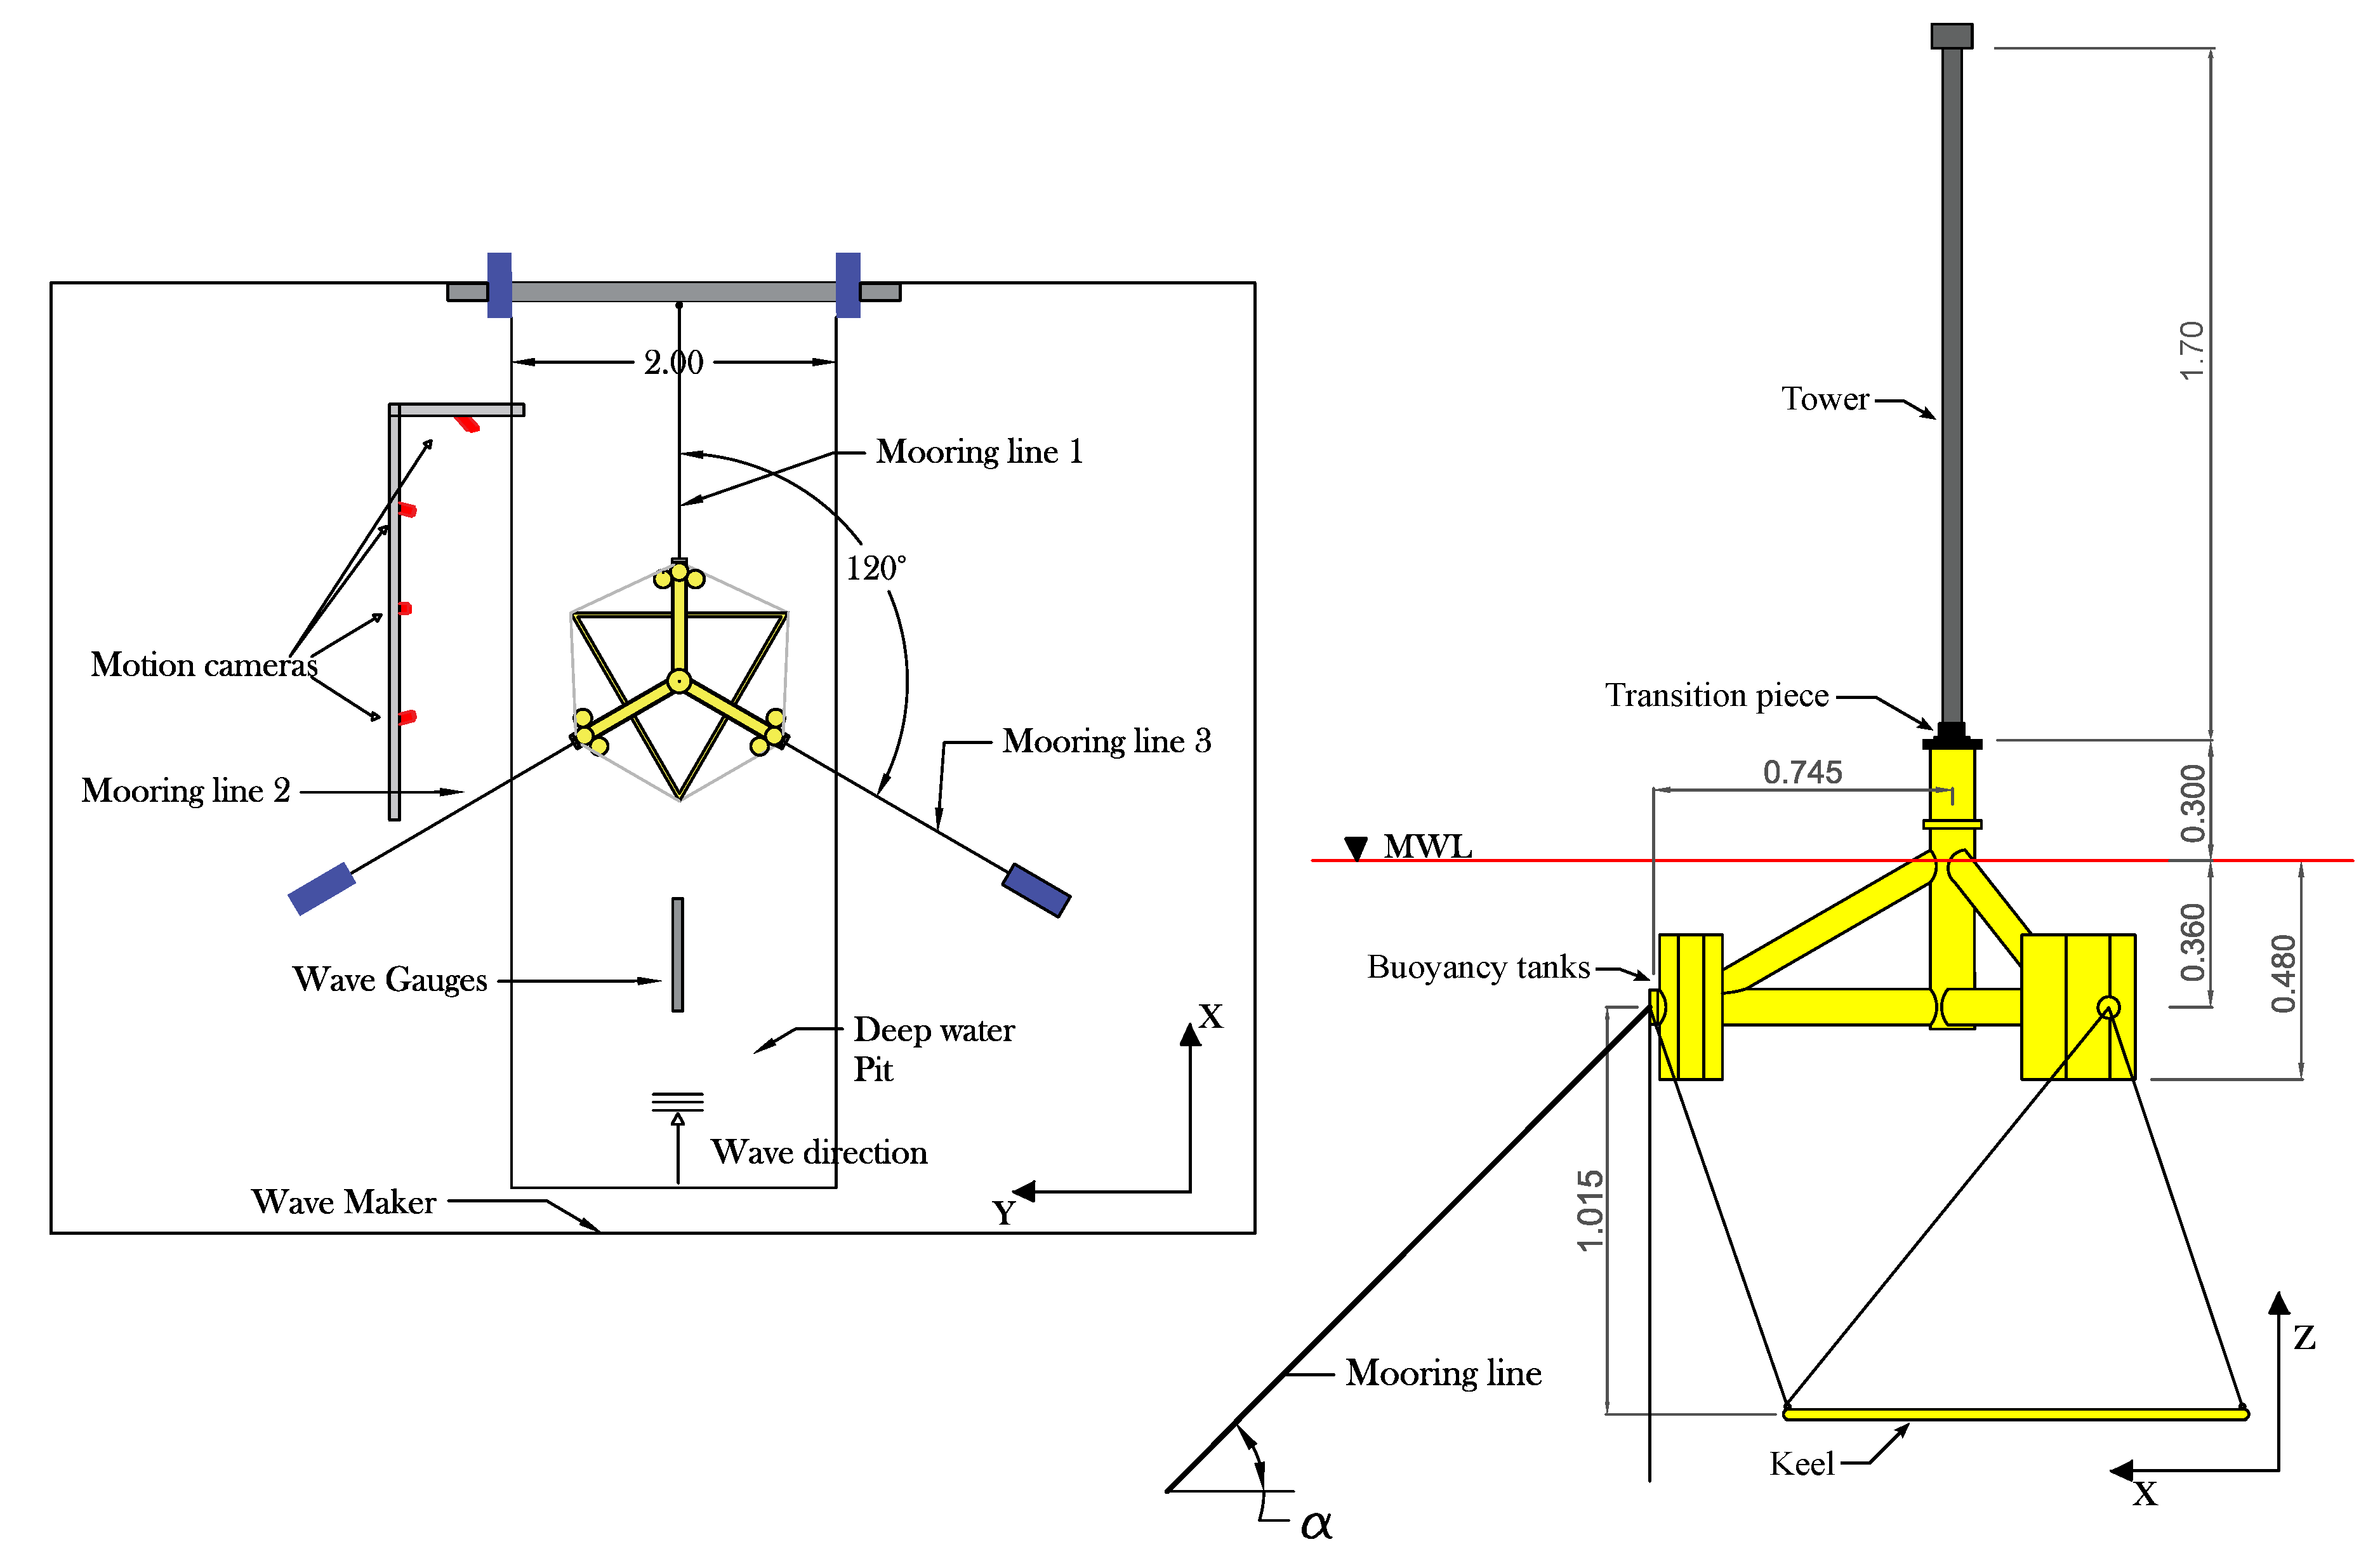
Motions were captured with the tracking system OptiTrack [
15] using four OptiTrack Flex 13 cameras and five reflective markers. The camera position can be seen in
Figure 3 where surge, heave and pitch DOFs were prioritized, but also with the possibility of capturing yaw movement. Due to the symmetry, the sway and roll DOFs are covered in the analysis of surge and pitch, respectively. The reflective markers were placed randomly on the transition piece and on the tower (cf.
Figure 3) to ensure non-symmetry. The motions were measured with respect to the structure center of gravity (CoG). Mooring loads were supposed to be measured with load cells located at the fairlead positions, however, the signal got disrupted when they were placed in water.
The test program consisted of ten regular waves at five different frequencies and two irregular sea states, which were generated with a Pierson-Moskowitz wave spectrum. A minimum of 1000 waves were generated in the irregular sea states. The waves were tested for each mooring set-up and the Environmental Condition (EC) input parameters can be seen in
Table 2. Due to the wave maker, only small waves were produced, which does not simulate any real operational or extreme wave heights set by DTU [
7].
2.2. Physical Model
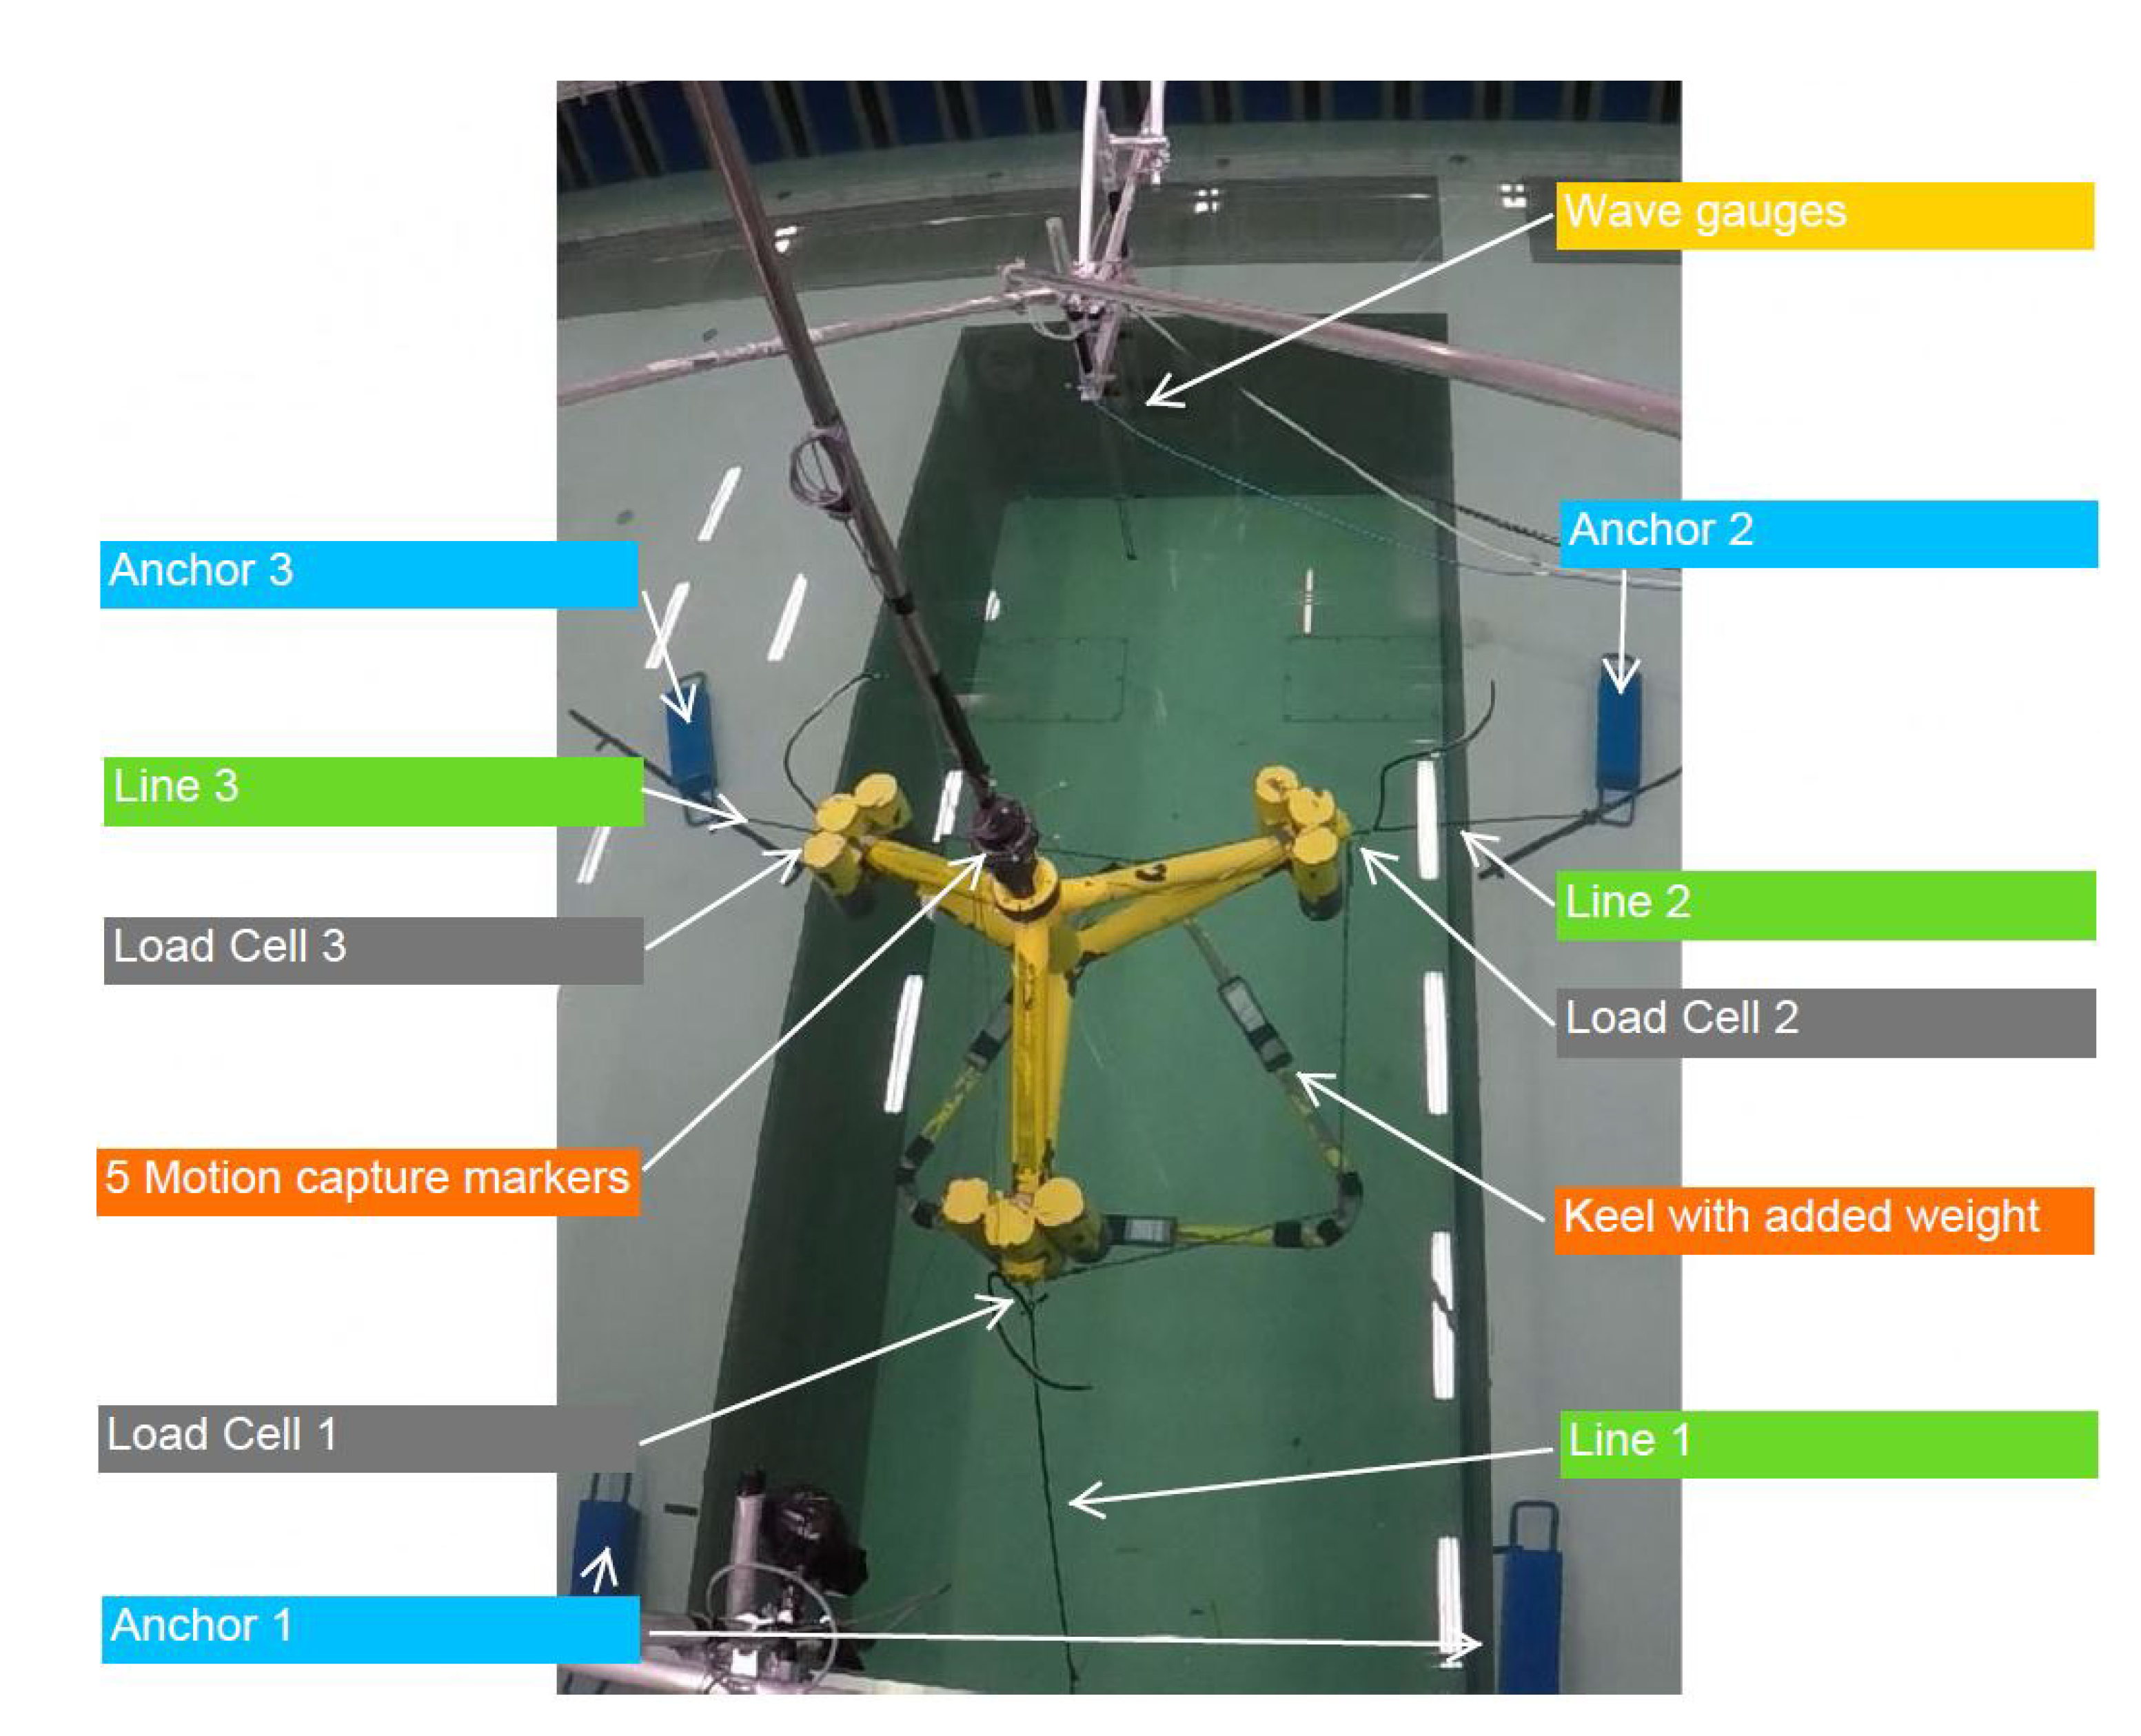
The physical model was a 1:60 Froude scaled version of the 10 MW TetraSpar substructure received from the Technical University of Denmark (DTU), and a picture of the model and the experimental setup is seen in
Figure 4. In the following sections, full-scale values are presented. Dimensions of the model is presented in
Figure 3 while the full-scale mass is listed in
Table 3. The substructure consisted of a floating foundation and a keel, where extra weights were placed on the keel to achieve the draft simulating the spar configuration. The drafts were measured from the waterline and down to the bottom of the three buoyancy tanks and the values are listed in
Table 3. The keel has the same radius as the floater. The tower was constructed in the laboratory based on Froude scaling with a lumped mass at the top simulating the inertia properties of the 10 MW turbine.
Mooring System
A spread taut mooring system consisting of three mooring lines connected to the fairleads at every 120
was tested, see
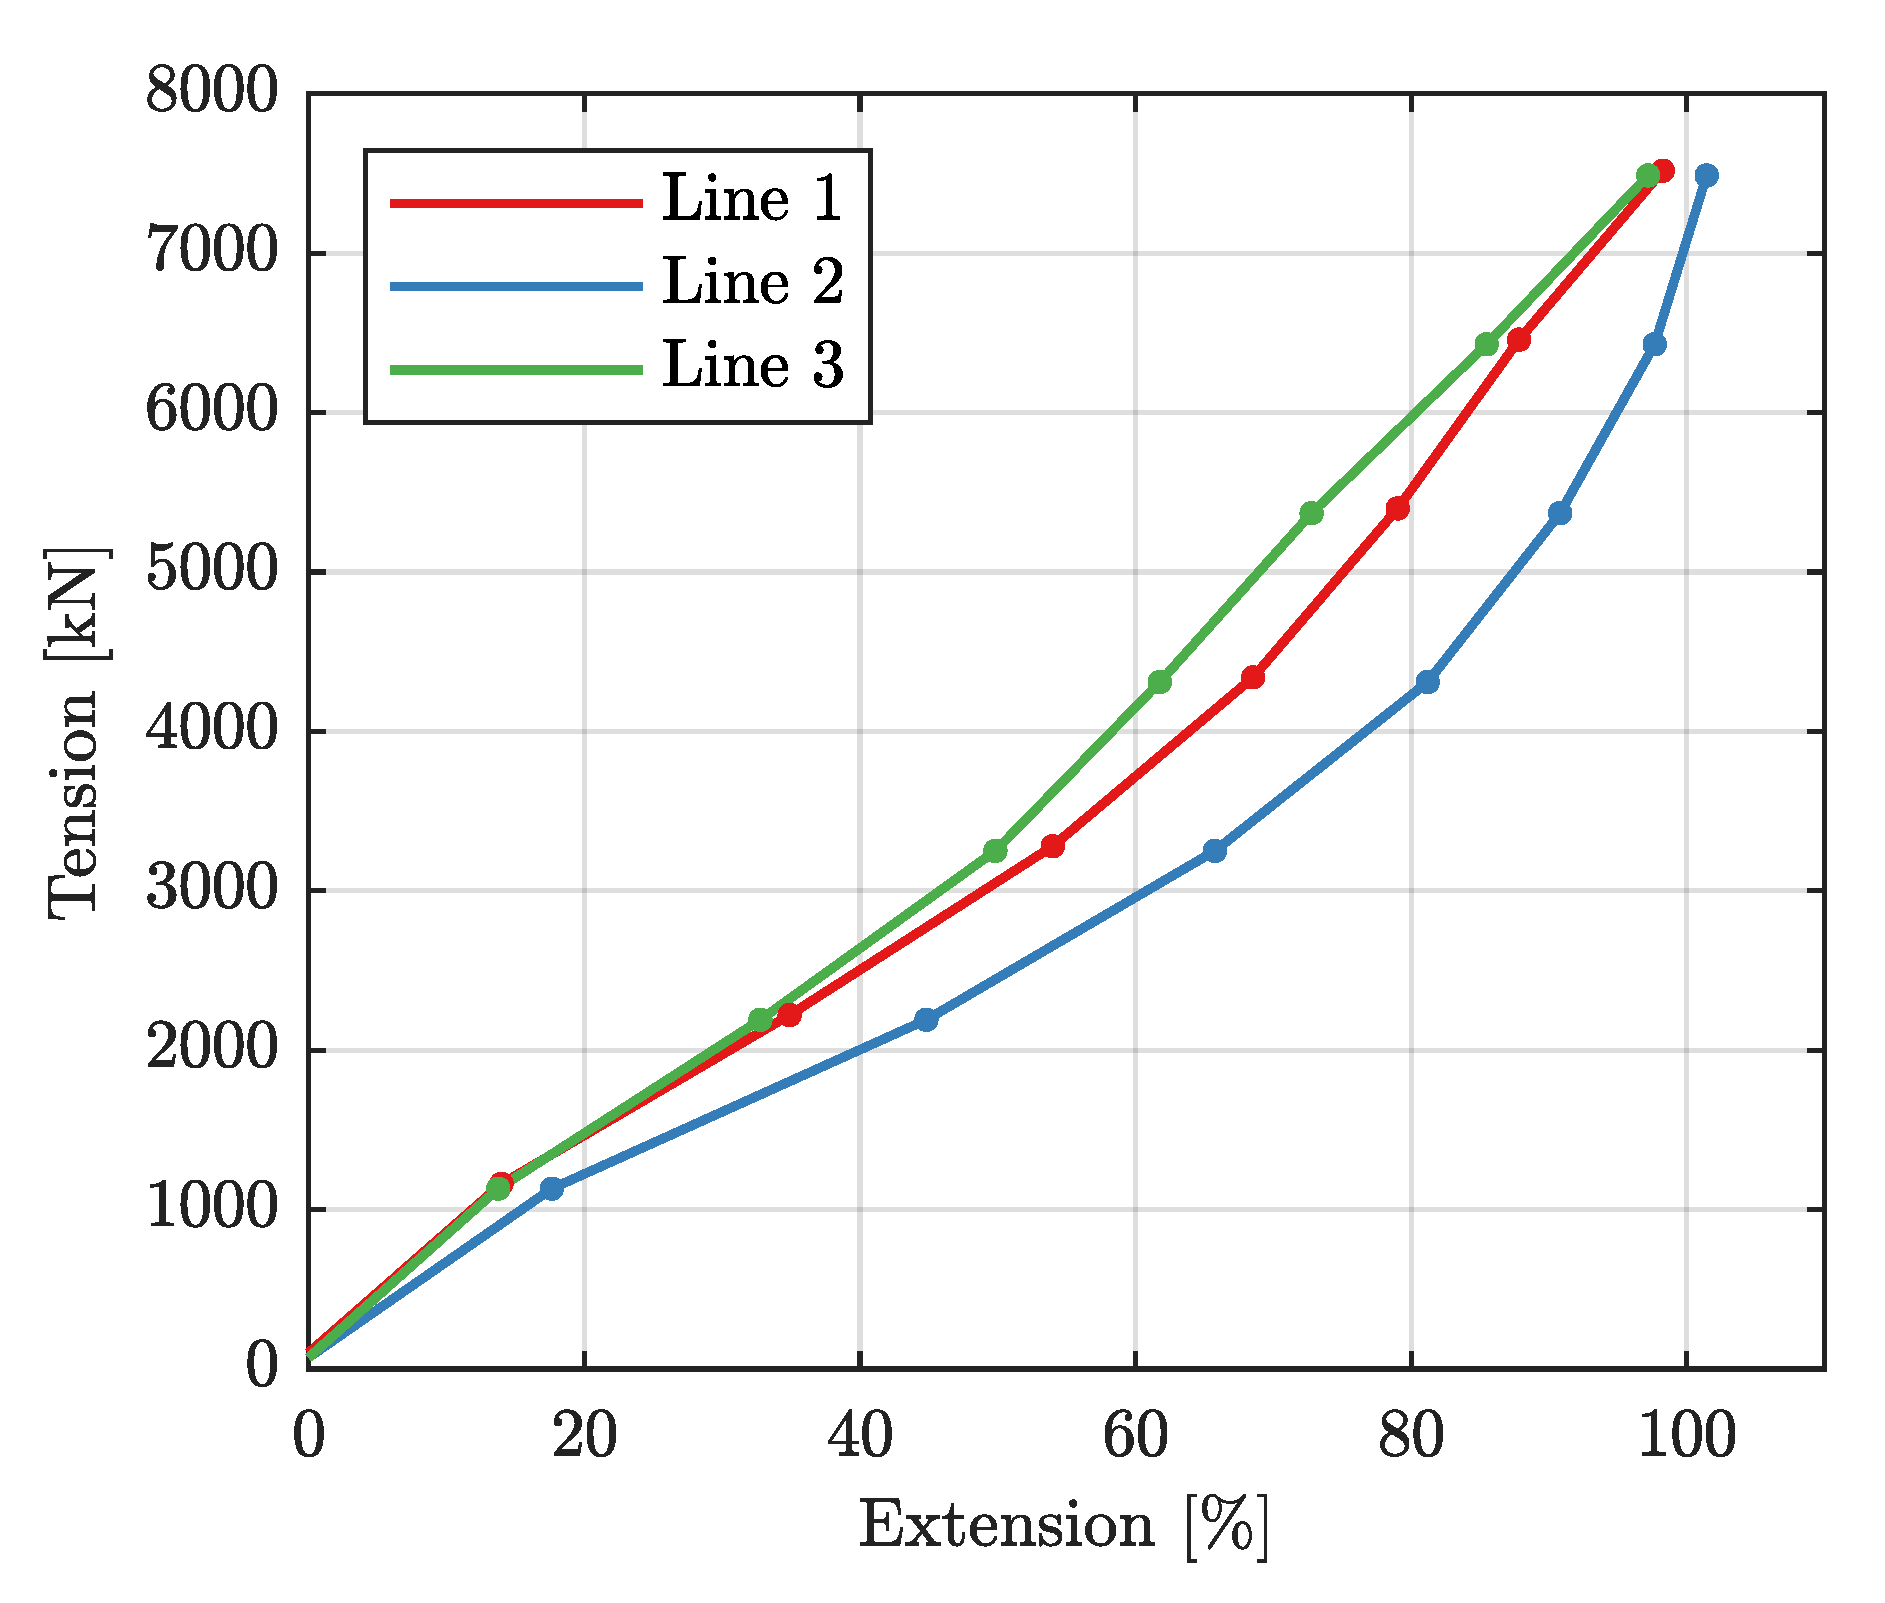
Figure 3. The mooring lines, which do not resemble any real available mooring material, consisted of a mildly non-linear elastic material. The force-extension curve can be seen in
Figure 5. Note that the curve was constructed after the test campaign where the material behavior changed throughout the experiment. The presented linear stiffness,
(where
E is the elastic modulus and
A is the line cross sectional area), was estimated before the test campaign. Further, the linear stiffness could be compared with Ø80 mm
Bridon Superline Nylon, but the force-extension curve differ [
16].
The lines were assumed to be modeled as linear springs in the analytical calculations with the spring constant, , (where is the unstretched line length). Due to the linearization of the non-linear material, some uncertainty can be expected in the analytical model, but is not considered to be crucial.
The combination of the controlling parameters, angle
and pretension,
T led to three different mooring configurations. Since the line loads were not measured, the pretension was approximated by hand calculation assuming the load cell located at the top end as a rigid part of the floater. The full overview of the mooring line parameters for each set-up is listed in
Table 4.
2.3. Numerical Model
A 1:60 numerical model was achieved from DTU, modeled in the time domain simulation tool OpenFAST [
17] including the corresponding WAMIT [
18] file for the floating foundation assuming a rigid structure [
19,
20]. The WAMIT file accounted for the frequency- and direction-dependent wave excitation force vector
, the frequency-dependent hydrodynamic added mass matrix
, damping matrix
and the hydrostatic restoring matrix
computed by the linear potential theory through the boundary element method (BEM) for the floater only. Therefore, the keel was modeled separately in the HydroDyn module in OpenFAST as Morison elements, and the keel cylinder diameter was determined based on model tuning to increase/decrease the buoyancy forces on the structure to achieve satisfying model equilibrium.
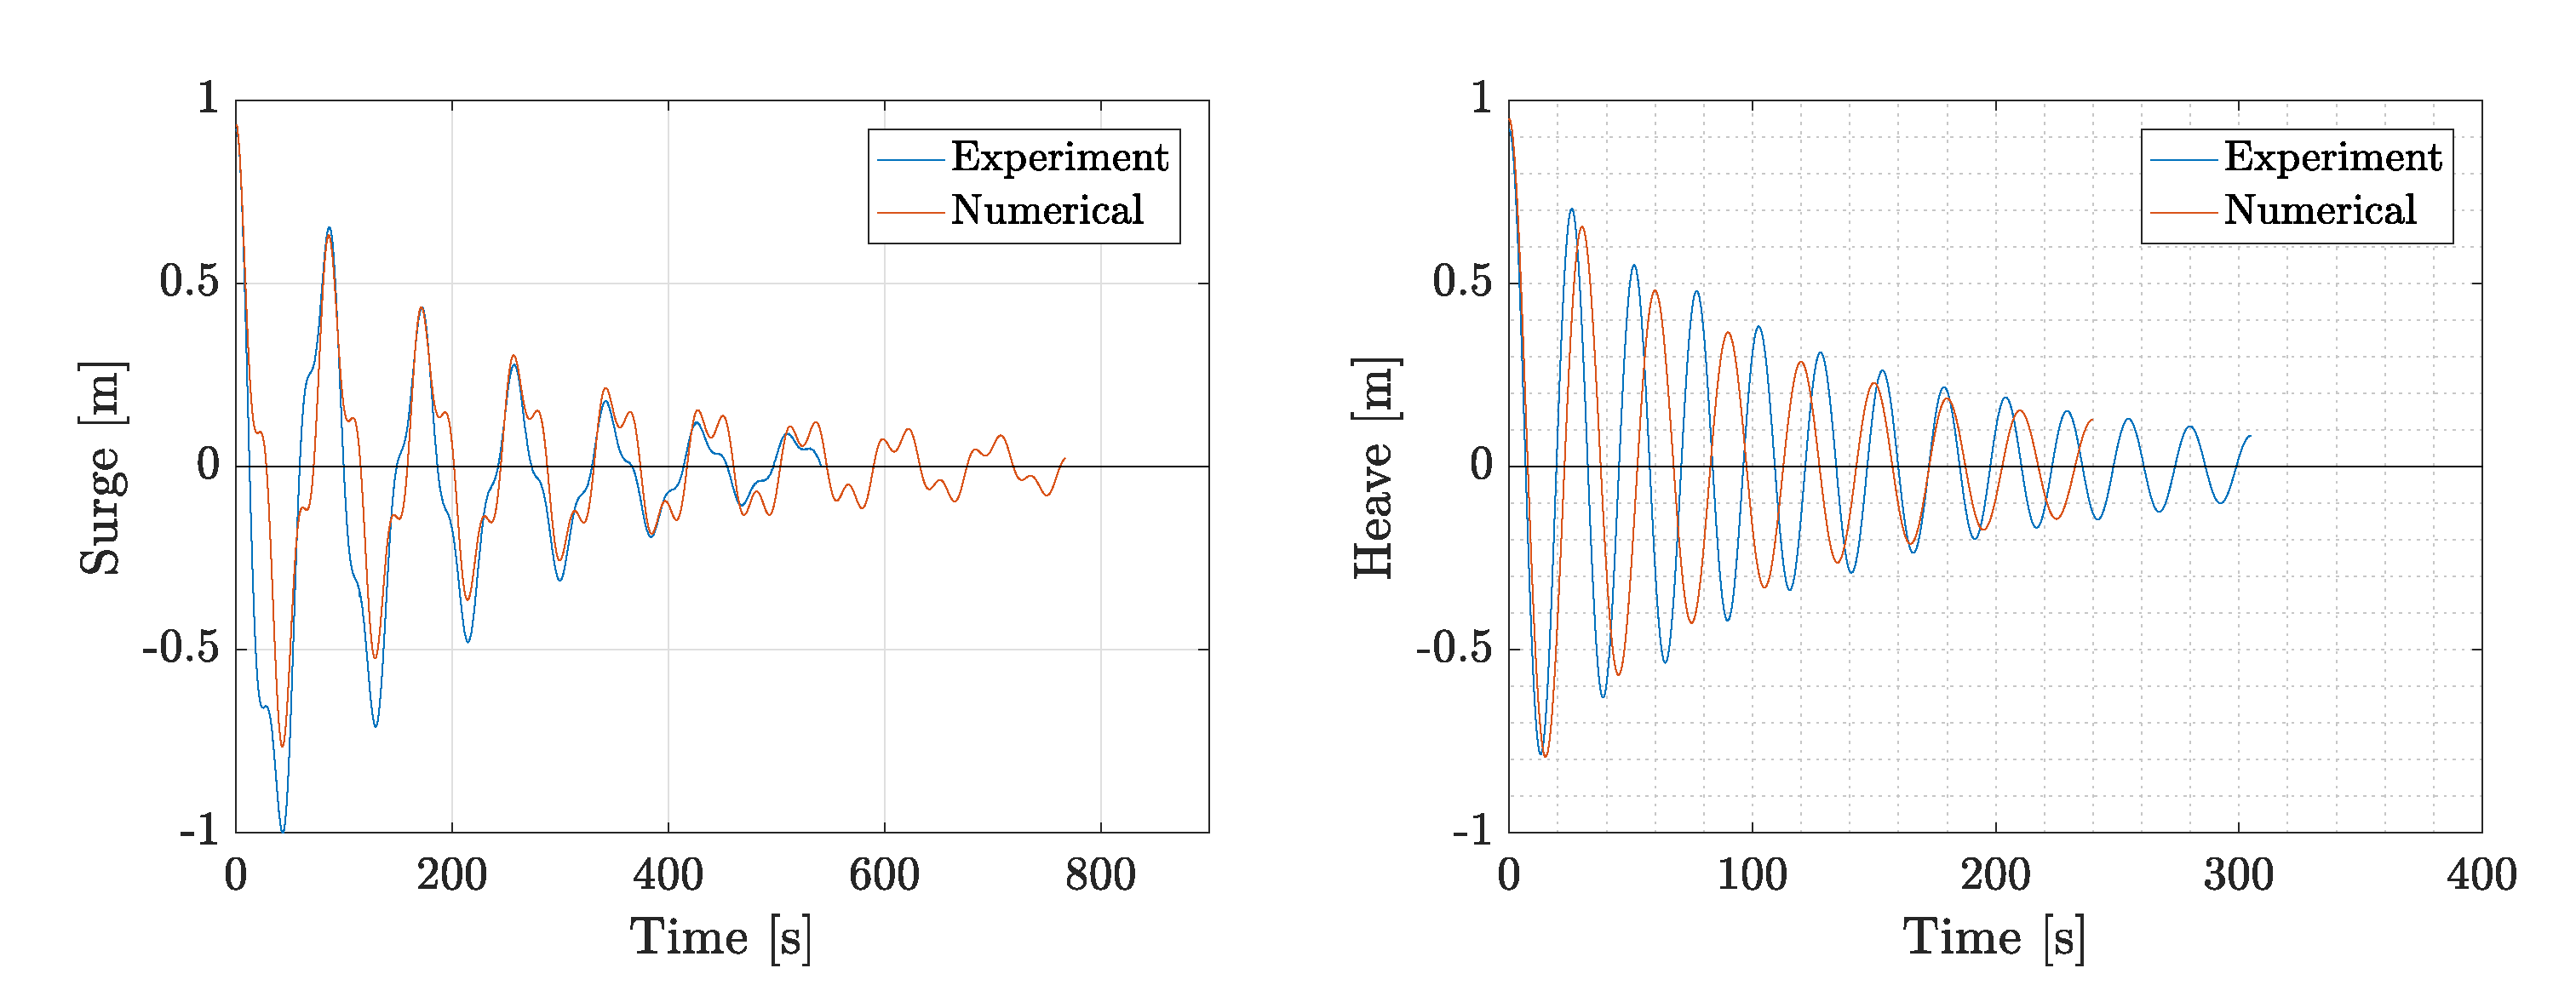
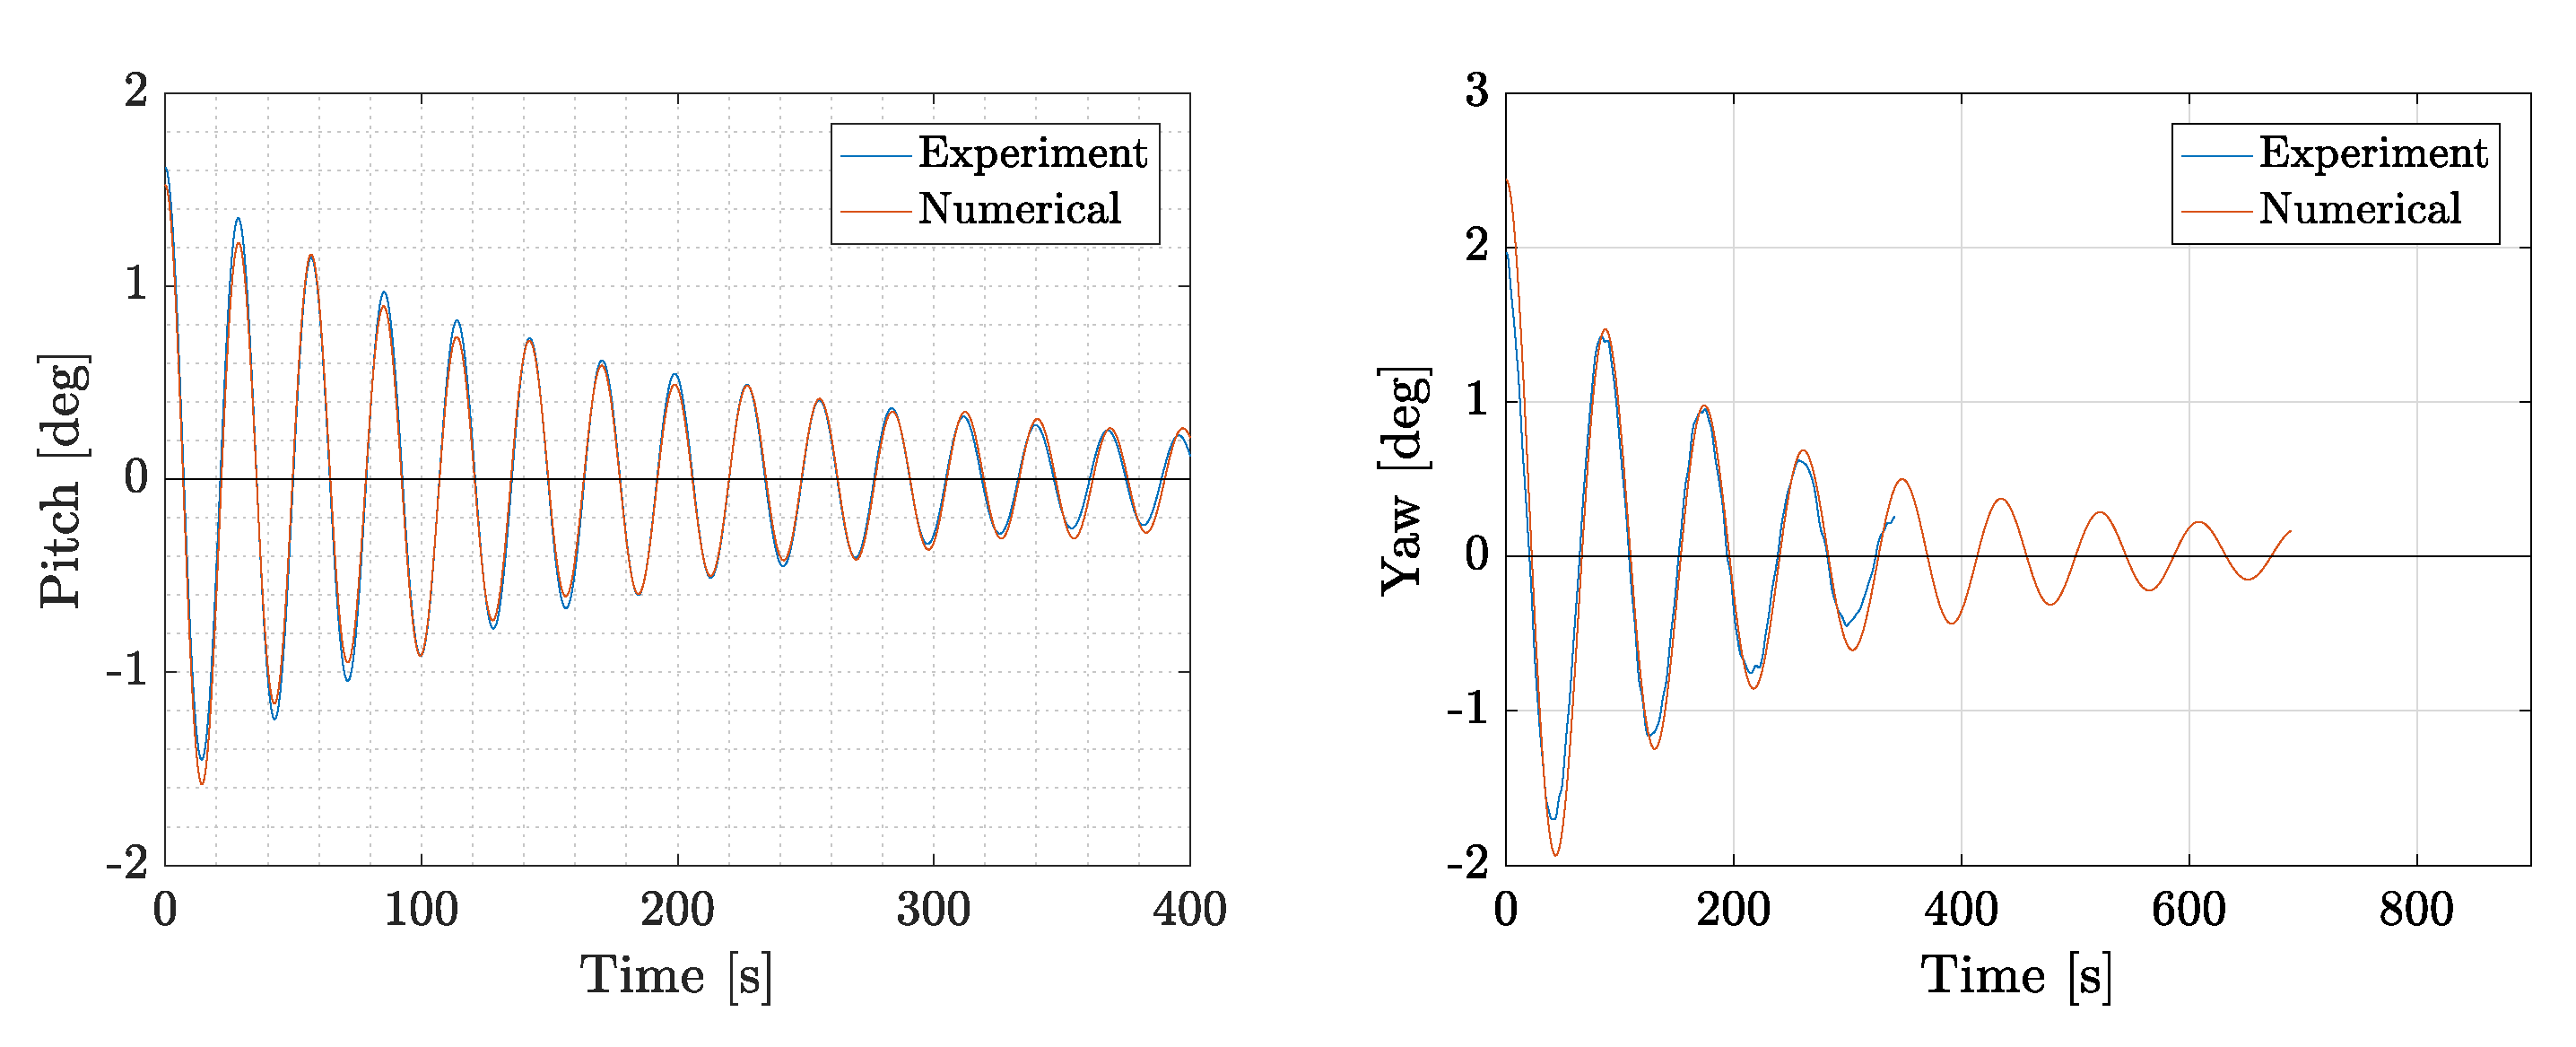
The mooring system was modeled in the MoorDyn module in OpenFAST based on the experimental Config 1, where the numerical model was tuned based on the experimental decay tests to obtain similar main dynamics, see
Figure 6 and
Figure 7. MoorDyn is based on the lumped-mass approach when modelling stiffness and hydrodynamics [
21].
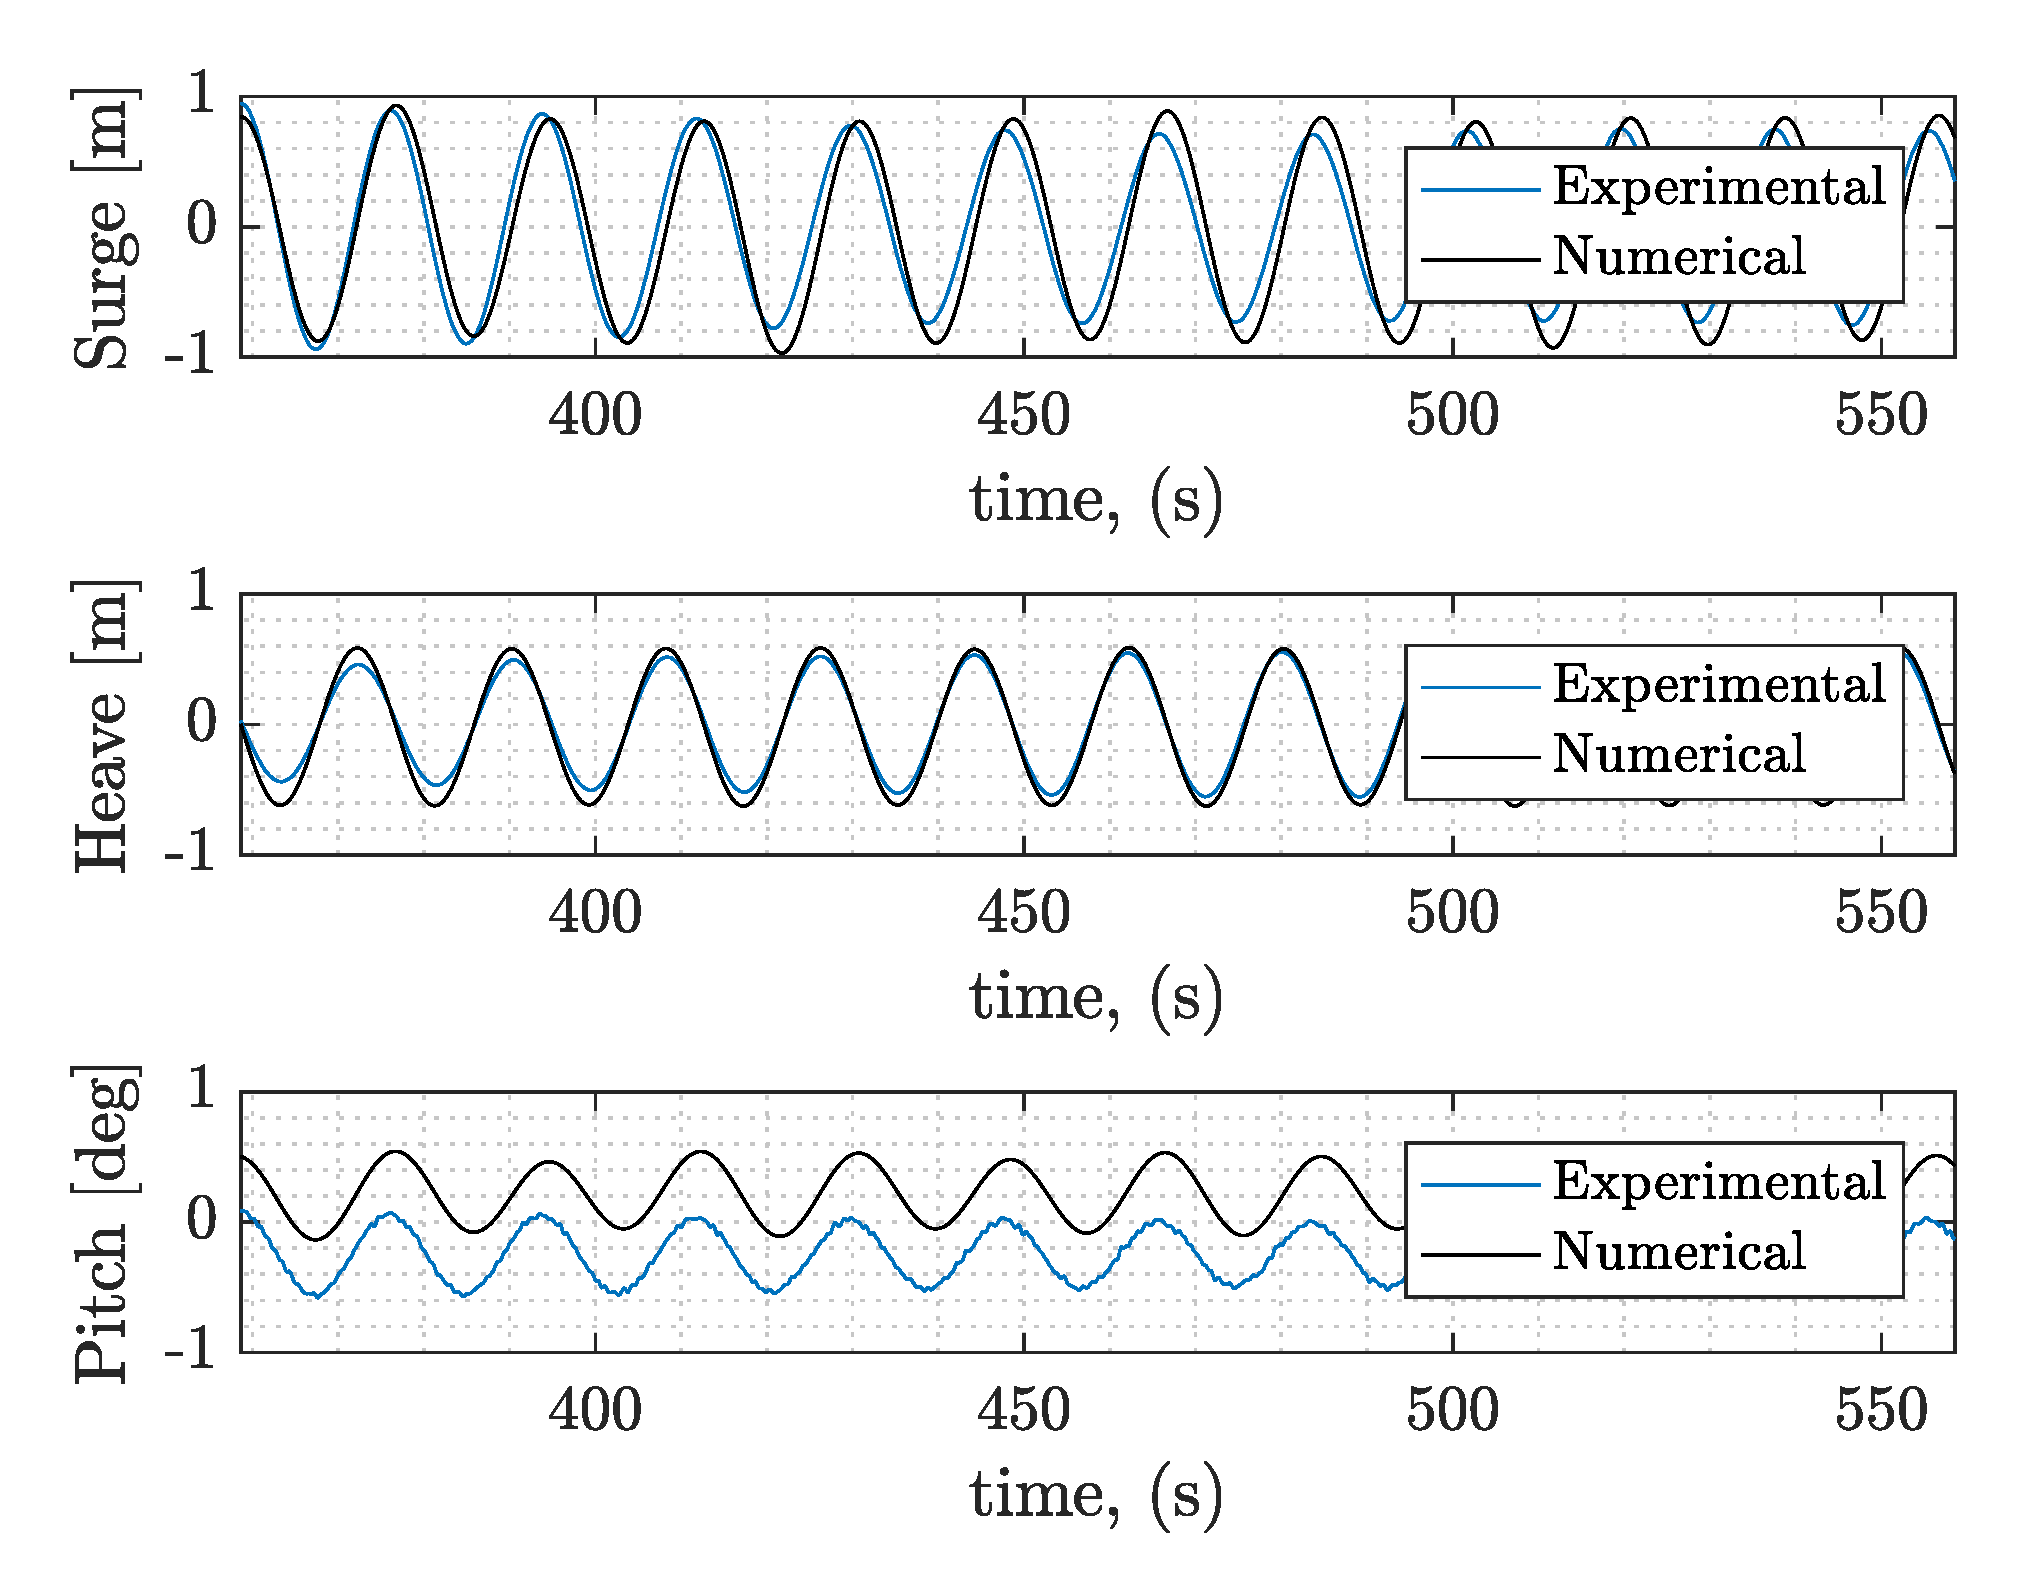
Some discrepancy is observed for the heave DoF indicating a lower natural frequency in the experimental model. The discrepancy can be caused by e.g., variation in actual and calculated hydrostatic stiffness or added mass. The mooring stiffness might also provide some discrepancy, but are showing good agreement in other DOFs. Also, the tuned numerical model showed good agreement with the regular wave tests in all the DOFs with the exception for the pitch DOF and EC 1 and EC 6, see
Figure 8 and
Figure 9.
3. Results
This section presents the results obtained during the test campaign for the three set-ups and compare them to the catenary mooring system presented in [
19]. Furthermore, results are compared to analytical approaches for the three mooring set-ups focusing on the motion response from the stiffness, whereas a numerical model was used to estimate the line tension in Config 1. The natural frequencies and RAOs were obtained from the experiments and compared to the numerical catenary configuration. All values are presented in full scale 1:60 by use of Froude scaling. Furthermore, the resulting analytical stiffness coefficients from the examined DOFs is shown in
Table 5.
3.1. Static Test
A static test was done by displacing the structure while the applied force was measured with a force meter to estimate the horizontal stiffness of the system. The structure was displaced in positive
x-direction (see
Figure 3), meaning that both mooring lines 2 and 3 contributed in the restoring force. Due to the symmetric geometry of the system, a similar horizontal response is expected for one line. The result can be used to understand the surge compliance and to estimate the experimental surge stiffness for the three set-ups.
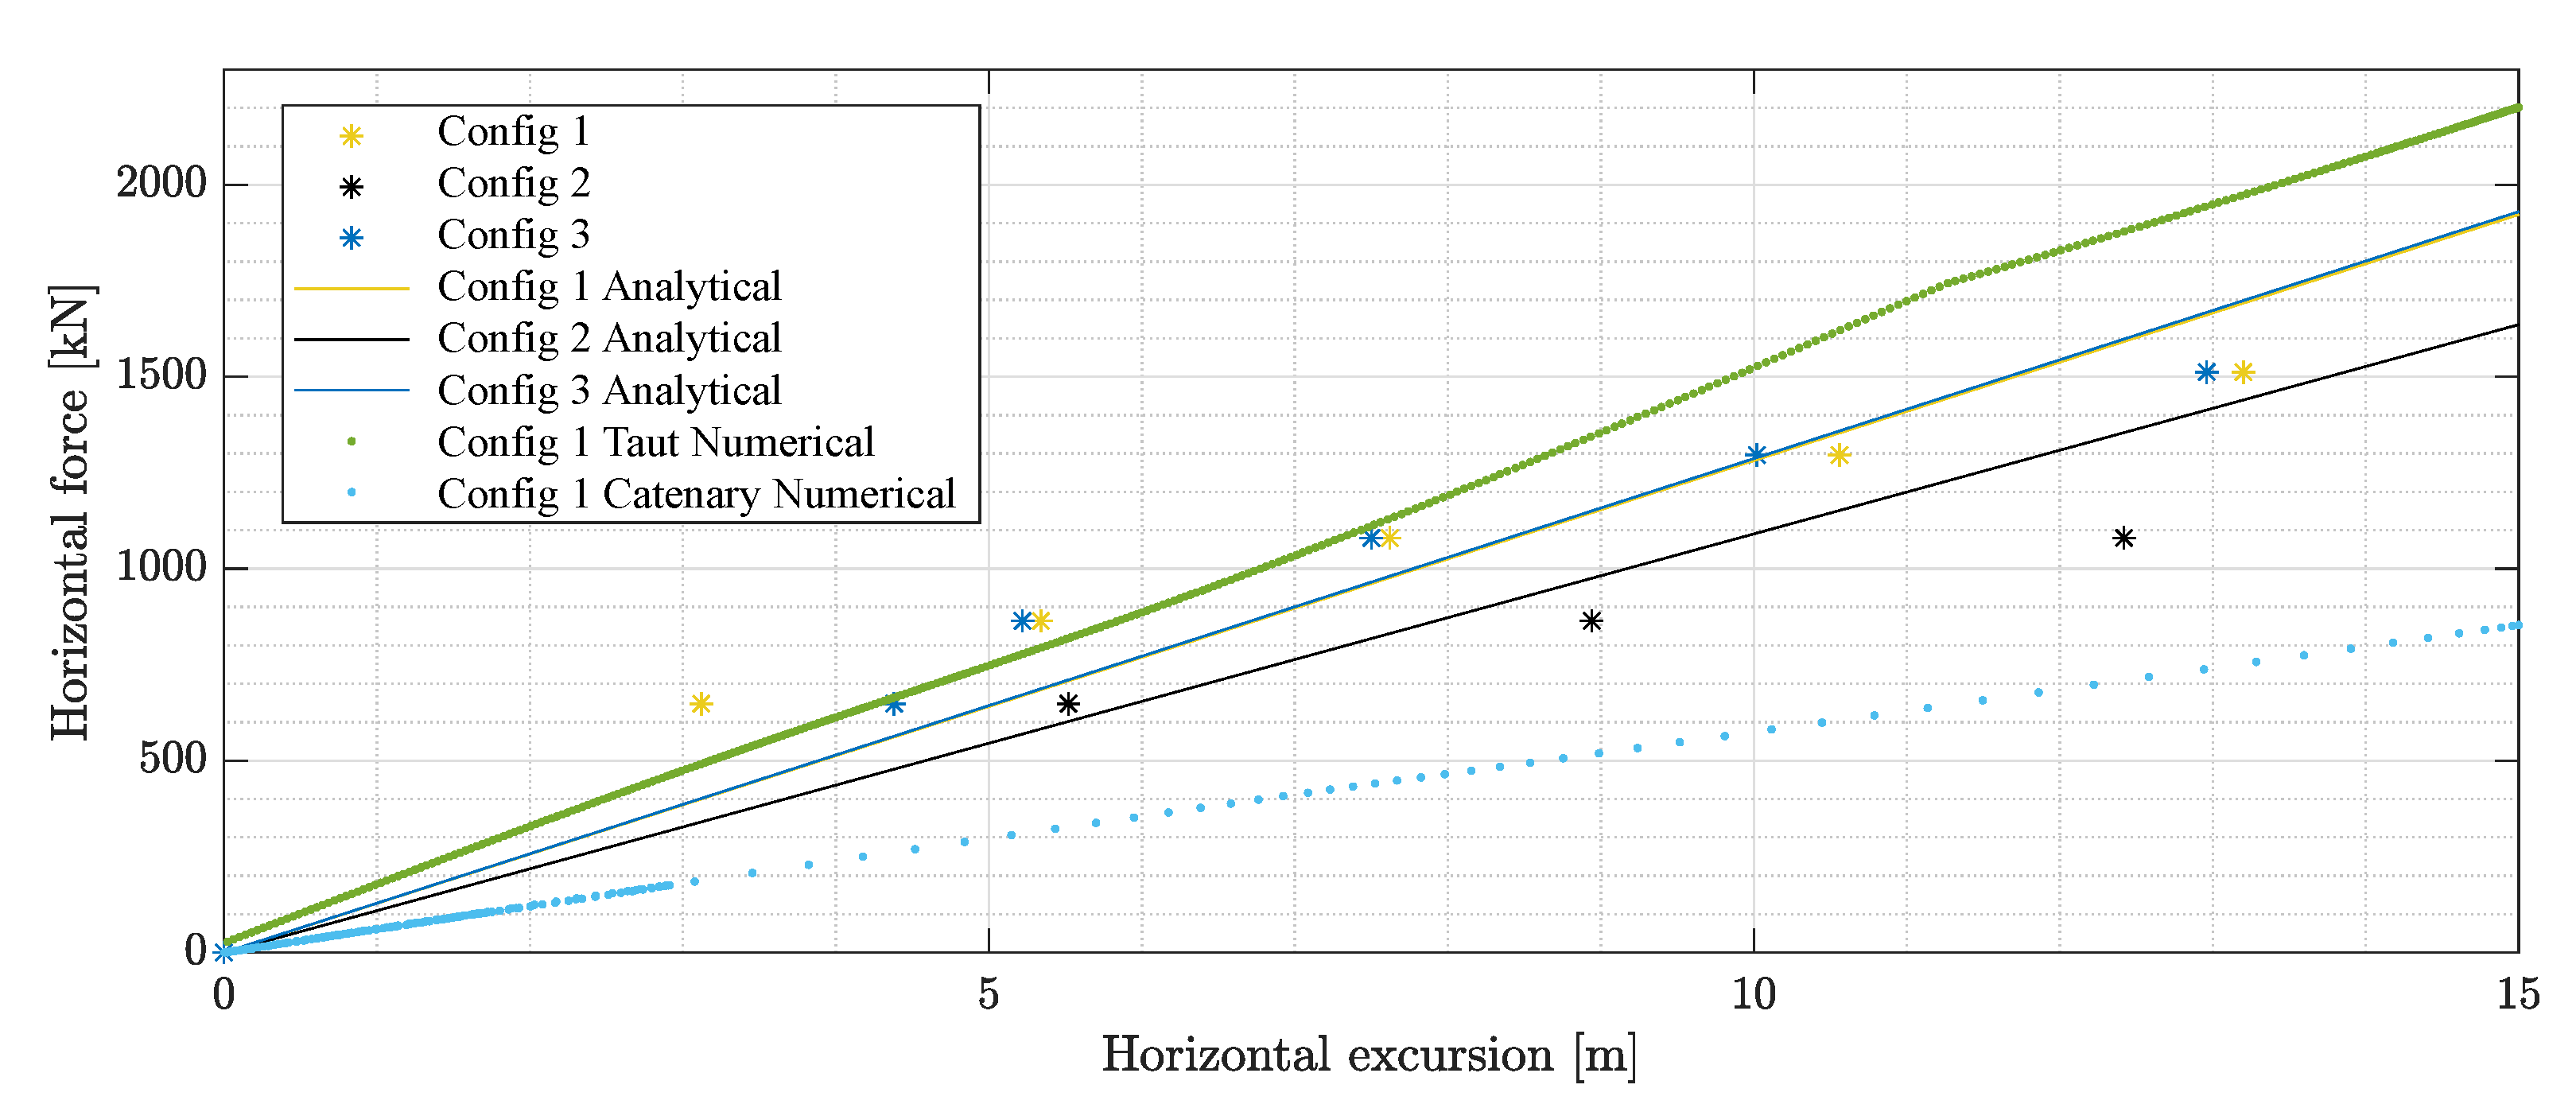
Figure 10 shows the experimental and numerical results plotted with the analytical force-excursion curve derived from the stiffness coefficient
. It can be seen that the horizontal stiffness is reduced in Config 2 caused by a reduced
due to longer mooring lines and less pretension,
T. However, Config 3 showed a similar response to Config 1 caused by a higher pretension. The more favorable horizontal component relative to the pretension will generally increase horizontal stiffness for the same pretension. However, due to constant water depth and lower
with decreasing angle, a non-linear stiffness relation from the controlling parameters was expected and seen analytically in
Figure 11. The experimental linearized surge stiffness was estimated by a linear regression for each set-up and shown next to the red markers in
Figure 11, and a deviation was seen between the analytical and experimental surge stiffness.
3.2. Natural Periods
The natural periods,
for each of the three set-ups were obtained by decay tests (see
Figure 6 and
Figure 7) and are listed in
Table 6. Surge, heave, pitch and yaw were examined by displacing the structure before releasing it. The
were found in time domain by zero-down-crossing and some cross coupling was visible between the DOFs. The first cycle of each test were removed in the post-processing to avoid any effects from manually displacing the structure. Further, small variations is seen in the natural periods for heave,
and pitch,
possibly due to high hydrostatic stiffness emerging from the water plane area and the metacentric height, respectively. Meaning the change of the mooring parameters did not give any clear changes.
The horizontal stiffness was discussed in
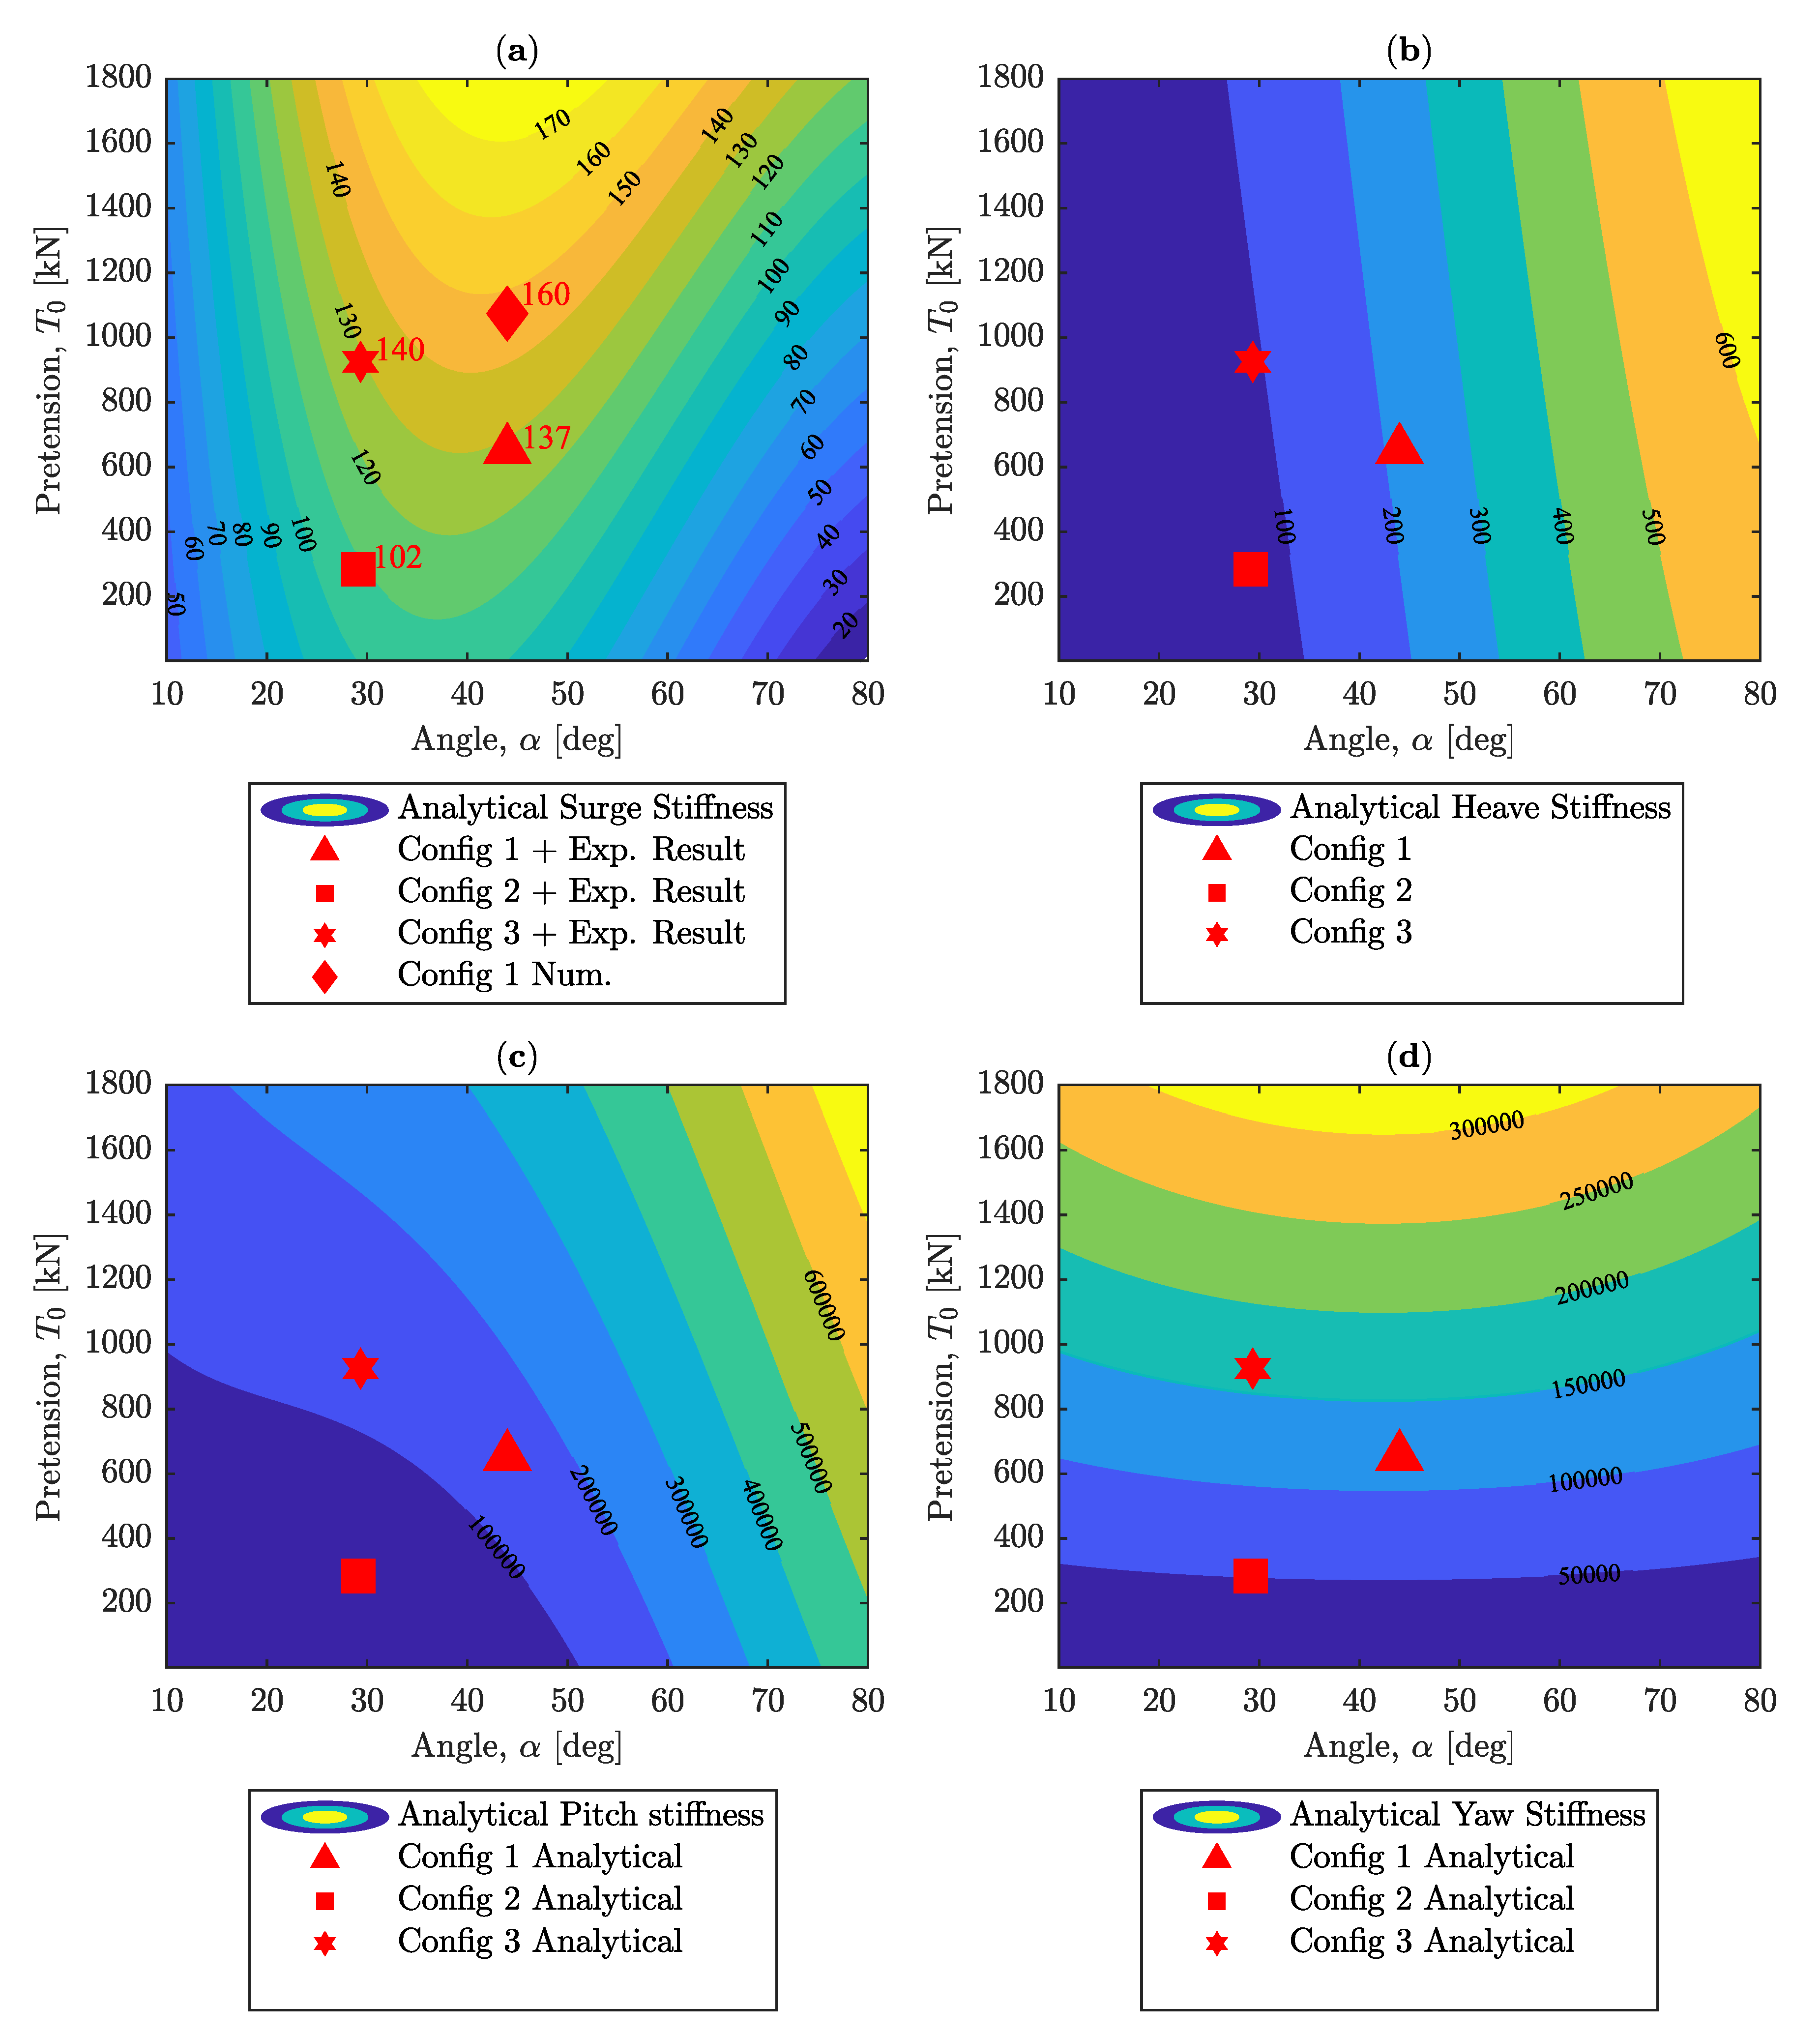
Section 3.1, and due to a reduction from Config 1 to Config 2, the surge compliance increases. Consequently, the natural period of the structure is expected to increase and an additional three seconds was observed from the surge decay test. Config 3 yields the same natural period as Config 1, as a result of higher pretension. By looking at the analytical contour plot in
Figure 11a the non-linear relationship is clear and it underlies how the natural periods can yield the same result for two different combinations of the controlling parameters.
The resulting heave natural periods,
were not consistent with the expected dynamics based on the analytically stiffness, plotted in
Figure 11.
Table 5 show the stiffness coefficients, where the hydrostatic heave stiffness is dominant. Since the measured draft seen in
Table 3 were not consistent, it could have a larger influence than the controlling parameters. The result apparently suggest this effect, where the increasing order of draft matches the increasing order of natural periods.
Even though
Figure 11c show different mooring stiffness for the set-ups, no clear change in the natural periods were visible. This could be due to a high hydrostatic stiffness and the one-second difference could result from measurement errors or the influence of the above-mentioned draft.
The discussed pattern between natural periods and mooring stiffness was very clear for the yaw DOF. The yaw natural periods,
varies highly between the set-ups and
Figure 11d show how sensitive the yaw stiffness,
are to changes in pretension. According to the analytical results, the mooring stiffness variations by
is rather modest for the analyzed pretensions.
Table 6 also show an overview for the catenary natural periods, where all
show higher values except for yaw, which is the least critical in terms of being in any existing sea state period. Hence, the catenary configuration show a more compliant system which is also suggested by the numerical force-excursion curve in
Figure 10. However, all taut set-ups have sufficient high natural periods to avoid resonance from first order wave forces.
3.3. Motion Response
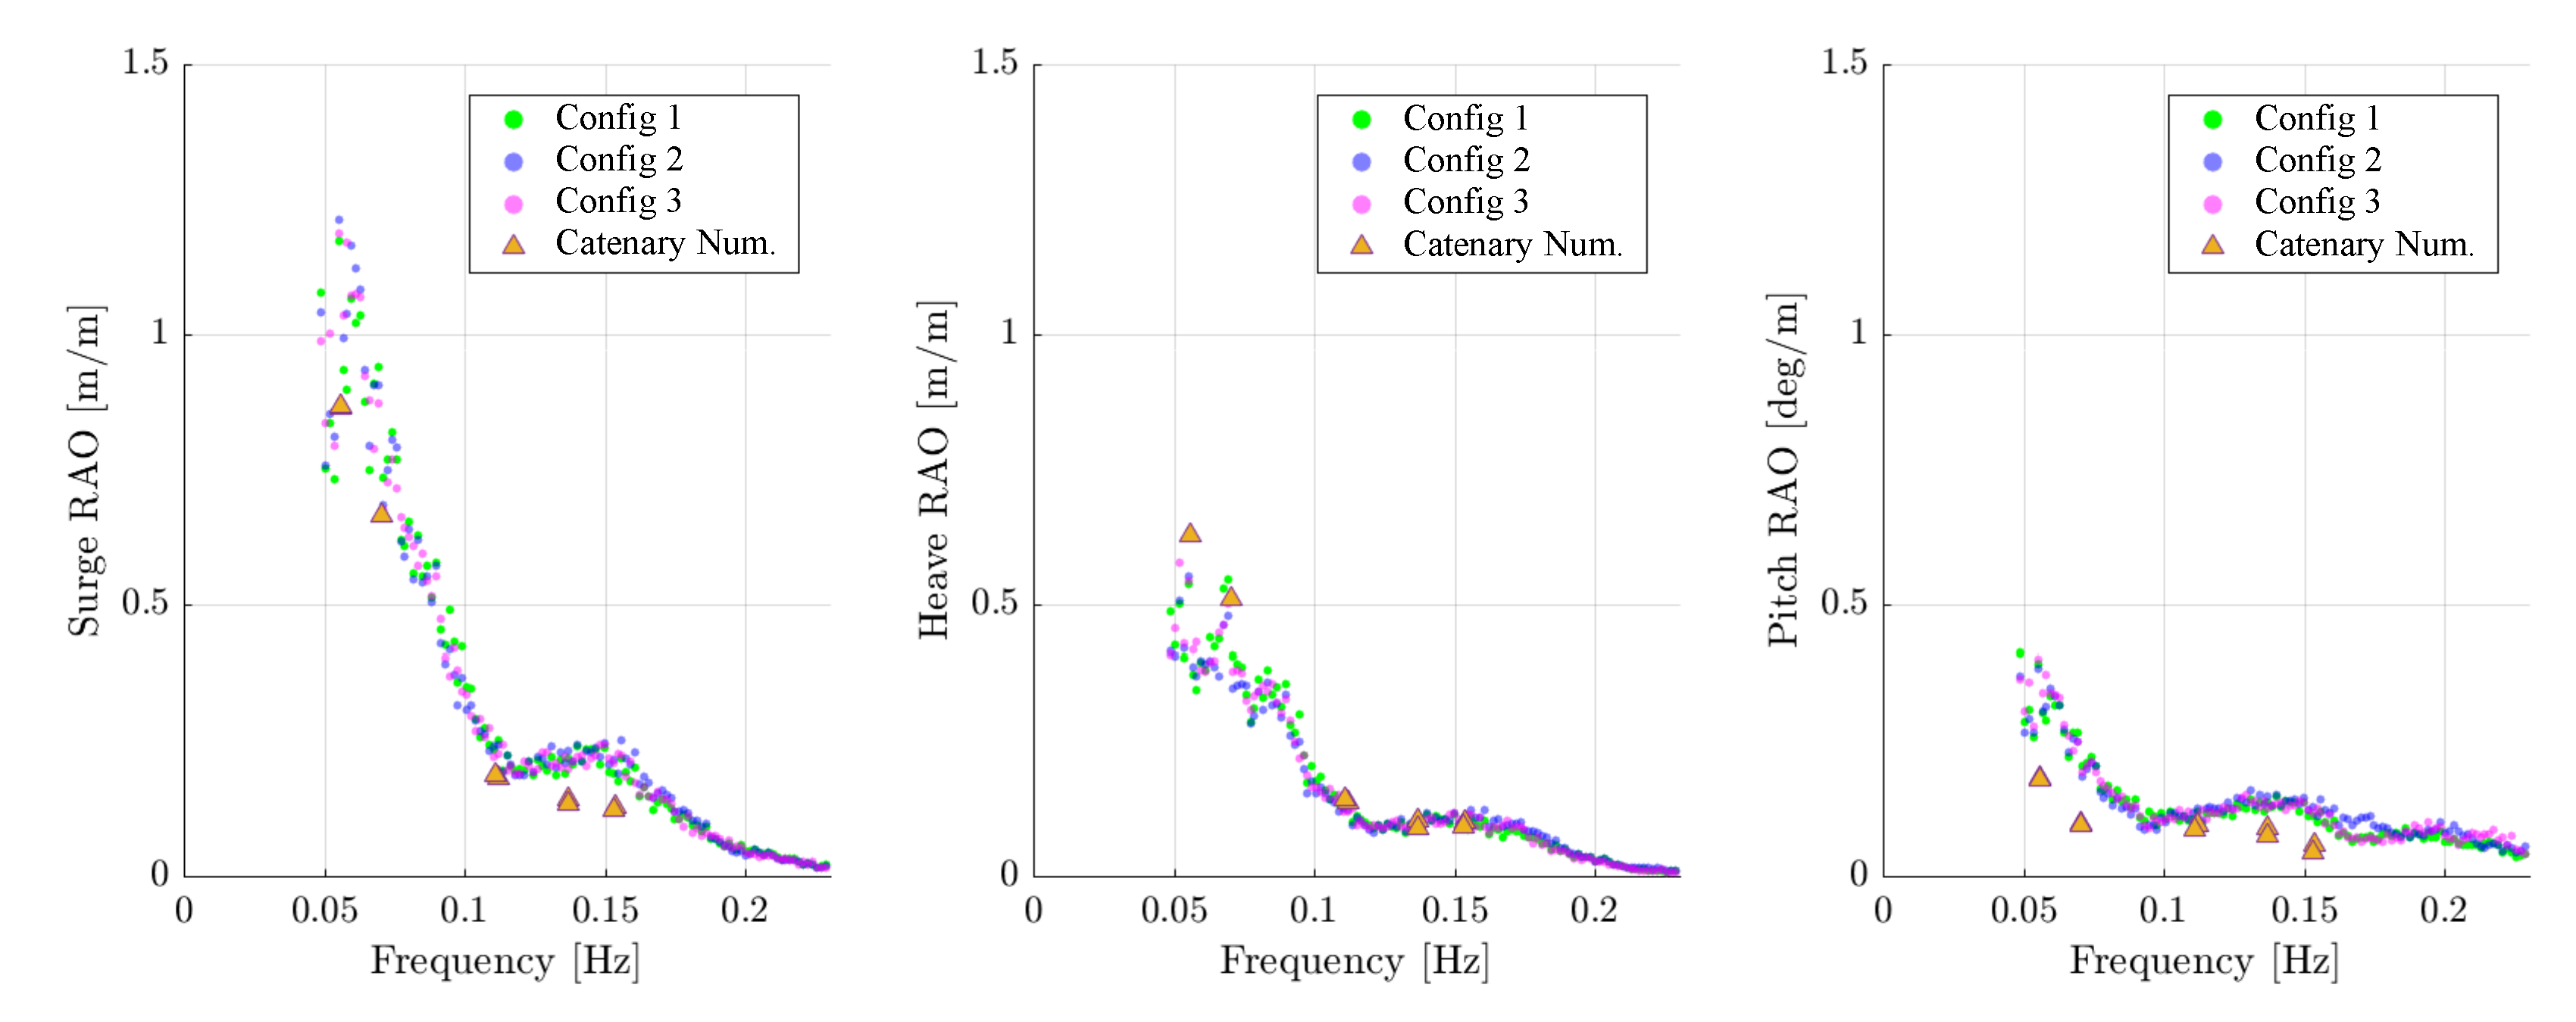
The motion response from the set-ups was captured during the regular and irregular wave tests. The results are plotted as motion RAOs for surge, heave and pitch DOFs wrt. CoG, which compare the results from the experimental irregular wave tests for the three set-ups to the numerical catenary RAOs. The RAOs for the three experimental set-ups were obtained from the frequency domain using the irregular waves with
m and
s, where a bandpass filter was introduced to reduce transient and noise signals focusing on frequencies,
f = 0.049–0.39 Hz. Hence, the RAOs in
Figure 12 is plotted with a minimum cutoff frequency at
Hz which corresponds to highest wave period of interest [
7]. Also, the data was smoothed using moving average to fit the RAOs obtained from the regular wave tests. The RAOs for the catenary mooring configuration were obtained from ten regular waves simulated numerically.
Almost identical RAOs are seen between the experimental set-ups over the frequency band for each of the investigated DOFs. The catenary configuration showed similar motion behavior in surge and heave, but smaller pitch amplitudes were visible, which could be due to the larger vertical force component at the fairleads discussed in
Section 1. As a consequence of higher pitch amplitudes, the tower accelerations are expected to be increased in a taut configuration.
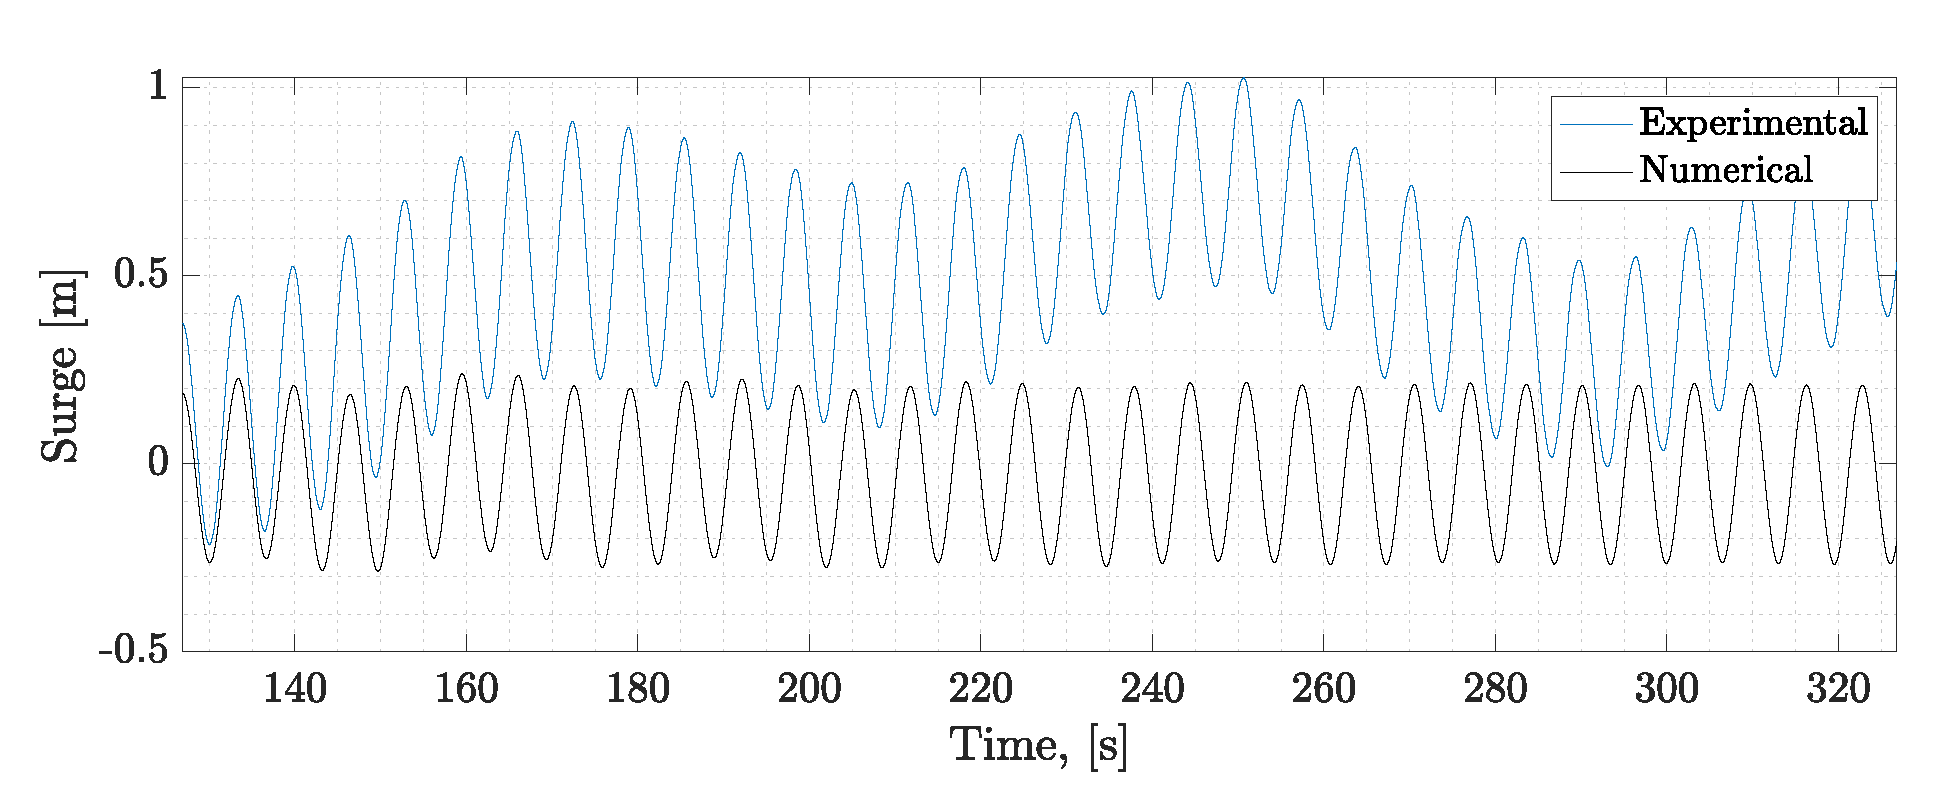
Figure 9 shows the output from EC 6 compared with the numerical results for Config 1. It is interesting to notice that resonance corresponding to the
occurred for this particular wave frequency at 0.15 Hz, as well as mean drift resulting from second order effects. This behavior was not simulated numerically, which will yield underestimated line loads at this wave frequency for the mooring lines as they are a function of horizontal excursions. Further, due to the resonance showed during this regular wave test could explain the higher amplitudes showed in the RAOs around 0.15 Hz in
Figure 12.
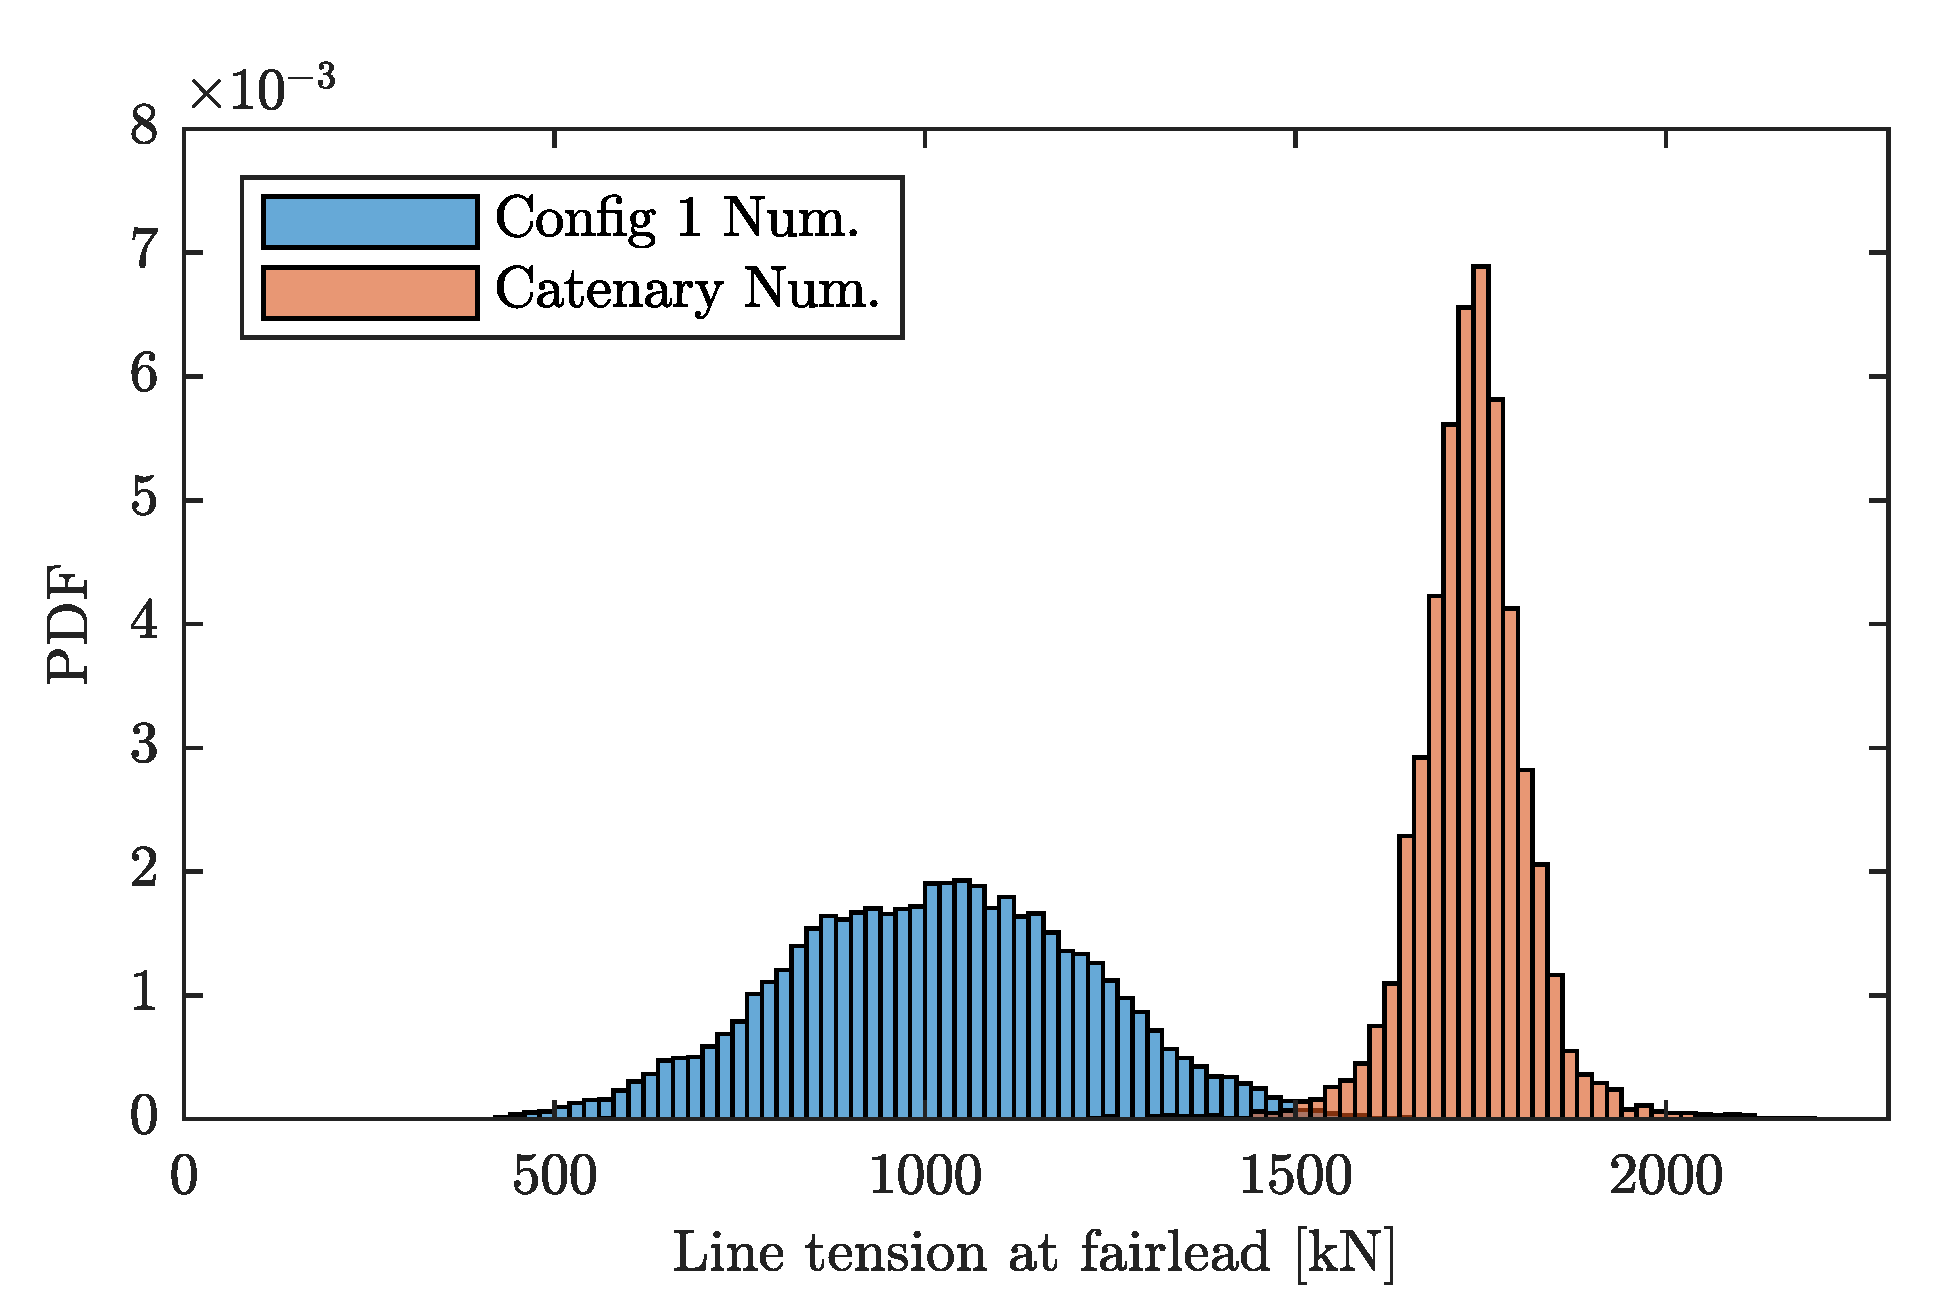
3.4. Tension Response
The tension response was estimated numerically for a 50-year survival wave condition,
m and
s as described in [
7], where the line loads presented in
Figure 13 corresponds to mooring line 3 at fairlead position. A significant load reduction can be seen in the taut mooring set-up compared with the catenary mooring, mainly due to different pretension and mooring line characteristics assuming the same horizontal velocity and acceleration. The arising loads in the taut configuration will be proportional to line elongation, whereas the catenary mooring will experience increased loads when the mooring line is lifted from the seabed. As a consequence, the difference in the minimum and maximum tension forces
are larger for the taut configuration.
would be expected to increase with a more compliant taut configuration as the structure would be allowed larger motion amplitudes and mean drift, thus increasing the risk of fatigue.
4. Discussion
This study has used three different mooring set-ups to experimentally investigate the influence of two parameters, pretension T and the angle , and some experimental uncertainties were present. First, the experiments were performed in a 1:60 model scale, where small uncertainties in the laboratory will have a large effect on the full scale values. In particular, inaccuracy are related to the static test, unstretched line length and the material stiffness as it was measured by hand. Also, the anchor placements will give uncertainty related to the results and since the anchors were relatively large of size they could potentially change the wave field. In the basin, the structure was placed in the deep-water pit and the wave gauges were 1.3 m in front of the structure. Due to the increased water depth in the pit, the waves could potentially be influenced, resulting in smaller wave heights, thus underestimate the RAOs. Further, the chosen line material showed different stiffness after the experiment, which would have an influence to the results. Another key point is that line tensions were not measured due to malfunctioning load cells, which is an important factor in the design of mooring lines. It also means that the pretension of the three set-ups were not correctly presented. Even so, the uncertainties were similar between most of the set-ups and the parameter variations are significantly large, so the parameter effects can be analyzed.
All the taut set-ups showed natural periods outside the wave spectrum, and the results indicated that changing the controlling parameters defined in this paper, led to small variations in the natural periods and motion response. This suggest that the mooring line stiffness,
is the driving parameter for a set geometry as seen in [
5].
Furthermore, the low variation in dynamic responses between the set-ups led to some reduced confidence in the resulting effect by changing the controlling mooring parameters. Although, the relation between the stiffness and periods for each DOF gave changes in the expected direction based on analytical result or otherwise explained by variations in draft. Surge and yaw is of special interest as they only are restored by the mooring stiffness. The surge natural period was additionally justified by experimental stiffness results and yaw was very clear and consistence with the analytical stiffness. Therefore, the result is assumed reliable.
The MoorDyn module was used to achieve the line loads in FAST, which has been verified and validated in [
22] towards experimentally data. Further, numerical software has proved to yield fairly accurate maximum line loads [
23], and that compliant mooring lines can reduce the magnitude of snap and maximum loads significantly [
5]. Unfortunately, no mean drift effect were simulated by the numerical model due to the lack of second order wave kinematic inputs. Consequently, this leads to inaccuracy for the tension results and potential snap loads were not detected, as the lines were not able to go slack. In addition, no current and wind loads were simulated, which will have an impact on the horizontal excursion and the line loads in real environment. Therefore, an improvement for the numerical line tension analysis is desired and the mentioned potential of the numerical program was not achieved. Nevertheless, a positive characteristic is seen from the parameter study to prevent slack lines. A higher horizontal stiffness is easily obtainable, which will reduce mean drift with low influence of the overall dynamics. It is understood to be a fine balance and a limitation will be in the allowed line excursion. Generally, less stiffness in the lines will give smaller loads, but more offset. Paper [
8] showed that the cyclic and peak loads will be halved with twice the compliance, which could reduce the anchor footprint.
Furthermore, the analytical mooring stiffness equations are useful to understand the effect of changing the controlling parameters. They seem to be consistent with the variation between the set-ups. However, at larger excursions and rotations, the non-linearity of the experimental results are not explained well with the linear analytical formulas shown in
Figure 10.
5. Conclusions
This paper dealt with the influence of two parameters for a taut compliant mooring system on a 1:60 10 MW floating offshore wind turbine and the results were compared to a catenary configuration. During the experiment, some uncertainties were present, but the overall behavior proved great potential for the taut compliant mooring lines in terms of the hydrodynamics and maximum line loads. The footprint could be highly reduced and showed a reduction of 2/3 compared with the original catenary station keeping system. The drawback of the investigated configuration were the higher pitch amplitudes in the response amplitude operator, which can be linked to higher accelerations in the tower. However, the angle and pretension had a rather modest influence on the natural periods with the exception of the yaw degree of freedom. With all the above mentioned, the motivation for developing even more compliant materials is evident, as the ease of a final design with low footprint will be more achievable.
A taut configuration with highly compliant mooring lines has, therefore, proved to have a large potential as an alternative to the catenary mooring and further research is encouraged.

 ,
, 


