Article

Development of Competitive–Cooperative Relationships among Mediterranean Cruise Ports since 2000

Faculty of Maritime Studies and Transport, University of Ljubljana, Pot pomorščakov 4, 6320 Portorož, Slovenia
*
Author to whom correspondence should be addressed.
J. Mar. Sci. Eng. 2020, 8(5), 374; https://doi.org/10.3390/jmse8050374
Submission received: 8 May 2020 / Revised: 20 May 2020 / Accepted: 21 May 2020 / Published: 24 May 2020
(This article belongs to the Section Coastal Engineering)

Abstract

:
Cruise shipping has been extremely popular in recent years, and one of the fastest-growing areas has been the Mediterranean. In the paper, we examine the evaluation of possible competitive–cooperative relationships among Mediterranean cruise ports for the period 2000–2017. To this end, we use three models: the dynamic shift-share model, the Lotka–Volterra model (LVM), and the logistic model (LM). The evaluation of basic market indices is included for completeness. The analysis shows that cruise traffic is in a saturation phase. The shift-share and LVM models reveal that interaction among ports is not significant for the large ports, but could be essential for the small ones.

1. Introduction

It is well known that, in the last two decades, cruises have become a significant part of tourism. As a result, the literature on the cruise industry has also become quite extensive. This includes studies, reports, and academic papers dealing with various aspects of cruising, such as the world cruise industry [1,2,3,4,5], cruise tourism [6,7], problems with cruise ‘overtourism’ [8,9], ecological problems of cruise tourism [10,11,12,13,14,15,16] and economic impact of cruise tourism, the geography of cruise tourism [17,18,19], competition and cooperation among ports [20,21,22], port management [23,24], cruise safety and security [25,26], and the socio-economic and demographic composition of a cruise tourists [27]. Despite the extensive literature, there seems to be a lack of effort in modeling the evaluation of cruise traffic to identify the possible cooperation and competition in the cruise market. Exceptionally, Marti [20] analyzed the concentration of port trade volume among ports or the changes in the proportion of market volume by using data from the ports. It demonstrated that each port’s situation must be studied in coordination with relevant situations at competing ports. The added value of this research is that it provides a method (shift-share) for evaluating the competitive dynamics of a port region. The authors in [21] studied the level of concentration among ports in Europe, and indicated that recent developments in the European port system resulted in a stagnation of the level of concentration. Jeronimo and Antonio [22] contributed with results on competitive relationships between cruise ports, where different methodologies were used in order to determine the type of relationships among ports. The results are indicate some advantage to cooperative relationships between the large cruise ports, because the largest ports perceive other ports as collaborators. However, this study doesn’t show the competitive relationships between ports and regions, rather their competitiveness relative to the changes in concentration and trade volume changes.
In this study, we focus on European cruise ports located in the Mediterranean. According to Pallis and Arapi [28] with the advent of globalization in the cruise industry, the Mediterranean and its adjoining seas has grown faster than any other region of the world during the period 2000–2015. Today, this region is the second most popular cruise destination in the world, after the Caribbean region [24].
First, let us clarify some terminologies used in the paper. The cruise market consists of cruise providers that sell cruise routes (destinations) to people (passengers) and ports that host the cruise ships. The cruise market is a system where providers, passengers, and ports operate. For cruise providers, cruise traffic implies the carriage of passengers, whereas for ports, it implies the movements of the cruise ships and the passengers (home in, home out, and transit passengers, i.e., passenger traffic). In this study, we focus on port cruise traffic.
Nowadays, reports provided by most port authorities include passenger traffic data, which we consider as the main indicator of port cruise traffic. We use data from reports by port authorities and passenger traffic data provided by various organizations [29,30]. There are other indicators of port cruise traffic, such as a number of calls and a number of arrivals of ships, but these data are either scattered or too hard to obtain. Moreover, passenger traffic data are inconsistent; that is, they differ across sources and at times, within the same sources.
This study aims to examine the interrelationship among ports and among regions that are a part of the cruise market in the Mediterranean Sea since the year 2000. The objective of this study is to model the evaluation of cruise traffic and to identify the possibilities for cooperation and competition in the cruise market. The methodology is based on three models that are used in this study: dynamic shift-share model, the Lotka–Volterra competition model, and the logistics model. The purpose of the shift-share model is to identify the changes in cruise traffic by assuming that competitors, that is, ports and regions, retain their initial market share. Then we use a dynamic shift-share model [31], which, unlike the static two-year model, considers every year in a given period. This approach helps reduce the effects of the given starting and ending years. We use the second model—the Lotka–Volterra competition model (LVM)—to identify interactions among competitors with respect to competitor’s growth rate. As both the above models provide a snapshot of the relationships that have developed over the observed period, they should not be considered as a method of forecasting (Esteban-Marquillas 1972). However, LVM provides an estimate of the final capacity of competitors. Third, the logistic model (LM), which is a special case of the LVM with no interaction among competitors. The LM will serve to evaluate the actual interactions among competitors.
This paper is organized as follows: In Section 2, we provide an overview of ports’ cruise traffic in the Mediterranean Sea by including the evaluation of various basic market indicators. We conduct the dynamic shift-share analysis for regions, ports, and ports in different regions. The LVM and LM we apply to three dominant regions: the West Mediterranean, the Adriatic Sea, and the East Mediterranean (including three of the largest ports in the West Mediterranean: Barcelona, Civitavecchia, and the Balearic Islands and the two largest ports in the Adriatic Sea: Venice and Dubrovnik). In Section 3, we summarize the results. In Section 4, we provide critical remarks about the methods used in the study.
In the following, we abbreviate passengers as “Pax.” We classify the ports as following:
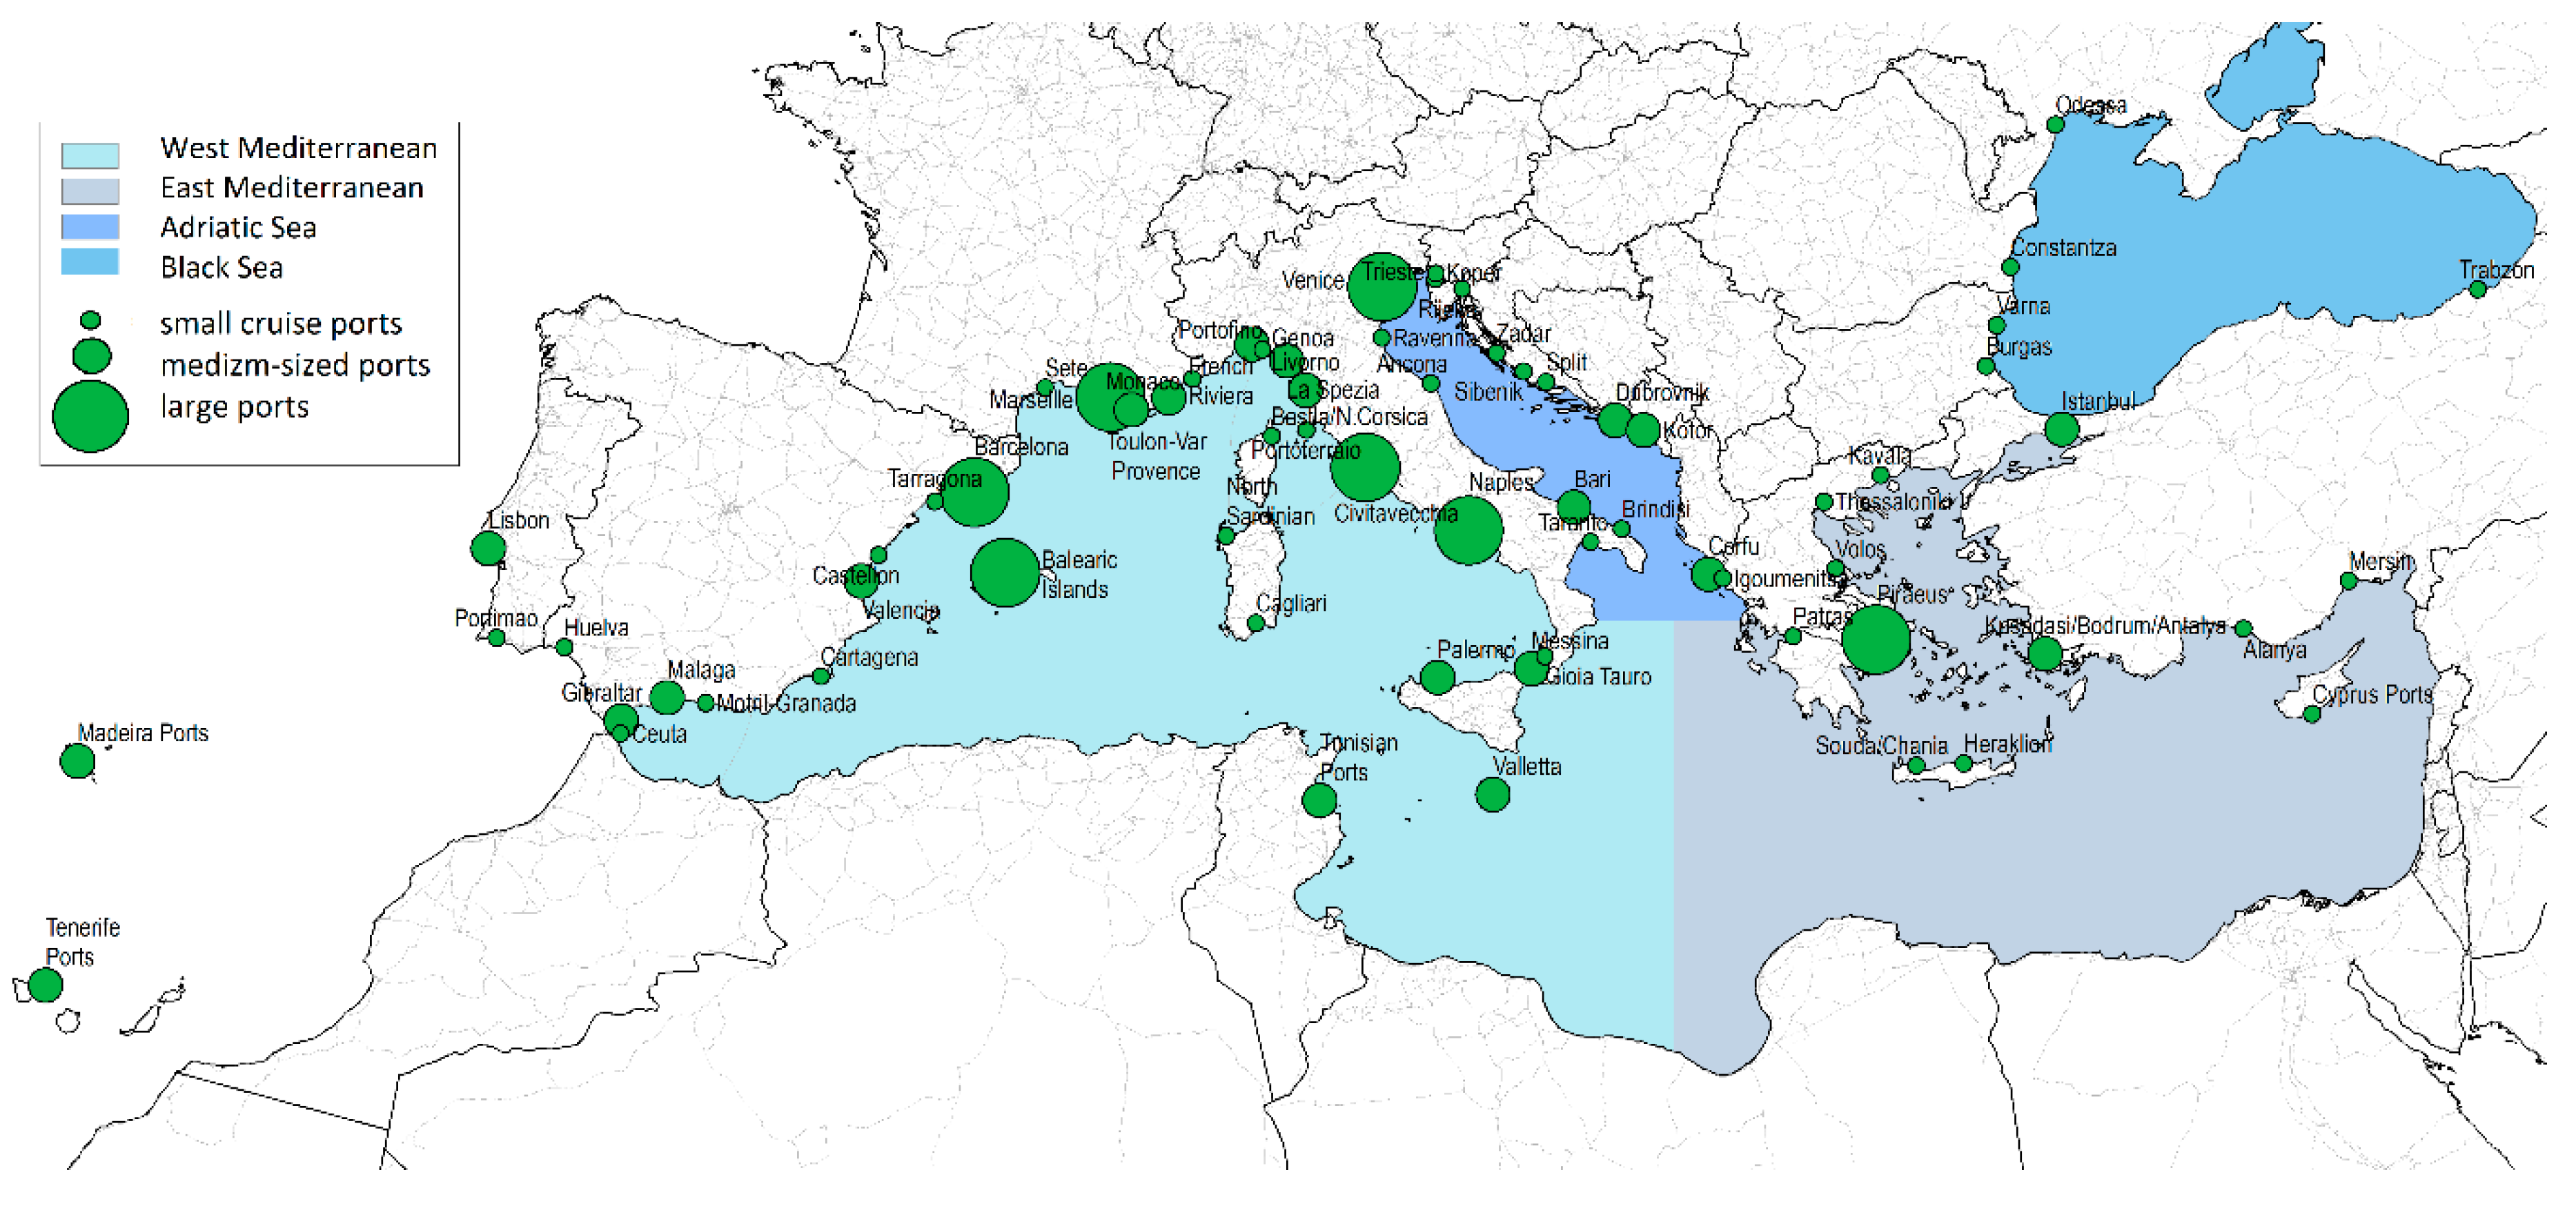
  • ports with more than 0.8 million Pax per year are large ports
  • ports with 0.2 to 0.8 million Pax per year are medium-sized ports
  • ports with less than 0.2 million Pax per year are small cruise ports
As regards the Mediterranean, a large port is one with more than 4% of market share, while a small port is one with less than 1% of market share (see below).

2. Materials and Methods

In this section we present an overview that includes a division of the Mediterranean Sea, basic cruise market metrics, and methods used.

2.1. An Overview

The Mediterranean ports can be divided into four regions (Figure 1), the West Mediterranean (WM), the East Mediterranean (EM), the Adriatic Sea (AS), and the Black Sea (BS) [18]. In general, we do not include the Southern Mediterranean, but among the WM ports, we include the Tunisian ports and the ports in the Atlantic Ocean, that is, the Tenerife ports in Spain and Lisbon and Madeira ports in Portugal, as they are included in some cruise tours.
According to MedCruise [29] in 2017, total Pax movement was 25.2 million, and the number of deployed vessels was 363, representing 15.8% of the world cruise fleet. In 2017, there were 42 companies that owned 136 vessels with a capacity of 3.8 million Pax operating in this region. Thus, according to the ABC method estimations, the market is highly concentrated with 20% of the companies having 76% of the capacity.
Table 1 lists the top 15 ports, i.e., ports with the highest Pax in the Mediterranean region. These ports account for about 70% of the cruise market. The top two ports are Barcelona and Civitavecchia in the WM region. Compared to 2010, Marseille made the most significant jump from 12th to 4th place, while Dubrovnik made the most significant drop from 7th to 11th place. The table also shows the advance of Valetta, Kotor, and Corfu into the top 15 list, replacing the Tunisian and Turkish ports.

2.2. Basic Cruise Traffic Metrics

The calculation of the basic cruise traffic metrics [32] is based on the data in Table 2. A more comprehensive statistical analysis—including, but not limited to, annual market growth, market share, market concentration, seasonal analysis, and forecasting—is provided by some port authorities and specialized organizations [30,33].
As shown in Table 2, the WM ports have the most Pax in the period 2010–2017. In this period, the AS and EM regions were ranked second and third, respectively, based on total Pax. The BS region has an almost negligible number of Pax at all times. The total number of Pax was 340 million, with the WM accounting for 71% of market share and the AS, EM, and BS regions accounting for 16%, 12%, and less than 1%, respectively.
As the number of ports in the various regions is different, we calculate the average Pax per port and normalize it in terms of the average Pax of the WM ports to compare the performance of the ports of these regions. The results are shown in Figure 2, which indicates that on average the AS ports account for approximately 68% of the average number of Pax of WM ports, while the EM ports and BS account for 44% and 4%, respectively. Thus, the WM, in addition to being the largest region, also has on average more Pax per port compared to ports in the other regions.
Another indicator of cruise traffic dynamic is the evaluation of growth indexes (number of Pax normalized in the year 2000), as shown in Figure 3. The AS region has the highest growth index, which, in 2013, reached a peak of more than 900%. The growth index of the BS region in 2012 dropped considerably due to uncertain geopolitical and economic situations. In 2015, a similar drop was observed for the EM region, which may also be a result of complicated political, economic, and social conditions in the Middle East.
Figure 4 shows the annual growth rate (AGR) of the cruise market in the Mediterranean. We see that the AGR, according to the trend line, dropped from about 20% in 2000 to about −5% in 2017, indicating a slowdown in the market. The results are similar for the other regions as well. Thus, in the observed period, the AGRs of the WM and AS regions dropped from 12% to −4% and 69% to 1%, respectively.
Figure 5 shows the cruise market share of the different regions. In the observed period, the WM region accounts for about 71% of market share, while the AS and EM regions accounts for about 15% and 13%, respectively. The BS region accounts for less than 1% of market share. The graphs indicate that from 2014 the market share of the WM and AS regions increased to about 76% and 17%, respectively, while that of the EM region decreased to about 7%.
We combine the average annual growth rate and market share into a Boston Consulting Group (BCG) matrix (Farris 2009), which is shown in Figure 6. We used the BCG matrix to evaluate the portfolio of the cruise regions in the Mediterranean Sea. In the matrix, the four regions are positioned according to their market share and annual growth rate of two consecutive four-year periods: 2010–2013 and 2014–2017. The figure indicates that all the regions retained their average market shares and average Pax movements. However, their average annual growth rates decreased, thus indicating a possible steady development of the market in the future. According to the BCG-matrix, the AS and EM regions fell from “wild cats” with a high growth prospect but a low market share to “dogs” since they lost their average growth rate, while the WM region fell from “stars” with the best market share and a good growth rate to “cash cows” that are leaders in the market share but have a low average growth rate.

2.3. Cruise Market Concentration

To estimate the concentration of the cruise market in the Mediterranean cruise ports we use the Lorentz concentration curve [21] and the Herfindahl–Hirschman Index (HHI), which is defined [21,34].
H H I = Σ i = 1 n P i 2 Σ i = 1 n P i ,   1 n H H I 1 ,
where Pi is total Pax in port i and n is the number of ports in the cruise port system. The higher the HHI, the higher is the market concentration. When HHI is equal to one, it indicates full concentration, that is, one port gains the entire cruise market. If all ports have the same market share, then HHI = 1/n. Thus, its inverse, ne = 1/HHI, describes an equivalent cruise market with ne ports having the same market share. Thus, ne is interpreted as the number of dominant ports in the market. For the practical calculation we used MS Excel.
Figure 7 shows the Lorentz concentration curves for the periods 2010–2013 and 2014–2017. For both the periods, the concentration of cruise ships is practically the same: approximately 20% of the ports (about 15 ports) receive 70% of total Pax, while approximately 50% of the ports receive 95% of the Pax traffic. A similar situation can be observed in the whole market for the AS and EM regions (Figure 8). The market concentration for the WM region is slightly lower (30% of the ports hold 70% of the market). It is even lower for the BS region, where 40% of ports hold 70% of market share.
Figure 9 shows the change in market concentration described by HHI. The HHI of all the regions and the WM region are steady and relatively low (HHI ≈ 0.04 and HHI ≈ 0.07), implying that cruise traffic is not concentrated. This shows that the cruise market in the Mediterranean is dominated by about 25 ports (out of 69 ports), of which about 15 ports (out of 36 ports) are in the WM region. The HHI for the AS and EM regions was slightly above 0.2 until 2015, that is, there was moderate cruise traffic concentration. This implies that there were five main ports (out of 15 and 13 ports, respectively) in each region. After 2015, the HHI for the AS region began decreasing gradually, that is, the traffic became less concentrated. However, the HHI for the EM region increased to about 0.4, implying that traffic became more concentrated with only two dominant ports/port complexes: Piraeus in Greece and the group of Turkish ports of Kusadasi/Bodrum/Antalya.

2.4. Shift-Share Analysis

Consider n regions or ports that are competitors in a system. Pi,t is Pax traffic of competitor i at time t. The total Pax within the system in time t is:
P t = i = 1 n P i , t
while the market share MSi,t of competitor i in time t is:
M S i , t = P i . t P t × 100 %
The shift-share model stipulates that Pi,t may be decomposed into the form:
P i , t = S H A R E i , t + S H I F T i , t
where:
S H A R E i , t = M S i , t 1 × P i ,     ( i = 1 , n )
and   S H I F T i , t = ( M S i , t M S i , t 1 ) × P t
Equation (4) indicates that the share effect describes the expected growth in Pax of a competitor in a way that its current market share is maintained. The shift reflects the total traffic gained or lost by a competitor in its competition with other stakeholders in the system. We will use the following percentage values in the Tables 6 and 7 below.
% S H A R E i , t = S H A R E i , t P i , t × 100 % ,     % S H I F T i , t = S H I F T i , t P i , t × 100 % ,
The former gives the percentage of expected share in terms of actual Pax of a competitor, while the latter gives the percentage of shift of actual Pax of the competitor.

2.4.1. Competition Among Regions

The results of the region’s shift-share analysis are shown in Figure 10. The figure shows that the shifting of Pax is not a steady process, that is, no region either gains or loses Pax permanently. For example, the WM region, which gained 2.1 million Pax in 2014–2017, lost 0.2 million Pax in 2010–2013. Similarly, the AS region gained 0.9 million Pax in 2010–2013, but lost about 0.3 million Pax in 2014–2017. In the period 2001–2017, the EM region lost the highest number of Pax (2.8 million Pax), while the WM region gained the highest number of Pax (1.64 million Pax) (Figure 11). This shift of Pax from the EM region represents a loss of approximately 6% of total Pax during this period. However, the shift of Pax to the WM region was not significant as it represented only 0.7% of total Pax during this period.
We note that the total Pax traffic in the system for the period 2001–2017 was about 330 million Pax and the total shift of Pax was about 3 million Pax, which is less than 1% of total Pax traffic during the period. The above situation is depicted in Figure 12, which also depicts the cruise market stability index [35], i.e., a relative shift of the Pax traffic. Although the evaluation of the index is not steady, its value is relatively low. We can see that on average in a year, about 2% of the total Pax shifts among regions, implying that the market is relatively stable.

2.4.2. Competition Among Ports

The results of the dynamic shift-share analysis of cruise ports for the period 2011–2017, when their regional location is not taken into account for the period 2011–2017 are shown in Table 3, Table 4, Table 5 and Table 6.
Table 3 displays the ports that have gained and those that have lost the most number of Pax in the period. We note that the ports of the Balearic Islands have gained the most number of Pax twice, while the Tunisian ports lost the most number of Pax twice.
Table 4 shows the list of nine ports that gained about 70% of the total Pax in the period 2011–2017. Most of the Pax were gained by large ports like Marseille (0.78 million Pax) and the Balearic Islands (0.47 Mio Pax). However, medium-sized and small cruise ports like the Italian ports of La Spezia and Cagliari and Kotor in Montenegro were the most successful in relative terms with shift of Pax to these ports accounting for about 15% of its total Pax traffic.
Table 5 shows the list of cruise ports that lost about 70% of total Pax in the period 2011–2017. The large cruise ports in this list include Dubrovnik, Naples, and Venice, which lost about 0.2 to 0.3 million Pax. However, the Tunisian ports (36% of its total Pax) and ports of Cyprus and Istanbul (about 15% of their total Pax) lost the most number of Pax in relative terms.
Figure 13 illustrates the shift-share dynamics of the ports through the evaluation of share and cumulative share of the four largest cruise ports: Barcelona, Civitavecchia, Balearic Islands, and Venice. As regards regions, it can be observed that shift-share is not steady for the ports. Nevertheless, from 2012 onwards the Balearic Islands have gained the most Pax every year. Barcelona has witnessed a positive shift every year as well. Figure 14 shows that three ports, Barcelona, Civitavecchia, and the Balearic Islands, have gained Pax from 2012 onwards. The results are similar for the entire period of 2011–2017 (Figure 14). All three ports gained Pax, but the Balearic Islands gained the most number of Pax (0.5 million Pax). However, Venice lost about 0.3 million Pax.

2.4.3. Competition Among Ports in Different Regions

Let Pjk,t be total Pax in port j in region k at time t. The total Pax Pk,t in region k at time t is:
P k , t = Σ j = 1 n k P j k , t
If we introduce regional market share MSi,t, regional port share RMSjk,t, and total port share MSjk,t, that is,
M S i , t = P i , t P t × 100 % ,   R M S j k , t = P j k , t P k , t × 100 % , M S j k , t = P j k , t P t × 100 %
then total Pax per port can be decomposed as follows [1]:
P j k , t = S H A R E j k , t + P R O S F T j k , t + D I F F S F T j k , t
where:
S H A R E j k , t M S j k , t 1 × P t
P R O S F T j k , t ( R M S j k , t 1 M S k , t M S j k , t 1 ) × P t ,   ( proportional   shift )
D I F F S F T j k , t = ( R M S j k , t R M S j k , t 1 ) × P k , t ,   ( differential   shift )
The total shift, SHIFTjk,t, in this case is:
S H I F T j k , t = P R O S F T j k , t + D I F F S F T j k , t
The share and total shift have the same interpretation as in the previous case. The proportional shift reflects the competitive effect among regions. The differential shift is a competitive effect among ports in a region. We show relative values in the Tables 6 and 7.
% P R O P S F T j k , t = P R O P S F T j k , t P j k , t × 100 % ,   % D I F F S F T j k , t = D I F F S F T j k , t P j k , t × 100 %
where % P R O P S F T j k , t gives the percentage of differential shifts of total Pax per port and % D I F F S F T j k , t gives the percentage of differential shift to total Pax per port.
The results of the analysis are summarized in Table 6. The proportional shift for the WM region is positive in the case of all the listed ports, implying that the region is attractive. However, differential shift reveals possible competition among ports in the region. The most successful port in the region is Marseille (7.4%), while the most unsuccessful is Malaga (−6.7%). As regards the largest ports, Barcelona and Civitavecchia, the shift represents only about 1% of their total Pax. In contrast, for Marseille, it represents about 9% of its total Pax.
Among the top ports in the AS region, Venice, Dubrovnik, and Corfu, Corfu indicates a positive differential shift, implying that it is attractive, while the other two ports indicate a negative differential shift, that is, they have lost Pax to other ports in the region. Dubrovnik lost the most Pax (−4.1%). The ports in the EM region show a negative proportional shift, indicating regional decline, but among the largest ports in the region, Piraeus has shown the most significant differential shift (5.8%), which implies that the port has gained Pax to other ports in the region.
Possible regional competition results in relatively small differential shift for the top ports and substantial differential shift for the small ports. Table 7 shows the list of ports that have gained more than 10% of its total Pax due to differential shift. The medium-sized ports in the list include Kotor in Montenegro (the AS region) and La Spezia in Italy (the WM region), which gained about 15% of their total Pax each.

2.5. Lotka–Volterra Model (LVM)

In this section, we will use the Lotka–Volterra competition model to identify possible relationships among regions and ports, that is, competitors. We use the autonomous LVM in the following form [36,37,38,39,40].
d x i d t = a i x i + j = 1 n b i j x i x j ( i = 1 , , n )
where n is the number of competitors, t is time, x i = x i ( t ) is Pax of competitor i at time t, ai denotes growth rate coefficients, and bij denotes interaction (cooperation) coefficients. The equation shows that positive coefficients increase the growth rate of a competitor, while negative coefficient decreases it. The role of the interaction coefficients is explained in Table 8.
Once the coefficients are estimated, we can calculate the stationary point, that is, the capacity ci of each competitor, by solving for ci in the following [39]:
j = 1 n b i j c j = a i
When Pax history of each competitor is given, then Equation (16) presents a regression problem in estimating the unknown coefficients. We use the least-squares method to resolve this problem [40]. We note that the LVM model is useful for a small number of competitors because the number of unknown coefficients increases by n 2 + n . As we have a time series of 18 years, we can include at most three competitors in the model.

2.6. Logistic Model (LM)

In the special case when all interaction coefficients except the diagonal one are zero, the LVM can be reduced to a set of logistic equations:
d x i d t = a i x i + b i i x i 2   ,   ( i = 1 , , n )
These equations have a closed-form solution, that is, logistic function:
x i = c i 1 + e a i ( t t 0 , i )
where t0,i is integration constant and c i a i b i i is capacity of port i. When x is given then Equation (19) becomes a nonlinear regression problem for the determination of ai, ci, and t0. We identify Pax fitted by Equation (19) as the Logistic model (LM).
In the following, we use both regressions. We use the coefficients of determination R2 to measure the goodness of fit. The comparison of values of R2 for the LVM and LM will indicate which model is better—that is, whether there is any essential interaction among the observed regions or they evolve independently of other competitors.

3. Results of LVM and LM Competition-Cooperation Analysis with Discussion

3.1. Competition Among Regions

We use historical data on total Pax for the period 2000–2017. Among the four regions, we exclude the BS region because its market share is negligible. The results of the calculations are shown in Figure 15. The R2 values in Table 9 show that both fits are acceptable. The fit with the LVM and LM gives similar results, but the LVM for the WM and AS regions give a slightly higher value of R2, indicating that there is possible interaction among the observed regions. The table shows that the LVM predicts a slightly higher capacity of the regions. Taking both LVM and LM into account, we can estimate that the long term capacity of the WM region ranges from about 22 to 29 million Pax per year, while those of the AS and the EM regions range from about five to seven million and three to four million Pax per year, respectively.
Table 10 shows the competition relationships among regions. The WM region is in strong competition with the AS region, while it is in strong cooperation with the EM region. On the other hand, the interaction of the AS region with the WM and EM regions is very limited. This shows that the AS region is autonomous. The table also shows that the EM region is in very strong competition with the AS region. In the terminology of the LVM, we can say that the WM region is a “prey” of the AS region, while the WM and EM regions have a “win–win” situation.

3.2. Competition–Cooperation Among Barcelona, Civitavecchia, and the Balearic Islands

Barcelona, Civitavecchia, and the Balearic Islands were the most visited ports in the last two decades, accounting for about 25% of total Pax and 35% of Pax in the WM regional. Figure 16, which depicts the LVM and LM fits of the Pax data, shows that Barcelona and Civitavecchia are in the saturation phase, while the Balearic Islands are in the initial growth phase. Table 11 shows that all the regressions are acceptable as they have R2 values greater than 0.9. As all the R2 values are similar for both the LVM and the LM, the competition effect among these ports is ambiguous and hardly distinguishable between the models. Moreover, the predicted long term capacity of the ports is the same, 2.6 to 2.9 million Pax for Barcelona and 2.4 to 3 million Pax for Civitavecchia. As regards the Balearic Islands, the predicted capacity differs substantially. The LVM predicts that after the initial growth phase, its capacity will fall to about one million Pax, while the LM predicts a final capacity of about 4.5 million Pax. However, as these are long-term predictions, one should exercise caution while considering them.
If we accept the LVM regression, then as per Table 12, which shows the normalized interaction parameters, Barcelona is in strong competition with the Balearic Islands and very strong competition with Civitavecchia. On the other hand, the presence of Barcelona increases the growth rate of Civitavecchia. In the terminology of the LVM, Barcelona is a “prey” of Civitavecchia and Venice, while Civitavecchia is a “predator” of Barcelona. In other words, all the ports are in competitive relationships.

3.3. Competition-Cooperation Among Two Main Competitors in Adriatic Sea

The results show that the key market indicators in Mediterranean cruise traffic are decreasing, meaning that evaluation of basic market indicators are indicating on slowing down of cruise market, but the market share of the different regions is remaining steady. This observation is confirmed by the LVM and LM, which shows that cruise traffic in these regions is in the saturation phase.
Let us consider the competition between two of the biggest ports in the AS region, Venice and Dubrovnik. These ports hold more than 50% of the regional cruise traffic. Figure 17 shows the fit of the historical data for the period 2000–2018. It shows that unlike the Barcelona–Civitavecchia–Balearic Islands competition, the LVM and LM are substantially different in this case. Table 13 reveals that the fit with the LVM has a higher value of R2 (>0.95), indicating interdependence between the ports’ Pax traffic. Table 14 shows that the presence of Dubrovnik increases the growth rate of Venice and the presence of Venice lowers the growth rate of Dubrovnik. In the terminology of the LVM, Dubrovnik is a “prey” of Venice. The estimated long term capacity of Venice and Dubrovnik are about 1.4 million and 0.7 million Pax, respectively. The LM gives R2 values that are about 20% greater than those of the LVM.
By performing a long-term estimation using the LVM and LM we found that in the future, if external conditions remain the same, the WM region will account for about 72% of the total Pax traffic, while the AS and EM regions will account for 18% and 10% each. When we compared the biggest (by Pax movement) cruise ports in the Mediterranean Sea (Barcelona, Civitavecchia and the Balearic Islands) we found that all ports are in competitive relationships, where Barcelona is in a strong competition with the Balearic Islands and in a very strong competition with Civitavecchia. While the situation in the AS is different, the data shows that the presence of Dubrovnik increases the growth rate of Venice and the presence of Venice lowers the growth rate of Dubrovnik. In the terminology of the LVM, Dubrovnik operates as “prey” in regard to Venice.

4. Conclusions

In 2000–2017 the Mediterranean region was the second most popular cruise destination after the Caribbean region [24], with a total Pax movement of 25.2 million [29] in 2017. In this study, we examine the competitive–cooperative relationship among ports and regions involved in the cruise market in the Mediterranean Sea.
The cruise sector is an increasingly important part of tourism in the countries of the Mediterranean, where ports (but also regions) compete with each other. For this reason, we modeled the evaluation of cruise traffic in this area. We tried to identify the possibilities for cooperation and competition in the cruise market. The analyses performed demonstrated how this market will behave in the coming years, whether there are any opportunities for the development of existing ports and where the concentration is already so high that we can expect changes. For a deeper analysis of the relations between the ports, we divided the ports into four regions: the West Mediterranean (WM), the East Mediterranean (EM), the Adriatic Sea (AS), and the Black Sea (BS) [18].
As the WM region (including the ports of Barcelona, Civitavecchia, Marseille and the Balearic Islands) is the most important region in the Mediterranean Sea, with 71% of the market share, it was very difficult to compare the traffic in the Pax between this region and others.
When we look at the market as a whole, we can say that it is moderately concentrated (about 21% of the ports receive 70% of Pax traffic). This is true for the WM and AS regions as well, but the EM region is becoming highly concentrated.
With the shift-share analysis, we show that the shift of Pax has a substantial effect on small cruise ports and not on large ports. Due to the shift of Pax shift, the top ports have gained slightly more than 1% of their total Pax traffic, but this change can be attributed to random Pax fluctuations and not interactions among ports.
As the LVM and LM give similar results, it is hard to decide whether the regions or ports evolve autonomously or through interaction. The exception is the interaction between Venice and Dubrovnik, with the LVM revealing strong competition between them. For this reason, we can conclude that there have been competitive–cooperative relationships among Mediterranean cruise ports between 2000 and 2017 and that we can expect a similar situation in the next year if nothing significant happens on the market. Ports need one another because of the itineraries that are the backbone of the shipping industry; for this reason, there are complex cooperative/competitive relationships among them [24].
The cruise market and the situation in the cruise ports will change because of the new legislation (Venice) and this will redirect the biggest cruise ships to other ports. Perhaps the new destinations will be more and more attractive (like what happened in Zadar last year and before that in Kotor as well), and these changes will be interesting for future works.

Author Contributions

Conceptualization, V.L., E.T. and M.B.; methodology, M.B.; writing—original draft preparation, V.L., E.T. and M.B. All authors have read and agreed to the published version of the manuscript.

Funding

This research received no external funding.

Conflicts of Interest

The authors declare no conflict of interest.

References

  1. Brida, J.G.; Aguirre, S. Cruise Tourism: Economic, Socio-Cultural and Environmental Impacts. Int. J. Leis. Tour. Mark. 2009, 1, 205–226. [Google Scholar] [CrossRef]
  2. Lekakou, M.; Pallis, A.; Vaggelas, G. Which homeport in Europe: The cruise industry’s selection criteria. Tour. Int. Multidiscip. J. Tour. 2009, 4, 215–240. [Google Scholar]
  3. Soriani, S.; Bertazzon, S.; Cesare, F.D.; Rech, G. Cruising in the Mediterranean: Structural aspects and evolutionary trends. Marit. Policy Manag. 2009, 36, 235–251. [Google Scholar] [CrossRef]
  4. Pallis, A. Cruise Shipping and Urban Development: State of the Art of the Industry and Cruise Ports; International Transport Forum Discussion Papers (No. 2015-14); OECD Publishing: Chios, Greece, 2015. [Google Scholar]
  5. Rodrigue, J.-P.; Notteboom, T. The Cruise Industry. In The Geography of Transport Systems, 3rd ed.; Rodrigue, J.-P., Ed.; Routledge: New York, NY, USA, 2017. [Google Scholar]
  6. Asero, V.; Skonieczny, S. Cruise Tourism and Sustainability in the Mediterranean. Destination Venice. In Mobilities, Tourism and Travel Behavior—Contexts and Boundaries; Butowski, L., Ed.; IntechOpen: London, UK, 2018. [Google Scholar]
  7. Cruise Ship Tourism, 2nd ed.; Dowling, R.K. (Ed.) CAB International: Wallingford, UK, 2017. [Google Scholar]
  8. González, A. Venice: The problem of overtourism and the impact of cruises. Investig. Reg. 2018, 2018, 35–51. [Google Scholar]
  9. Rosa-Jiménez, C.; Perea-Medina, B.; Andrade, M.J.; Nebot, N. An examination of the territorial imbalance of the cruising activity in the main Mediterranean port destinations: Effects on sustainable transport. J. Transp. Geogr. 2018, 68, 94–101. [Google Scholar] [CrossRef]
  10. Johnson, D. Environmentally sustainable cruise tourism: A reality check. Mar. Policy 2002, 26, 261–270. [Google Scholar] [CrossRef]
  11. Butt, N. The impact of cruise ship generated waste on home ports and ports of call: A study of Southampton. Mar. Policy 2007, 31, 591–598. [Google Scholar] [CrossRef]
  12. Tzannatos, E. Ship emissions and their externalities for the port of Piraeus—Greece. Atmos. Environ. 2010, 44, 400–407. [Google Scholar] [CrossRef]
  13. Carić, H.; Mackelworth, P. Cruise tourism environmental impacts—The perspective from the Adriatic Sea. Ocean Coast. Manag. 2014, 102, 350–363. [Google Scholar] [CrossRef]
  14. Pallis, A.; Papachristou, A.; Platias, C. Environmental policies and practices in Cruise Ports: Waste reception facilities in the Med. SPOUDAI J. Econ. Bus. 2017, 67, 54–70. [Google Scholar]
  15. Pallis, A.; Vaggelas, G. Chapter 13—Cruise Shipping and Green Ports: A strategic Challenge. In Green Ports. Inland and Seaside Sustainable Transportation Strategies; Bergqvist, R., Monios, J., Eds.; Elsevier: Amsterdam, The Netherlands, 2019; pp. 255–273. [Google Scholar]
  16. Paiano, A.; Crovella, T.; Lagioia, G. Managing sustainable practices in cruise tourism: The assessment of carbon footprint and waste of water and beverage packaging. Tour. Manag. 2020, 77, 104016. [Google Scholar] [CrossRef]
  17. Rodrigue, J.-P.; Notteboom, T. The geography of cruise shipping: Itineraries, capacity deployment and ports of call. In Proceedings of the Atti Della IAME 2012 Conference, Taipei, Taiwan, 14–15 June 2012; pp. 6–8. [Google Scholar]
  18. Rodrigue, J.-P.; Notteboom, T. The geography of cruises: Itineraries, not destinations. Appl. Geogr. 2013, 38, 31–42. [Google Scholar] [CrossRef]
  19. Tsiotas, D.; Niavis, S.; Sdrolias, L. Operational and geographical dynamics of ports in the topology of cruise networks: The case of Mediterranean. J. Transp. Geogr. 2018, 72, 23–35. [Google Scholar] [CrossRef]
  20. Marti, B.E. Shift-share analysis and port geography: A New England example. Marit. Policy Manag. 1982, 9, 241–250. [Google Scholar] [CrossRef]
  21. Notteboom, T.E. Concentration and load centre development in the European container port system. J. Transp. Geogr. 1997, 5, 99–115. [Google Scholar] [CrossRef]
  22. Jeronimo, E.-P.; Antonio, G.-S. Dynamism Patterns of Western Mediterranean Cruise Ports and the Coopetition Relationships Between Major Cruise Ports. Pol. Marit. Res. 2018, 25, 51–60. [Google Scholar]
  23. Castillo-Manzano, J.I.; Fageda, X.; Gonzalez-Laxe, F. An analysis of the determinants of cruise traffic: An empirical application to the Spanish port system. Transp. Res. Part E Logist. Transp. Rev. 2014, 66, 115–125. [Google Scholar] [CrossRef]
  24. Esteve-Perez, J.A. Garcia-Sanchez, and A. Muñoz-Paupie, Cruise Traffic Seasonality Patterns in the Western Mediterranean and the Adriatic Sea: A Challenge to Port Operators. Coast. Manag. 2019, 47, 362–386. [Google Scholar] [CrossRef]
  25. Zhang, N.; Miao, R.; Huang, H.; Chan, E.Y. Contact infection of infectious disease onboard a cruise ship. Sci. Rep. 2016, 6, 38790. [Google Scholar] [CrossRef]
  26. Klein, R.; Lück, M.; Poulston, J. Passengers and Risk: Health, Wellbeing, and Liability. In Cruise Ship Tourism, 2nd ed.; Dowling, R.K., Ed.; CAB International: Wallingford, UK, 2017; pp. 106–123. [Google Scholar]
  27. Marti, B.E. Cruise ship market segmentation: A ‘non-traditional’ port case study. Marit. Policy Manag. 1991, 18, 93–103. [Google Scholar] [CrossRef]
  28. Pallis, A.; Arapi, K.P. A multi-port cruise region: Dynamics and hierarchies in the Med. Tourismos 2016, 11, 168–201. [Google Scholar]
  29. MedCruise. 2018. Available online: http://www.medcruise.com/ (accessed on 11 July 2018).
  30. CLIA. Reports—Cruise Industry Outlook, State of the industry; Publisher: Cruise Lines International Association. Available online: https://cruising.org/news-and-research/research (accessed on 6 February 2020).
  31. Esteban-Marquillas, J.M.I. A reinterpretation of shift-share analysis. Reg. Urban Econ. 1972, 2, 249–255. [Google Scholar] [CrossRef]
  32. Farris, P. Key Marketing Metrics: The 50+ Metrics Every Manager Needs to Know; Financial Times Prentice Hall: Harlow, UK, 2009; p. 353. [Google Scholar]
  33. MedCruise, Cruise Activities in MedCruise Ports: Statistics, in (Statistics 2013, 2014, 2015, 2016, 2017). Available online: https://www.medcruise.com/ (accessed on 15 January 2020).
  34. Notteboom, T.E. Concentration and the formation of multi-port gateway regions in the European container port system: An update. J. Transp. Geogr. 2010, 18, 567–583. [Google Scholar] [CrossRef]
  35. Twrdy, E.; Batista, M. Assessment of Cooperation and Competition Among Container Ports in the Northern Adriatic. In Dynamics in Logistics: Proceedings of the 6th International Conference LDIC 2018; Freitag, M., Kotzab, H., Pannek, J., Eds.; Springer International Publishing: Bremen, Germany, 2018; pp. 231–242. [Google Scholar]
  36. Chukwu, E.N. A mathematical treatment of economic cooperation and competition among nations: With Nigeria, USA, UK, China and Middle East examples. In Mathematics in Science and Engineering, 1st ed.; Elsevier: Amsterdam, The Netherlands, 2005; p. 37. [Google Scholar]
  37. Lee, S.J.; Lee, D.J.; Oh, H.S. Technological forecasting at the Korean stock market: A dynamic competition analysis using Lotka-Volterra model. Technol. Forecast. Soc. Chang. 2005, 72, 1044–1057. [Google Scholar] [CrossRef]
  38. Marasco, A.; Romano, A. Inter-port interactions in the Le Havre-Hamburg range: A scenario analysis using a nonautonomous Lotka Volterra model. J. Transp. Geogr. 2018, 69, 207–220. [Google Scholar] [CrossRef]
  39. Takeuchi, Y. Global Dynamical Properties of Lotka-Volterra Systems; World Scientific: Singapore, 1996; p. 316. [Google Scholar]
  40. Twrdy, E.; Batista, M. Modeling of container throughput in Northern Adriatic ports over the period 1990–2013. J. Transp. Geogr. 2016, 52, 131–142. [Google Scholar] [CrossRef]
Figure 1. The various regions and ports in the Mediterranean.
Jmse 08 00374 g001
Figure 2. Share of average number of Pax in the ports of different regions for the period 2000–2016 (West Med = 100%).
Jmse 08 00374 g002
Figure 3. Trend of growth indexes for the different regions of the Mediterranean (2000 = 100%).
Jmse 08 00374 g003
Figure 4. Annual growth rate of cruise traffic in the ports of the Mediterranean.
Jmse 08 00374 g004
Figure 5. Market share of cruise traffic of the various regions of the Mediterranean.
Jmse 08 00374 g005
Figure 6. Positions of the various regions in the BCG-matrix for two different periods. The width of the bubbles is proportional to the Pax per region.
Jmse 08 00374 g006
Figure 7. Cumulative Pax market share of cruise ports in the Mediterranean (69 ports).
Jmse 08 00374 g007
Figure 8. Cumulative market share of cruise ports in different regions for the period 2014–2017.
Jmse 08 00374 g008
Figure 9. Trend of the Hirschman–Herfindahl index of cruise traffic for the period 2010–2017.
Jmse 08 00374 g009
Figure 10. Dynamic shift-share analysis with shifts summarized for four-year periods.
Jmse 08 00374 g010
Figure 11. Cumulative shift in total Pax for the period 2001–2017.
Jmse 08 00374 g011
Figure 12. Trend of the stability index for Mediterranean cruise traffic.
Jmse 08 00374 g012
Figure 13. Dynamic shift of total Pax in the period 2011–2017.
Jmse 08 00374 g013
Figure 14. Cumulative shift of total Pax in the period 2011–2017.
Jmse 08 00374 g014
Figure 15. Trend of total Pax in different regions over time fitted by the LVM.
Jmse 08 00374 g015
Figure 16. Trend of total Pax fitted by the LVM and LM.
Jmse 08 00374 g016
Figure 17. Time evaluation of total Pax in ports Venice and Dubrovnik fitted by the Lotka–Volterra and Logistic curve.
Jmse 08 00374 g017
Table 1. Passenger movements (in millions Pax) of the top 15 cruise ports in the Mediterranean.
RPort2010Rank ShiftPort2017PortTotal 2010–2017
1Barcelona2.350Barcelona2.71Barcelona20.32
2Civitavecchia1.940Civitavecchia2.20Civitavecchia18.41
3Venice1.621Balearic Islands2.11Balearic Islands13.69
4Balearic Islands1.558Marseille1.49Venice13.34
5Piraeus1.35−2Venice1.43Naples9.53
6Naples1.15−1Piraeus1.06Marseille9.44
7Dubrovnik1.143Tenerife ports0.96Piraeus9.32
8Tunisian ports0.94−2Naples0.93Dubrovnik7.37
9Genoa0.900Genoa0.93Genoa7.12
10Livorno0.86−2Valletta0.78Tenerife ports6.87
11Tenerife ports0.82−4Dubrovnik0.75Livorno6.41
12Marseille0.74−2Livorno0.70Corfu5.37
13French Riviera0.700French Riviera0.69Kusadasi/
Bodrum/Antalya
5.07
14Kusadasi/
Bodrum/Antalya
0.67 Corfu0.68French Riviera5.05
15Malaga0.66 Kotor 0.54Valletta4.78
Share top 1573.0% Share top 1571.7%Share top 1569.3%
Table 2. The data (based on MedCruise reports [29]).
YearNumber of Ports IncludedTotal Pax (in Millions)Average Pax per Port (in Thousands)
WMASEMBSWMASEMBSWMASEMBS
200034101694.730.531.610.05139.153.0100.45.9
200134101695.290.901.390.05155.789.786.96.0
200234101696.181.051.160.07181.9104.872.27.6
200334101697.501.441.530.11220.7144.295.611.9
200434101697.541.471.390.13221.7146.887.014.7
200534101698.851.701.750.14260.2169.7109.415.2
2006341016910.121.942.260.16297.5194.1141.417.8
2007341016912.102.262.750.18355.8225.8172.020.5
2008341016913.892.853.310.15408.7285.3206.616.2
2009341016915.373.692.680.10452.1368.7167.611.3
2010341016917.244.112.570.13507.0411.1160.515.0
2011341016918.904.733.120.14555.9473.0194.815.4
2012361312618.554.863.260.15515.2373.8271.824.4
2013361312618.835.122.860.21523.1393.7238.035.6
2014391313618.034.562.980.19462.3350.8229.231.4
2015391313619.644.493.000.07503.6345.7230.911.6
2016391416620.084.752.600.02514.8339.1162.82.8
2017401315519.724.451.740.01493.0342.1116.01.3
Note: The data highlighted in gray are estimations.
Table 3. Shift of total Pax by year.
Total Shift
of Pax (in Millions)
Maximum Gain
% of Total Shift
PortsMaximum Loss
% of Total Shift
Ports
20111.8821.6Civitavecchia−36.6Tunisian ports
20121.6114.5Valencia−14.7Piraeus
20131.8214.2Marseille−19.0Livorno
20141.5718.2La Spezia−12.6Civitavecchia
20151.8117.1Balearic Islands−22.9Tunisian ports
20161.809.8Genova−30.5Istanbul
20171.5015.2Balearic Islands−22.0Naples
Table 4. Ports that have gained the most number of Pax in the period 2010–2017.
PortRegionCountryMarket Share (in %)Shift of Pax (in Millions)% Gain from Shift% SHIFT
MarseilleWMFRA4.600.7816.98.25
Balearic IslandsWMESP6.680.4910.73.60
La SpeziaWMITA1.230.429.016.60
Kotor ASMNE1.330.408.814.82
CagliariWMITA0.800.275.816.40
VallettaWMMLT2.330.265.65.37
BarcelonaWMESP9.980.255.51.24
CivitavecchiaWMITA8.980.194.11.03
Tenerife portsWMESP3.350.183.92.6
Table 5. Ports that have lost the most number of Pax in the period 2010–2017.
PortRegionCountryMarket Share
(in %)
Shift of Pax
(in Millions)
% Loss from Shift%SHIFT
MalagaWMESP2.01−0.21−4.5−4.99
DubrovnikASHRV3.59−0.23−5.0−3.16
NaplesWMITA4.65−0.27−5.9−2.88
Ports of CyprusEMCYP0.89−0.28−6.1−15.55
VeniceASITA6.51−0.29−6.2−2.14
IstanbulEMTUR1.75−0.54−11.6−14.88
Kusadasi/Bodrum/AntalyaEMTUR2.47−0.59−12.9−11.71
Tunisian portsWMTUN1.43−0.99−21.5−36.16
Table 6. Shift-share analysis of the Mediterranean cruise ports (in million Pax) (only ports that have gained more than 2% of the total cruise market in 2010–2017 are listed).
PortRegionCountryTotal Pax
(in Millions)
Market Share
(in %)
Regional Market Share (in %)%
SHIFT
%
PROPSFT
%
DIFFSFT
BarcelonaWMESP17.979.9114.211.411.210.20
CivitavecchiaWMITA16.468.9812.881.151.22−0.07
Balearic IslandsWMESP12.146.689.584.061.312.74
NaplesWMITA8.394.656.66−3.271.21−4.48
MarseilleWMFRA8.744.606.608.911.567.35
GenoavaWMITA6.263.474.980.541.26−0.72
Tenerife portsWMESP6.133.354.812.921.211.70
LivornoWMITA5.593.134.48−3.160.93−4.09
French RivieraWMFRA4.382.463.53−0.651.00−1.65
VallettaWMMLT4.292.333.345.991.184.80
Madeira portsWMPRT3.742.062.960.431.14−0.71
MalagaWMESP3.472.012.89−5.940.74−6.69
PiraeusEMGRC8.174.5440.04−1.70−7.525.82
Kusadasi/
Bodrum/
Antalya
EMTUR4.412.4721.79−13.47−8.58−4.89
VeniceASITA11.736.5135.06−2.440.49−2.93
DubrovnikASHRV6.433.5919.36−3.620.49−4.11
CorfuASGRC4.772.6214.101.170.320.85
Table 7. Ports with largest relative proportional shift in the period 2010–2017.
PortRegionCountryTotal Pax
(in Millions)
Market Share
(in %)
Regional
Market Share
%
SHIFT
%
PROPSFT
%
DIFFSFT
Taranto ASITA110.010.0379.20.079.2
BurgasBSBGR640.038.770.0−59.960.0
TarragonaWMESP810.040.0659.71.058.8
IgoumenitsaEMGRC300.010.1331.7−9.140.8
SeteWMFRA1430.070.1029.91.328.7
ZadarASHRV4860.251.3324.9−0.125.0
Souda/ChaniaEMGRC8170.403.5615.8−9.124.9
CeutaWMESP560.030.0423.51.022.5
BrindisiASITA3150.170.9024.42.521.9
HuelvaWMESP340.020.0221.31.919.4
ConstantzaBSROU2230.1233.25−9.9−28.218.3
CagliariWMITA14840.801.1518.21.216.9
TriesteASITA5760.291.5516.70.516.2
Kotor ASMNE25831.337.1715.70.115.5
La SpeziaWMITA24681.231.7616.92.314.6
SibenikASHRV1280.070.3713.00.112.9
MersinEMTUR40.000.02−0.5−13.212.7
CartagenaWMESP10200.550.7912.71.411.3
VarnaBSBGR520.037.99−15.7−26.110.4
Table 8. Type of competitive role between competitors i and j.
ijTypeExplanation
sgn ( b i j ) sgn ( b j i )
++pure cooperationwin-win situation
+competitionj is a prey of i
+competitioni is a prey of j
pure competitionlose-lose situation
Table 9. LVM competition–cooperation relationships among regions in the period 2000–2017.
RegionsLotka–Volterra ModelLogistic Model
Capacity Pax (in Millions)Growth RateR2Adj_R2Capacity Pax (in Millions)Growth RateR2Adj_R2
West Med26.9−0.1660.9880.98521.60.2520.9820.980
Adriatic Sea6.8−0.1060.9630.9555.10.3250.9520.945
East Med3.9−0.1410.5890.5013.10.3630.5970.582
Table 10. Normalized interaction parameters for the LVM.
RegionsWest MedAdriatic SeaEast Med
West Med1−5.74.14
Adriatic Sea0.27−1−0.06
East Med4.04−14.64−1
Table 11. LVM competition–cooperation relationships among ports in the period 2000–2017.
RegionsLotka–Volterra ModelLogistic Model
Capacity
Pax (in Millions)
Growth RateR2Adj_R2Capacity
Pax (in Millions)
Growth RateR2Adj_R2
Barcelona2.620.2330.9680.9622.8550.2890.9700.966
Civitavecchia3.03−0.3090.9690.9632.3950.4600.9610.956
Balearic Islands0.990.0900.9560.9474.5410.0910.9480.941
Table 12. Normalized interaction coefficients for the LVM.
RegionsBarcelonaCivitavecchiaBalearic Islands
Barcelona1−6.116−2.732
Civitavecchia1.540−1−0.831
Balearic Islands−0.420−0.5751
Table 13. LVM competition-cooperation relationships among ports in the period 2000–2017.
RegionsLotka–Volterra ModelLogistic Model
Capacity Pax (in Millions)Growth RateR2Adj_R2Capacity Pax (in Millions)Growth RateR2Adj_R2
Venice1.3990.2940.9830.9811.7200.3440.9200.910
Dubrovnik0.7220.4330.9570.9510.9160.4890.8960.883
Table 14. Normalized interaction coefficients for the LVM.
VeniceDubrovnik
Venice−11.236
Dubrovnik−0.9651

