Data Driven In-Cylinder Pressure Diagram Based Optimization Procedure


Abstract
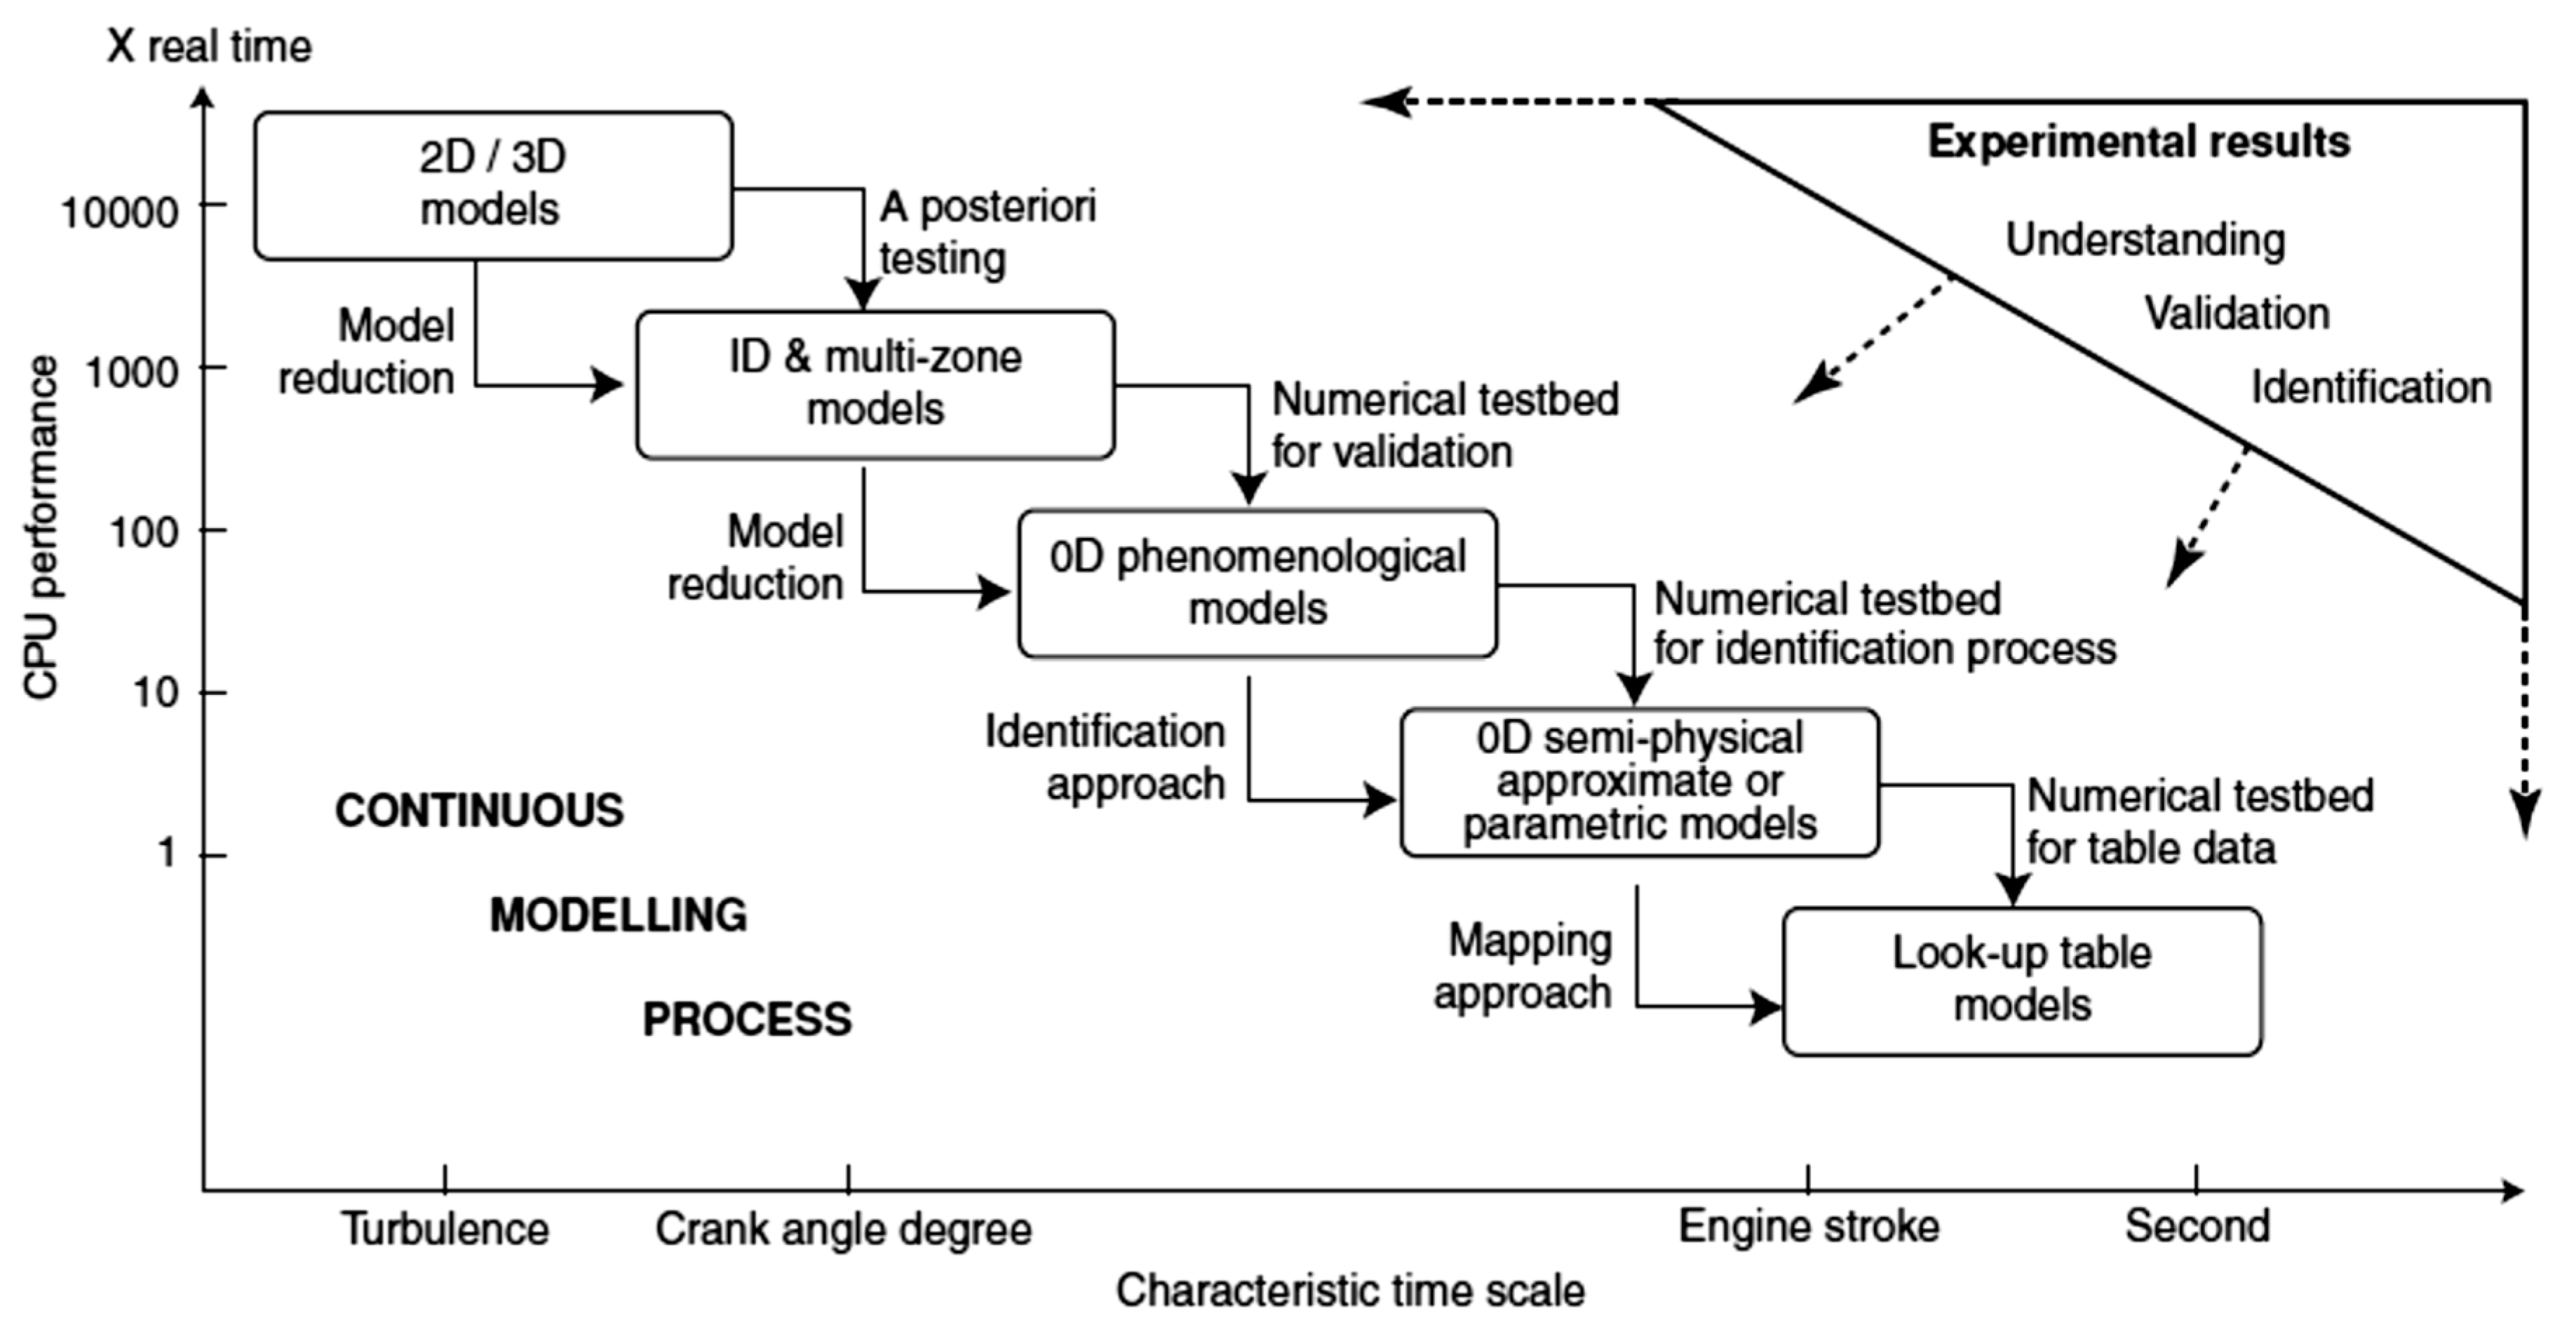
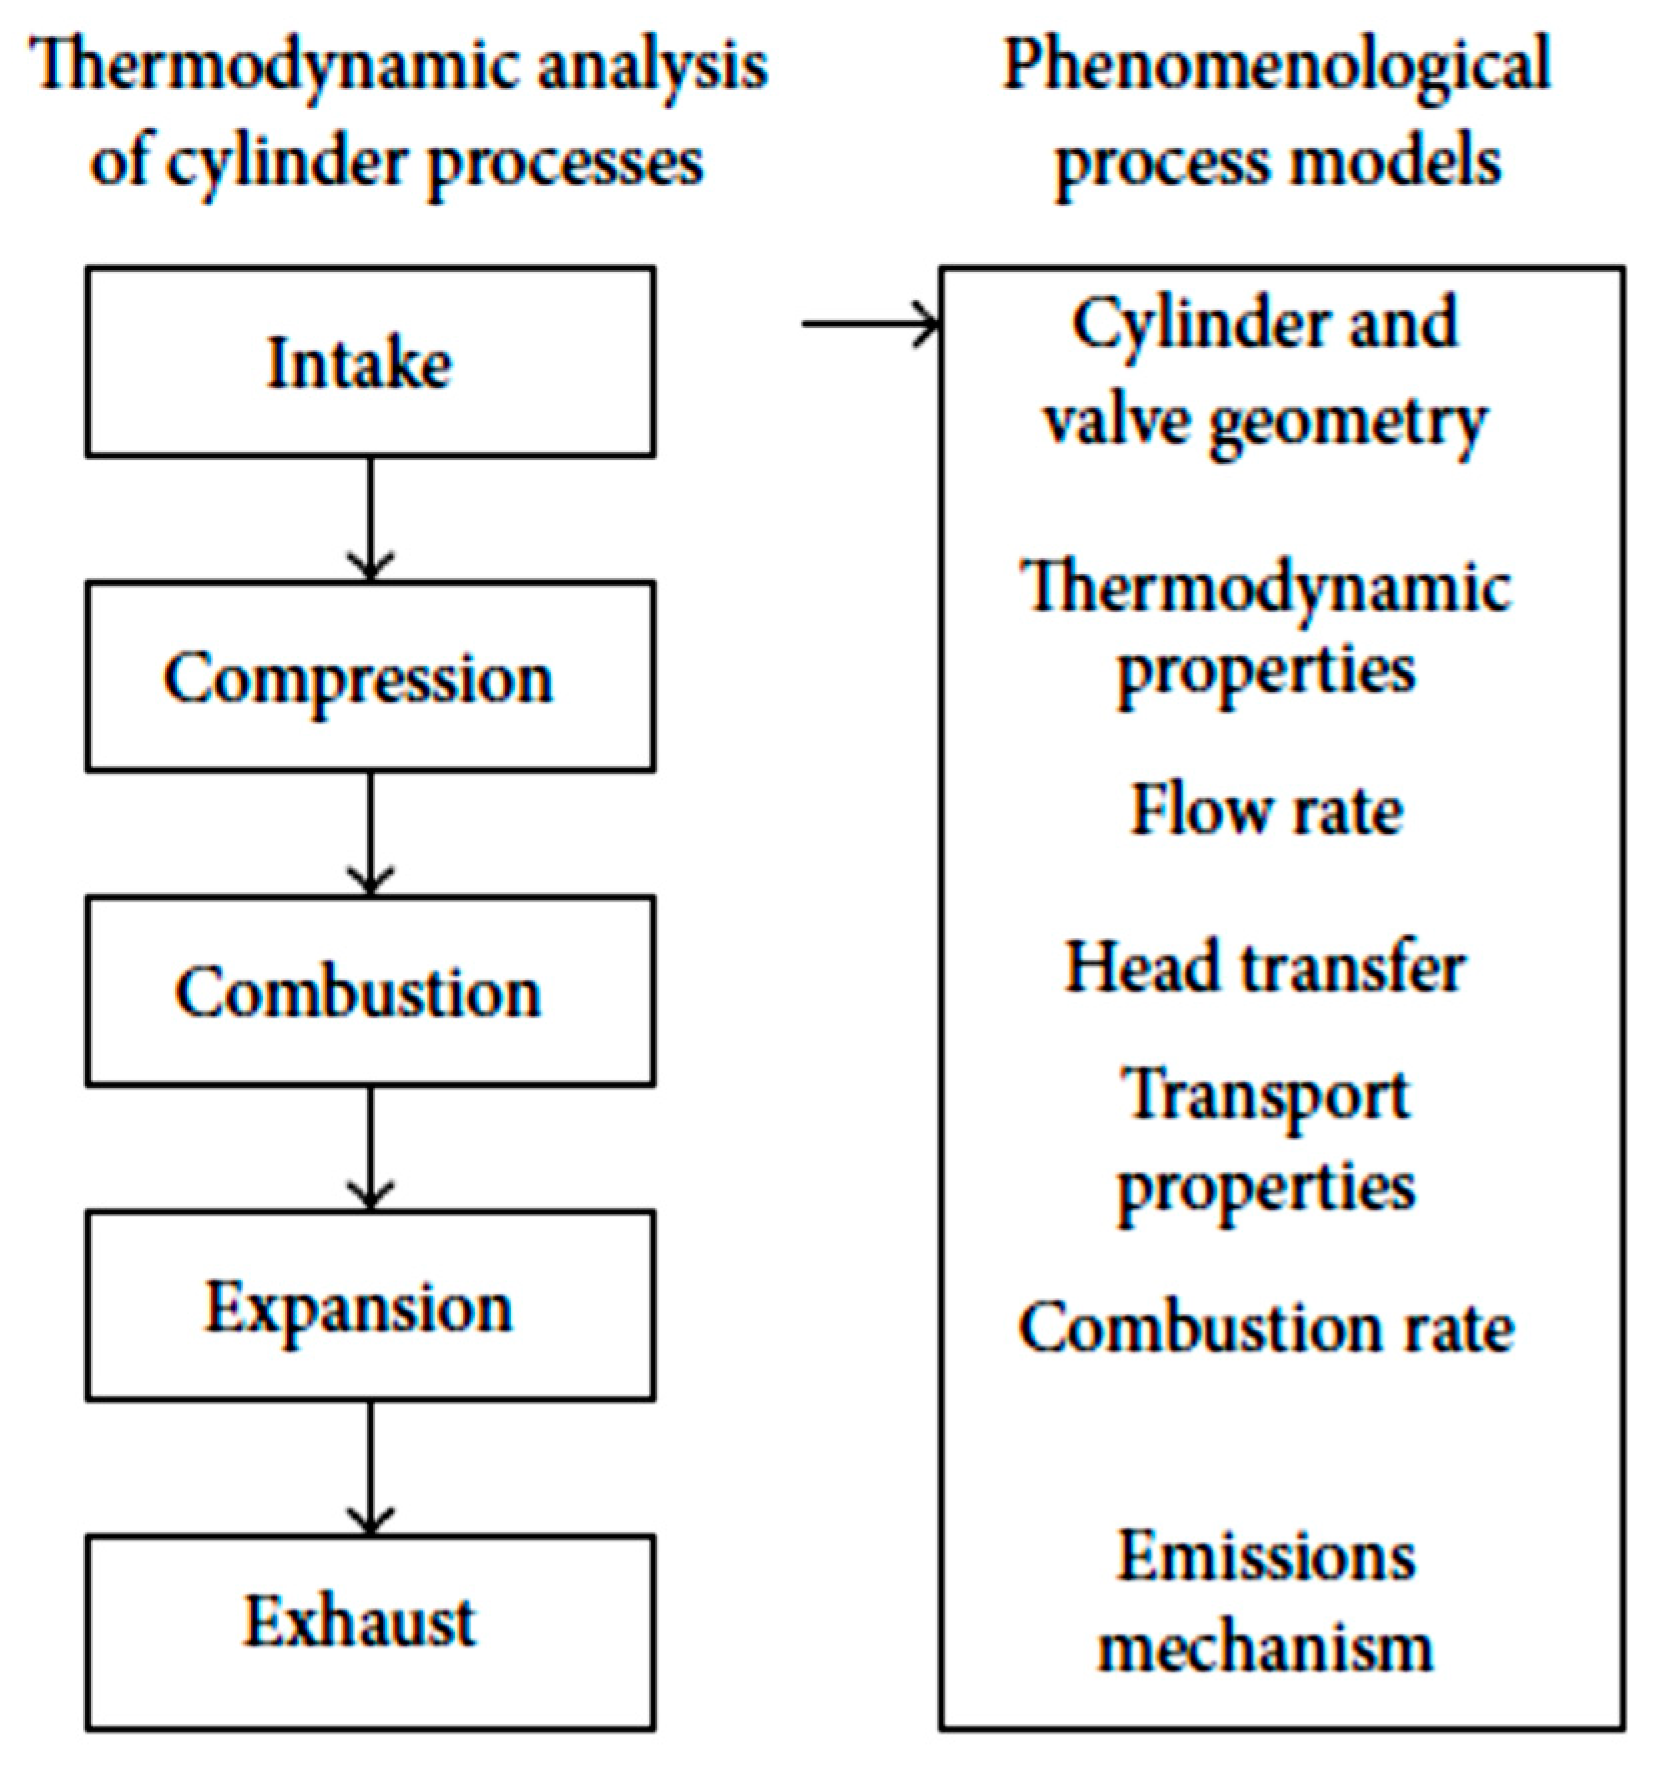
:1. Introduction
2. Main Contribution and Brief Description of the Current Study
3. Engine Optimization Model
3.1. Engine specifications
3.2. Overview of the Simulation Software
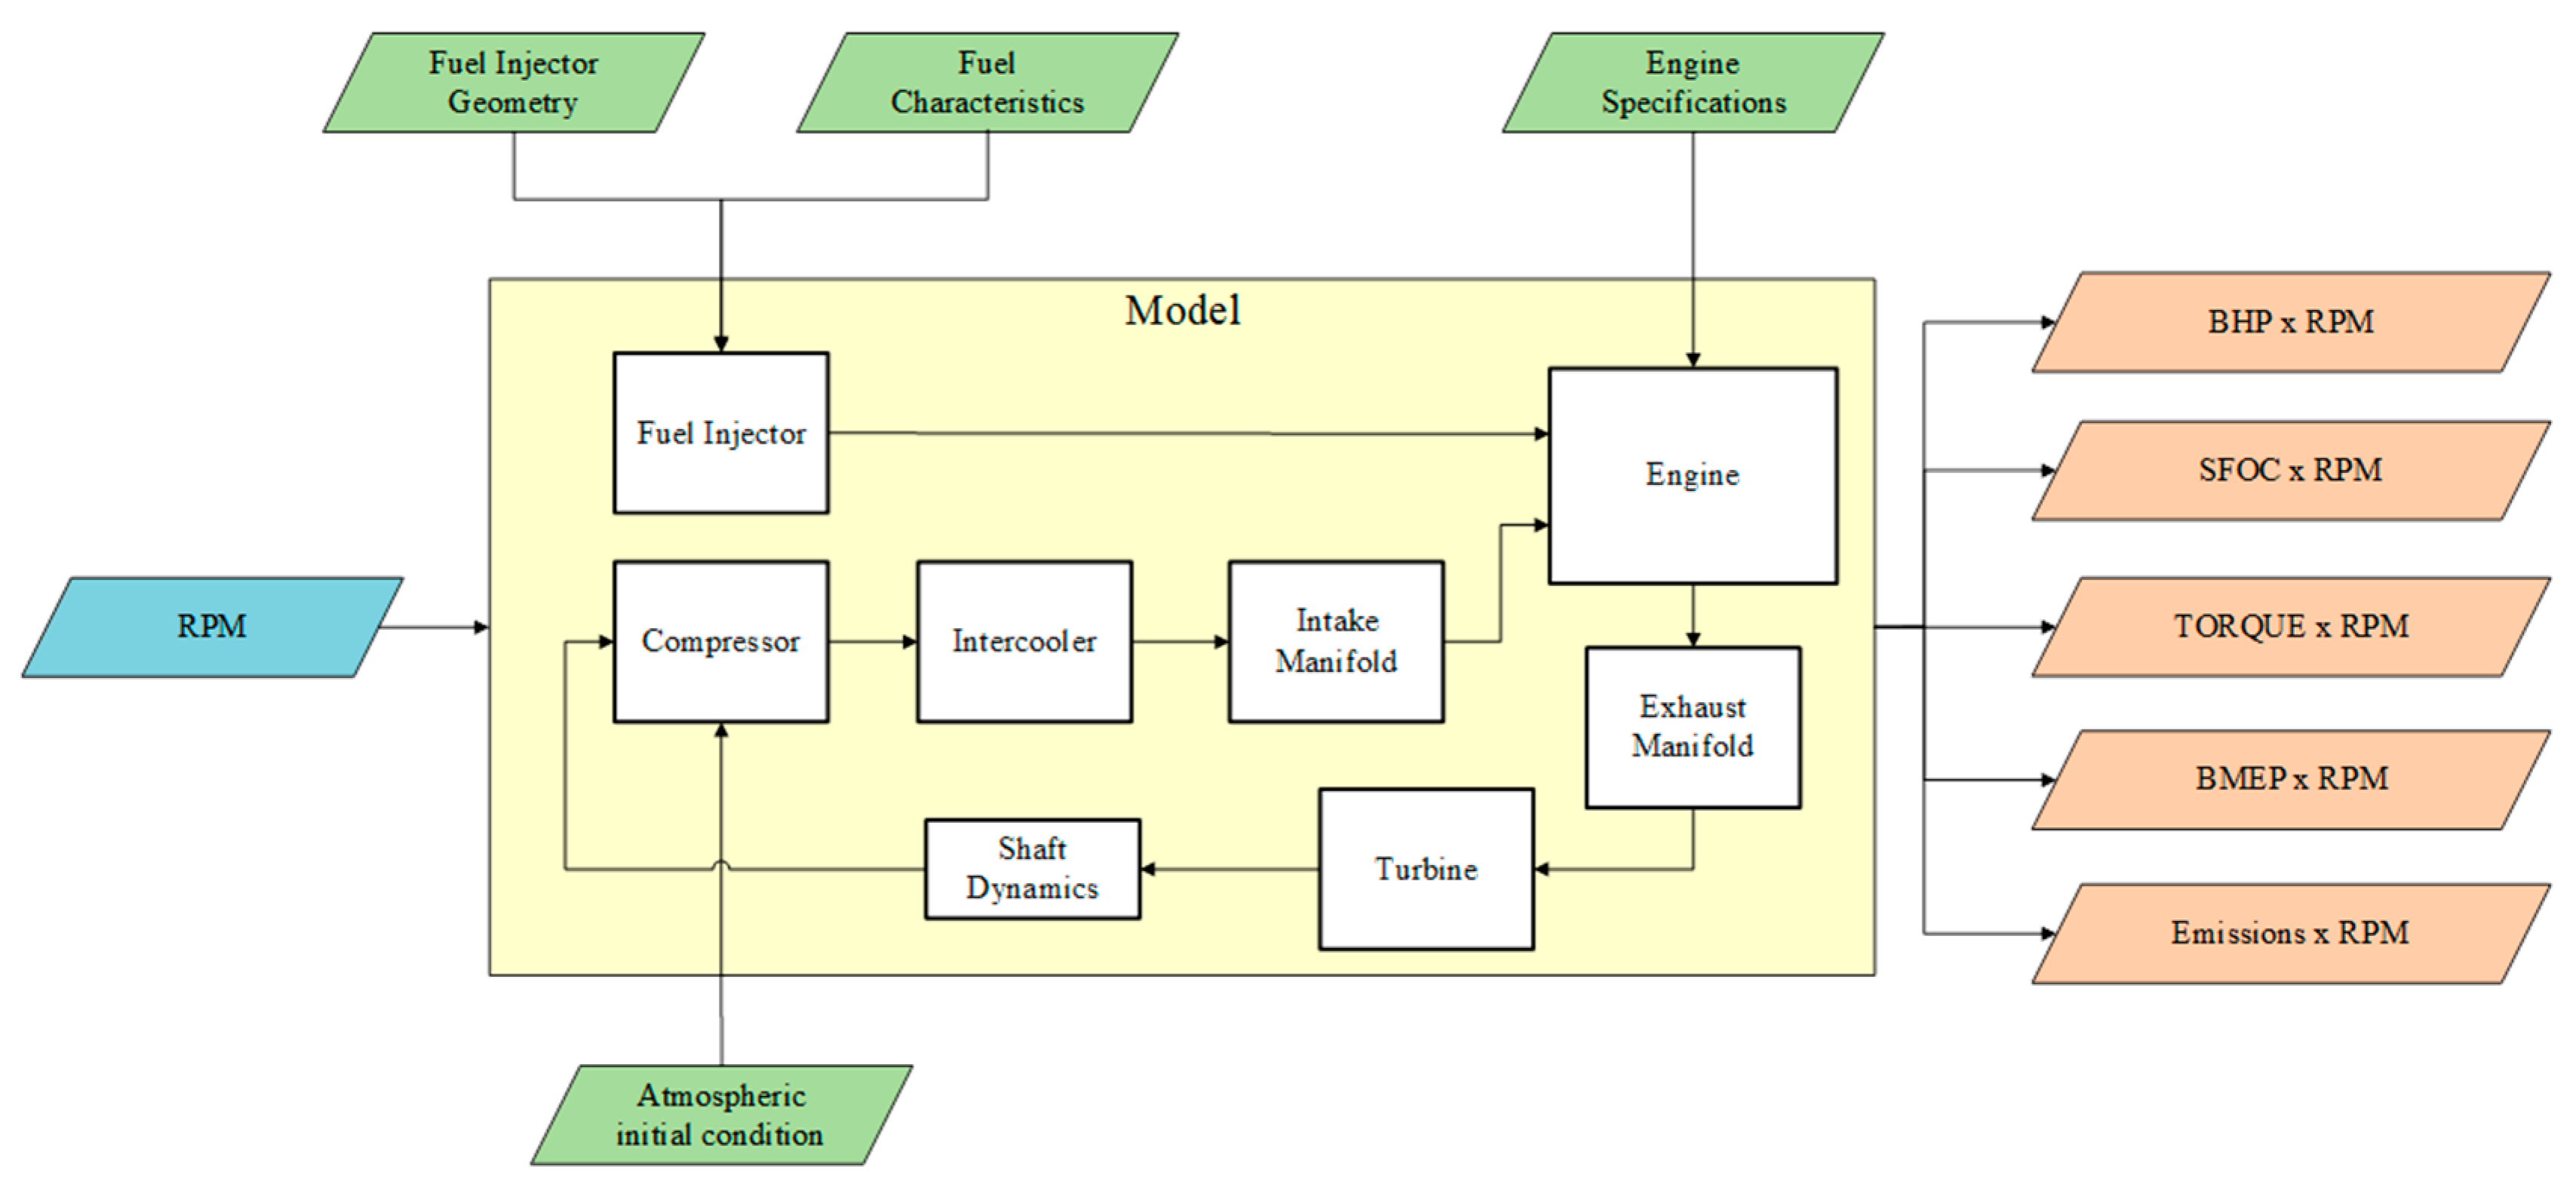
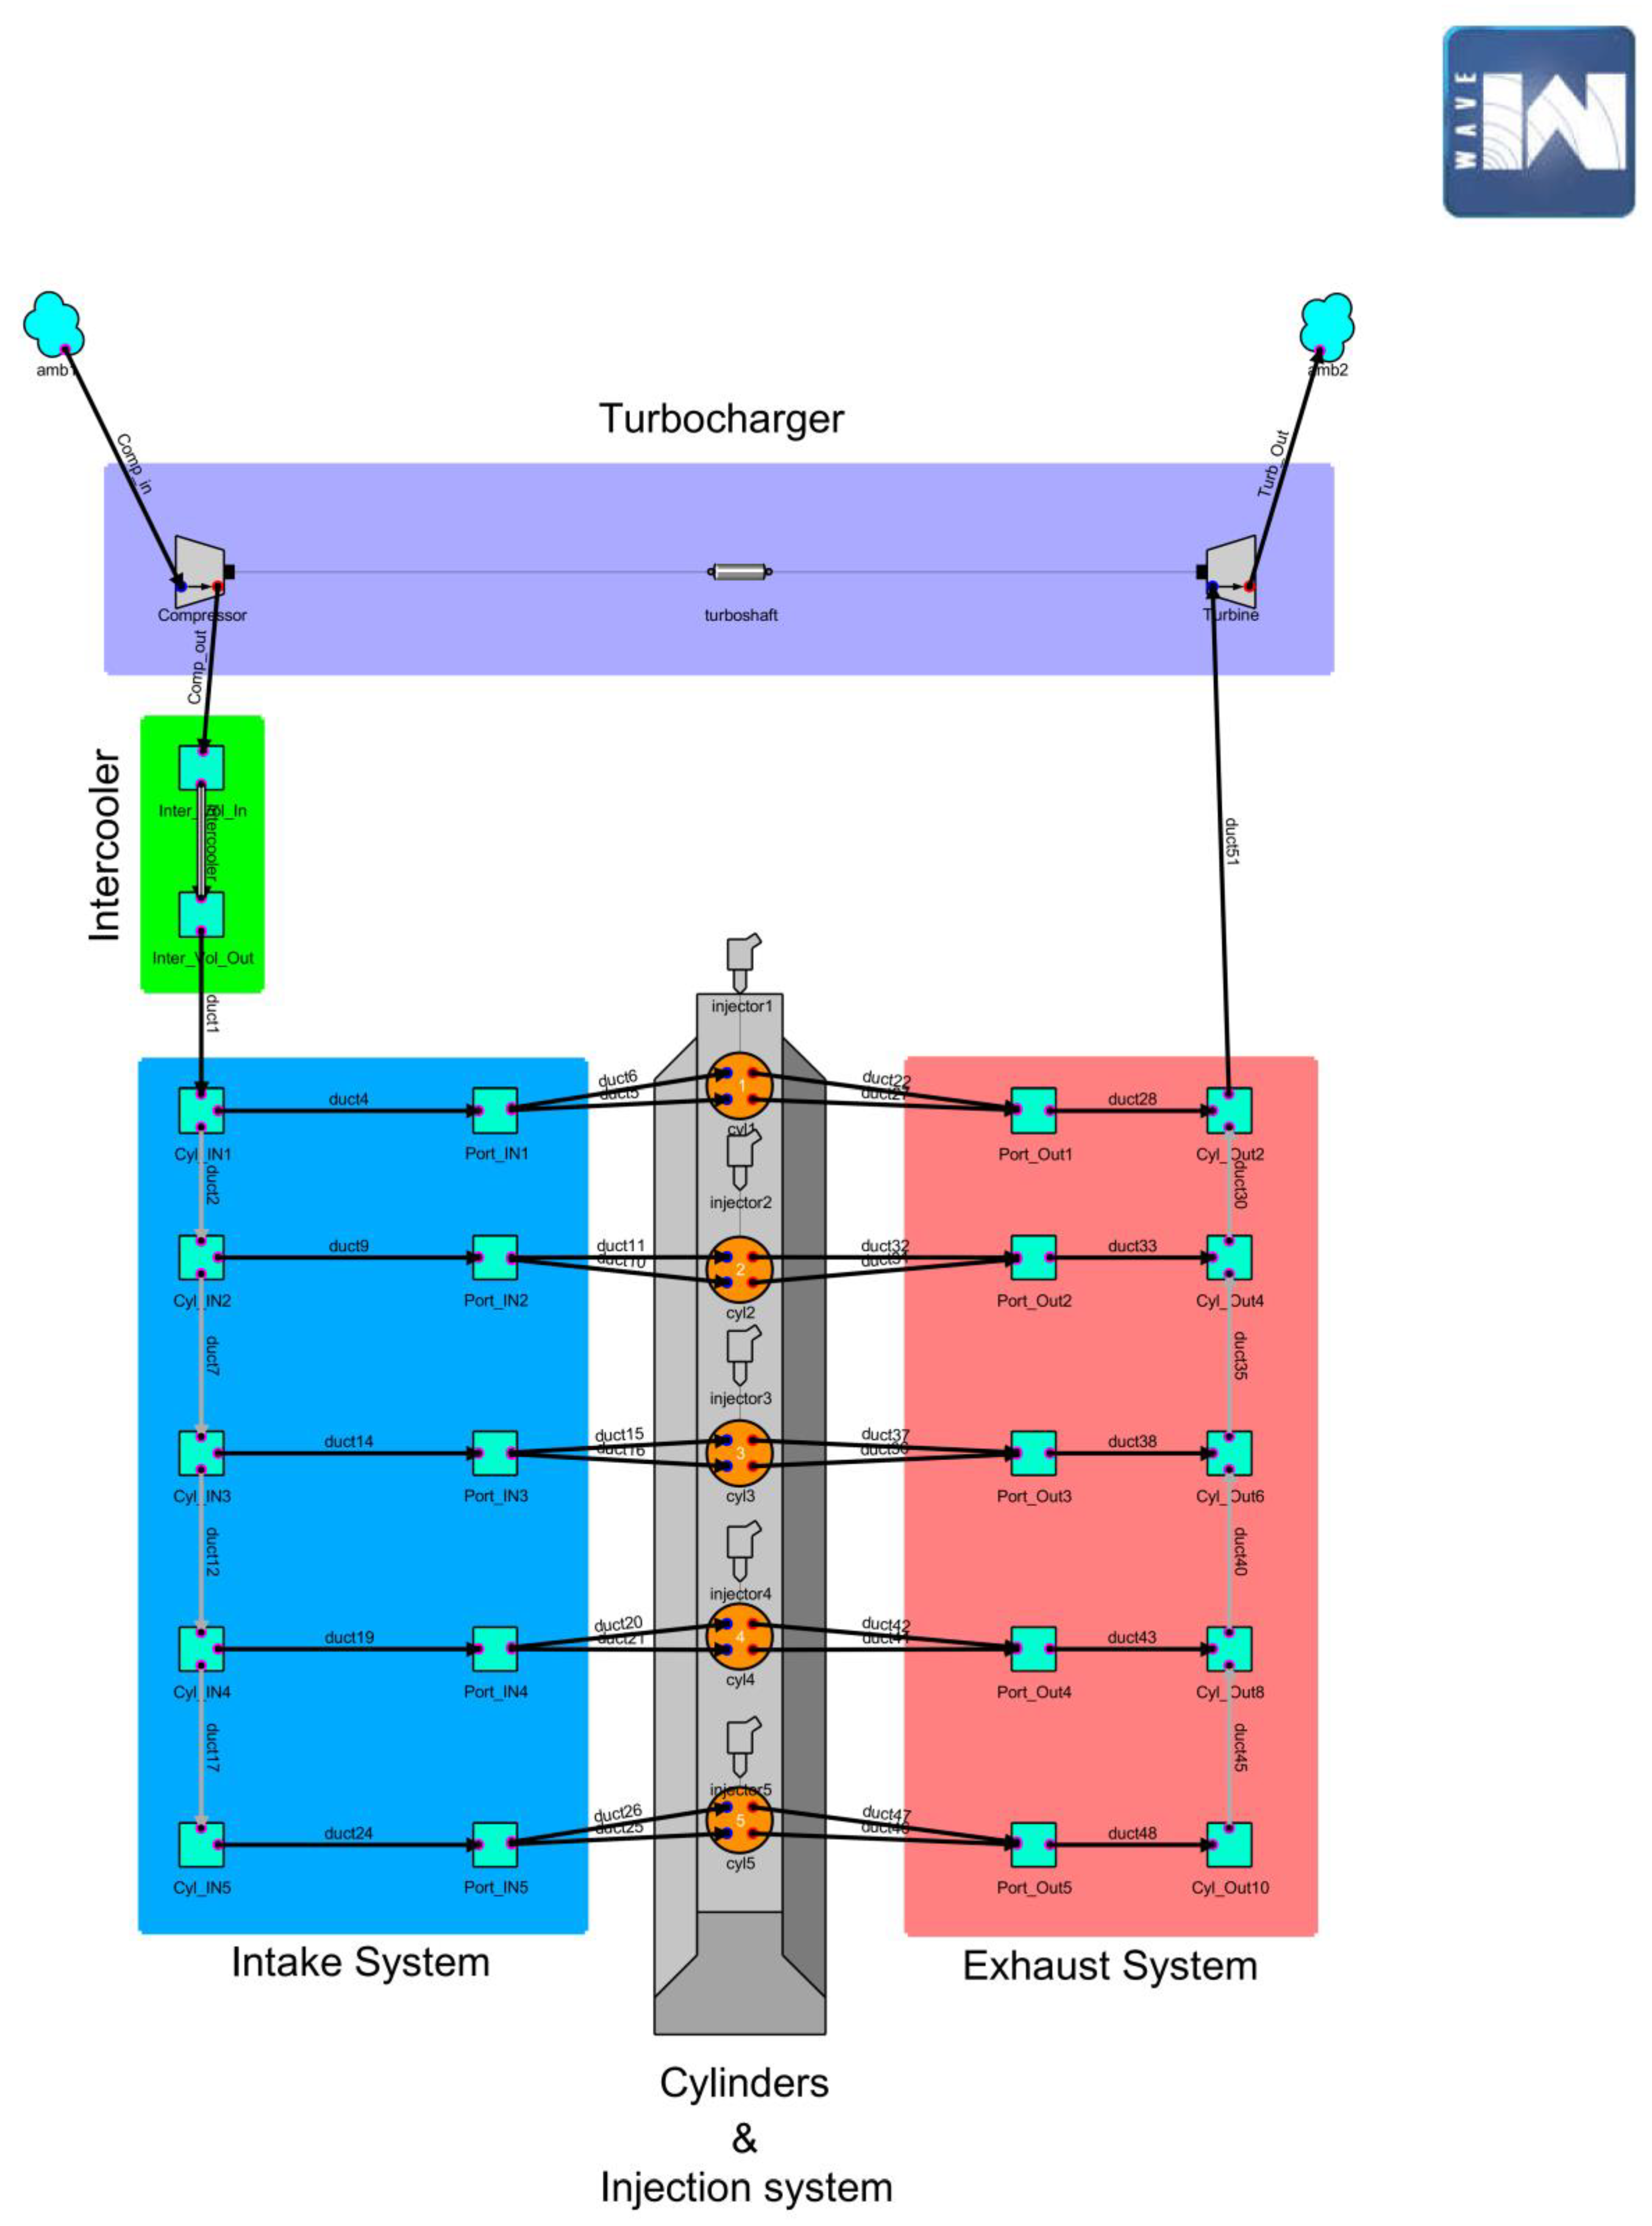
3.2.1. Establishment of the Engine Model
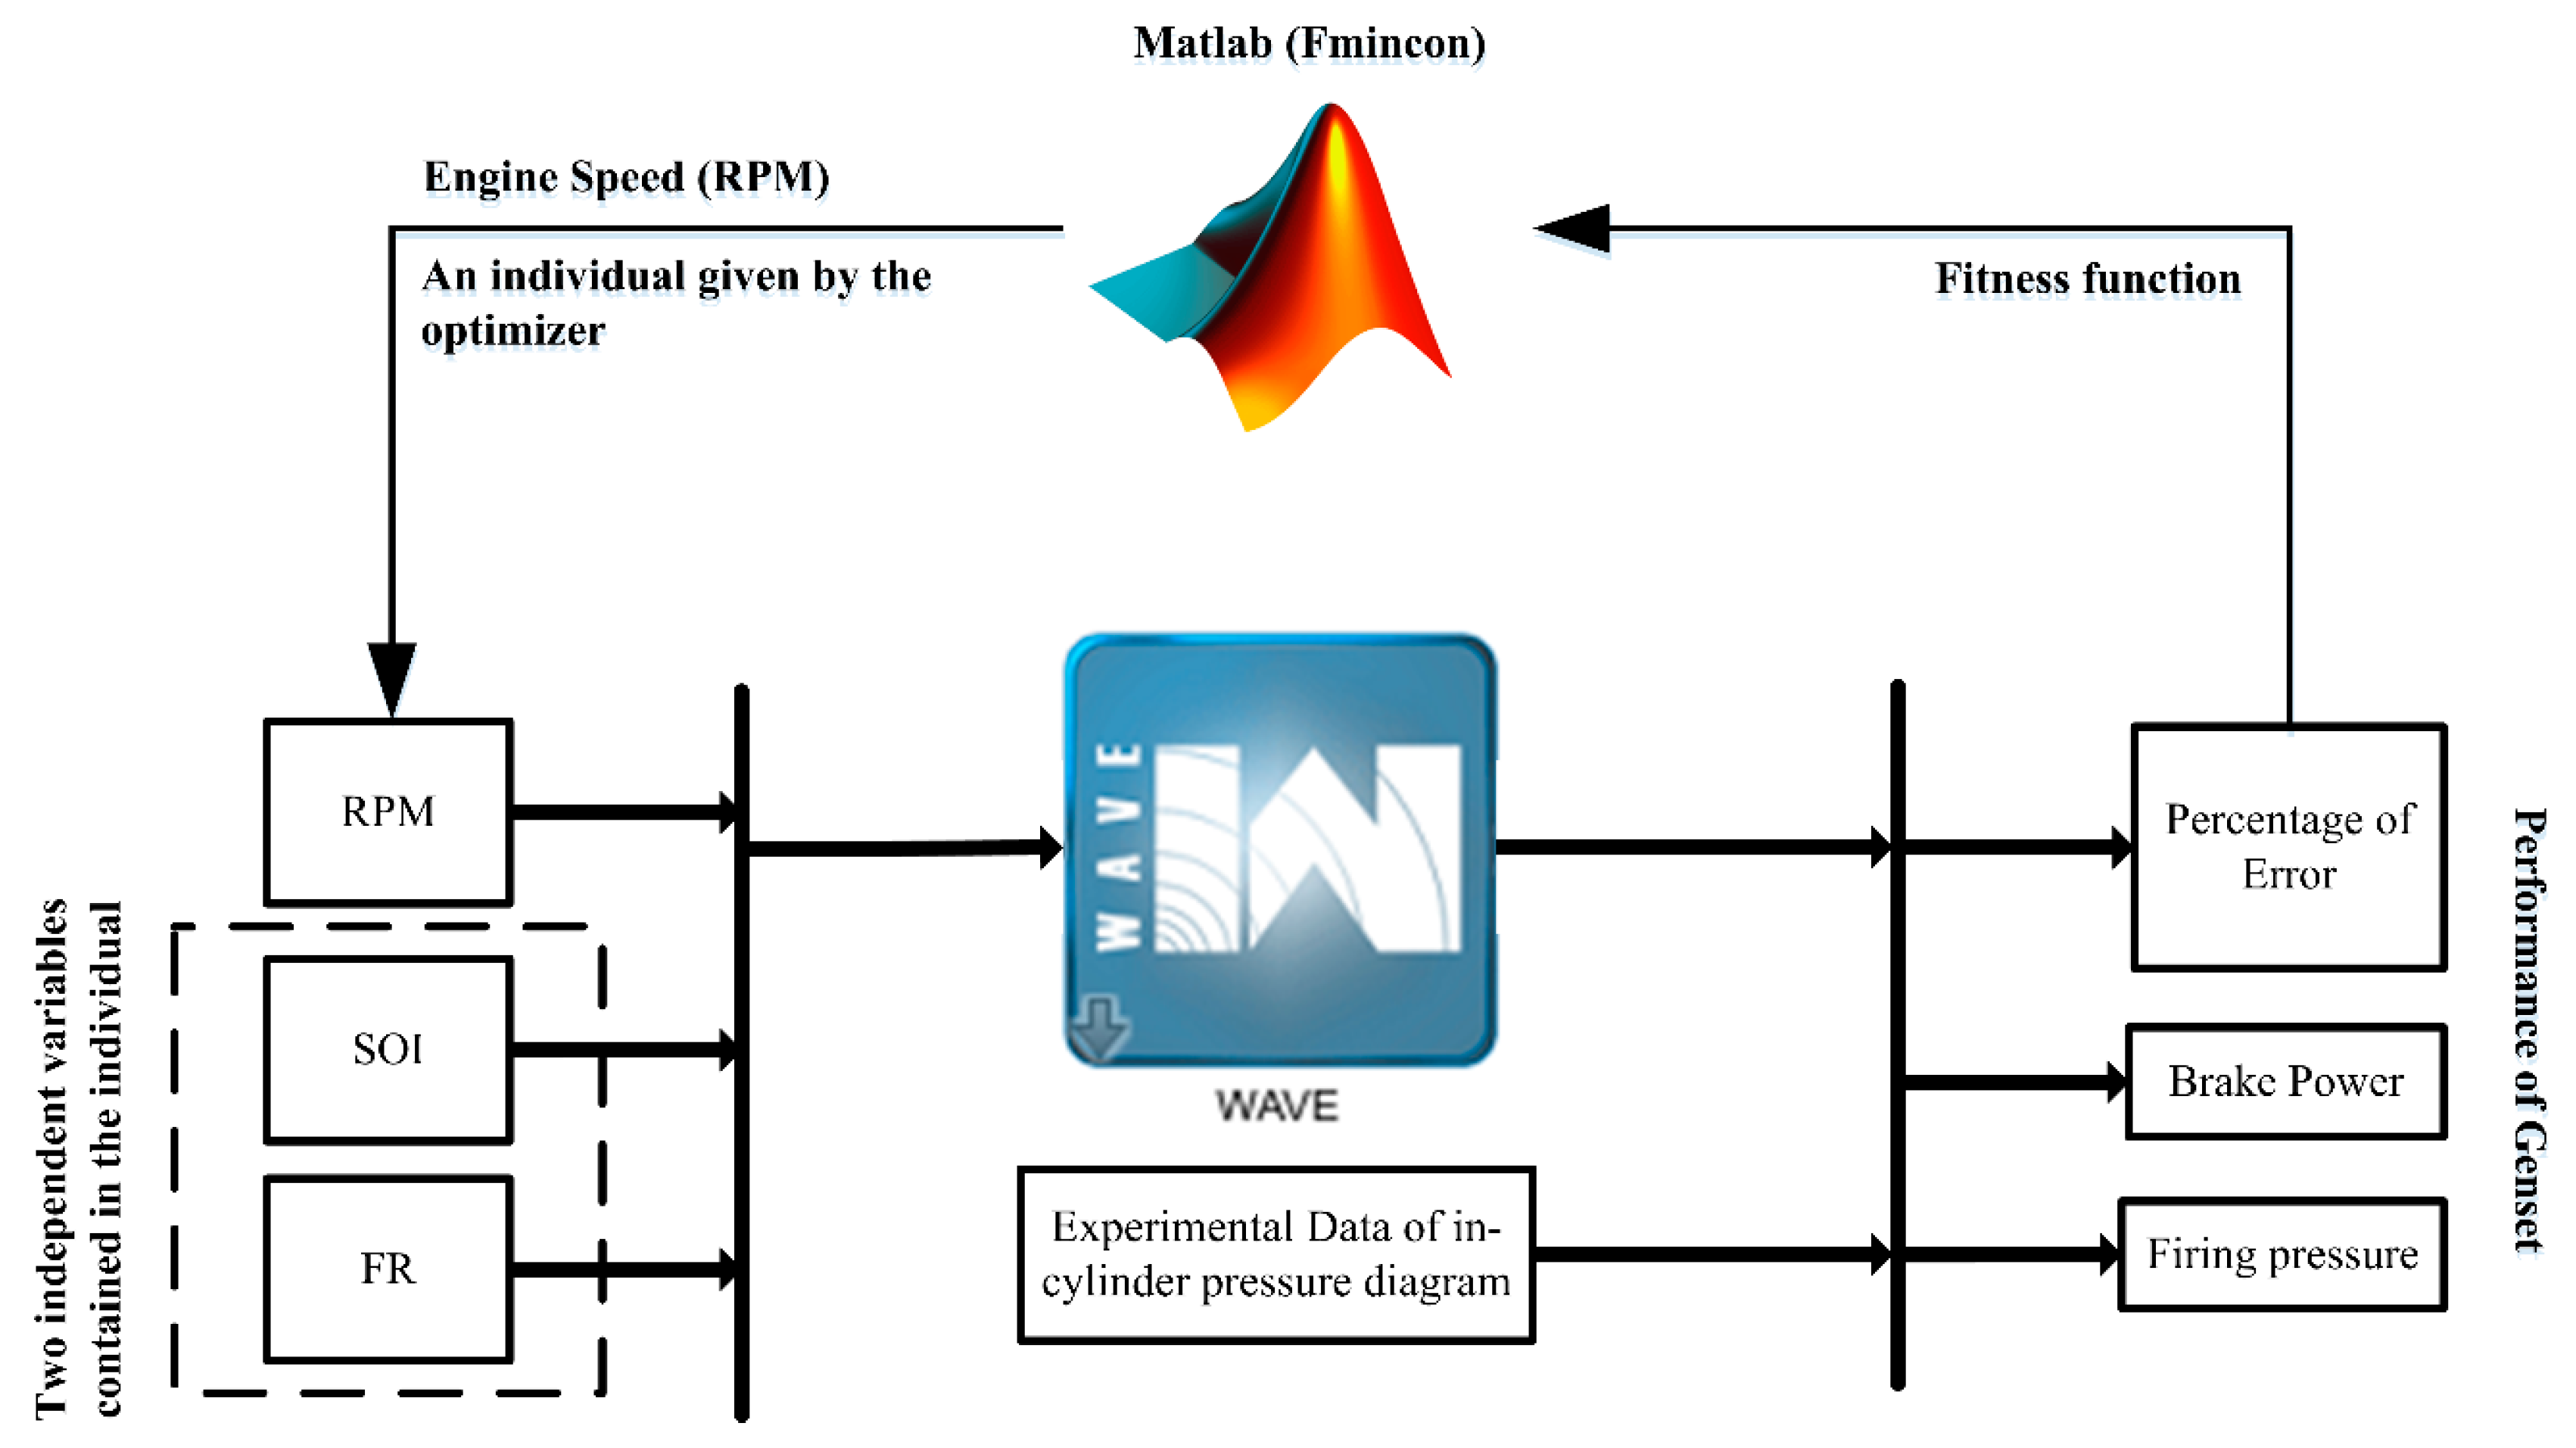
3.2.2. Nonlinear Optimization Model
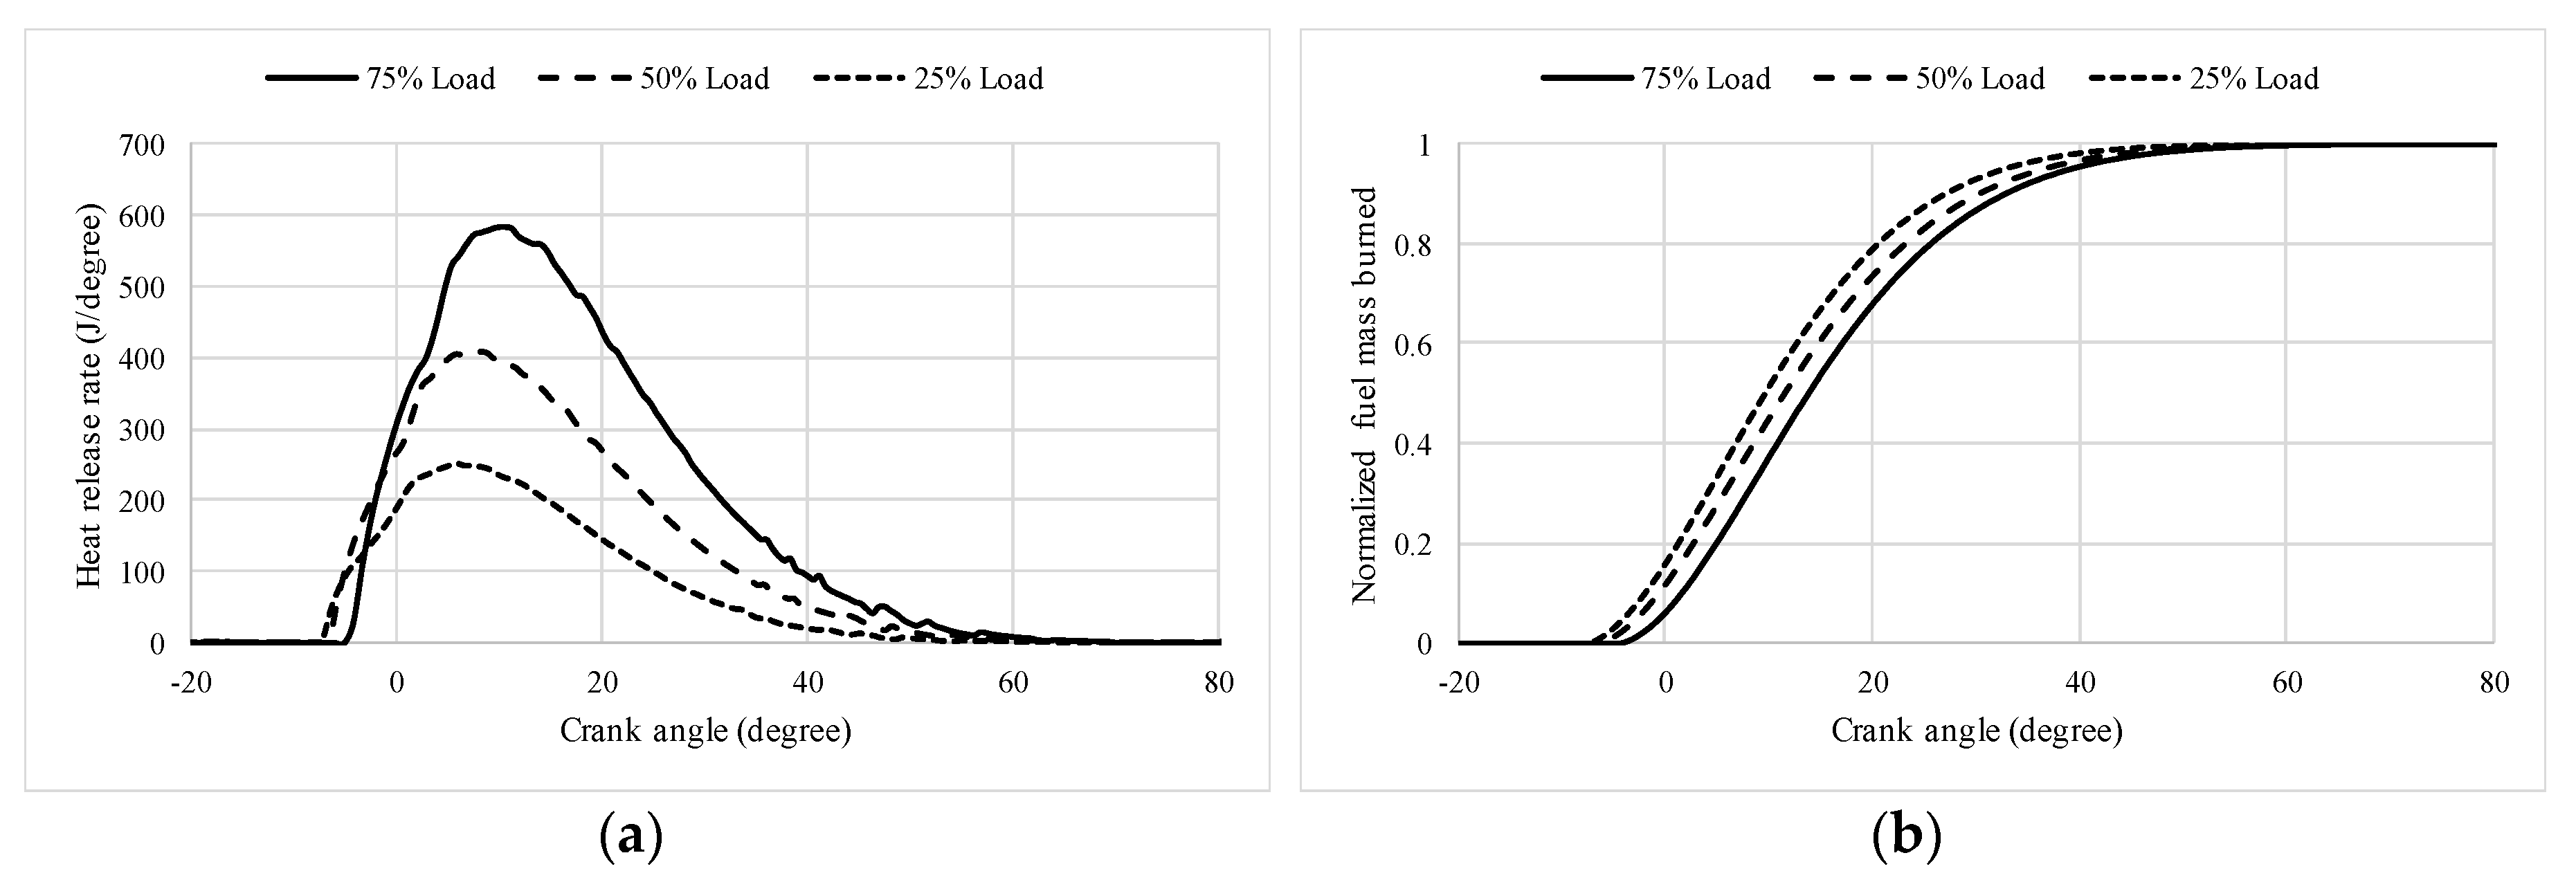
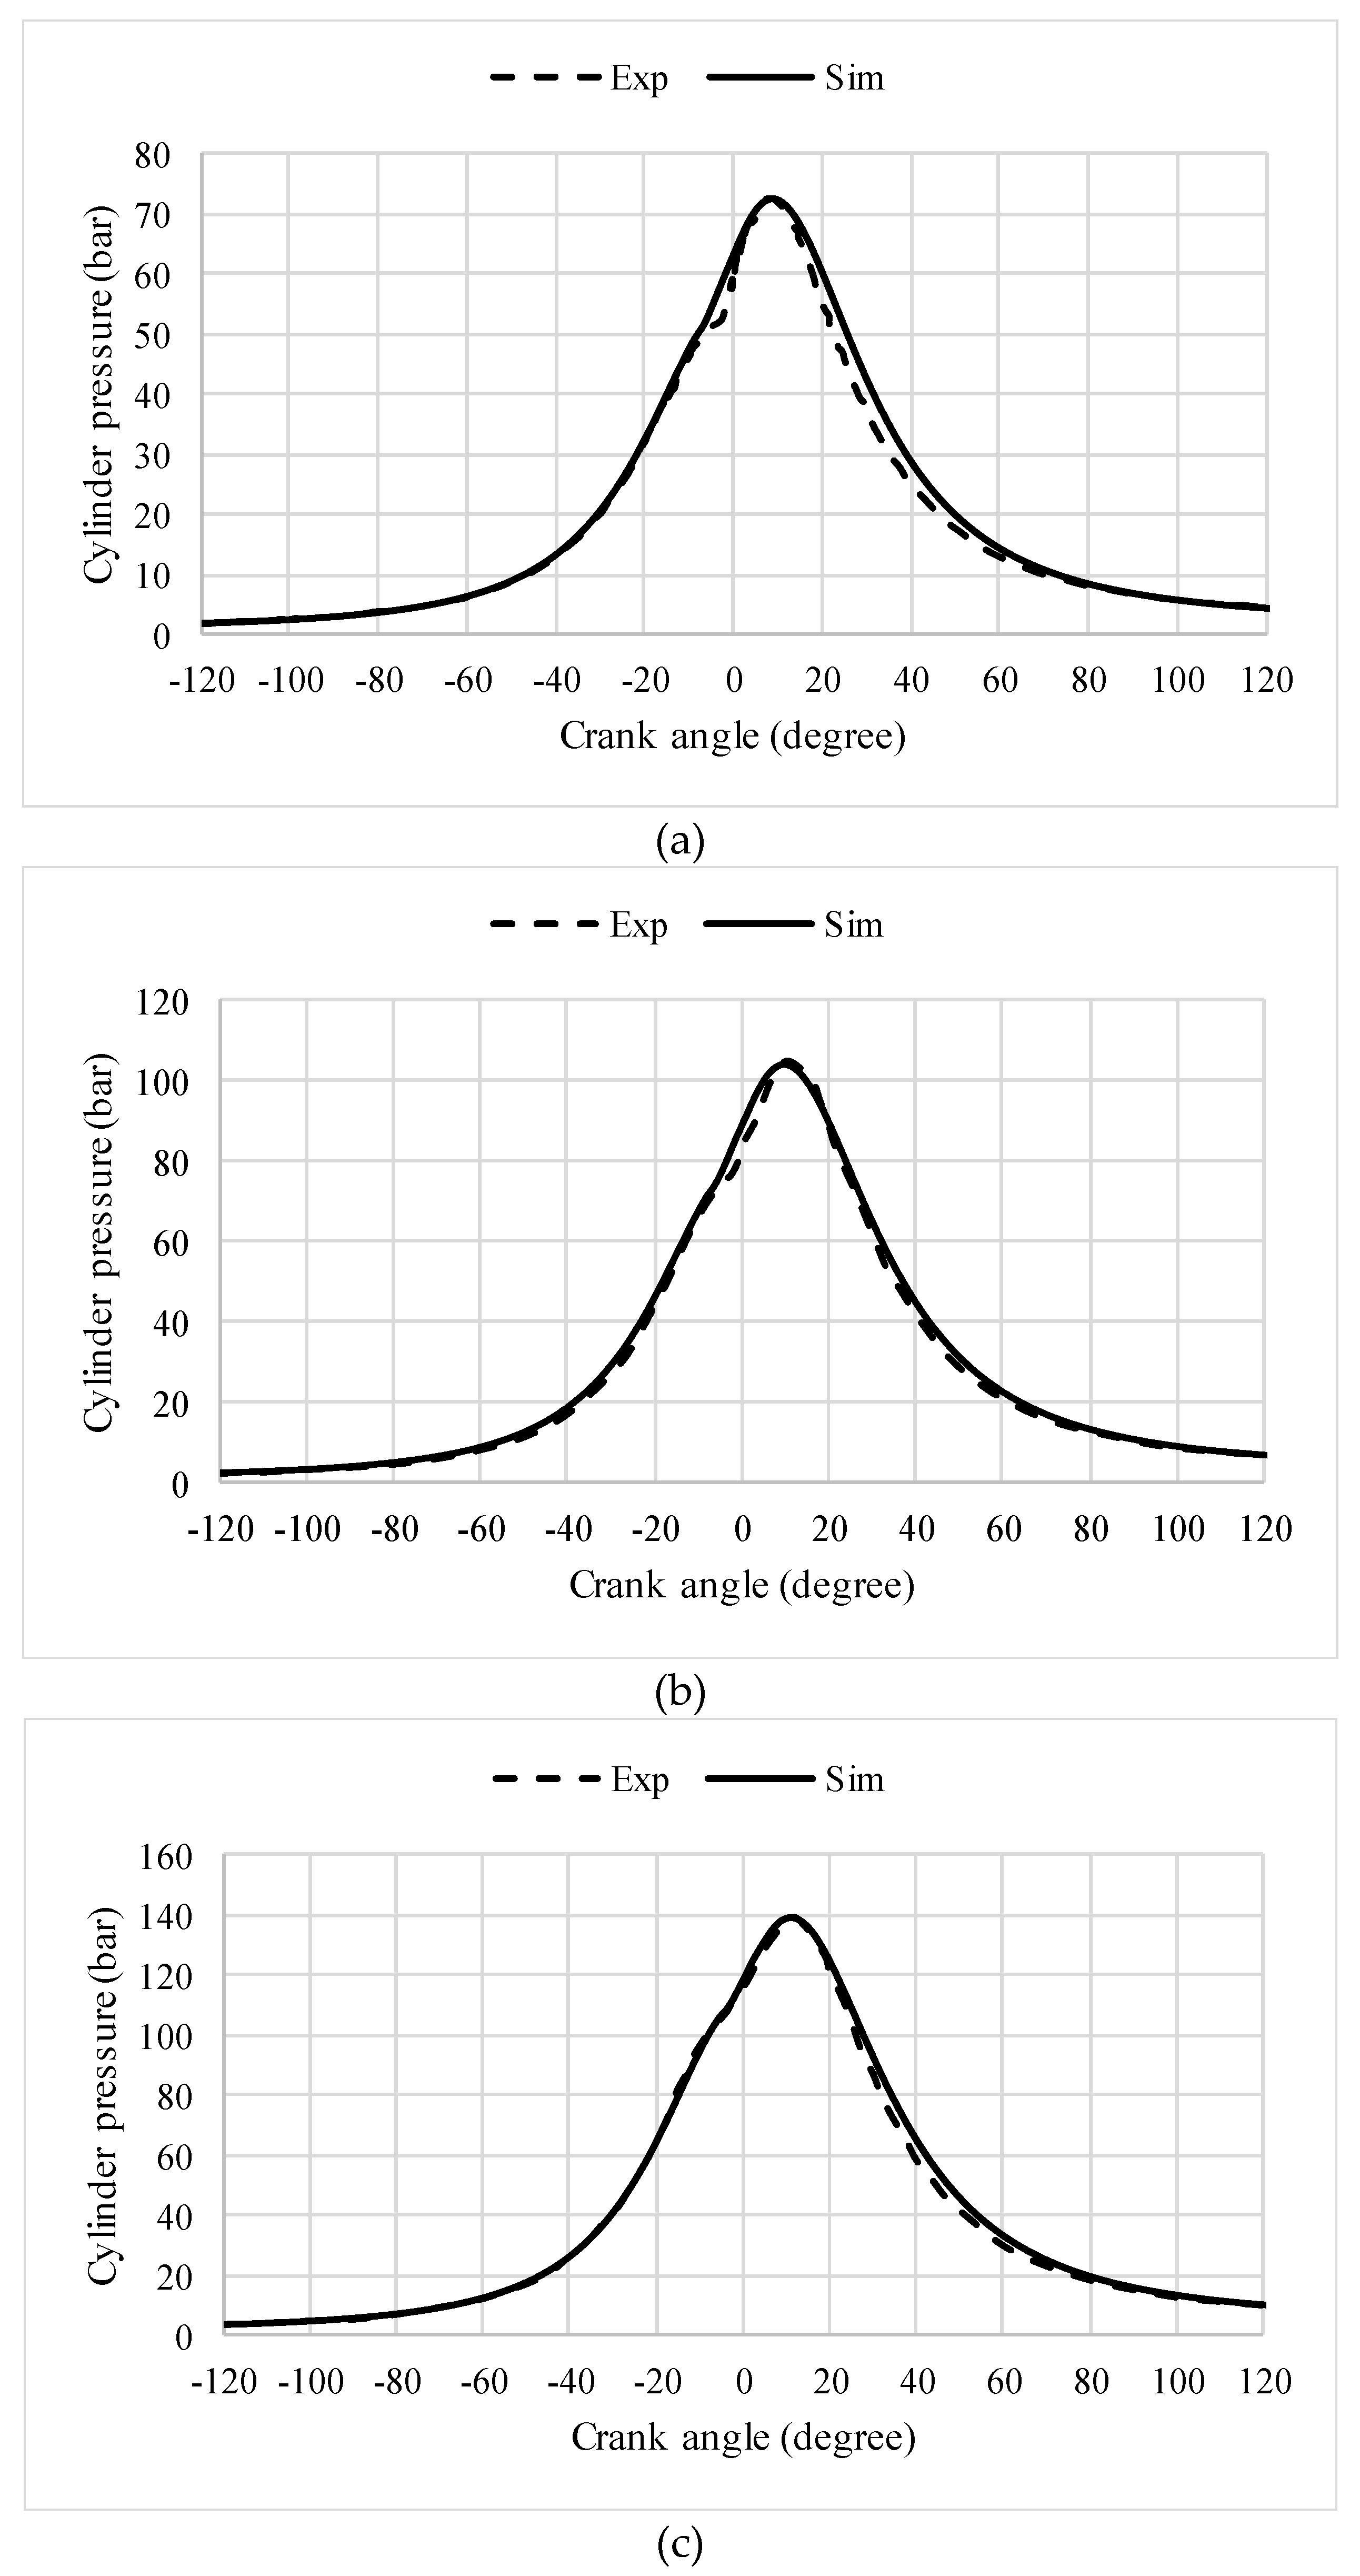
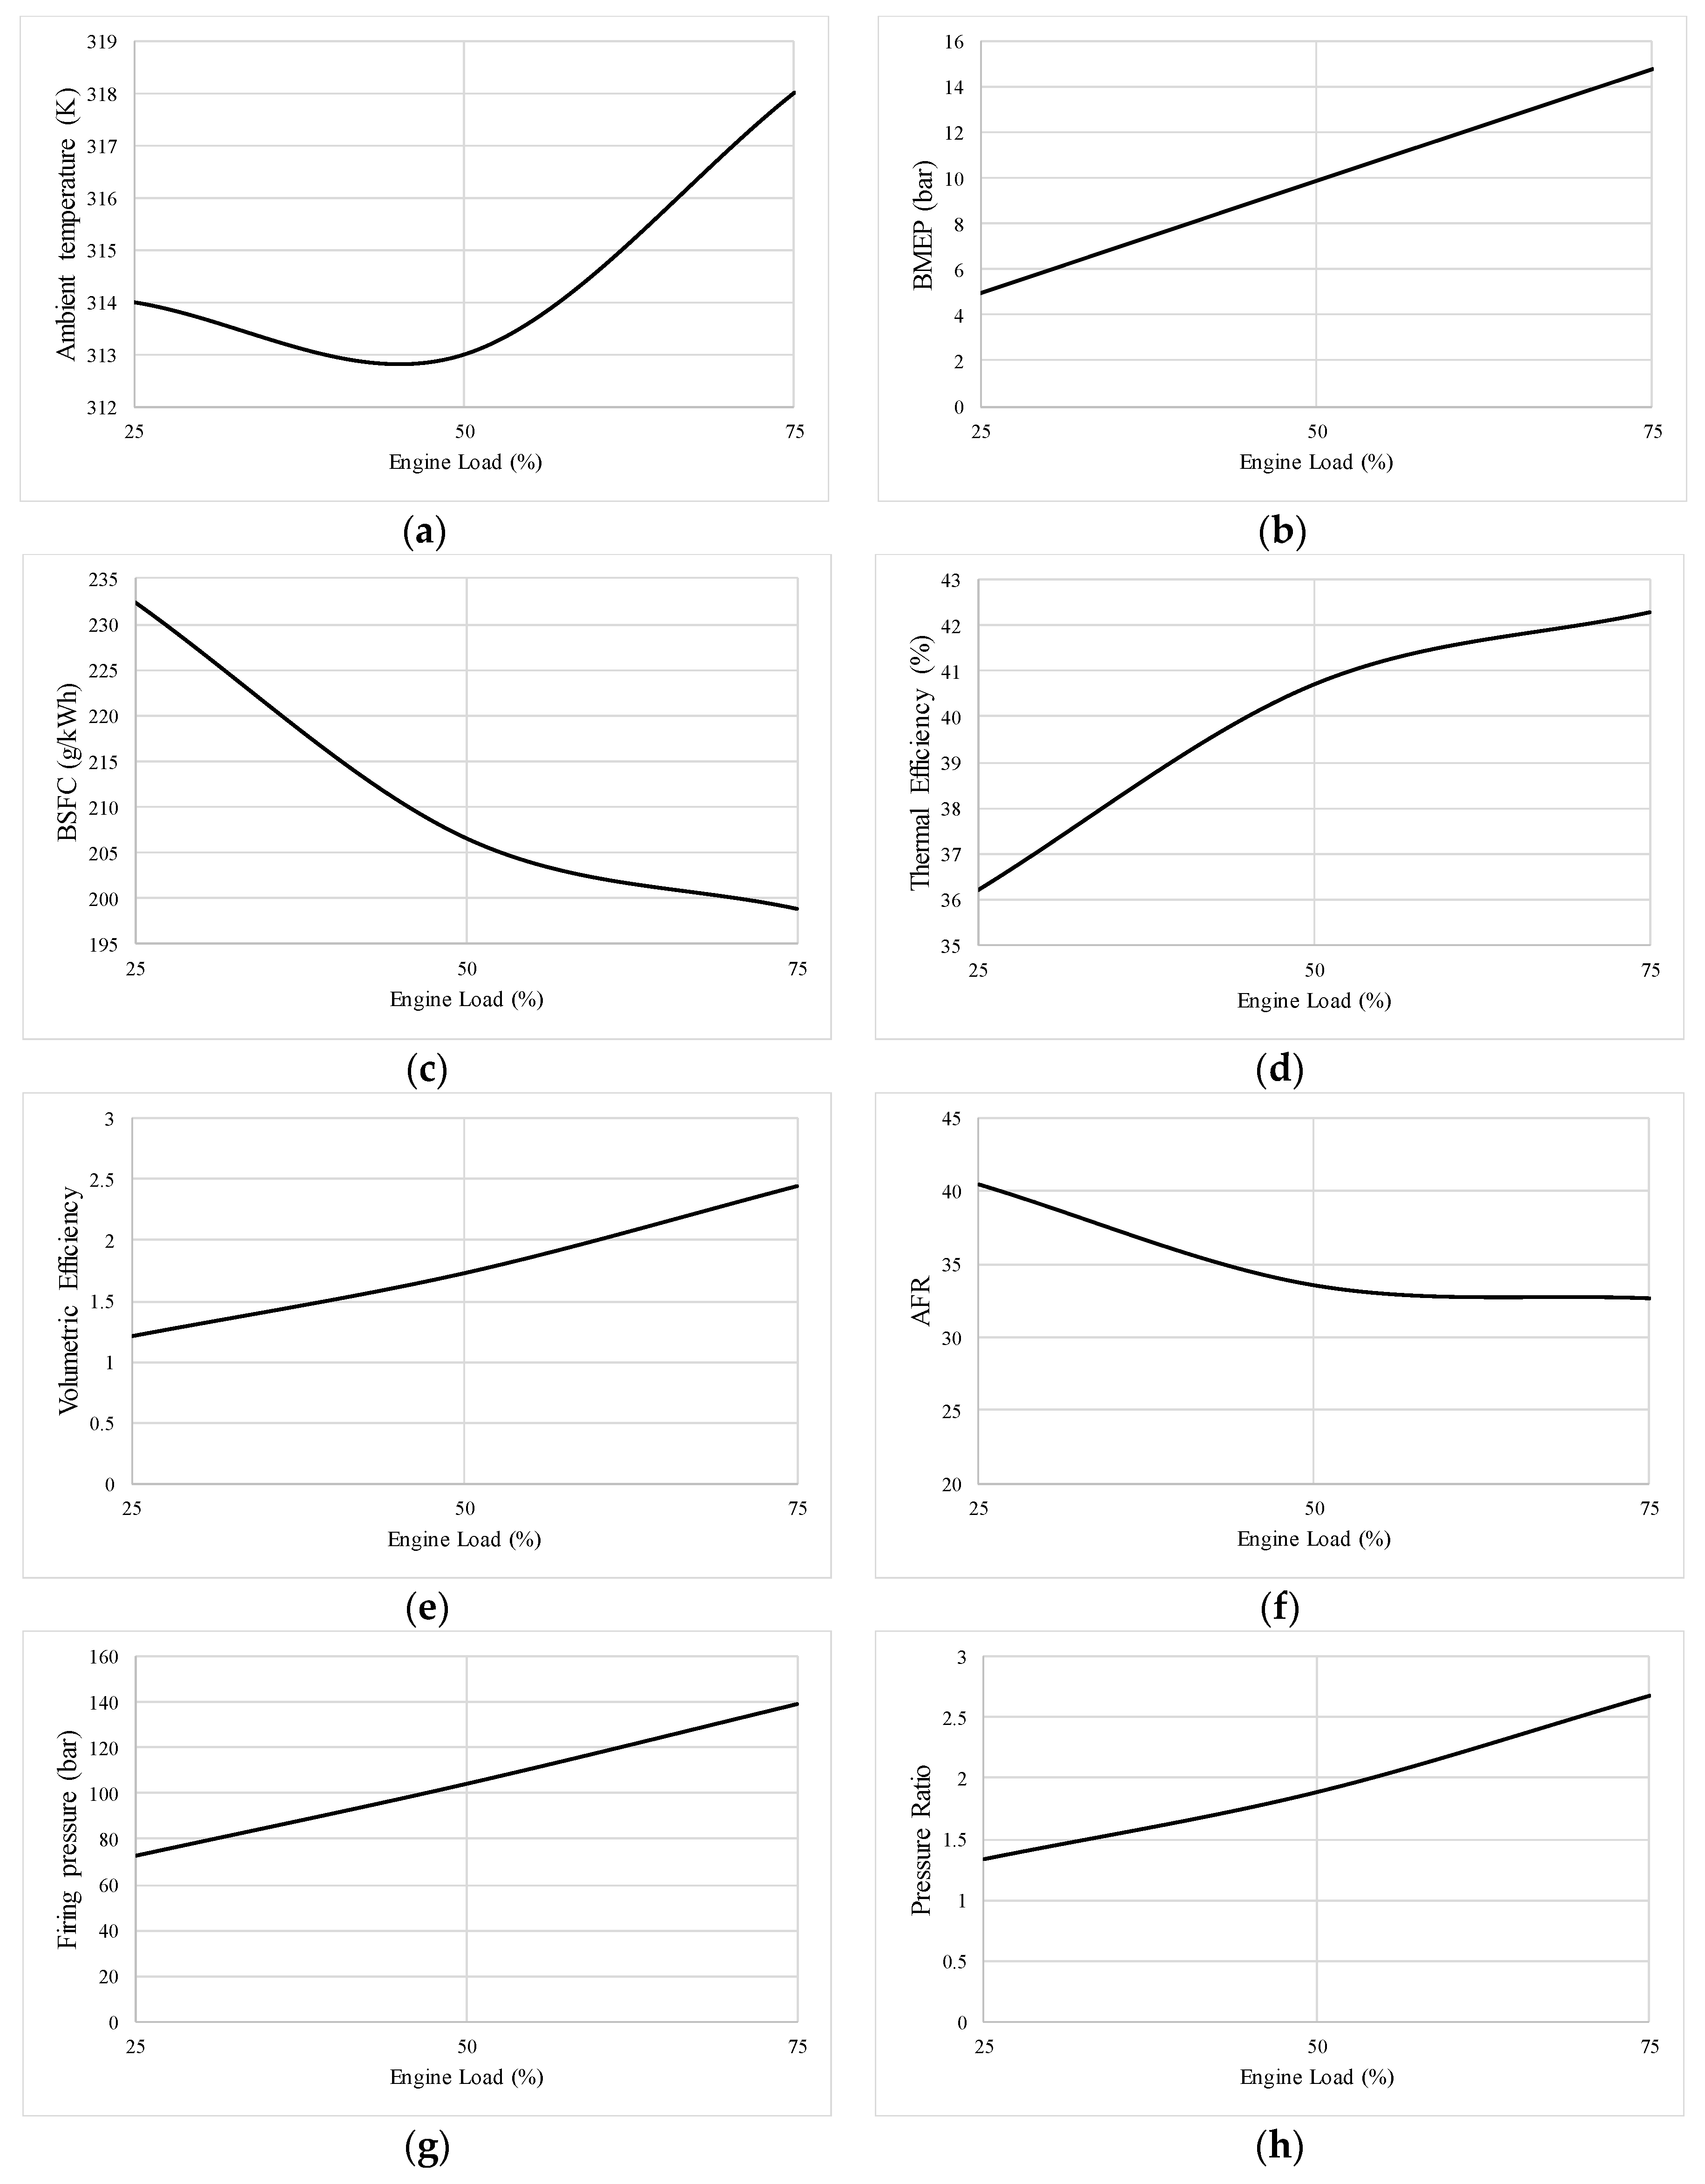
4. Results and Discussions
5. Conclusions
- (1)
- A good agreement is achieved between the simulated and experimental data for different engine loads.
- (2)
- The model finds the optimal values of SOI and the amount of injected fuel by minimizing the MAPE between the two curves (simulated and experimental).
- (3)
- The model succeeds in verifying the firing pressure and the engine brake power for the different loads.
- (4)
- The double Wiebe function based on the Watson model shows effectiveness in simulating the combustion process of the marine Genset considered in this study as shown from the computed in-cylinder pressure diagram. The main advantage of this model that it does not require any calibration of its coefficient, which can be used in the simulation of other diesel engines without the need for the real in-cylinder pressure diagram.
- (5)
- This model can be further used during the calibration procedures of other types of engine models by considering more variables during the simulation.
Author Contributions
Funding
Conflicts of Interest
Abbreviations
| AFR | Air fuel ratio |
| ANN | Artificial neural network |
| ATDC | After top dead center |
| BMEP | Brake mean effective pressure |
| BSFC | Brake specific fuel consumption |
| CFD | Computational fluid dynamics |
| CI | Compression ignition |
| EGR | Exhaust gas recirculation |
| FR | Fuel rate |
| GA | Genetic algorithm |
| HRR | Heat release rate |
| ICE | Internal combustion engine |
| LHV | Lower heating value |
| LSM | Least square method |
| MAPE | Mean absolute percentage error |
| MDO | Marine diesel oil |
| ML | Machine learning |
| MOGA | Multi-objective genetic algorithm |
| NOx | Nitrogen oxides |
| PB | Brake power |
| Pmax | Firing pressure |
| R | Penalty parameter |
| SOI | Start angle of injection |
References
- Hountalas, D.T.; Anestis, A. Effect of pressure transducer position on measured cylinder pressure diagram of high speed diesel engines. Energy Convers. Manag. 1998, 39, 589–607. [Google Scholar] [CrossRef]
- Lyn, W.T. Calculations of the Effect of Rate of Heat Release on the Shape of Cylinder-Pressure Diagram and Cycle Efficiency. Proc. Inst. Mech. Eng. Automob. Div. 1960, 14, 34–46. [Google Scholar] [CrossRef]
- Man Diesel & Turbo. Marine Engine IMO Tier II and Tier III Programme 2018; Man Diesel & Turbo: Augsburg, Germany, 2018. [Google Scholar]
- Bai, F.; Zhang, Z.; Du, Y.; Zhang, F.; Peng, Z. Effects of Injection Rate Profile on Combustion Process and Emissions in a Diesel Engine. J. Combust. 2017, 2017, 1–8. [Google Scholar] [CrossRef] [Green Version]
- Agarwal, A.K.; Atul, D.; Gupta, J.G.; Kim, W.; Choi, K.; Lee, C.; Park, S. Effect of fuel injection pressure and injection timing of Karanja biodiesel blends on fuel spray, engine performance, emissions and combustion characteristics. Energy Convers. Manag. 2015, 91, 302–314. [Google Scholar] [CrossRef]
- Tadros, M.; Ventura, M.; Guedes Soares, C. Assessment of the Performance and the Exhaust Emissions of a Marine Diesel Engine for Different Start Angles of Combustion. In Maritime Technology and Engineering 3; Guedes Soares, C., Santos, T.A., Eds.; Taylor & Francis Group: London, UK, 2016; pp. 769–775. [Google Scholar]
- Mohammadi, A.; Ishiyama, T.; Kakuta, T.; Kee, S.-S. Fuel Injection Strategy for Clean Diesel Engine Using Ethanol Blended Diesel Fuel; SAE Technical Paper 2005-01-1725; 2005; Available online: https://saemobilus.sae.org/content/2005-01-1725 (accessed on 20 April 2020).
- Zhu, Z.; Zhang, F.; Li, C.; Wu, T.; Han, K.; Lv, J.; Li, Y.; Xiao, X. Genetic algorithm optimization applied to the fuel supply parameters of diesel engines working at plateau. Appl. Energy 2015, 157, 789–797. [Google Scholar] [CrossRef]
- Liu, J.; Yao, A.; Yao, C. Effects of diesel injection pressure on the performance and emissions of a HD common-rail diesel engine fueled with diesel/methanol dual fuel. Fuel 2015, 140, 192–200. [Google Scholar] [CrossRef]
- Bernard, G.; Lebas, R.; Demoulin, F.-X. A 0D Phenomenological Model Using Detailed Tabulated Chemistry Methods to Predict Diesel Combustion Heat Release and Pollutant Emissions; SAE Technical Paper 2011-01-0847; 2011; Available online: https://saemobilus.sae.org/content/2011-01-0847/ (accessed on 20 April 2020).
- Senčić, T.; Mrzljak, V.; Blecich, P.; Bonefačić, I. 2D CFD Simulation of Water Injection Strategies in a Large Marine Engine. J. Mar. Sci. Eng. 2019, 7, 296. [Google Scholar] [CrossRef] [Green Version]
- Sun, X.; Liang, X.; Shu, G.; Lin, J.; Wang, Y.; Wang, Y. Numerical investigation of two-stroke marine diesel engine emissions using exhaust gas recirculation at different injection time. Ocean Eng. 2017, 144, 90–97. [Google Scholar] [CrossRef]
- Albrecht, A.; Grondin, O.; Le Berr, F.; Le Solliec, G. Towards a Stronger Simulation Support for Engine Control Design: A Methodological Point of View. Oil Gas Sci. Technol. 2007, 62, 437–456. [Google Scholar] [CrossRef]
- Chan, K.; Ordys, A.; Volkov, K.; Duran, O. Comparison of Engine Simulation Software for Development of Control System. Model. Simul. Eng. 2013, 2013, 1–21. [Google Scholar] [CrossRef] [Green Version]
- Theotokatos, G. On the cycle mean value modelling of a large two-stroke marine diesel engine. Proc. Inst. Mech. Eng. 2010, 224, 193–205. [Google Scholar] [CrossRef]
- Tadros, M.; Ventura, M.; Guedes Soares, C. Numerical Simulation of a Two-Stroke Marine Diesel Engine. In Towards Green Marine Technology and Transport; Guedes Soares, C., Dejhalla, R., Pavletic, D., Eds.; Taylor & Francis Group: London, UK, 2015; pp. 609–617. [Google Scholar]
- Vettor, R.; Tadros, M.; Ventura, M.; Guedes Soares, C. Route Planning of a Fishing Vessel in Coastal Waters with Fuel Consumption Restraint. In Maritime Technology and Engineering 3; Guedes Soares, C., Santos, T.A., Eds.; Taylor & Francis Group: London, UK, 2016; pp. 167–173. [Google Scholar]
- Marques, C.H.; Caprace, J.-D.; Belchior, C.R.P.; Martini, A. An Approach for Predicting the Specific Fuel Consumption of Dual-Fuel Two-Stroke Marine Engines. J. Mar. Sci. Eng. 2019, 7, 20. [Google Scholar] [CrossRef] [Green Version]
- Vettor, R.; Tadros, M.; Ventura, M.; Guedes Soares, C. Influence of Main Engine Control Strategies on Fuel Consumption and Emissions. In Progress in Maritime Technology and Engineering; Guedes Soares, C., Santos, T.A., Eds.; Taylor & Francis Group: London, UK, 2018; pp. 157–163. [Google Scholar]
- Tadros, M.; Ventura, M.; Guedes Soares, C. Predicting the Performance of a Sequentially Turbocharged Marine Diesel Engine Using ANFIS. In Sustainable Development and Innovations in Marine Technologies; Georgiev, P., Guedes Soares, C., Eds.; Taylor & Francis Group: London, UK, 2020; pp. 300–305. [Google Scholar]
- Chakraborty, A.; Roy, S.; Banerjee, R. Characterization of performance-emission indices of a diesel engine using ANFIS operating in dual-fuel mode with LPG. Heat Mass Transf. 2018, 54, 2725–2742. [Google Scholar] [CrossRef]
- Ricardo Wave Software. WAVE 2016.1 Help System. 2016. Available online: https://software.ricardo.com/products/wave (accessed on 8 May 2016).
- Altosole, M.; Campora, U.; Figari, M.; Laviola, M.; Martelli, M. A Diesel Engine Modelling Approach for Ship Propulsion Real-Time Simulators. J. Mar. Sci. Eng. 2019, 7, 138. [Google Scholar] [CrossRef] [Green Version]
- Yan, T.; Yobby, J.; Vundavilli, R. Optimal Design of IC Engine Cooling Fins by Using Genetic Algorithm. In Proceedings of the ASME 2014 International Mechanical Engineering Congress and Exposition (IMECE2014), Montreal, QC, Canada, 14–20 November 2014. [Google Scholar]
- Ahmadi, M. Intake, Exhaust and Valve Timing Design Using Single and Multi- Objective Genetic Algorithm; SAE Technical Paper 2007-24-0090; 2007; Available online: https://www.sae.org/publications/technical-papers/content/2007-24-0090/ (accessed on 20 April 2020).
- GT-SUITE. The Leading CAE Platform for Multi-Physics System Simulations. Available online: https://www.gtisoft.com/ (accessed on 2 January 2017).
- Branney, C.; Cunningham, G.; Spence, S.; McCullough, G. Development of Optimization Techniques for the Design of an Internal Combustion Engine Airbox; SAE Technical Paper 2006-32-0114; 2006; Available online: https://www.sae.org/publications/technical-papers/content/2006-32-0114/ (accessed on 20 April 2020).
- Liu, J.; Wang, J.; Zhao, H. Optimization of the injection parameters and combustion chamber geometries of a diesel/natural gas RCCI engine. Energy 2018, 164, 837–852. [Google Scholar] [CrossRef]
- Munnannur, A.; Kong, S.-C.; Reitz, R.D. Performance Optimization of Diesel Engines with Variable Intake Valve Timing Via Genetic Algorithms; SAE Technical Paper 2005-01-0374; 2005; Available online: https://www.sae.org/publications/technical-papers/content/2005-01-0374/ (accessed on 20 April 2020).
- Millo, F.; Arya, P.; Mallamo, F. Optimization of automotive diesel engine calibration using genetic algorithm techniques. Energy 2018, 158, 807–819. [Google Scholar] [CrossRef]
- D’Errico, G.; Cerri, T.; Pertusi, G. Multi-objective optimization of internal combustion engine by means of 1D fluid-dynamic models. Appl. Energy 2011, 88, 767–777. [Google Scholar] [CrossRef]
- Zhao, J.; Xu, M. Fuel economy optimization of an Atkinson cycle engine using genetic algorithm. Appl. Energy 2013, 105, 335–348. [Google Scholar] [CrossRef]
- Zhu, Z.; Zhang, F.; Li, C.; Han, K. Calibration for Fuel Injection Parameters of the Diesel Engine Working at Plateau via Simulating. Adv. Mech. Eng. 2014, 2014, 1–8. [Google Scholar] [CrossRef]
- Tadros, M.; Ventura, M.; Guedes Soares, C. Optimization procedure to minimize fuel consumption of a four-stroke marine turbocharged diesel engine. Energy 2019, 168, 897–908. [Google Scholar] [CrossRef]
- Hiroyasu, H.; Miao, H.; Hiroyasu, T.; Miki, M.; Kamiura, J.; Watanabe, S. Genetic Algorithms Optimization of Diesel Engine Emissions and Fuel Efficiency with Air Swirl, EGR, Injection Timing and Multiple Injections; SAE Technical Paper 2003-01-1853; 2003; Available online: https://www.sae.org/publications/technical-papers/content/2003-01-1853/ (accessed on 20 April 2020).
- Dempsey, A.B.; Reitz, R.D. Computational Optimization of a Heavy-Duty Compression Ignition Engine Fueled with Conventional Gasoline. SAE Int. J. Engines 2011, 4, 338–359. [Google Scholar] [CrossRef]
- Sakthivel, G.; Sivaraja, C.M.; Ikua, B.W. Prediction OF CI engine performance, emission and combustion parameters using fish oil as a biodiesel by fuzzy-GA. Energy 2019, 166, 287–306. [Google Scholar] [CrossRef]
- Kurtgoz, Y.; Karagoz, M.; Deniz, E. Biogas engine performance estimation using ANN. Eng. Sci. Technol. Int. J. 2017, 20, 1563–1570. [Google Scholar] [CrossRef]
- Goudarzi, K.; Moosaei, A.; Gharaati, M. Applying artificial neural networks (ANN) to the estimation of thermal contact conductance in the exhaust valve of internal combustion engine. Appl. Eng. 2015, 87, 688–697. [Google Scholar] [CrossRef]
- The MathWorks Inc. Fit Curves and Surfaces to Data Using Regression, Interpolation, and Smoothing. Available online: https://www.mathworks.com/products/curvefitting.html (accessed on 10 November 2017).
- The MathWorks Inc. Nonlinear Least Squares (Curve Fitting). Available online: https://www.mathworks.com/help/optim/nonlinear-least-squares-curve-fitting.html (accessed on 5 June 2018).
- Vilhelmsson, C. Compressible Flow Modeling with Combustion Engine Applications. Master‘s Thesis, Linköping University, Linköping, Sweden, 2017. [Google Scholar]
- Ingesson, G. Model-Based Control of Gasoline Partially Premixed Combustion. Ph.D. Thesis, Lund University, Lund, Sweden, 2015. [Google Scholar]
- The MathWorks Inc. Fmincon. Available online: https://www.mathworks.com/help/optim/ug/fmincon.html (accessed on 2 June 2017).
- Byrd, R.H.; Mary, E.H.; Nocedal, J. An Interior Point Algorithm for Large-Scale Nonlinear Programming. SIAM J. Optim. 1999, 9, 877–900. [Google Scholar] [CrossRef]
- Belchior, C.R.P.; Bueno, J. Evaluation of Ignition and Combustion Quality of Different Formulations of Heavy Fuel Marine Oil by Laboratory and Engine Test. In Sustainable Maritime Transportation and Exploitation of Sea Resources; Rizzuto, E., Guedes Soares, C., Eds.; Taylor & Francis Group: London, UK, 2012; pp. 595–602. [Google Scholar]
- Bueno, J.P.V.M. Análise do Desempenho de Motores Diesel Utilizando óleo Combustível Pesado e Combustível Destilado Marítimo. Master‘s Thesis, Universidade Federal do Rio de Janeiro, Rio de Janeiro, Brazil, 2011. [Google Scholar]
- MAN Diesel & Turbo. L16/24 Project Guide—Marine Four-stroke GenSet compliant with IMO Tier II; MAN Diesel & Turbo: Augsburg, Germany, 2017. [Google Scholar]
- Watson, N.; Janota, M.S. Turbocharging the Internal Combustion Engine; Palgrave: London, UK, 1982; pp. 551–594. [Google Scholar]
- Almajri, A.K.; Mahmoud, S.; Al-Dadah, R. Modelling and parametric study of an efficient Alpha type Stirling engine performance based on 3D CFD analysis. Energy Convers. Manag. 2017, 145, 93–106. [Google Scholar] [CrossRef]
- Chen, S.K.; Flynn, P.F. Development of Single Cylinder Compression Ignition Research Engine; SAE Technical Paper 650733; 1965; Available online: https://www.sae.org/publications/technical-papers/content/650733/ (accessed on 20 April 2020).
- UAMCO Ltd. Technical Information: L16/24 Gensets Update; UAMCO Ltd.: Seoul, Korea, 2011. [Google Scholar]
- Heywood, J.B. Internal Combustion Engine Fundamentals; McGraw-Hill: New York, NY, USA, 1988; pp. 72–83. [Google Scholar]
- Woodyard, D. Pounder’s Marine Diesel Engines, 8th ed; Butterworth-Heinemann: Oxford, UK, 2004; p. 241. [Google Scholar]
- Watson, N.; Pilley, A.D.; Marzouk, M. A Combustion Correlation for Diesel Engine Simulation; SAE Technical Paper 800029; 1980; Available online: https://www.sae.org/publications/technical-papers/content/800029/ (accessed on 20 April 2020).
- Ghojel, J.I. Review of the development and applications of the Wiebe function: A tribute to the contribution of Ivan Wiebe to engine research. Int. J. Engine Res. 2010, 11, 297–312. [Google Scholar] [CrossRef]
- Woschni, G. A Universally Applicable Equation for the Instantaneous Heat Transfer Coefficient in the Internal Combustion Engine; SAE Technical Paper 670931; 1967; Available online: https://www.sae.org/publications/technical-papers/content/670931/ (accessed on 20 April 2020).
- Bird, R.B.; Stewart, W.E.; Lightfoot, E.N. Transport Phenomena; John Wiley & Sons Inc.: New York, NY, USA, 2002; p. 439. [Google Scholar]
- Benvenuto, G.; Laviola, M.; Campora, U. Simulation Model of a Methane-Fuelled Four Stroke Marine Engine for Studies on Low Emission Propulsion Systems. In Developments in Maritime Transportation and Exploitation of Sea Resources; Guedes Soares, C., Peña, F.L., Eds.; Taylor & Francis Group: London, UK, 2013; pp. 591–597. [Google Scholar]
- Yeniay, Ö. Penalty Function Methods for Constrained Optimization with Genetic Algorithms. Math. Comput. Appl. 2005, 10, 45–56. [Google Scholar] [CrossRef] [Green Version]
- Michalewicz, Z.; Schoenauer, M. Evolutionary algorithms for constrained parameter optimization problems. Evol. Comput. 1996, 4, 1–32. [Google Scholar] [CrossRef]


| Parameter | Value |
|---|---|
| Bore (mm) | 160 |
| Stroke (mm) | 240 |
| Displacement (liter) | 24.12 |
| No. of cylinders | 5 |
| Compression ratio | 15.2 |
| Brake mean effective pressure (bar) | 19.68 |
| Piston speed (m/s) | 10.5 |
| BSFC (g/kW.h) | 195 |
| IVO (degree ATDC) | 330 |
| IVC (degree ATDC) | −136 |
| EVO (degree ATDC) | 140 |
| EVC (degree ATDC) | 383 |
| Number of valves per cylinder | 4 |
| Items | Units | Reference Data | Ricardo Wave | Error% |
|---|---|---|---|---|
| Intake temperature | °C | 41.00 | 40.98 | 0.04 |
| Inlet manifold pressure | bar | 1.35 | 1.34 | 0.74 |
| Exhaust temperature | °C | 405.00 | 417.54 | 3.09 |
| Firing pressure | bar | 72.91 | 72.50 | 0.56 |
| Engine power | kW | 118.75 | 121.75 | 2.46 |
| Items | Units | Reference Data | Ricardo Wave | Error% |
|---|---|---|---|---|
| Intake temperature | °C | 40.00 | 39.97 | 0.07 |
| Inlet manifold pressure | bar | 1.88 | 1.88 | 0.00 |
| Exhaust temperature | °C | 483.00 | 488.00 | 1.03 |
| Firing pressure | bar | 105.50 | 104.12 | 1.32 |
| Engine power | kW | 238.00 | 236.00 | 0.84 |
| Items | Units | Reference Data | Ricardo Wave | Error% |
|---|---|---|---|---|
| Intake temperature | °C | 45.00 | 45.00 | 0.00 |
| Inlet manifold pressure | bar | 2.64 | 2.66 | 0.75 |
| Exhaust temperature | °C | 497.00 | 513.86 | 3.39 |
| Firing pressure | bar | 139.6 | 139.18 | 0.30 |
| Engine power | kW | 357.00 | 356.17 | 0.23 |
© 2020 by the authors. Licensee MDPI, Basel, Switzerland. This article is an open access article distributed under the terms and conditions of the Creative Commons Attribution (CC BY) license (http://creativecommons.org/licenses/by/4.0/).
Share and Cite
Tadros, M.; Ventura, M.; Guedes Soares, C. Data Driven In-Cylinder Pressure Diagram Based Optimization Procedure. J. Mar. Sci. Eng. 2020, 8, 294. https://doi.org/10.3390/jmse8040294
Tadros M, Ventura M, Guedes Soares C. Data Driven In-Cylinder Pressure Diagram Based Optimization Procedure. Journal of Marine Science and Engineering. 2020; 8(4):294. https://doi.org/10.3390/jmse8040294
Chicago/Turabian StyleTadros, Mina, Manuel Ventura, and C. Guedes Soares. 2020. "Data Driven In-Cylinder Pressure Diagram Based Optimization Procedure" Journal of Marine Science and Engineering 8, no. 4: 294. https://doi.org/10.3390/jmse8040294