Article

Analysis of Piled Concrete Foundation for a 3-MW Class Offshore Wind Turbine along the Southwest Coast in Korea

1
Department of Energy Plant Engineering, Catholic Kwandong University, Gangnung 25601, Korea
2
Department of Civil and Environmental System Engineering, Konkuk University, Seoul 05029, Korea
3
Department of Civil Engineering, Catholic Kwandong University, Gangnung 25601, Korea
*
Author to whom correspondence should be addressed.
J. Mar. Sci. Eng. 2020, 8(3), 215; https://doi.org/10.3390/jmse8030215
Submission received: 2 March 2020 / Revised: 14 March 2020 / Accepted: 14 March 2020 / Published: 20 March 2020

Abstract

:
Concrete foundations have received attention as offshore wind turbine support structures because of their various advantages. However, because of the lack of information on structural analysis and the design method of complex marine environmental loads, concrete foundations cannot be applied on actual sites. Therefore, the structure behavior mechanism and concrete reinforcement design need to be evaluated based on soil-structure interactions. Herein, an efficient method for analysis of piled concrete foundations (PCFs) is presented, and the stability of PCF structures is evaluated under environmental conditions of the coast in Korea for a 3-MW wind turbine. Three analytical parameters for PCF models were defined to consider soil-structure interaction. The results of each model were compared with the displacement, stresses, and natural frequencies. Using the analysis results, a prestressing reinforcement design for concrete foundations was proposed. Quasi-static analysis showed that maximum displacement was sufficiently small and the maximum stresses did not exceed the allowable stresses. PCF showed excellent dynamic performance and structural stability. In addition, stiffness of the soil spring model influenced the natural frequency rather than the stiffness of the pile type. Detailed analysis of the connections between piles and concrete need to be studied in the future.

1. Introduction

The amount of offshore wind energy has recently increased across the globe as one of the renewable energy sources. The Korean Government has also started to invest in the offshore wind turbine industry and will move forward with projects to develop offshore wind farms in Korea. In 2010, the Korea Government Ministry of Knowledge Economy presented the Offshore Wind Turbine Roadmap that included a 2.5-GW class offshore wind farm on the southwest coast of Korea with an investment of 10.2 trillion KRW [1]. A private sector-led project was started to build a large-scale 5-GW wind farm off the coast of southwestern Jeolla Province in Korea. A 1-GW class onshore wind farm and a 4-GW class offshore wind farm are planned to be constructed by 2023 with the aim of reducing carbon dioxide emissions by 5.4 million tons.
Meanwhile, many studies focusing on offshore wind turbines in Korea have been completed. Oh et al. [2,3] studied the feasibility of the offshore wind resources around the Korean Peninsula for a 100-MW class offshore wind farm and performed an assessment of the wind energy potential at a demonstration site in Korea to estimate the economic benefits and establish reliable design criteria. Kim et al. [4] carried out research on the selection of the optimal site for an offshore wind farm around the Korean Peninsula by comparing economic benefits of the development project to the entire cost. From this research, it was concluded that the construction of an offshore wind farm along the coast near Buan-gun and Yeonggwang-gun in Jeolla Province was preferred from an economic and site applicability standpoint. Oh et al. [5] preliminarily evaluated the offshore wind turbine monopile foundation dimensions based on the site conditions near the island Wi-do in the West Sea of Korea by considering aerodynamic loads and hydrodynamic loads. They presented foundation design methods and optimal dimensions of the monopile foundation for the selected site. For the feasibility study of the 5 MW offshore wind turbine substructures in Korea’s southwest coast, Shi et al. [6] compared the dynamic responses of different substructures, including the monopile, jacket, and multipile, by performing an eigenvalue analysis and a coupled aero-hydro-servo-elastic simulation.
There are many types of support structures, such as the steel monopile, steel jacket, and the concrete gravity-based structure (GBS). The most used type is the steel monopile, which has a transition piece to aid installation. Recently, however, the concrete GBS has been preferred because of its cost efficiency for large-capacity wind turbines in the deep sea [7,8,9]. However, a new type of structure that consists of concrete and steel materials is being developed due to the limitation of GBS. In December 2012, BAM Energie [10] presented a cutting edge concrete gravity base foundation suitable for larger offshore wind turbines in deeper waters. It consists of a concrete caisson and steel shaft; the base is cast onshore and then installed offshore using standard vessels, thus eliminating the need for heavy lifting equipment. Kim [11] proposed a new hybrid type of cost-efficient support structure composed of a concrete tripod and steel shaft. To validate the new structure, a preliminary design concept was applied. Despite these efforts, that kind of structure was difficult to apply to the southwest coast in Korea where weak soil is too deep to sustain the GBS structure. To overcome the disadvantages of the existing type of offshore wind turbine support structure, Kim et al. [12] suggested a new hybrid concrete support structure. The suggested type was supported not only by a gravity-type foundation, but also by driven piles, and it was possible to reduce the weight of the structure. Stream function wave theory and the environmental conditions in the Southwest Coast in Korea were applied, and the hybrid support structure showed enough structural stability to be applied to real site conditions in Korea. Unlike steel fabricated of isotropic material, reinforced concrete is a composite material in which the relatively low tensile strength and ductility of the concrete are counteracted by the inclusion of reinforcement with a higher tensile strength or ductility. For design of the concrete structure, the ultimate member force is calculated through structural analysis.
In this study, an efficient method for the analysis of a piled concrete foundation (PCF) is presented, and the stability of the PCF structure is evaluated under the environmental conditions of the coast near the Jaeun island in Jeonnam-do of Korea. Three analytical models for PCF were defined to consider the interaction between soil and structure. The results of each model were compared with the displacement, stresses, and natural frequencies. Using the results of analysis, the prestressing reinforcement design for the concrete foundation was carried out. The displacements and rotation angles, end bearing capacity, and pulling capacity were examined for evaluation of the pile. A pile foundation installed in soft ground must be secured to support various loads of the upper structure, so that a desired power can be stably obtained through a turbine. Moreover, natural frequency analysis was performed to investigate the resonance occurrence in the PCF structure. The study aims to provide an efficient analysis method and prestressing reinforcement design method through analysis results of piled concrete foundations for offshore wind turbines and present design references for the future.

2. Theoretical Background

2.1. Wave Force

Airy wave theory is a relatively simple wave theory with a small amplitude, and the wave curve is a sine curve. The wave height is assumed to be smaller than the wave length in deep water and the water depth in shallow, and thus, it is called the small amplitude wave theory. In the small amplitude wave theory, the waves used in the calculation of velocity and acceleration are periodically repeated with the same wave height and wave length; thus, the equation of motion is linearized. If the x-direction is defined as the horizontal direction and z-direction as the vertical direction, surface wave elevation from the still water level and the water particle velocity can be expressed by Airy wave theory as follows:
η ( x , t ) = H 2 cos ( k x ω t )
u ( x , z , t ) = π H T cosh [ k ( h + z ) ] sinh k h cos ( k x ω t )
w ( x , z , t ) = π H T sinh [ k ( h + z ) ] sinh k h sin ( k x ω t )
where x and z are Cartesian coordinates with z = 0 at the still water level (positive upwards), H is wave height, T is wave period, h is water depth, η is the free water surface, u and w are velocity components in the x , z directions, respectively, k is the wave number, ω is wave frequency defined by 2 π / T , and t is the time. The horizontal and vertical accelerations of the fluid particle, a x and a y , can be calculated by differentiating u and w over time t , and Equations (2) and (3) can be applied to calculate the acceleration as follows:
a x ( x , z , t ) = 2 π 2 H T cosh [ k ( h + z ) ] sinh k h sin ( k x ω t )
a y ( x , z , t ) = 2 π 2 H T sinh [ k ( h + z ) ] sinh k h cos ( k x ω t )
Wave force can be calculated by Morison equation as follows:
F T = 1 2 ρ C D D | u | u + π D 2 4 ρ C M a x
where F T is the total force, ρ is the density of water, C D and C M are the drag and inertia coefficients, respectively, and D is the diameter of the vertical cylinder. The first term in Equation (6) is the drag component and the second term is the inertia component.

2.2. Soil Spring Stiffness

To calculate the soil spring stiffness, a soil model called the Winker model can be used, and the spring stiffness in the horizontal and vertical directions can be calculated [13]. First, the horizontal soil spring stiffness at any depth is estimated as follows:
K h = k s Δ Z Z
where Z denotes any depth in soil and Δ Z denotes the spacing between the springs at a depth Z . k s is the modulus of subgrade reaction at a depth Z , and this can be calculated from some methods, such as constant distribution, linear distribution, equation by Matlock and Reese, equation by CSN 73 1004, and an equation from Vesic [14]. The vertical soil spring stiffness can be classified into end bearing stiffness K v b and skin friction resistance stiffness K v f , as shown in Figure 1. The vertical end bearing stiffness K v b can be calculated using Equation (8).
K v b = k s D 2 L ( D D * )
where L is the pile length, D is the diameter of pile, and D * is the nominal diameter of the pile. The vertical skin friction resistance stiffness K v f can be calculated using the equation given by Pender [15].
K v f = 1.8 E s t i p ζ λ 0.5 λ ζ α ,
where ζ is the pile ratio ( L / D ) and λ is the pile-soil stiffness ratio. To get the soil spring stiffness at the bottom of the pile, the end bearing stiffness and skin friction resistance stiffness need to be combined, as presented in Figure 1.

3. 3-MW Class Piled Concrete Foundation Model

The PCF structure to support a 3-MW wind turbine was determined for the offshore conditions of the coast near Jaeun island in Jeollanam-do of Korea. The dimensions and material properties of the PCF structure are presented in Figure 2 and Table 1, respectively. The thickness of the steel shaft is 40 mm, including corrosion thickness, and the outer diameter of the shaft to be connected to the tower of the 3-MW wind turbine is 4.5 m. The diameter of the concrete foundation is 6.0 m, the outer diameter of the shaft is 4.5 m, and the thickness is 0.75 m. The diameter of the bottom of the concrete foundation is 11 m, excluding the concrete sleeve, which is 1.0-m thick. For the pile, which has a 2.0-m diameter, the concrete-sleeve has a 3.0-m diameter and 0.5-m thickness. To determine the heights of the shaft and concrete structure, the datum level (DL), mean higher high water level (MHHW), and maximum wave height are considered. MHHW is DL (+) 4.86 m and maximum wave height is DL (+) 12.64 m. Thus, the heights of the shaft and concrete structure are DL (+) 16.82 m and DL (+) 9.0 m, respectively, to install the steel platform above the maximum wave height of DL (+) 12.46 m. Construction cost per 1 MW turbine capacity of PCF was calculated based on the dimensions of the structure and construction site and was compared to the cost of the jacket structure calculated using the same site conditions. The cost of manufacturing and construction of 10 PCF structures are calculated as 4.47 and 23.89 billion KRW respectively, and construction cost per 1 PCF was 2.84 billion KRW. Therefore, construction costs per 1 MW of PCF structure is 0.945 billion KRW and this is indicated a cost difference of approximately 7% when comparing with the cost of jacket 1.013 billion KRW.

4. Load Conditions and Load Combinations

4.1. Local Site Description

The coast near Jaeun island that was selected for analysis of the PCF structure is located in Jeolla Province of Korea, as shown in Figure 3. This area has sufficient wind conditions, and the range of wind velocity is from 7.0 to 7.5 m/s. Water depths are from 20 to 40 m, and the potentials for power generation by offshore wind turbines in this area are 4 GW and 6 GW within 20 m and 40 m water depths, respectively. The soil conditions are as shown in Table 2. The soil is sandy or clay soil. On account of the above conditions, Jeonnam-do announced a 5-GW wind farm project in 2009, and this project is currently progressing. For this project, the economic feasibility study of the selected site for the offshore wind farm was conducted from 2012 to 2014. From January 2013 to February 2014, wind condition data were measured by an offshore meteorological tower, and the mean wind velocity was found to be 7 m/s.

4.2. Dead Load and Turbine Load

The self-weight, including the steel shaft, platform, and concrete support structure, affects the whole structure as a dead load. This dead load can be determined from the properties of the construction material. The weight of the steel shaft can be calculated by adding 5% of the self-weight to consider the connecting reinforcement in the shaft. We applied 32.634 kN of the self-weight to take account for the platform. For the turbine load, the 3-MW wind turbine of Doosan heavy industry (WinDS3000) was considered; the specifications are shown in Table 3 [16]. Tower base loads were calculated based on the data from the Jeju island offshore wind farm which has a tower height of 62.4 m and a wind speed (50 year extreme, 10 min) of 46.9 m/s.

4.3. Environmental Load

As mentioned above, the targeted site for analysis of the PCF structure is along the coast near Jaeundo in Jeollanam-do of Korea. The environmental load was calculated based on the marine conditions at a water depth of 11.80 m, maximum wave height of 12.64 m, wave period of 13.67 s, current velocity of 2.52 m/s by tide, current velocity of 6.0 m/s by wind, and maximum wind speed of 70.0 m/s. To analyze the PCF under environmental loads, structural analysis software MIDAS Civil [17] was used. MIDAS Civil is the general-purpose structural analysis software that has been used in worldwide and integrated solution system for civil engineering including static analysis, dynamic analysis, etc. However, the modules to calculate wave force and current force are not included in the MIDAS software. Thus, wave force and current force were calculated from the equations suggested by Det Norske Veritas [18], and these forces were applied to the structure as distributed loads in the MIDAS software.
Depending on the location such as deep water or shallow water, an adequate wave theory was selected for the computation of wave kinematics such as velocity and acceleration. Using the graph for finding validity of the wave theories proposed by Le Méhauté [19], a suitable wave theory can be selected the based on the relationship between dimensionless relative depth h / ( g T 2 ) and dimensionless wave steepness H / ( g T 2 ) . From this graph, the wave condition in the targeted site was in the area above the shallow water breaking limit H / h =0.78 with h / ( g T 2 ) =0.00644 and H / ( g T 2 ) = 0.0069. Thus, the slamming force should be considered, and calculation of slamming force is classified to three cases according to sea level. In these three cases, the case where the wave force was the largest was determined. In the case of the highest astronomical tide (HAT), Morison’s equation with Airy theory in Equation (6) is required. In the case of mean sea level (MSL) and lowest astronomical tide (LAT), the equation of slamming force with Airy theory in Equation (10) is recommended.
{ F s = 1 2 ρ C S D u 2 C s = 5.15 ( D D + 19 s + 0.107 s D )
From the selected site conditions, HAT was 17.66 m (11.8 m + 4.86 m + 1.0 m), MSL was 14.73 m (11.8 m + 2.43 m + 0.5 m), and LAT was 11.80 m. The largest wave force was calculated in the case of LAT; 1.0 was applied for the drag coefficient, and 2.0 was applied for the inertia coefficient to calculate wave forces based on the recommendation from DNV-RP-C205 [18]. Similarly, Morison equation was used to calculate the current force, and current velocity was applied by using Equation (11).
v z ( z ) = v t i d e ( h + z h ) 1 7 + v w i n d ( h 0 + z h 0 )
where v t i d e and v w i n d are current velocity by tide and wind, respectively. In this study, v t i d e = 2.52 m/s, v w i n d = 6.0 m/s and 50 m were used.
Total wave force F t o t a l along the height calculated by adding all of the forces (drag F d , inertia F i , slamming F s l a m m i n g , and current forces F c u r r e n t ) are plotted in Figure 4. Maximum wave force occurred when the wave period was 7T/8 period (11.916 s). Here, 0 m is the highest position where wave and current is applied in the vertical axis.

4.4. Load Combinations

On the offshore wind turbine structure, environmental loads such as the wave load, current load, wind load, and turbine load due to the turbine located at the top of the tower were applied, and these loads are appropriately combined by the service limit state to perform the structural analysis. In the case of prestressing tendon, it is necessary to design using serviceability limit state(SLS), and the material factor γ m for the SLS is taken as 1.0. In this analysis, a total of 12 load cases were applied and defined by the design conditions and the weather conditions according to IEC 61400-1 International Design Standards [20], as presented in Table 4. DLC6.1ab, DLC6.2da, DLC6.2ka, DLC6.2fb, DLC6.2kb, and DLC6.2db are parked and idling situations; DLC2.2cc and DLC2.3bc are power generation and fault situations; DLC1.4af and DLC1.3a are power production situations; DLC3a is parked and fault conditions; and DLC8.1al is transport, assembly, maintenance, and repair.

5. Structural Analysis and Design

5.1. Structural Modeling

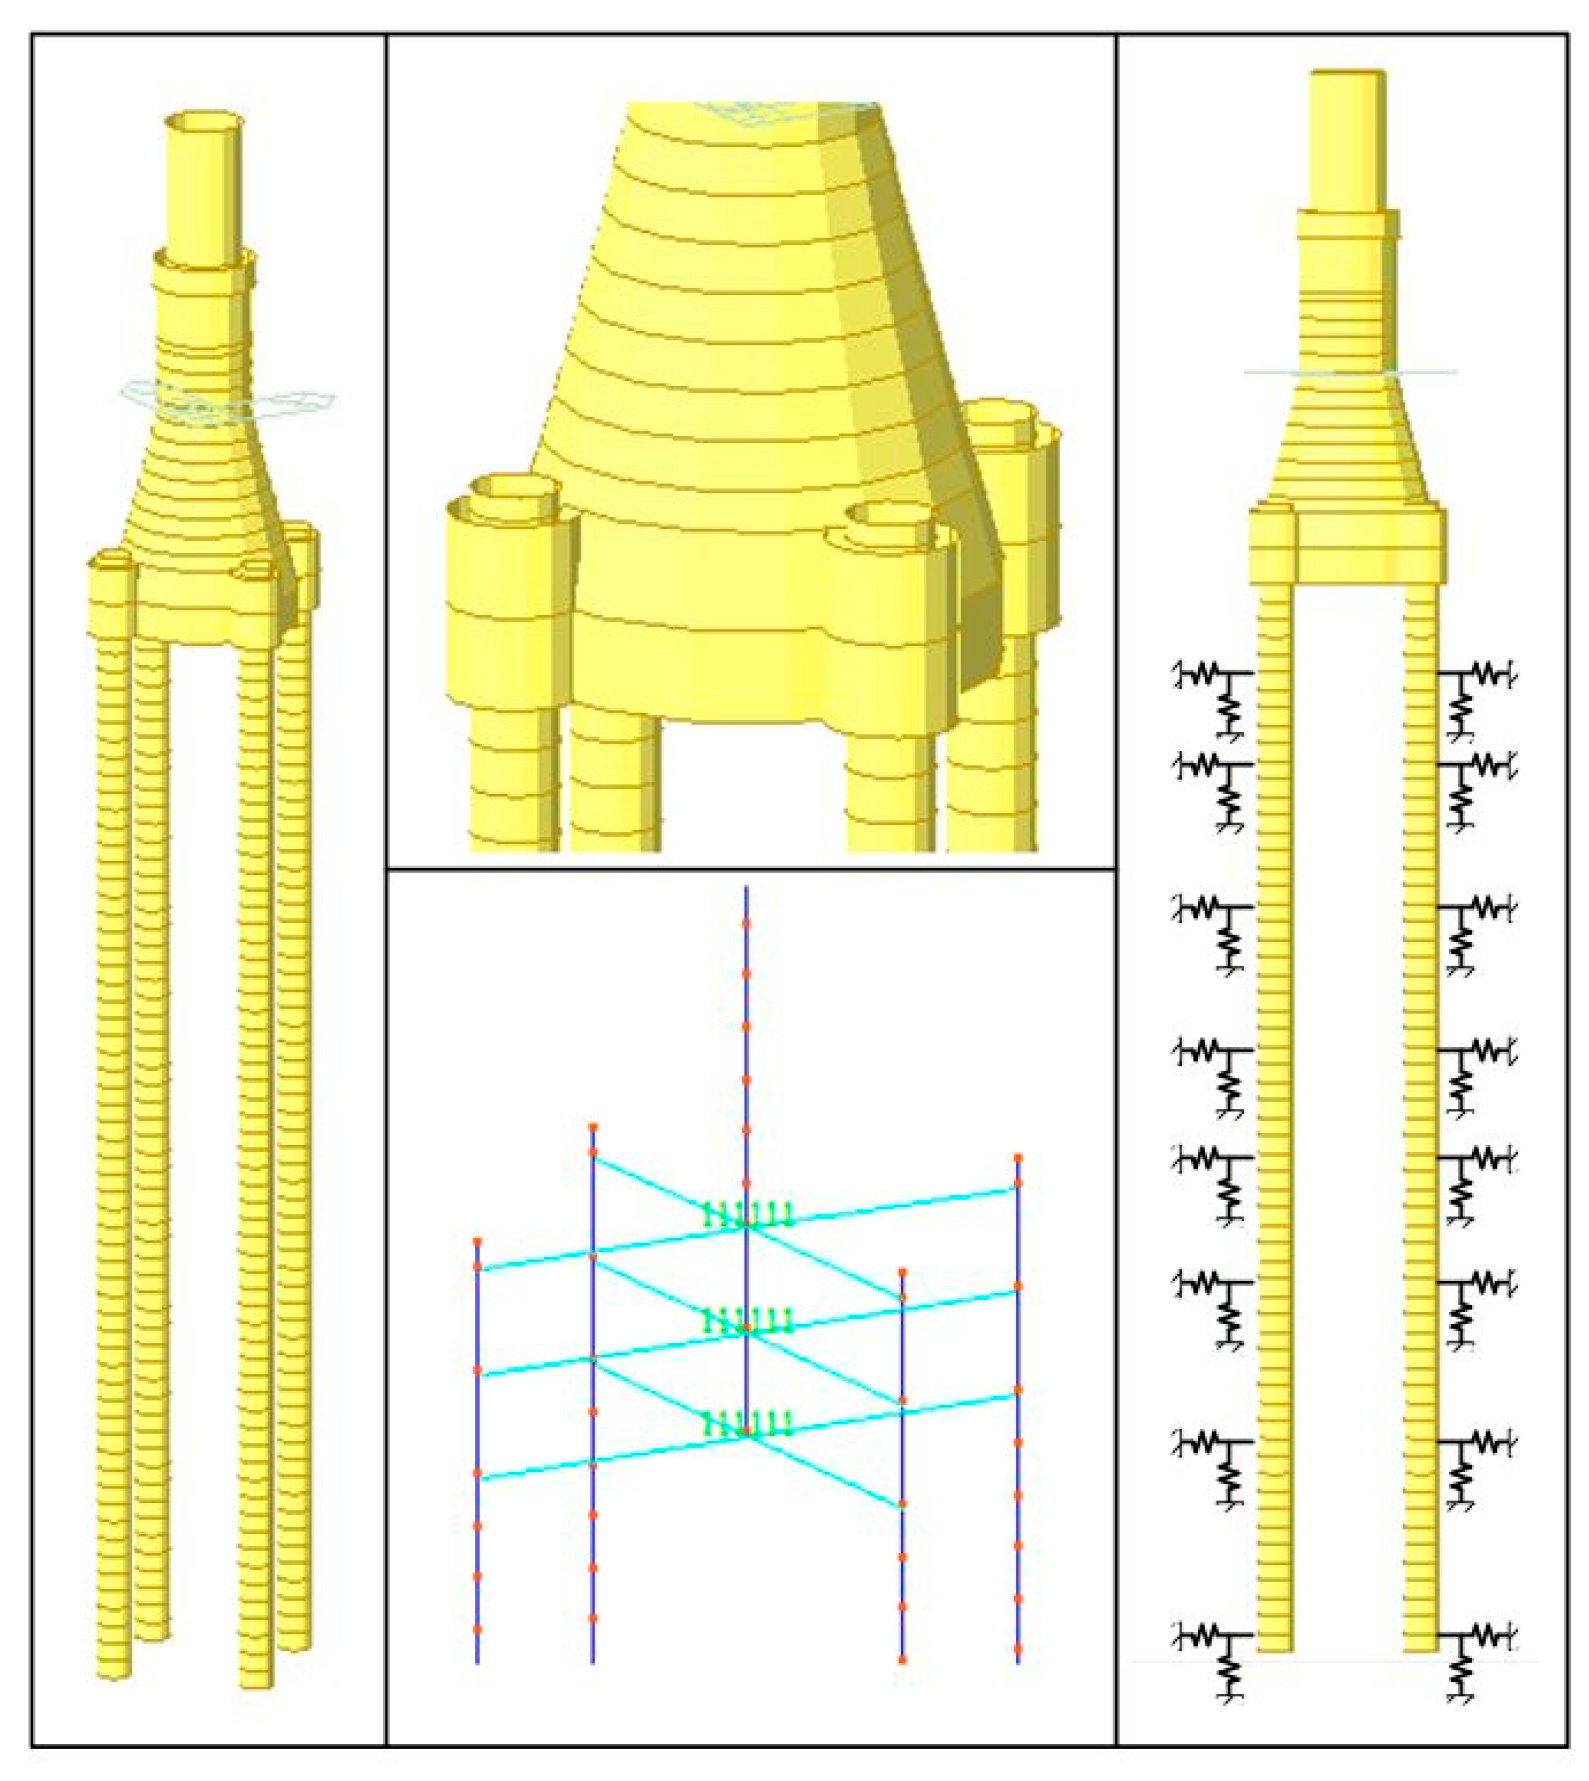
For the structural analysis of the PCF structure, modeling was implemented by the structural analysis software MIDAS Civil, as shown in Figure 5. The steel shaft and concrete substructure were modeled using frame elements, and the pile and concrete sleeve were also modeled as frame elements to examine the behavior of the structure due to the effects of the pile. Modeling is performed using the frame element, therefore it is necessary to connect the concrete foundation element and concrete sleeve element, and an effective connection method needs to be considered.
Assuming that the concrete sleeves and piles are sufficiently composited with a length of 4 m, the rigidity of the concrete foundation itself is high. Therefore, as shown in Figure 5, the concrete foundation element and the concrete sleeve element are connected using a rigid link. To apply the behavior of the pile according to the soil conditions, the soil is modeled as an elastic foundation, and the horizontal and vertical elastic springs are applied to the pile. For the pile, a reverse circulation drill (RCD) pile with a diameter of 2 m, which is used for marine construction, is applied. The soil where the PCF structure is located is composed of sandy soil and weathered soil up to a depth of 60 m, as shown in Table 2, therefore piles were penetrated to the weathered soil layer to achieve the end bearing capacity of the pile. Thus, the total length of the pile was 60 m, and the diameter and thickness were 1.8 m and 0.05 m, respectively. A 1-m deep pile was modeled as a frame element, and a total of 60 frame elements were used to model the pile, with horizontal and vertical elastic springs applied to the center of each pile. The spring stiffnesses were calculated according to the soil conditions in Section 2.2 and Equations (7)–(9), and the vertical and spring stiffness for each layer are shown in Table 5.
In this study, three analytical parameters (i.e., boundary conditions, type of pile, and location of stress concentration) are considered for structural models, and each model is defined as shown in Table 6.

5.2. Quasi-Static Analysis

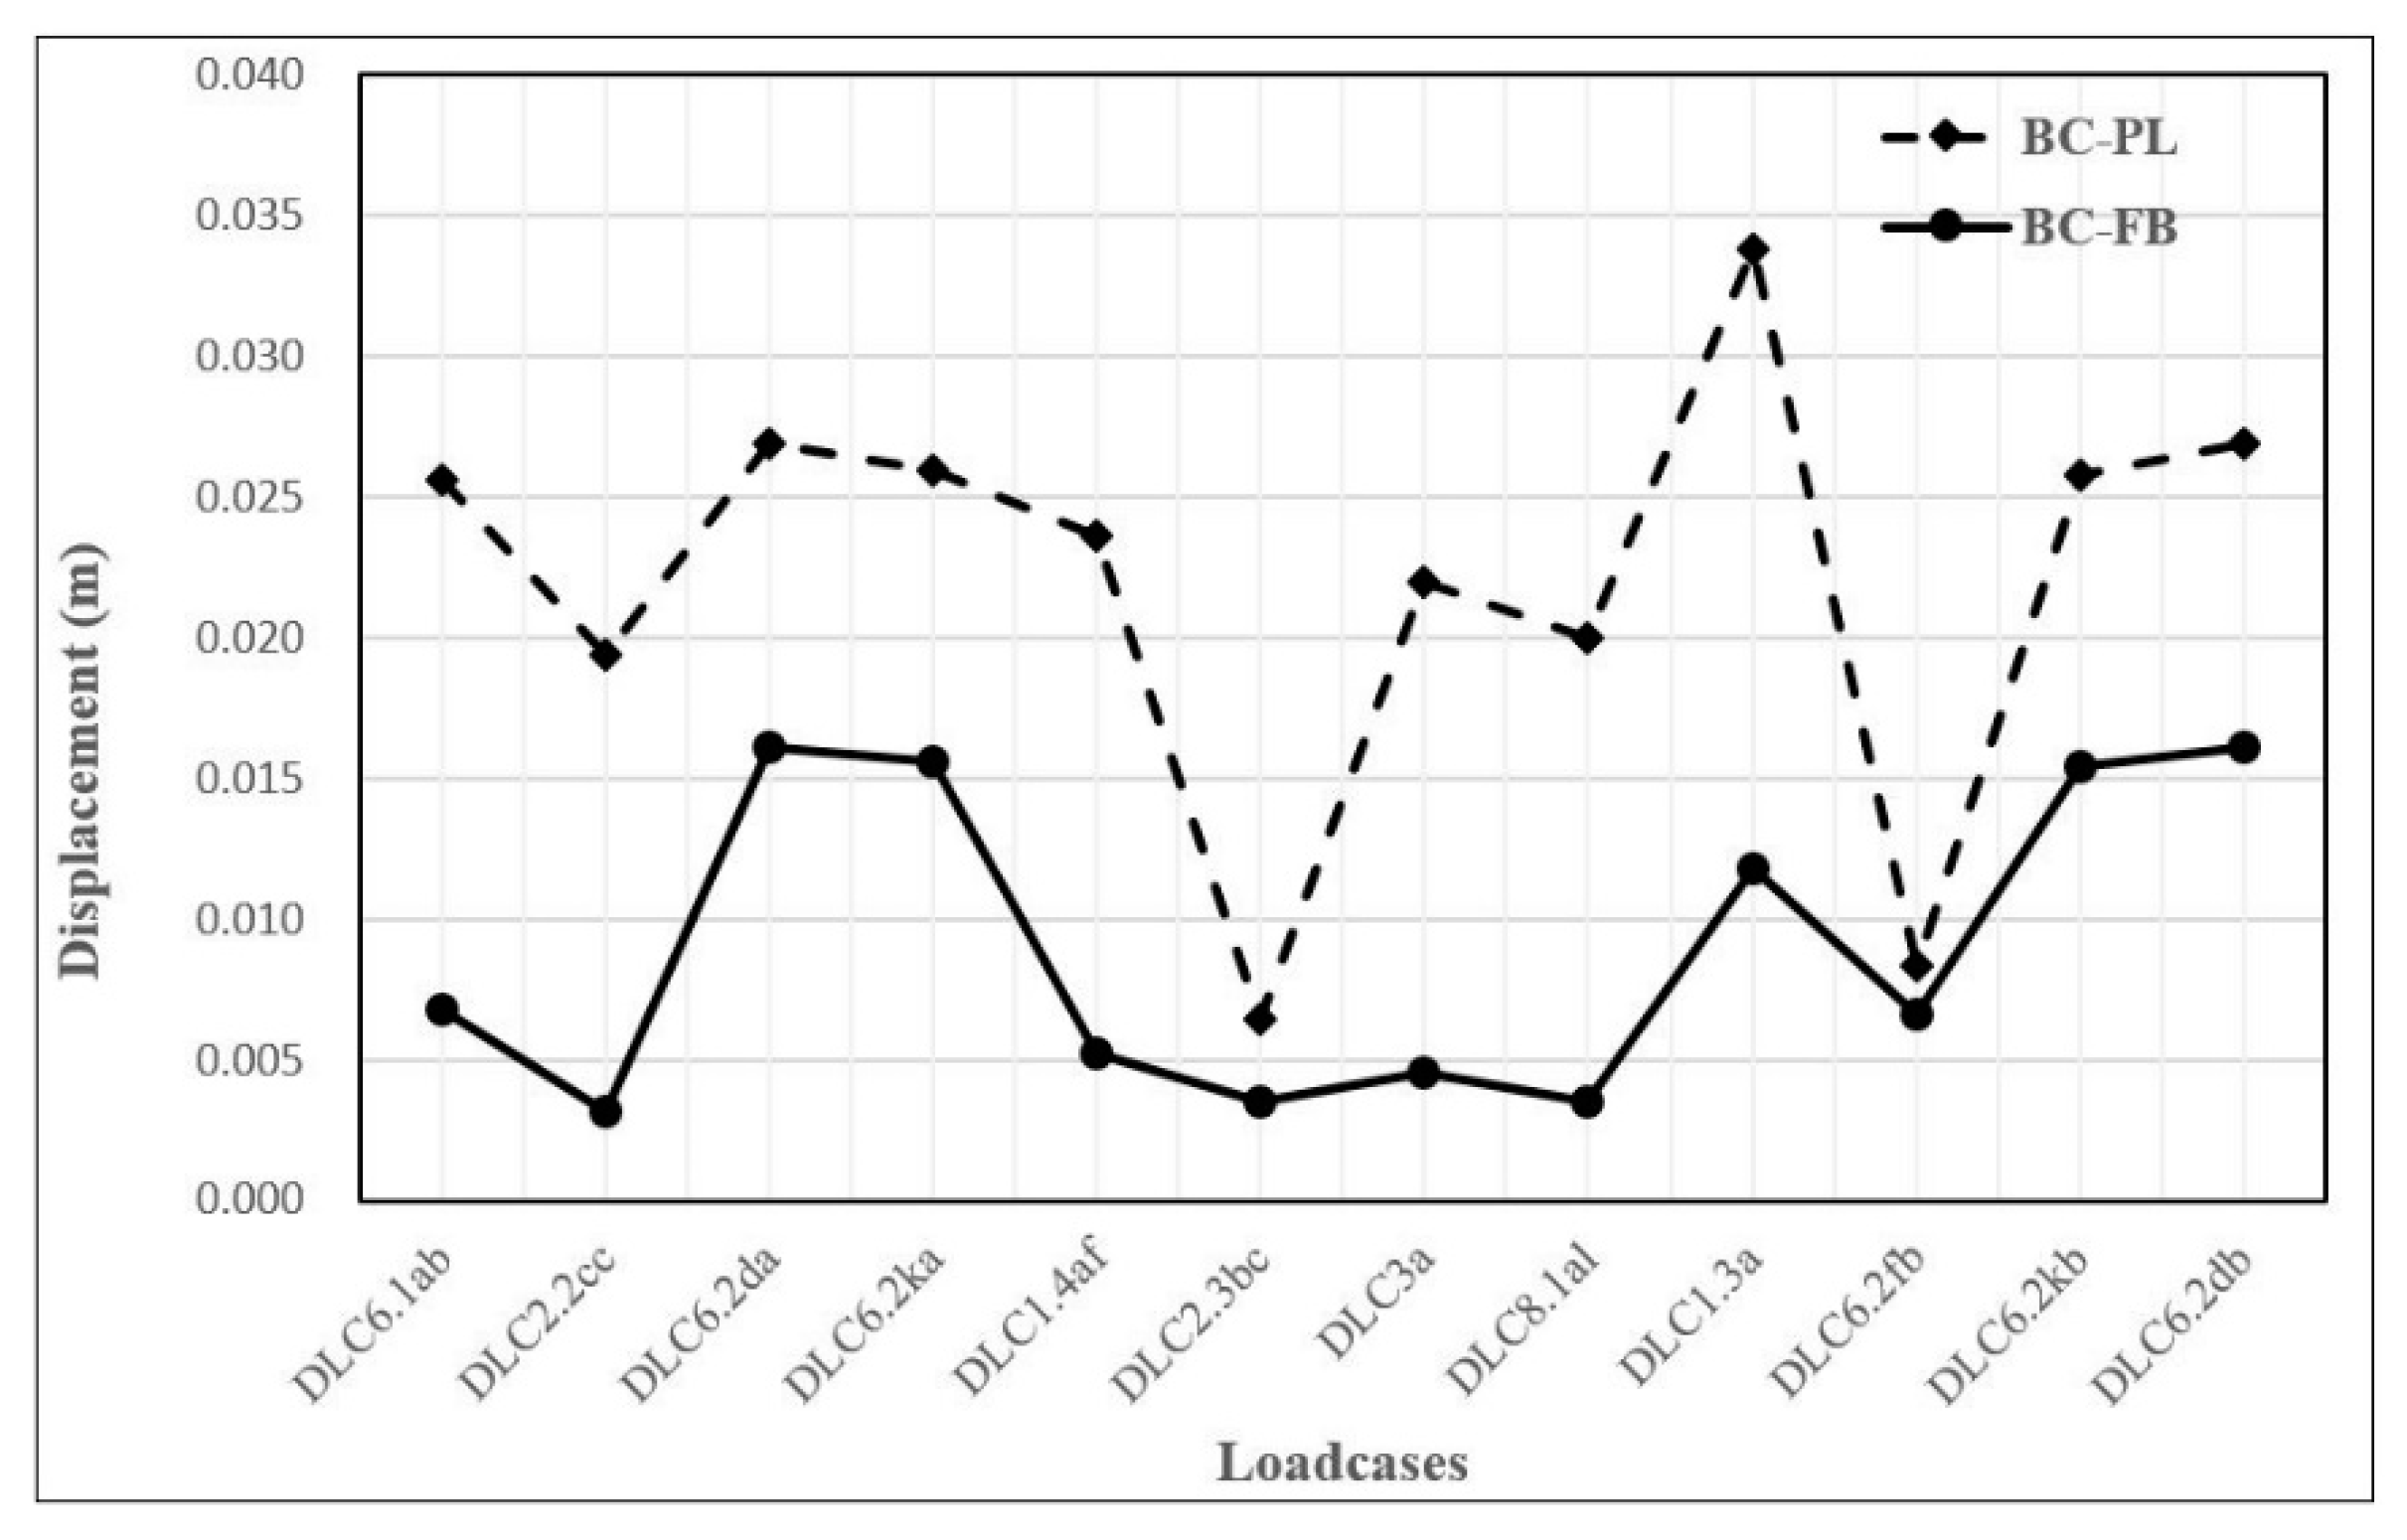
The support structure is subjected to horizontal loads due to turbine and environmental loads, therefore the maximum displacement occurs in the horizontal direction. To evaluate the influence of the use of piles on the PCF structure, the horizontal displacement of the piled foundation model (BC-PL model) was compared to that of the model using the fixed boundary condition instead of the pile (BC-FB model). The maximum horizontal displacements of the two models according to the load case are shown in Figure 6, and the deformed shapes are shown in Figure 7.
The maximum displacement occurred at the top of the support structure in both models. The maximum displacements were 0.0167 m in the case of the BC-FB model at DLC1.3a, and 0.0347 m in the case of the BC-PL model at DLC1.3a. Comparing the displacements of the two models, it can be seen that the displacement of the BC-FB model is about 46.40% of the displacement of the BC-PL model. As shown in Figure 7, the fixed model does not cause the displacement of the bottom of structure due to the fixed boundary condition.
However, because the BC-PL model has the displacement at the bottom of the pile and structure due to the use of the soil spring, two maximum displacements can be different by about 46.40%. Therefore, it is an accurate method to implement the analysis of the support structure by modeling the pile because the displacement difference occurs depending on the use of the pile when evaluating the behavior of the pile support structure. Notwithstanding the fact that structural analysis is performed using fixed boundary conditions due to the uncertainty of the boundary condition between soil and foundation, this result shows that the piled foundation model is required for the analysis of the global behavior of the structure. The maximum displacement of 0.0625 m in the support structure is 0.22% of the total length of the support structure of 28.640 m, and the maximum displacements of the 40-m long monopile and tripod structure in the study of Chen et al. [21] are 0.4864 m and 0.3687 m, respectively. Thus, it can be concluded that the maximum displacement occurring in the PCF structure is sufficiently small to be safe for displacement.
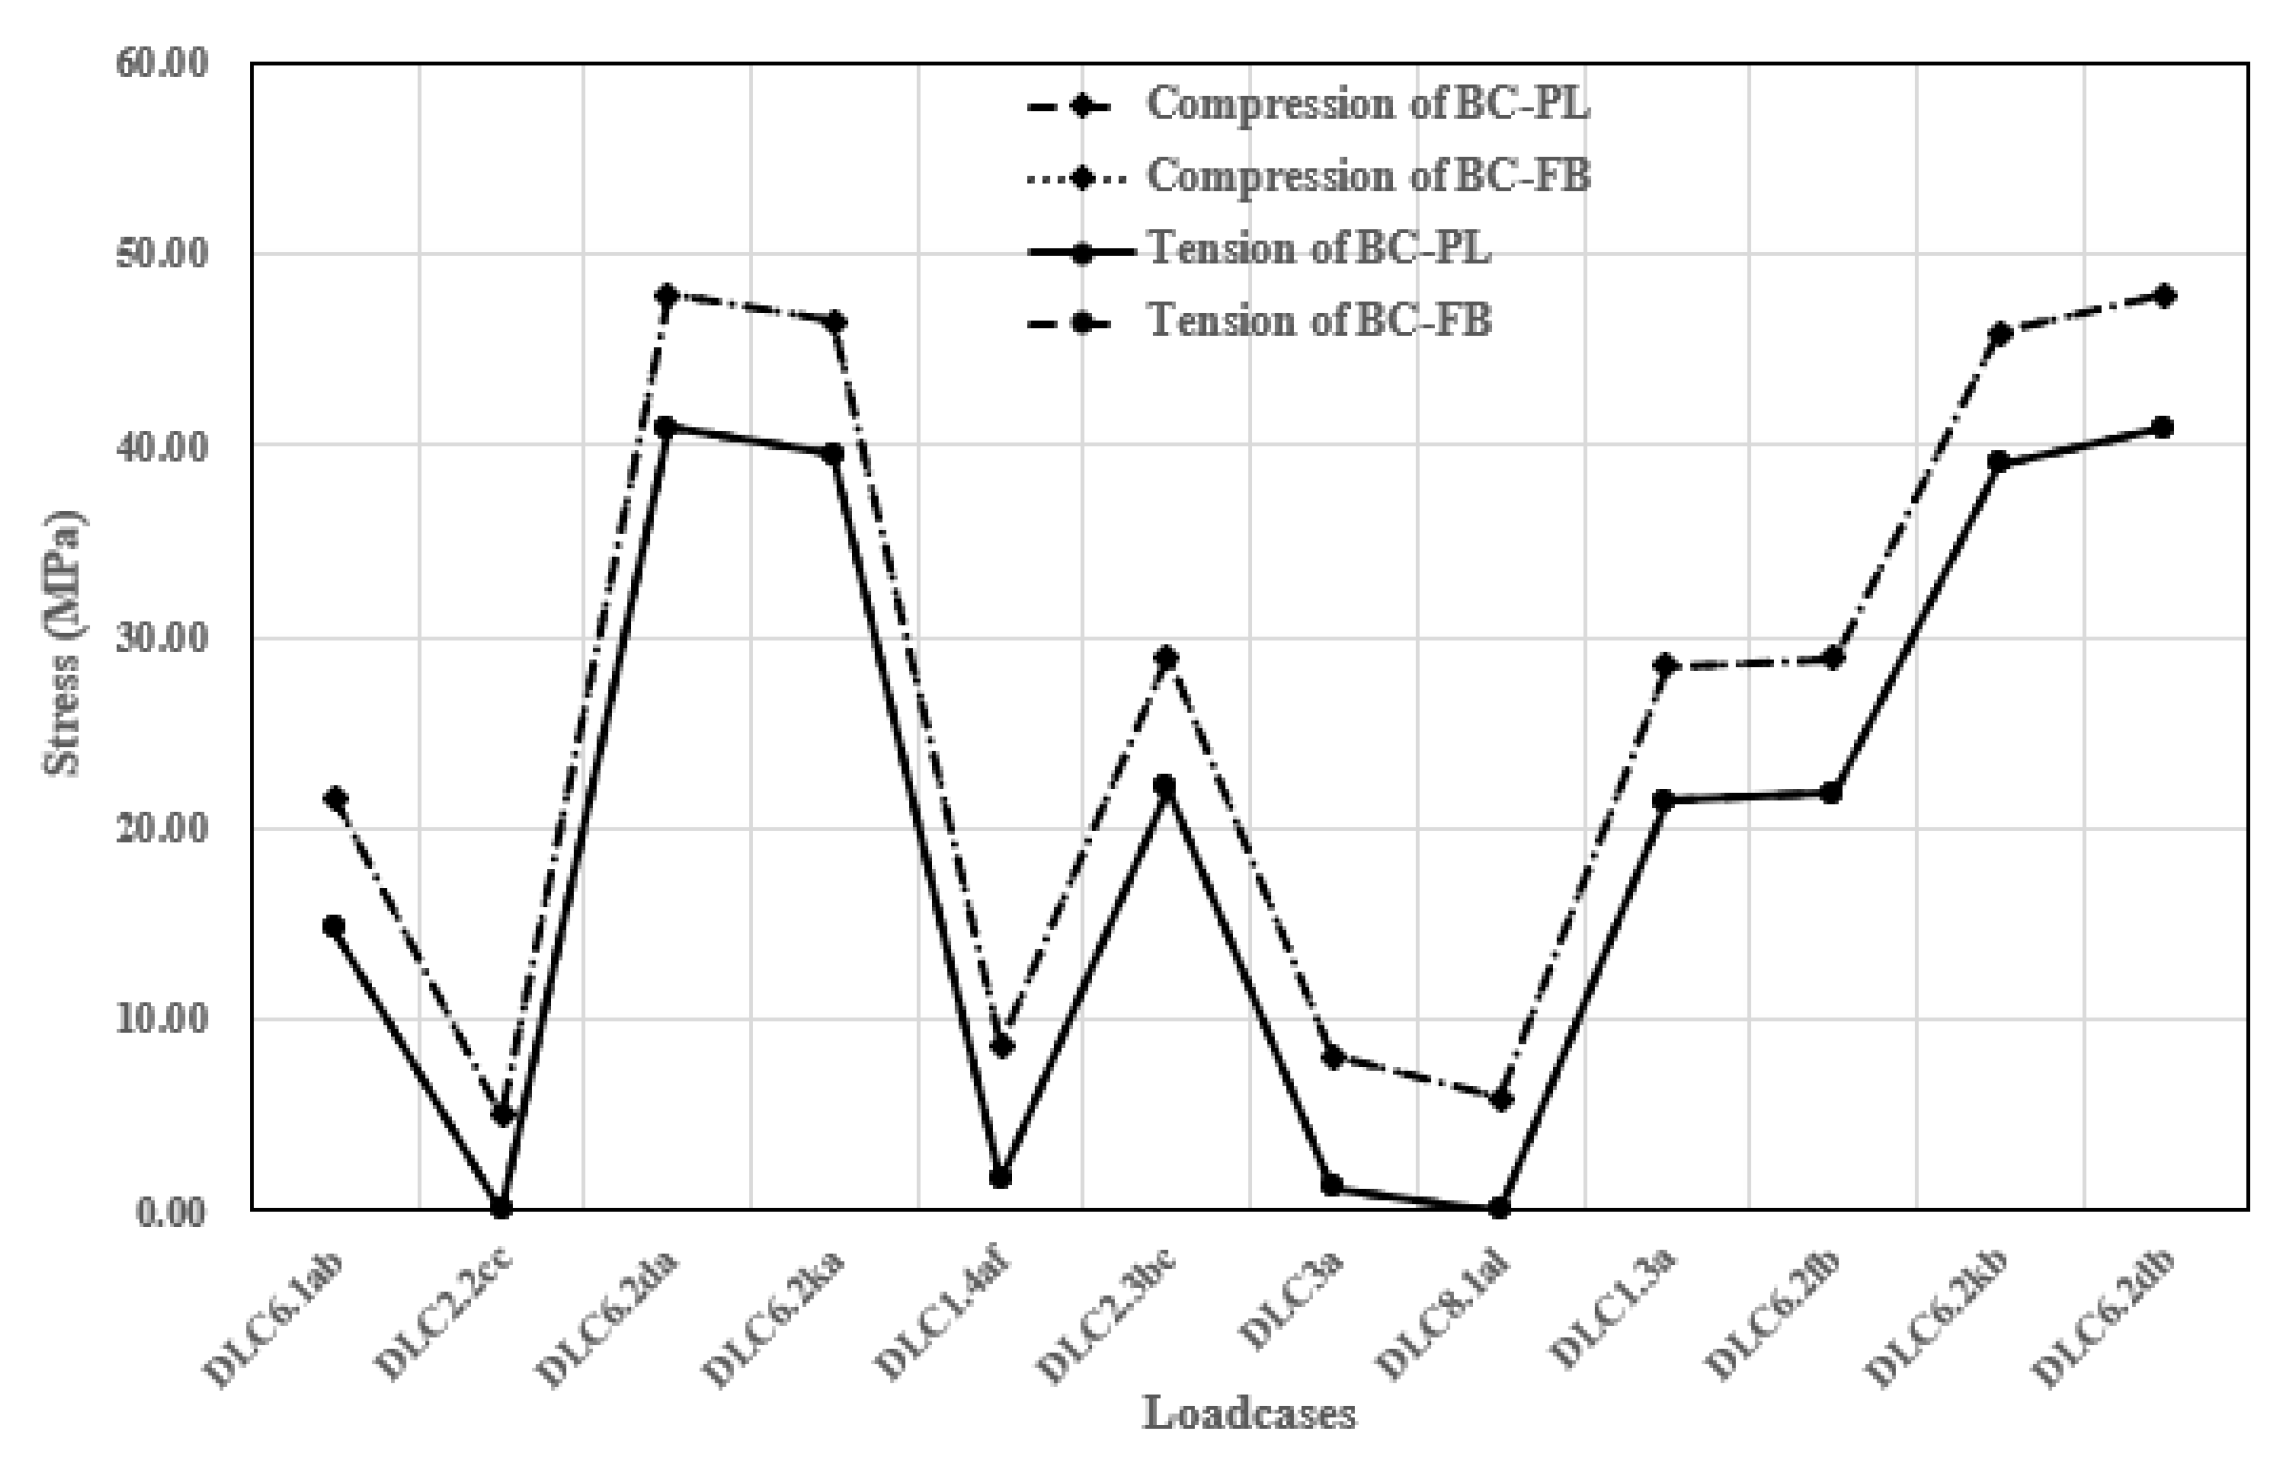
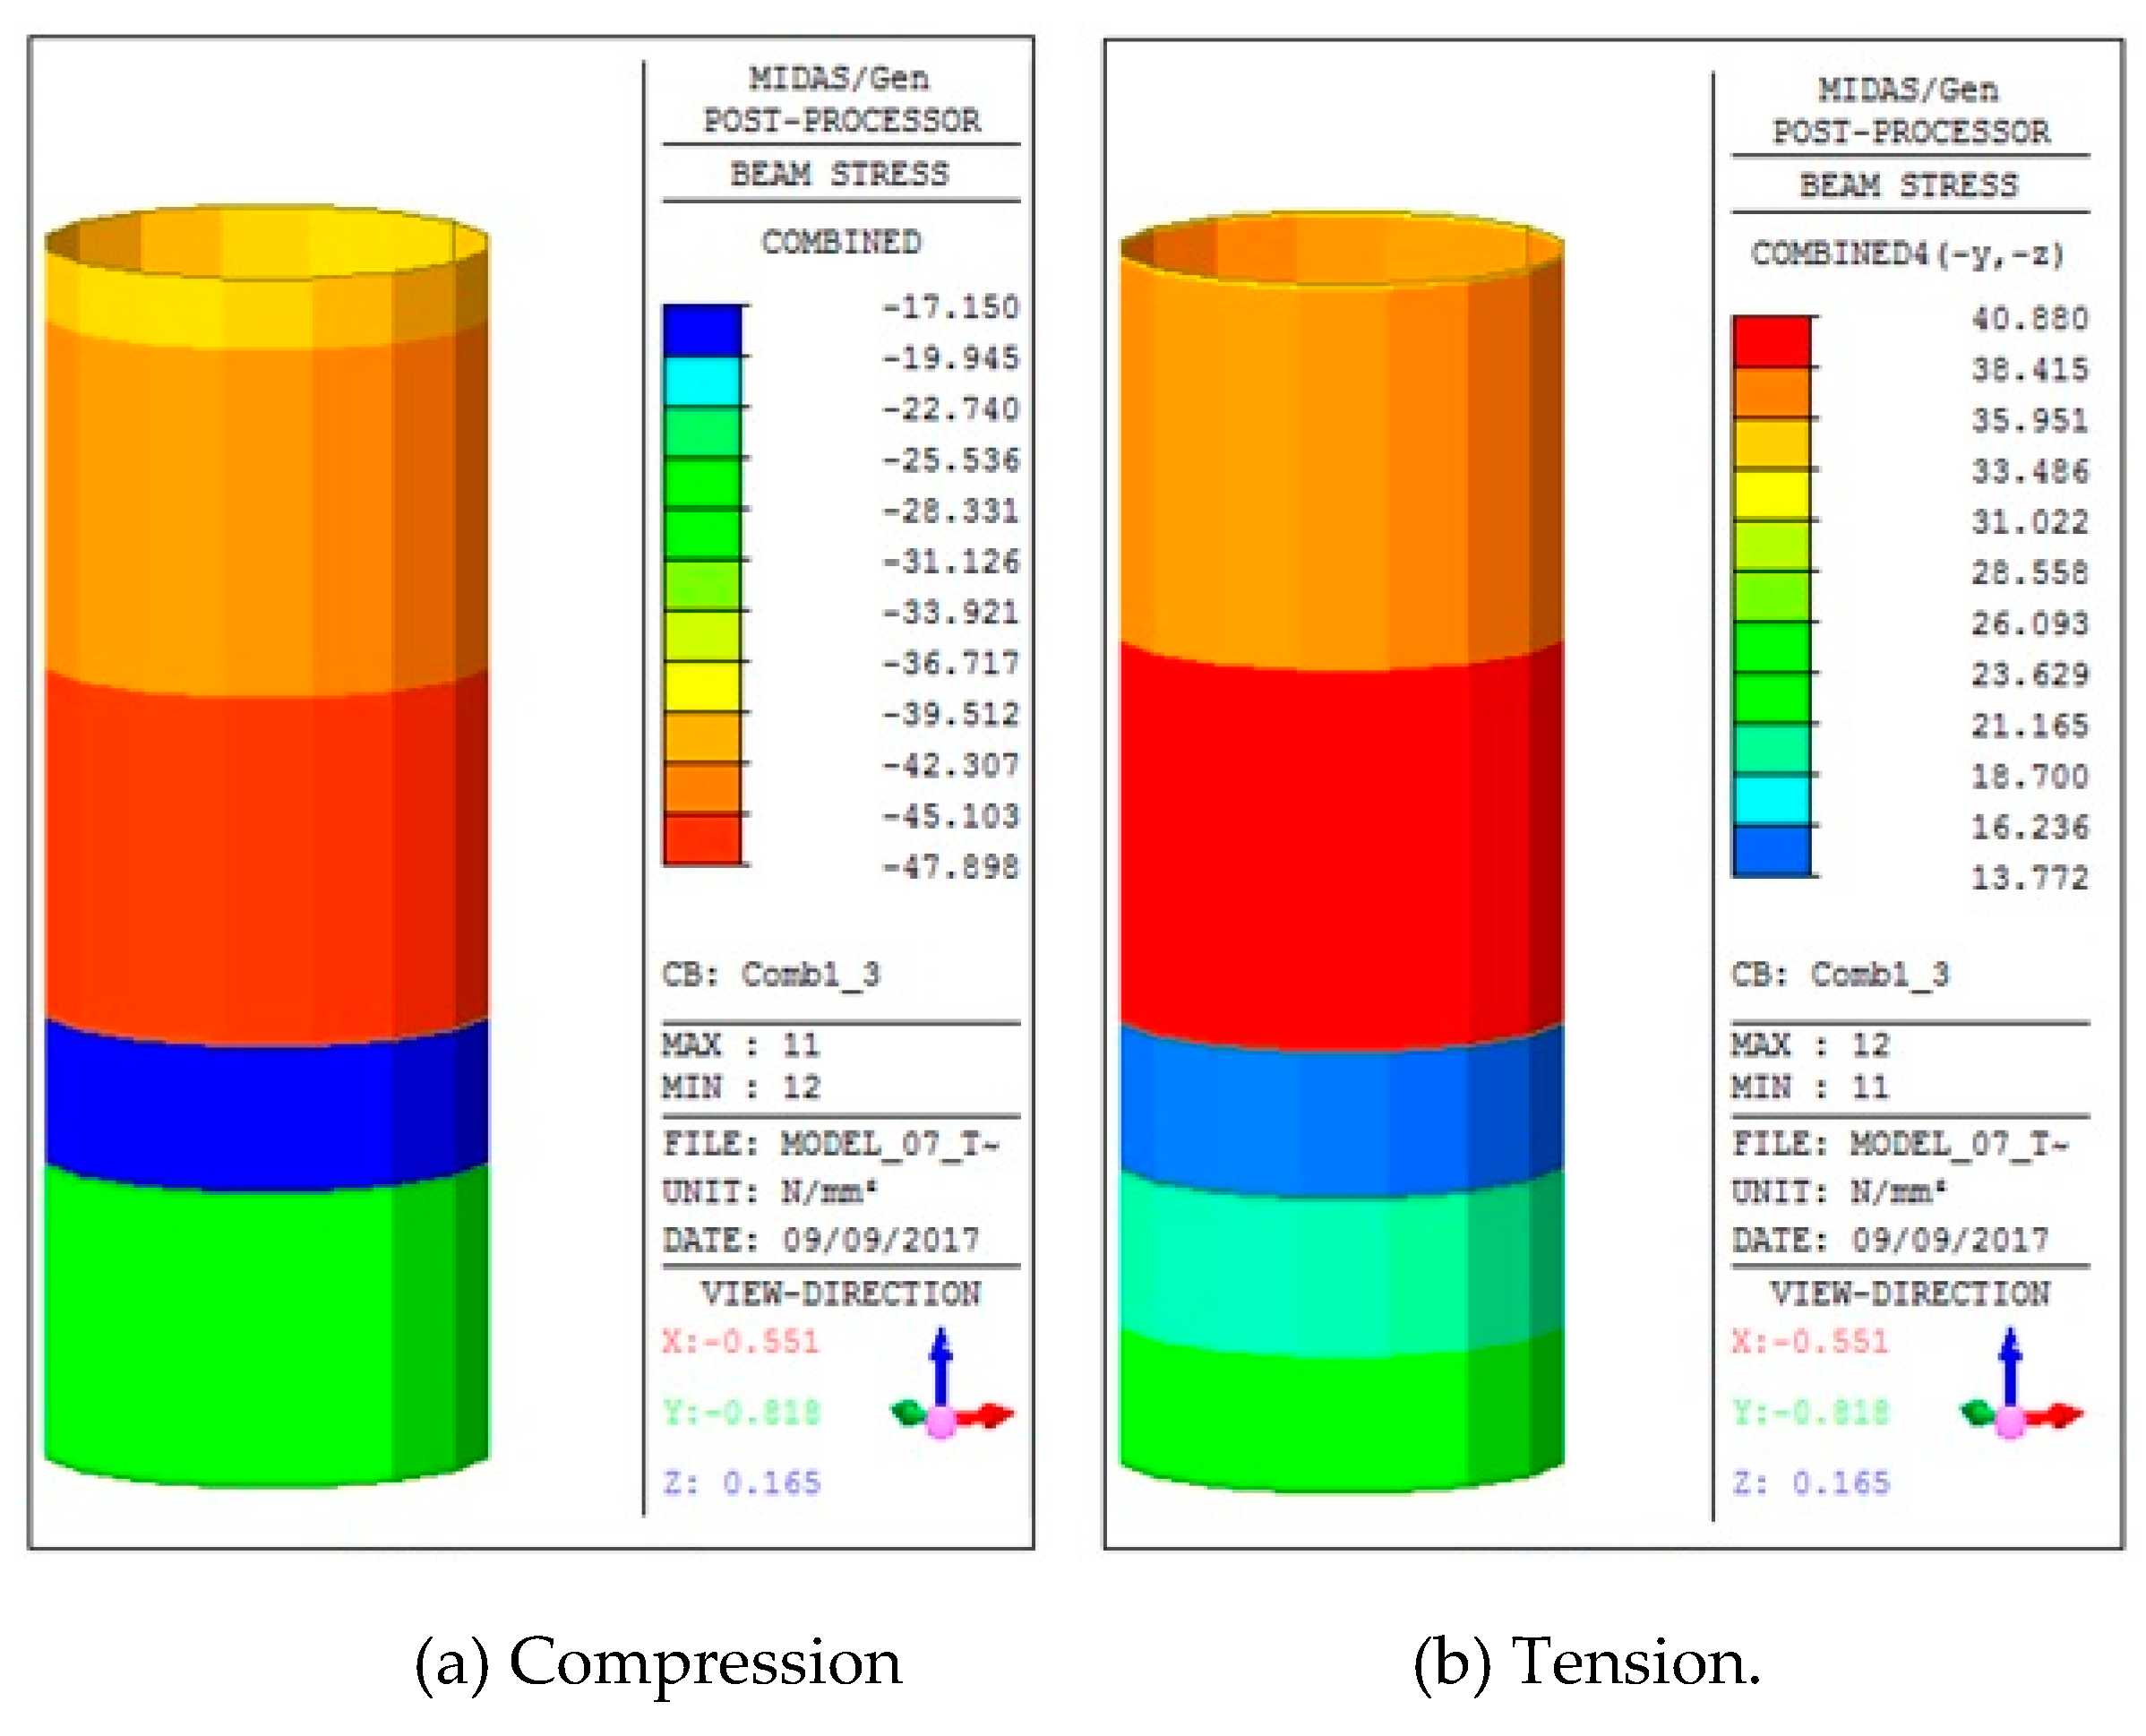
In order to evaluate whether the PCF structure is safe under the turbine load and environmental load, the generated stress and the displacement were evaluated. The stresses that occurred in the shaft, which is steel, are as shown in Figure 8, and the stresses of the BC-FB model and the BC-PL model were compared. The stresses in the two models were almost the same, and the maximum compressive stress and the maximum tensile stress were −47.900 MPa and 40.900 MPa in DLC6.2da, respectively. Stress distribution on the shaft is shown in Figure 9, and maximum stress was found at the center of the shaft. The allowable stress of the steel can be used as the allowable stress of SM400 steel of 185 MPa as proposed by the Harbor and Fishery design criteria [22], and the material factor γ m for tubular structures is 1.1 according to DNV-OS-J101. The steel shaft is safe because the maximum stress of −47.900 MPa does not exceed the allowable stress.
To evaluate the stresses occurring in the concrete support structure, they were compared to the allowable compressive and tensile stresses presented in the structural concrete design code [23]. The allowable compressive and tensile stresses of concrete are 0.60 f c k and 0.60 f c k , respectively, and those stresses were calculated to be 27 MPa and 4.226 MPa, respectively, when the applied concrete design strength of 45 MPa was used.
As in the case of displacement, the generated stresses for the pile model are compared to those of the model using fixed boundary conditions, and the maximum stresses according to each load case are shown in Figure 10. The stresses in the two models show that the same stresses occur in each load case, except for the tensile stress of DLC2.2cc and DLC6.2fb. The maximum tensile stress of DLC2.2cc occurred in the concrete sleeve part, and it was found that the maximum tensile stress occurred differently depending on whether the pile was used. Therefore, it is necessary to model and analyze the structure with pile modeling for the stress check. Since the maximum tensile stress occurs in some load cases, further study about the concrete-sleeve is needed through a detailed analysis. The maximum compressive and tensile stresses in the PCF structure occurred in the case of DLC6.2da, and the values were −7.910 MPa and 6.340 MPa, respectively. The stress distribution for this load case is shown in Figure 11. It can be seen that the maximum stress occurs at the part where the concrete cone and the cylinder shape are connected (tapered section). Except for DLC2.2cc, the maximum stress occurred at the same part, and for DLC2.2cc, the maximum tensile stress occurred at the concrete sleeve.
Figure 12 shows the stresses of the concrete sleeves for all load cases. When the stress is compared to the stress at the tapered section, it can be seen that the compressive stress is a maximum of 61.59%, and the tensile stress is about 90.22% when DLC2.2cc is excluded. This means that the bending moment generated by the load is supported by the shape and strength of the concrete support structure itself, but the pile penetrated into the soil has a huge influence on supporting the load. Thus, it is necessary to consider the stresses occurring in the concrete sleeve, as well as the concrete support structure for the stress evaluation, and additional reinforcement is necessary when the occurred stress exceeds the allowable stress.
First, the maximum compressive and tensile stresses in the concrete sleeves were −1.43 MPa and 0.991 MPa, respectively. Compared to the allowable compressive stress and the tensile stress, it can be seen that the stresses did not exceed the allowable values. For the stresses of the entire concrete structure, the maximum compressive stress does not exceed the allowable compression, but in the case of tensile stress, it is 6.340 MPa, exceeding 4.226 MPa. This means that the safety of the support structure is not ensured due to damage, such as fracture in the case of tension, while it is safe in compression due to the applied loads. Therefore, it is necessary to reinforce the concrete foundation. The support structure is examined in the following section by applying prestressing steel.

5.3. Post-Tensioning Design

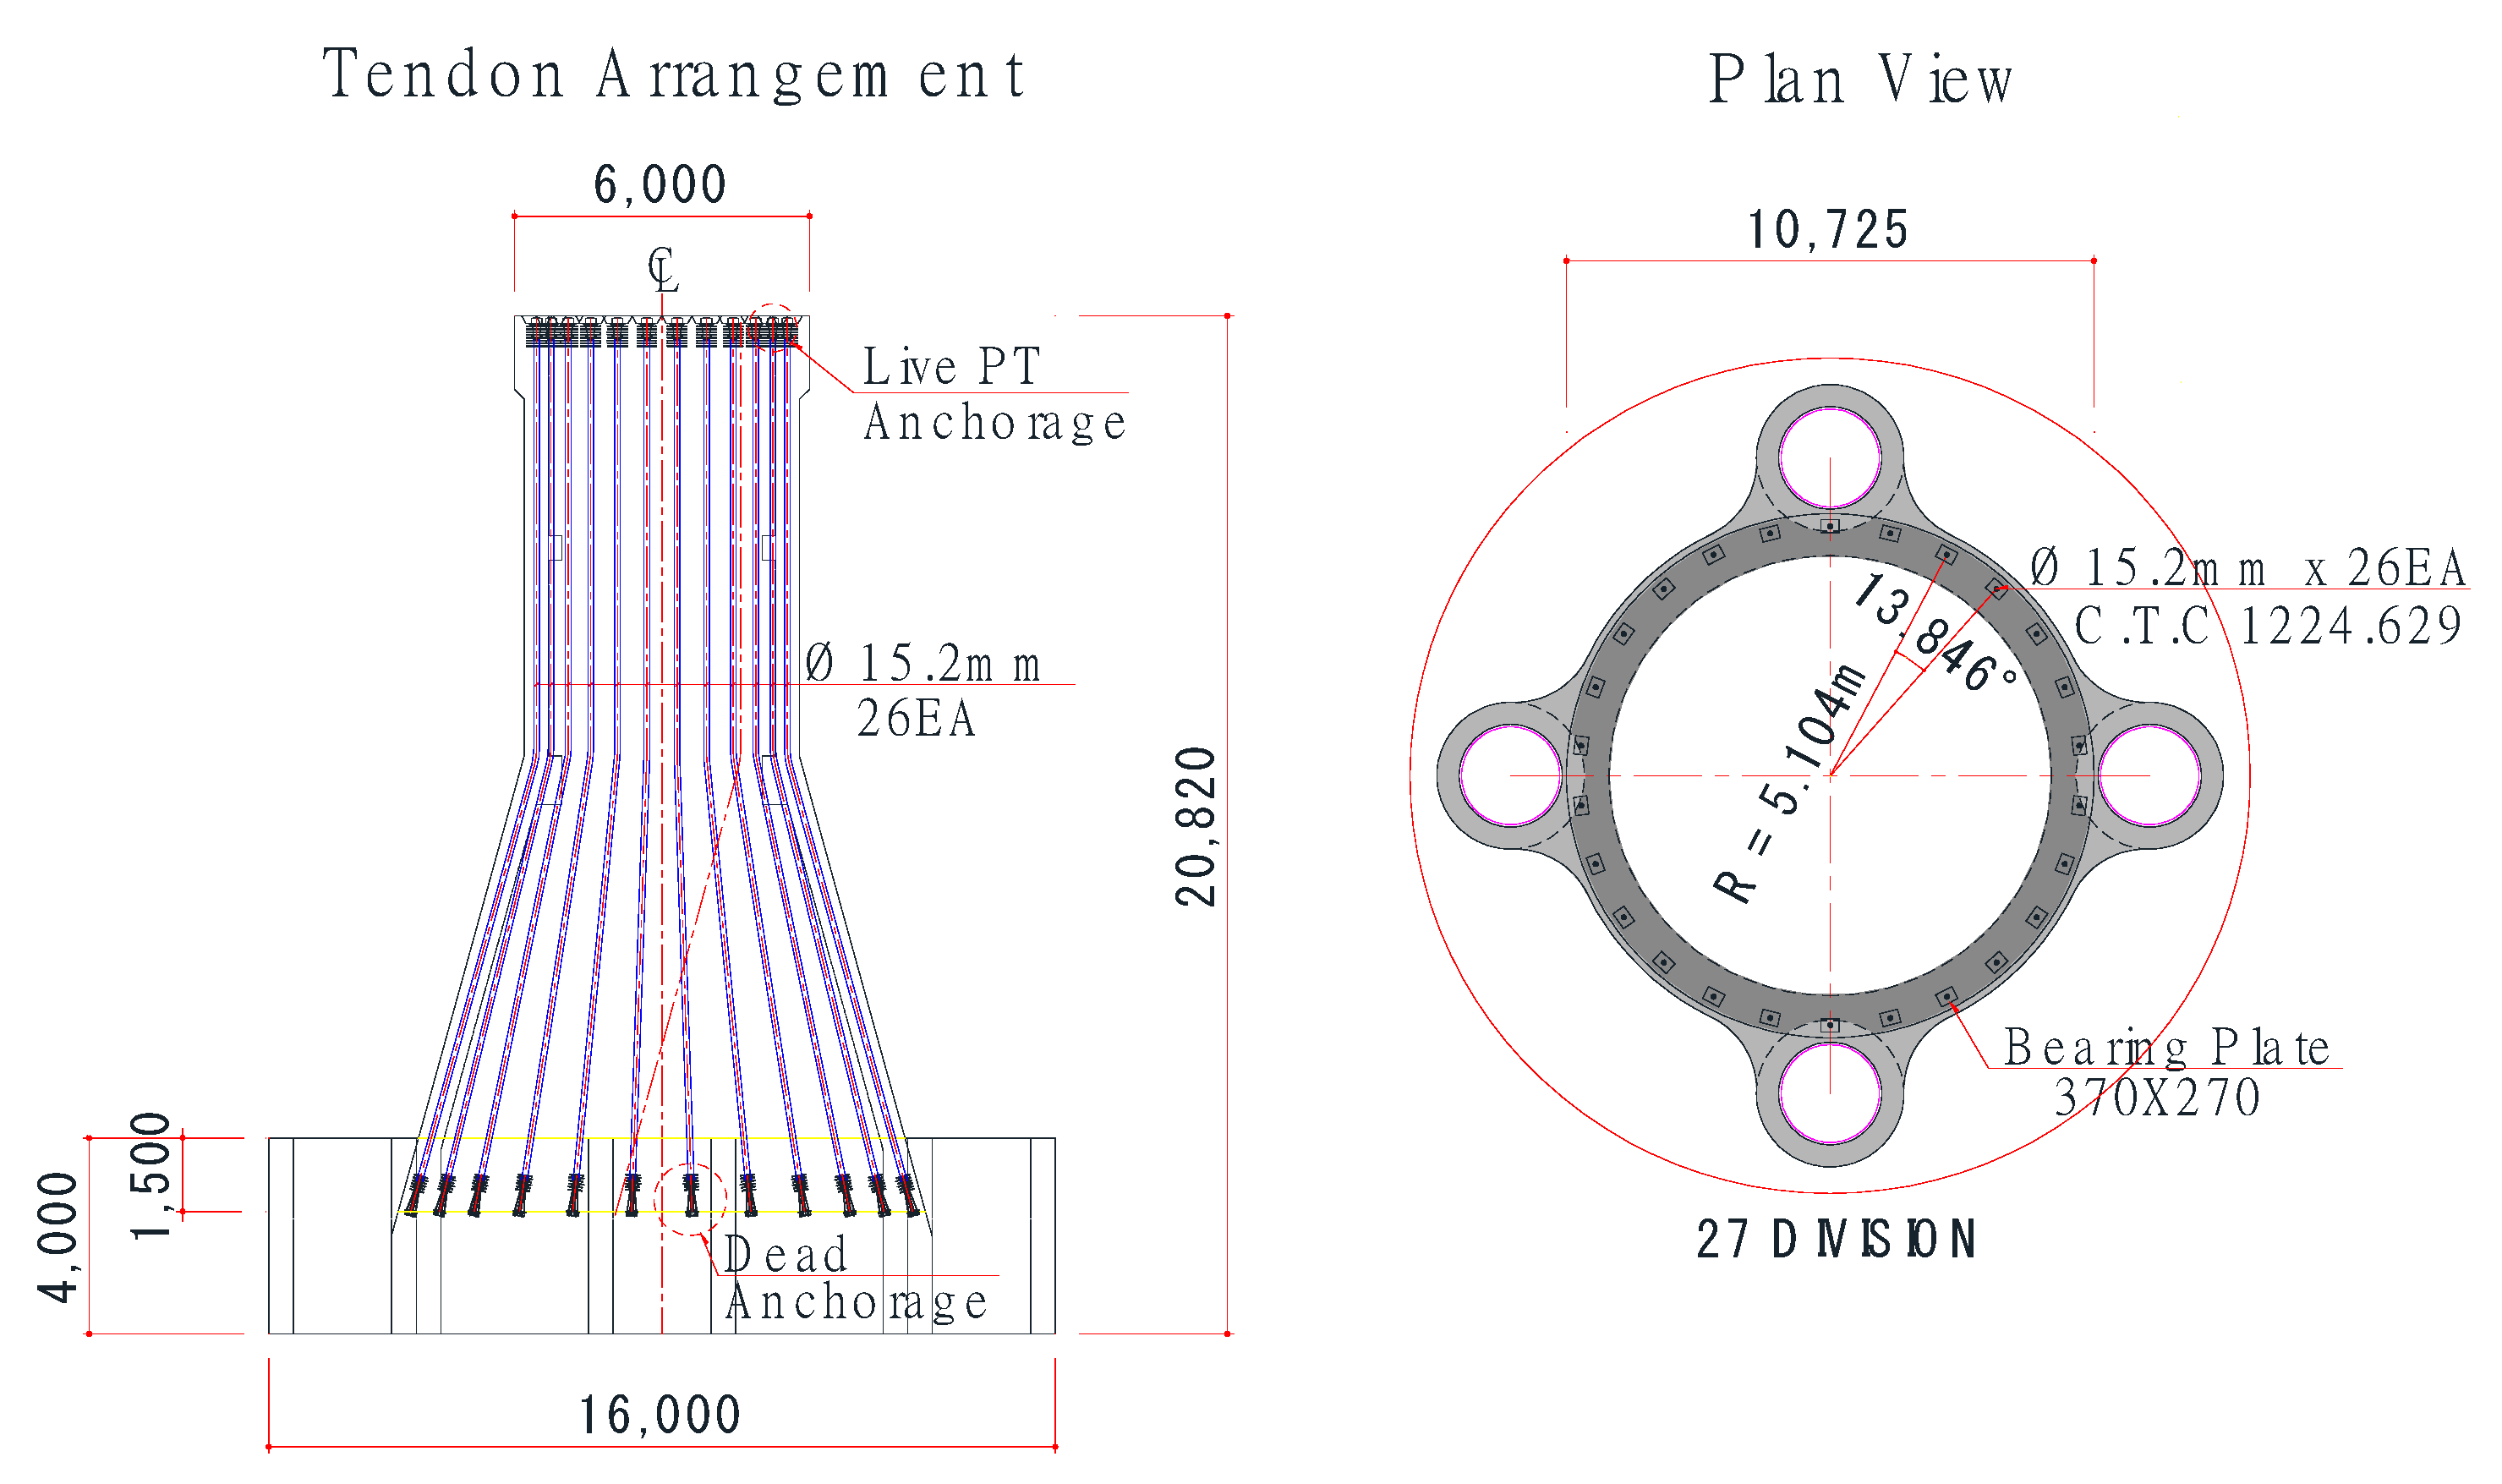
From the results of stress, it was found that prestressing steel is required to reduce tensile stress to less than the allowable stress. Prestressing steel was chosen from the Korean Industrial Standards for prestressing wire, and pre-stressing strand, KS D 7002 [24], and SWPC7B of 19 prestressing strand, which has a 0.01524 m diameter and low relaxation were used. The ultimate strength ( f p u ) and yield strength of steel are 1900 MPa and 1600 MPa, respectively, and the nominal cross-sectional area ( A p ) is 138.700 mm2. The number and arrangement of tendons have to be determined by considering the size of the outer and inner diameter of the top of the concrete structure. The outer and inner diameters are 5600 mm and 4600 mm each, therefore the area of that part is 8.01 × 106 mm2 and the number of tendons is 30. The tendon arrangement is presented in Figure 13.
To apply the effect of prestressing steel to concrete, prestressing force and effective stress have to be calculated based on the prestressing strand and the number of tendons. For prestressing force, 72% of the ultimate strength, 1368 MPa, was used. From this strength, the prestressing force of one strand can be calculated by multiplying 1368 MPa by the nominal cross-sectional area 138.700 mm2, and the prestressing force of one tendon is the sum of the prestressing force of 19 strands. For the effective stress, 20% loss of prestressing was applied. Calculation procedure and values of the prestressing force are presented in Table 7. The calculated effective stress by prestressing steel was 9.36 MPa, as presented in Table 7. With this value, total stresses on the structure after applying the prestressing steel could be calculated, and these stresses were evaluated by comparing it with the allowable stresses. From the quasi-static analysis, maximum tensile and compressive stress were 9.026 MPa and −7.55 MPa, respectively. Thus, the total stresses could be calculated, as presented in Figure 14, and it is noted that the maximum tensile stress was changed to compressive stress because an effective stress of −9.36 MPa was bigger than the occurred stress of 9.02 MPa. Consequently, it is determined that the total stresses on the structure are safe enough by applying prestressing steel.

5.4. Pile Evaluation

Due to the turbine and the environmental loads acting on the support structure, the deformation, compressive stress, and tensile stress occurring in the piles are applied, so it is important to evaluate the stability and bearing capacity of the pile accordingly. Thus, the displacements and rotation angles at the top of the piles and the end bearing and pulling capacities of the piles were examined for the stability evaluation of the piles. According to Upwind final report WP 4.2 [25] and DNV-OS-J101 [26], the pile displacement at the seabed should be less than 0.1 m and the rotation angle should be less than 0.5°. The maximum displacements and rotation angles according to the load cases are shown in Table 8. The maximum displacement and rotation angle occurred at 0.0075 m and 0.0371°, respectively, at DLC1.3a. These results are less than 0.1 m and 0.5°; thus, the pile is safe for displacement and rotation.
To evaluate the end bearing and pulling capacities of the piles, they are compared to the allowable bearing capacities according to the soil conditions. The allowable bearing and pullout capacities can be calculated by dividing the ultimate bearing capacity by the safety factor. The safety factor is 1.5 according to the API design standard [27]. The compressive and tensile forces at the top of the pile according to the load cases are shown in Table 8, and the maximum values were 8052 kN and 14,490 kN for DLC1.3a, respectively. The end bearing and pulling capacities were calculated to be 1,229,715 kN and 1,227,980 kN, respectively; the allowable end bearing capacity is 819,810 kN, and the allowable pulling capacity is 818,653 kN. When comparing these allowable values to compressive and tensile forces at the top of the pile, it can be seen that the allowable values are larger than the applied loads. Therefore, it is concluded that the piles have sufficient end bearing and pulling capacities for the applied load and soil conditions.

5.5. Natural Frequency Analysis

To evaluate the dynamic response and stability of the PCF structure, natural frequency analysis was carried out. To account for the entire model of the structure, the tower was modeled as shown in Figure 15, and the turbine above the tower was applied as an additional mass. The properties of tower and turbine are presented in Table 3. The pile for the PCF structure can be considered as a steel pile or RCD pile, and the results of the three models (i.e., PL-ST, PL-RCD and BC-FB models) are compared to evaluate the effects of pile type and boundary conditions. The evaluation of the natural frequency was carried out using the natural frequency design range of the support structure, which has the 3-MW class turbine in Figure 16. The second and third modes rarely occur in a real structure, therefore the evaluation of first natural frequency is most important.
A first natural frequency of the support structure must not be in rotor frequency range (1P) or in blade passing frequency ranges (3P) to avoid the resonance because the resonance induces large displacements and large stresses in the structure. Generally, in the case of the jacket and tripod support structures, the first mode natural frequency is designed to be located in the region between 1P and 3P. The mode shape according to frequency analysis is shown in Figure 15, and the frequencies and periods according to the models are shown in Table 9. The mode shapes of the PL-ST, PL-RCD, and BC-FB models were the same, and the first mode frequencies were 0.3519 Hz, 0.3561 Hz, and 0.3814 Hz, respectively. Two frequency values of the PL-ST model and PL-RCD model show a difference of about 1.1%, and they are all located between 1P and 3P, which is the region between the frequencies of the rotor and the blades. However, a frequency value of 0.3814 for the BC-FB model is in 3P region and resonance can occur. Therefore, when steel or RCD piles are used, it can be concluded that the PCF structure has similar and safe vibration characteristics to the existing support structure of the jacket or tripod. The RCD pile filled with concrete is more massive than the steel pile, therefore the frequencies between the two models are expected to show a large difference. However, the difference between frequencies was not significant. It is confirmed that the factor influencing the natural frequency is the pile model or the fixed model is affected by the pile type considering the pile stiffness.

6. Conclusions

In this study, structural analysis using general-purpose structural analysis software was performed to evaluate the adequacy of behavior mechanism for the 3-MW class piled concrete foundation. Three analytical parameters were defined to consider the interaction between the ground and the structure. Analysis was carried out on a fixed boundary application model that eliminated the uncertainty of the pile and concrete connections, and two models with different pile stiffness were proposed. By analyzing the behavior of the entire supporting structure and evaluating the stability of displacement, stress, and natural frequency, dominant mechanisms of the behavior were identified, and the impact of the influence factors was summarized. This study aims to provide well-documented results to help expand our understanding of piled concrete foundations and facilitate the application of this innovative foundation system. The following conclusions are drawn according to the structural analysis.
(1) From the quasi-static analysis, maximum stresses and displacements of a fixed foundation and piled foundation were evaluated. Stress results showed that the differences in the maximum stresses between the fixed foundation and piled foundation were as not large, but the maximum stress locations were different.
(2) As a result of structural analysis using three parameters, the fixed end boundary condition for the design of concrete member was found to be unreasonable because the overall stress and displacement was about 46.40% larger than the model using pile and soil spring.
(3) In the analytical model considering the soil-structure interaction, the stiffness of the soil spring model according to the type of soil rather than the pile type influenced the natural frequency. The boundary conditions of the pile and concrete connections must be considered when evaluating the natural frequencies, which is the first mode of frequency considered in the design.
(4) Tensile stress of the concrete structure was designed to be sufficiently reinforced by prestressing tendon.
(5) Further details on the construction method of PCF should be obtained by performing detailed studies on the connection between pile and concrete.

Author Contributions

Conceptualization, H.-G.K. and K.-H.L. Methodology, H.-G.K. and B.-J.K. Data curation, H.-G.K. and B.-J.K. Writing—original draft preparation, H.-G.K. and K.-H.L. Writing—review and editing, K.-H.L. Supervision, H.-G.K. and K.-H.L. All authors have read and agreed to the published version of the manuscript.

Funding

This research was funded by the research support project of Catholic Kwandong University.

Conflicts of Interest

The authors declare no conflict of interest.

References

  1. Korea Government Ministry of Knowledge Economy (MKE). Offshore Wind Turbine Roadmap 2010. Available online: http://www.motie.go.kr (accessed on 10 January 2020).
  2. Oh, K.Y.; Kim, J.Y.; Lee, J.S.; Ryu, K.W. Wind Resource Assessment around Korean Peninsula for Feasibility Study on 100 MW class Offshore Wind Farm. Renew. Energy 2012, 42, 217–226. [Google Scholar] [CrossRef]
  3. Oh, K.Y.; Kim, J.Y.; Lee, J.K.; Ryu, M.S.; Lee, J.S. An Assessment of Wind Energy Potential at the Demonstration Offshore Wind Farm in Korea. Energy 2012, 46, 555–563. [Google Scholar] [CrossRef]
  4. Kim, J.Y.; Oh, K.Y.; Kang, K.S.; Lee, J.S. Site Selection of Offshore Wind Farms around the Korean Peninsula through Economic Evaluation. Renew. Energy 2013, 54, 189–195. [Google Scholar] [CrossRef]
  5. Oh, K.Y.; Kim, J.Y.; Lee, J.S. Preliminary Evaluation of Monopile Foundation Dimensions for an Offshore Wind Turbine by Analyzing Hydrodynamic Load in the Frequency Domain. Renew. Energy 2013, 54, 211–218. [Google Scholar] [CrossRef]
  6. Shi, W.; Han, J.; Kim, C.; Lee, D.; Shin, H.; Park, H. Feasibility Study of Offshore Wind Turbine Substructures for Southwest Offshore Wind Farm Project in Korea. Renew. Energy 2015, 74, 406–413. [Google Scholar] [CrossRef]
  7. Peire, K.; Nonneman, H.; Bosschem, E. Gravity Base Foundations for the Thornton Bank Offshore Wind Farm. Terra Aqua 2009, 115, 19–29. [Google Scholar]
  8. Esteban, M.D.; López-Gutiérrez, J.S.; Negro, V. Gravity-Based Foundations in the Offshore Wind Sector. J. Mar. Sci. Eng. 2019, 7, 64. [Google Scholar] [CrossRef] [Green Version]
  9. Thomsen, J.H.; Forsberg, T.; Bittner, R. Offshore Wind Turbine Foundations-the COWI Experience. In Proceedings of the 26th International Conference on Offshore Mechanics and Arctic Engineering, San Diego, CA, USA, 10–15 June 2007; p. 29567. [Google Scholar]
  10. Energy, Oil & Gas Magazine. Integrated Solutions: BAM Energie. 2013. Issue 100. Available online: http://www.energy-oil-gas.com (accessed on 10 January 2020).
  11. Kim, H.G. A Study on the Static and Dynamic Behaviors for Hybrid Support Structure of Offshore Wind Turbines. Ph.D. Thesis, Konkuk University, Seoul, Korea, 2013. [Google Scholar]
  12. Kim, H.G.; Kim, B.J.; Kim, K.D. New Development of Hybrid Concrete Support Structure with Driven Piles for Offshore Wind Turbines. J. Korean Soc. Steel Const. 2013, 25, 307–320. [Google Scholar] [CrossRef]
  13. Fleming, K.; Weltman, A.; Randolph, M.; Elson, K. Piling Engineering, 3rd ed.; CRC Press: Boca Raton, FL, USA, 2008; ISBN 978-0-415-26646-8. [Google Scholar]
  14. Anjos, G.; Cunha, R.R.; Kuklik, P.; Brouček, M. Numerical Evaluation of Bored Piles in Tropical Soils by Means of the Geo-Technical Engineering GEO4 Fine Software. In Proceedings of the III European Conference on Computational Mechanics Solids, Structures and Coupled Problems in Engineering, Lisbon, Portugal, 5–8 June 2006. [Google Scholar]
  15. Pender, M. A Seismic Pile Foundation Design Analysis. Bull. N. Z. Natl. Soc. Earthqu. Eng. 1993, 26, 49–160. [Google Scholar]
  16. Park, J.; Kim, J.; Shin, Y.; Lee, J.; Park, J. 3 MW Class Offshore Wind Turbine Development. Curr. Appl. Phys. 2010, 10, S307–S310. [Google Scholar] [CrossRef]
  17. MIDAS IT. MIDAS/CIVIL Computer Program; MIDAS IT: Seoul, Korea, 2019. [Google Scholar]
  18. DNVGL. Recommended Practice DNVGL-RP-C205: Environmental Conditions and Environmental Loads; Det Norske Veritas: Oslo, Norway, 2019. [Google Scholar]
  19. Le Méhauté, B. An Introduction to Hydrodynamics and Water Waves; Springer-Verlag: New York, NY, USA, 1976; ISBN 978-3-642-85567-2. [Google Scholar]
  20. International Electrotechnical Commission (IEC). Wind Turbines—Part 1: Design Requirements, 4rd ed.; IEC 61400-1:2019-02; IEC: Geneva, Switzerland, 2019. [Google Scholar]
  21. Chen, D.; Huang, K.; Bretel, V.; Hou, L. Comparison of structural properties between monopile and tripod offshore wind-turbine support structures. AIME 2013, 3, 943–950. [Google Scholar] [CrossRef] [Green Version]
  22. Ministry of Maritime Affairs and Fisheries. Korea Harbor and Fishery Design Criteria; Korea Port and Harbours Association: Seoul, Korea, 2014.
  23. Korean Concrete Institute. Korean Structural Concrete Design Code; Korean Concrete Institute: Seoul, Korea, 2012. [Google Scholar]
  24. Korean Standards Association. Uncoated Stress-Relieved Steel Wires and Strands for Prestressed Concrete (KS D 7002); Korean Standards Association: Seoul, Korea, 2019. [Google Scholar]
  25. De Vries, W.; Vemula, N.K.; Passon, P.; Fischer, T.; Kaufer, D.; Matha, D.; Schmidt, B.; Vorpahl, F. Final Report WP4.2: Support Structure Concepts for Deep Water Sites; Project UpWind D4.2.8; TU-Delft: Delft, The Netherlands, 2011; p. 019945. [Google Scholar]
  26. Det Norske Veritas. Offshore Standard: Design of Offshore Wind Turbine Structures Draft (DNV-OS-J101); Det Norske Veritas: Oslo, Norway, 2014. [Google Scholar]
  27. American Petroleum Institute. American Petroleum Institute Recommended Practice for Planning, Designing and Constructing Fixed Offshore Platforms—Working Stress Design (API RP2A-WSD); American Petroleum Institute: Washington, DC, USA, 2014. [Google Scholar]
Figure 1. Model for soil springs.
Jmse 08 00215 g001
Figure 2. Dimensions of piled concrete foundation (PCF).
Jmse 08 00215 g002
Figure 3. Selected site for the 5-GW wind farm project.
Jmse 08 00215 g003
Figure 4. Distributions of wave and current forces.
Jmse 08 00215 g004
Figure 5. Modeling of PCF.
Jmse 08 00215 g005
Figure 6. Comparison of displacements of BC-PL model and BC-PB model.
Jmse 08 00215 g006
Figure 7. Maximum displacement of structural models.
Jmse 08 00215 g007
Figure 8. Comparison of stresses in shaft of piled model (BC-PL) and fixed model (BC-FB).
Jmse 08 00215 g008
Figure 9. Stress distributions of steel shaft on DLC6.2da3.
Jmse 08 00215 g009
Figure 10. Comparison of stresses in concrete of BC-PL model and BC-FB model.
Jmse 08 00215 g010
Figure 11. Stress distributions on DLC6.2da.
Jmse 08 00215 g011
Figure 12. Comparison of stresses in concrete of SS-CF model and SS-PS model.
Jmse 08 00215 g012
Figure 13. Prestressed tendon arrangement.
Jmse 08 00215 g013
Figure 14. Total stresses on structure.
Jmse 08 00215 g014
Figure 15. Design ranges for the fundamental frequency of WinDS3000.
Jmse 08 00215 g015
Figure 16. Mode shapes of PCF.
Jmse 08 00215 g016
Table 1. Material properties.
MaterialProperties
Steel (for shaft)Specification and Grade: ASTM 572
Elastic Modulus: 200,000 MPa
Unit Weight: 77.0 kN/m3
Steel Strength: 345 MPa
ConcreteDesign Strength: 45 MPa
Design Strength for Grout part: 40 MPa ((More than 30 MPa)
PS TendonUltimate Strength: fpu = 1900 MPa
Yield Strength: fpy = 1600 MPa
Nominal Cross-Sectional Area of Strand: Ap = 138:700 mm2
Table 2. Soil conditions.
StratumDepth γ t γ s u b C ϕ
(m)(kN/m3)(kN/m3)(kN/m3)(deg)
Sand0.0~14.017.710-20
Clay14.0~16.016.7910-
Sand16.0~25.017.710-30
Sand25.0~34.017.710-35
Sand34.0~37.017.710-25
Sand37.0~44.017.710-30
Sand44.0~58.017.710-30
Weathered soil58.0~60.017.710-35
Weathered rock60.0~64.518.711-35
Table 3. Specifications of WinDS3000 wind turbine.
Rating3 MWRated Wind Speed13 m/s
Rotor orientationUpwindCut-out wind speed25 m/s
Blade3 bladesNacelle mass130,000 kg
Rotor diameter91.3 mHub mass30,000 kg
Hub height80 mBlade mass100,000 kg
Cut-in wind speed4 m/sTower mass157,000 kg
Table 4. Design load cases.
Design SituationDLCSafety Factor
Power production1.3a1.35
1.4af1.35
Power production plus loss of electrical grid connection2.2cc1.35
2.3bc1.10
1.4af1.10
Parked (standing still or idling)6.1ab1.35
6.2da1.10
6.2ka1.10
6.2db1.10
6.2fb1.10
6.2kb1.10
3a1.00
Transport, assembly, maintenance, and repair8.1al1.505
Table 5. Spring stiffness.
LayerHorizontal Spring Stiffness (N/m)Vertical Spring Stiffness (N/m)
1st2.251 × 1091.398 × 107
2nd1.847 × 1096.465 × 106
3rd5.756 × 1092.492 × 107
4th9.557 × 1093.389 × 107
5th1.406 × 10103.688 × 107
6th1.783 × 10104.385 × 107
7th3.098 × 10105.781 × 107
8th2.976 × 10101.296 × 108
Table 6. Definition of structural models.
Analytical ParametersModel NameModel
Boundary conditionsBC-FBFixed foundation
BC-PLPiled foundation
Type of pilePL-RCDRCD piled foundation
PL-STSteel piled foundation
Positions of stress concentrationSS-CFConcrete foundation
SS-PSConcrete sleeve
Table 7. Prestressing force.
Forces and StressesEquations and Values
1 strand force1368 MPa × 138.700 mm2 = 189,742 N
1 tendon force189,742 N × 19 strands = 3,605,090 N
30 tendon force3,605,090 N × 30 tendons = 108,152,940 N
Stress108,152,940 N/8.01e+06 mm2 = 11.702 MPa
Effective stress11.702 MPa × 0.8 = 9.36 MPa
Table 8. Maximum deflections, rotations, allowable capacities, and loads of the piles.
Load CasesMax. Deflection (m)Max. Rotation (deg)Allowable Bearing
Capacity (kN)
Allowable Pullout Capacity (kN)
830,516818,653
Compressive ForceTensile Force
DLC6.1ab0.00660.0313533711,641
DLC2.2cc0.00580.026632549235
DLC6.2da0.00560.0261453710,545
DLC6.2ka0.00610.0287424910,261
DLC1.4af0.00640.0305476711,200
DLC2.3bc0.00380.0152-4831
DLCe3a0.00610.028840439849
DLC8.1al0.00580.027032299897
DLC1.3a0.00750.0371805214,490
DLC6.2fb0.00370.0145-5340
DLC6.2kb0.00610.0286423510,219
DLC6.2db0.00570.0266454110,551
Table 9. Results of natural frequency analysis.
ModePL-STPL-RCDBC-FB
Frequency (Hz)Period (sec)Frequency (Hz)Period (s)Frequency (Hz)Period (s)
1st0.35192.84150.35612.80800.38142.6221
2nd0.35192.84150.35612.80800.38142.6221
3rd1.18180.84621.18380.84471.20790.8279
4th1.59170.62821.63290.61241.98140.5047

