Article

Dynamics Simulation of the Risk Coupling Effect between Maritime Pilotage Human Factors under the HFACS Framework

1
Merchant Marine College, Shanghai Maritime University, Shanghai 201306, China
2
Plymouth Business School, University of Plymouth, Devon PL4 8AA, UK
3
College of Ocean Science and Engineering, Shanghai Maritime University, Shanghai 201306, China
*
Author to whom correspondence should be addressed.
J. Mar. Sci. Eng. 2020, 8(2), 144; https://doi.org/10.3390/jmse8020144
Submission received: 12 January 2020 / Revised: 18 February 2020 / Accepted: 20 February 2020 / Published: 22 February 2020

Abstract

:
Maritime pilotage is an important guarantee for the safety of water traffic in port. The pilot is affected by the complex port environment, the differences of crew and equipment of different ships, the physical and psychological pressure of the pilot himself, as well as the management factors from the pilot station and maritime safety administration. In order to avoid pilotage accidents (PAs), it is necessary to study the coupling effect of human-organizational factors (HOFs) on PAs. In this paper, from the perspective of HOF risk coupling in pilotage, the problem of HOF risk coupling in maritime pilotage is studied by using the hierarchical classification idea of the human factors analysis and classification system (HFACS) and the method of system dynamics (SD). First of all, HFACS is used to analyse the HOF risk causal elements (RCEs) in pilotage, and 70 RCEs are summed up in four layers; secondly, the SD coupling model of RCEs is constructed; finally, based on a dataset of PAs collected by the Shanghai Harbour Pilot Association, the coupling simulation of RCEs in pilotage is carried out, and the volatility is evaluated. In general, the safety situation of maritime pilotage has been improving in the Shanghai port. However, four RCEs (negligence, habit, pilotage experience, and violations) in unsafe acts and two RCEs (teamwork and personal safety awareness) in precondition for unsafe acts contribute the most to maritime PAs and need to be paid attention to.

1. Introduction

Maritime pilotage, which plays a very active role in port maritime safety, refers to the operations where pilots board a ship, guide the ship safely into and from the port, berth or unberth, drop or heave up anchors, as well as passing ship locks and other restricted waters in certain water areas for the purpose of ensuring the safety of the ships, ports, and facilities. However, due to the improper judgment, operation, and decision-making of pilots, and the uncertainty and complexity of the environment, it is unlikely to eliminate maritime pilotage accidents (PAs) completely and PAs will continue to occur. Scholars and pilotage experts have studied the issue of pilotage risk of ships in the port water areas from different perspectives. Hu et al. adopted a formal safety assessment (FSA) proposed by the International Maritime Organization (IMO) to conduct a risk assessment on the safety pilotage in the Shanghai port [1]. On the basis of applied research, Fang et al. analysed the importance degree of the “human–machine–environment” cause of the pilotage risk system [2]. Xi et al. pointed out that the main cause of PAs was human error [3].
As important national and international hubs of transportation, ports are widely concerned by the society. Moreover, with the continuous growth of international trade, the port becomes more and more busy, making the density of ships in the port water area increase greatly. As a result, water traffic accidents occur frequently, and people’s lives, property, and environment are facing a huge threat. In particular, some serious accidents, such as the collision of CF Crystal and Sanchi in the East China Sea [4], have caused great concerns.
In the actual pilotage, the pilot’s advice is supposed to be authorized by the captain and implemented by the officer on watch (OOW) and helmsman in the normal conditions. As such, the captain needs to supervise the operation of the pilot and take necessary actions, including taking command when he has any doubt. Therefore, it is extremely important that the ship’s crew on bridge and the pilot work closely to guarantee the safety of ships. When berthing and unberthing, the cooperation between the ship and the tugboat and the dock side is also required. In some special cases, if the visibility is poor, or the ship carried dangerous goods, some additional safety measures are needed, such as additional look-out and tug escorts. Obviously, due to the addition of pilots, the traditional ship’s bridge has changed in the operation of navigation, so that pilots’ technical acts directly affect the safety of the ships entering and leaving the ports. Furthermore, pilots are faced with the complicated environment of the pilotage waters, the quality of the crew on the piloted ships, the diversity of equipment on the piloted ships, the psychological and physical pressure of themselves, and the supervision of various departments within the pilot station. Therefore, the risk of pilotage operations is characterized by diversity and complexity, and the occurrence of a PA is no longer just the personal acts of the pilot. In this context, it is necessary to pay more attention to the human-organizational factors (HOFs) in the entire piloting process.
While individual risk causal elements (RCEs) can lead to accidents, the interaction, which is termed as the risk coupling, between two or more RCEs will also affect the risk of the entire HOF system. Although risk coupling has been receiving more and more research attention [5], it has rarely been studied in human factors research. Based on a database of PAs, this article investigates the risk coupling effect between RCEs in maritime pilotage. The database contains all the PAs collected and investigated by the Shanghai Harbour Pilot Association (SHPA) from 1995 to 2016, a total of 890, including collisions, groundings, and all other types of accidents. All these cases are deemed worthy of investigation by the SHPA. The reason that the SHPA collected information about and investigated these PAs is to learn from these individual cases. The purpose of this paper, however, is to analyse these PAs together in order to investigate the risk coupling effect. Shanghai is the busiest port in the world, and the number of ships piloted in the Shanghai port is increasing day by day. It has exceeded 70,000 ships in 2016 [6], which is shown in Figure 1.
This article is structured as follows. Section 2 reviews the related research about human factors. Section 3 presented the research theory about risk coupling and risk measurement, and proposes a coupling model of RCEs in pilotage based on system dynamics (SD). In Section 4 and Section 5, the coupling model is simulated with the HOF data, and the results are analysed and discussed. Section 6 concludes the paper.

2. Literature Review

While maritime transport has a long history, HOF research in maritime shipping originates from aviation, nuclear energy, and other industries [7]. With the increase in the size of ships and the constant complexity of traffic in the port waters, the risk of maritime pilotage continues to increase, and risk management methods need to be introduced. As early as the 1930s, Heinrich proposed the causal chain theory of accidents, expounding the relationship between accidents and causes [8]. After that, researchers and scholars in various industries used qualitative, quantitative, and mixed methods to explore the relationship between causes and accidents, so that they could take better measures to control accidents based on specific causes. Cooper et al. proposed a technique for human event analysis (ATHEANA) to analyse human error and potential causes of nuclear power plants [9]. Marseguerra et al. used the cognitive reliability and error analysis method (CREAM) to evaluate the impact of common performance conditions (CPCs) on operational reliability ratings [10]. Li et al. used fuzzy Bayesian networks to study the root cause of human error as an organizational factor [11]. Sotiralis et al. focused on HOFs in ship collisions and estimated the risk of HOFs [12].
In 1972, Edwards proposed the SHEL model [13], which stands for software, hardware, environment, and liveware. Subsequently, Hawkins modified the model by adding another “L” to emphasize the interaction between liveware and other liveware; that is, the communication, exchange, cooperation, and division of labour between humans [14]. As such, people are the most important part of the model. In 1997, Kawano studied nuclear power and found that although SHEL could explain HOFs, it could not take into account teamwork, equipment, and software, nor management factors such as a safety culture and organizational management. Therefore, Kawano proposed the M-SHEL evolution model, where M describes the organizational management factors [15]. The SHEL model has also been widely used. Chang et al. used the SHEL model to analyse the risk factors of aircraft maintenance technicians in the aviation maintenance industry [16]. However, the SHEL model only provides factors that are considered when dealing with HOFs without classifying the hierarchical relations of these factors.
In 1990, Reason proposed the Swiss Cheese Model (SCM) [17]. In 2000, based on a large number of aviation accident reports, Shappell and Wiegmann proposed the human factors analysis and classification system (HFACS) model, which classifies faults into active faults and latent faults [18]. The idea of classification and stratification of HOFs was very popular in various industries and made Reason’s SCM of practical significance. HFACS is widely used in accident investigations in many industries, with some transformations to make it consistent with the characteristics and actual conditions of various industries, such as the aviation industry [19,20], construction industry [21], railway industry [22,23], shipping industry [24,25,26], oil and gas industry [27], and mining industry [28,29].
However, traditional linear relationship models can no longer explain complex systems nowadays, and the SCM has been subject to criticism because simplified and linear models cannot explain the complexity, dynamics, and adaptability of the system and unexpected failures caused by system characteristics [30,31,32]. As the system thinking method can analyse the system as a whole instead of a certain part in isolation [33,34], more recently safety scientists have proposed a series of systematic thinking methods with social technology systems at the core, such as AcciMap [35], system theory accident modelling and process models (Stamp) [36], SD [37], and the functional resonance accident model (FRAM) [38]. It has become a trend to study HOFs from the perspective of systems thinking.
In the maritime transportation industry, 80% of maritime traffic accidents (MTAs) are related to HOFs [30], such as negligence of watchkeepers, poor communication and teamwork, and lack of supervision and management. IMO revealed that human factor is one of the most important factors that lead to accidents or avoid accidents in revised guidelines for FSA [39]. However, the human factor in shipping has largely been used to identify the cause–effect relationship of the accident, while ignoring the interaction or coupling effect between various factors.
This paper aims to make a contribution to maritime safety research by studying human factors from the perspective of a systematic HOF. It first adopts the HFACS classification and hierarchical thinking to analyse HOFs in pilotage in detail, and then it constructs a coupling model using SD. The coupling model is used to carry out a quantitative study on the degree and volatility of HOF risk coupling in maritime pilotage. It serves to reveal the impact of mutual coupling between HOFs at various layers of HFACS on the risk of accidents. Most of the research on human error in the maritime industry is qualitative, or quantitative with strong subjectivity, which makes the research results lack credibility. In this paper, the influence of subjectivity is reduced by using SD simulation with historical data (the dataset of 890 PAs from the SHPA).

3. Methodology and Data

3.1. Risk Coupling and the Coupling Function

3.1.1. Risk Coupling

Risk coupling refers to the degree to which the occurrence of an RCE and its influence depend on other RCEs, and the degree of influence and occurrence of other RCEs during the process of a system. In the HOF system of maritime pilotage, each RCE affects and interacts with each other, thereby changing the influence and even the nature of other RCEs. Such risk coupling influences the process of HOF risk evolution. For example, in one pilotage mission, due to a long backlog of ships requiring pilotage, the pilot had to work continuously; but during the piloting process, the pilot was fatigued, which led to his negligence and unsafe acts. In this case, the pilotage risk was increased dramatically by the coupling effect between the supervision of the dispatching department, the status of the pilot, and fatigue.

3.1.2. Coupling Degree Function
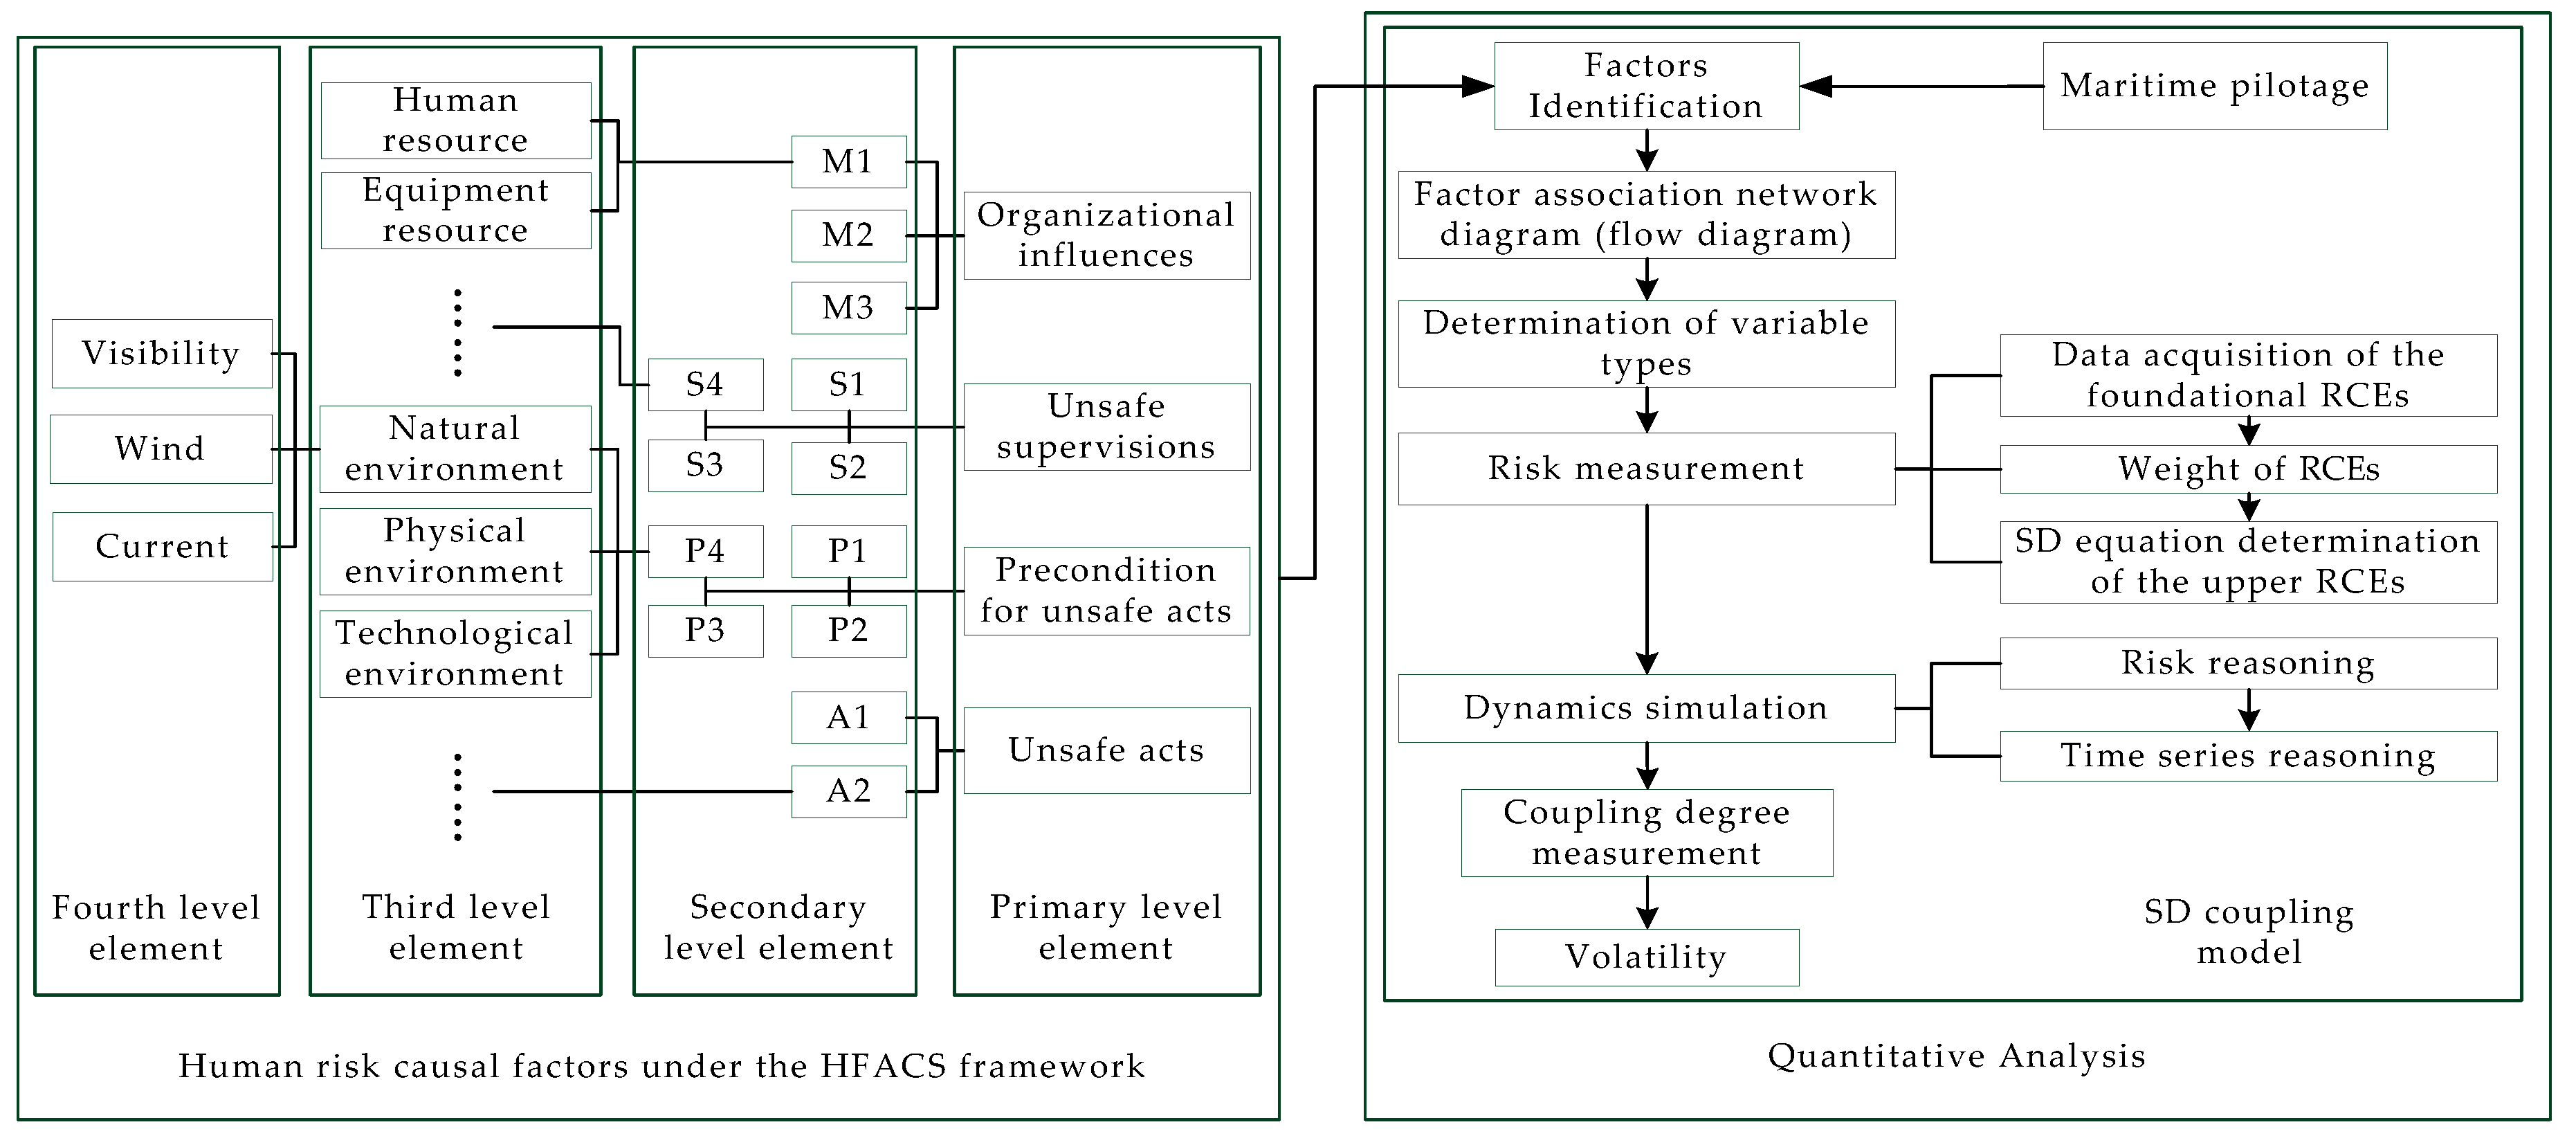
The calculation of the coupling degree of RCEs in maritime pilotage is based on the concepts of capacity coupling and capacity coupling coefficient models in physics [40,41]. The calculation equation is as follows:
C n = n { ( u 1 u 2 u n ) / ( i = 1 n u i ) n } 1 / n
u n denotes the risk of the RCE n in the coupling system.
Based on the HFACS model to be discussed in the next section, the risk coupling model of maritime pilotage is composed of four core subsystems, namely unsafe acts, preconditions for unsafe acts, unsafe supervisions, and organizational influences. According to mathematical principles, the value of C is between 0 and 1. When C = 1 , the coupling degree is maximized and the risk coupling between subsystems is maximized. When C = 0 , the coupling degree reaches the minimum value, and the subsystems are independent. The coupling is divided into four stages according to the coupling degree. When C ( 0 , 0.3 ] , the coupling model is in the disordered coupling stage; when C ( 0.3 , 0.5 ] , the coupling model is in the low-level coupling stage; when C ( 0.5 , 0.8 ] , the coupling model is in the intermediate-level coupling stage; when C ( 0.8 , 1 ] , the coupling model is in the high-level coupling stage.
C n ¯ = 1 m m = 1 m C n m
where C n ¯ is the average coupling degree of the coupling model n for m years.

3.2. HFACS Model

The HFACS model as mentioned in Section 2 classifies HOFs faults into two layers, active faults and latent faults, by taking into account all aspects of human error, including the errors of front-line operators and organizational departments. It has established a bridge among accidents, direct causes, indirect causes, and deeper causes [20]. This article also uses HFACS’s classification and hierarchical thinking to analyse HOFs in pilotage. In maritime traffic [42,43], HFACS describes four layers of human factor failures or defects, including unsafe acts, precondition for unsafe acts, unsafe supervisions, and organizational influences. The layer of unsafe acts is the HOF that directly lead to the accident, and the other three layers are potential HOFs.
Based on the dataset of 890 PAs and with the help of maritime pilotage experts, an HFACS model suitable for maritime pilotage is constructed. It consists of four layers: the phenomenon layer (unsafe acts of pilots, 15 RCEs), the influence layer (precondition for unsafe acts, such as environmental factors, 28 RCEs), the supervisory layer (unsafe supervisions, 11 RCEs), and the root layer (organizational influences, 12 RCEs). These factors are listed in Table 1.
In the actual pilotage, the RCEs of the phenomenon layer and the influence layer have the greatest influence on the pilotage operation. The RCEs of the phenomenon layer directly affect pilotage safety, and the RCEs at the influence layer directly affect the RCEs at the phenomenon layer. That is to say, the entire pilot is under the influence of RCEs at both the phenomenon layer and the influence layer. In the meantime, the RCEs of the supervisory layer and the root layer in pilotage are related to the shore-based departments, which manage scheduling management, equipment and technical support, personnel management, supervisions of pilotage plans and implementation processes, etc. The RCEs at the supervisory layer and the root layer indirectly affect pilotage safety through affecting the RCEs at the phenomenon layer and the influence layer.

3.3. Research Framework

Based on the constructed HFACS framework, an SD model is then built to produce the complete HFACS–SD framework (see Figure 2) used in this paper. The risk and weight of the foundational RCEs are calculated based on the database of PA causes, avoiding the subjectivity of the questionnaire survey, and thus obtaining SD equation of the upper RCEs. Then the risk of upper RCEs can be simulated dynamically. Finally, according to the coupling theory, the coupling influence and stability among HOFs are studied. These processes are explained in detail in the next few sections.

3.4. Risk Measurement

The HFACS model includes a total of 70 RCEs in four layers. These RCEs are divided into 38 leaf nodes (LNs), 28 intermediate nodes (INs), and 4 root nodes (RNs) in the HFACS–SD model.
The risk of LNs is obtained from the database. A certain accident is related to a certain foundational RCEs as “1” and irrelevant as “0”. Assume that the number of accidents related to a foundational RCE in HFACS in a year is x i j , then the risk for that year for this LN is
r i j = x i j / a j ,   i = 1 , 2 , , n , j = 1995 , 1996 , , 2016
where a j is the quantity of PAs in the year j .
The risk of INs is determined by the risk of the LNs, which requires calculating the weight of the LNs. The weight is determined based on the contribution of the 22-year average risk of the foundational RCEs to the upper RCE.
r i ¯ = 1 22 j = 1995 2016 r i j
where r i ¯ is the average risk for the foundational RCE from 1995 to 2016.
w i = r i ¯ / i = 1 m r i ¯
where w i is the weight of the LN i , and m is the number of LNs under the same IN.
u k j = i = 1 m w i r i j ,   i = 1 m w i = 1
where u k j is the risk for the year j about the upper RCE k . This is also the SD equation of the upper RCEs.
Repeating Equations (4)–(6), the risk of the RNs can be calculated based on the INs.

3.5. SD in HOF Risk Coupling Model for Maritime Pilotage

3.5.1. SD Theory

SD is a computer simulation technique proposed by Dr. Forrester of the Massachusetts Institute of Technology (MIT) to study the dynamics of the system [44]. SD is based on systems theory, cybernetics, and information theory, and applies the ideas of system science to build the SD model, so as to determine the internal components of the system and the characteristics of causal feedback. In this way, one can easily grasp the discipline of systematic change and development and find out the basic cause of the problem from the inside of the system, and then optimize and control it [45].
The SD model of HOF risk in the maritime pilotage based on HFACS includes HOF risk at all the four layers, organizational influences, supervising, precondition for unsafe acts, and unsafe acts, as shown in Figure 3. The purpose of the SD modelling process is to observe the interaction of the four layers in the system, determine the key variables of the system, and establish a causal feedback loop as well as SD equations between the variables. These key variables (status variables, auxiliary variables, rate variables, and table functions) all depend on the SD equations, which is a causal relationship between variables. This causality constitutes a feedback loop and a feedback system.

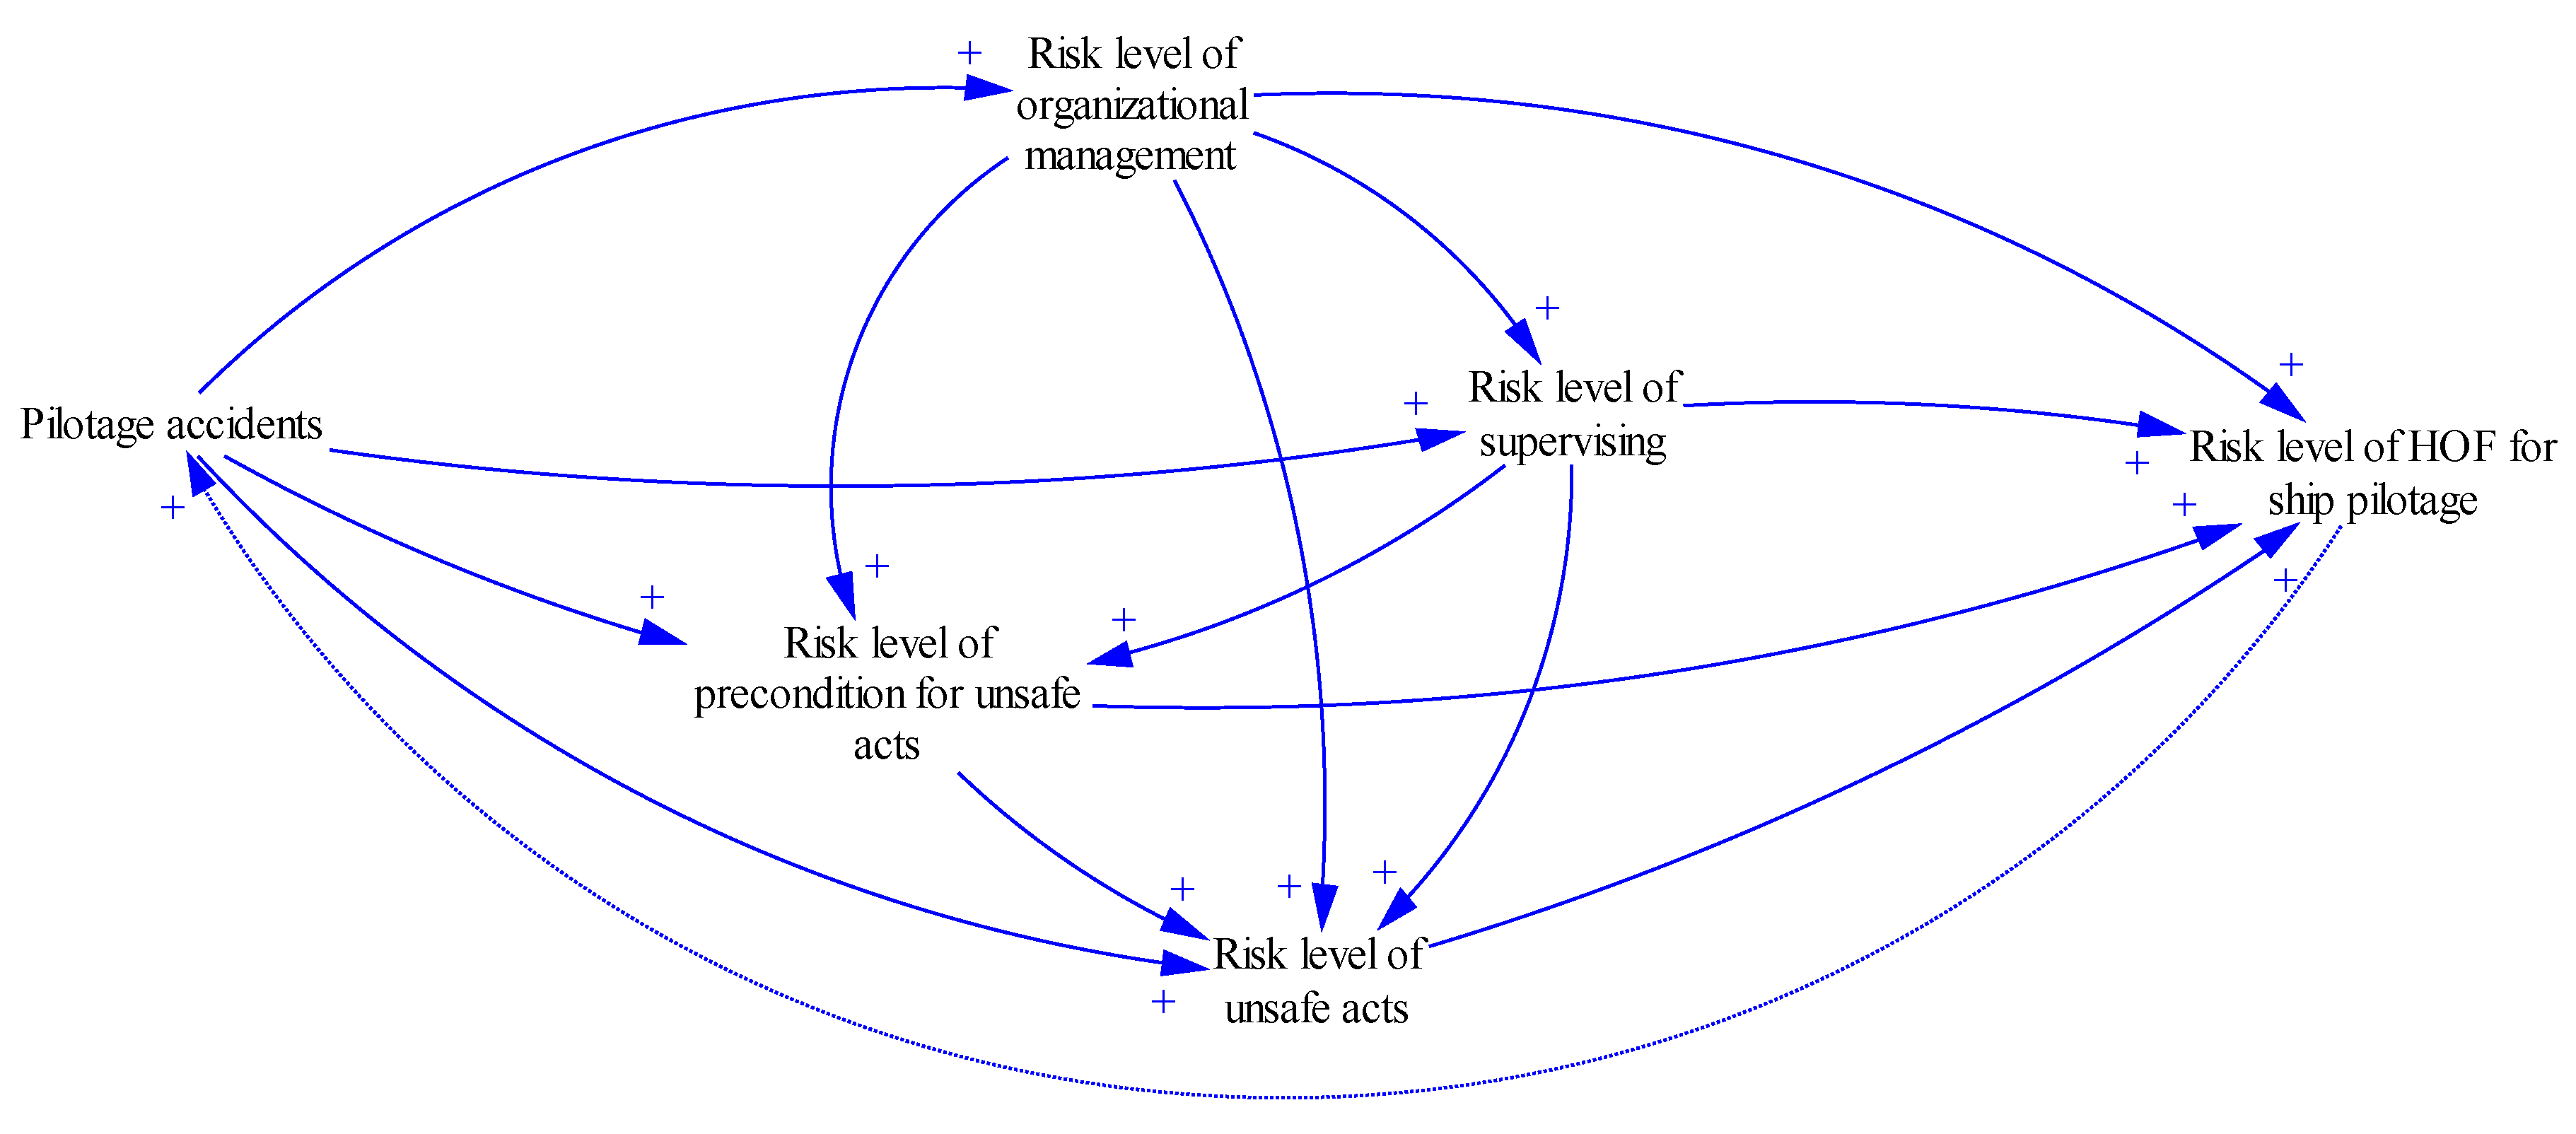
3.5.2. Causal Relationship SD Model for Maritime Pilotage

According to the causal chain theory of accidents, accidents are caused by the unsafe acts of human and unsafe states of things [46]. In HFACS, the latter is placed in the preconditions for unsafe acts, which is the prerequisite to trigger unsafe acts.
In the actual pilotage operation, the preconditions for unsafe acts directly affect the pilot’s unsafe acts. The Shanghai port channel is the estuary of the Yangtze River. Ships entering the Yangtze river need to pass through the waters of the Shanghai port. In the Shanghai section of the Yangtze River, there are dense traffic, complicated traffic forms, various types of ships, uneven quality and literacy of crew, extremely busy very-high-frequency (VHF) communications, the using and upgrading of new navigation aids, such as ECDIS and AIS, and the difference of various ships’ handling performance under different cargo loading conditions. Furthermore, due to the large number of ships in its jurisdiction, the vessel traffic system (VTS) may find it is difficult to supervise and give adequate advice to all of them. Navigable waters are limited for deep-draft ships in some complicated water areas with a tortuous coastline. All of these factors can lead to unsafe acts of pilots. Furthermore, although maritime pilotage is a highly practical industry, it cannot do without the support of shore-based departments, including supervisions for the pilot, management of pilotage equipment, training of pilots and shore-based personnel, and construction of corporate culture. As such, the coupling of RCEs in maritime pilotage is complicated, as shown in Figure 4.

4. Results

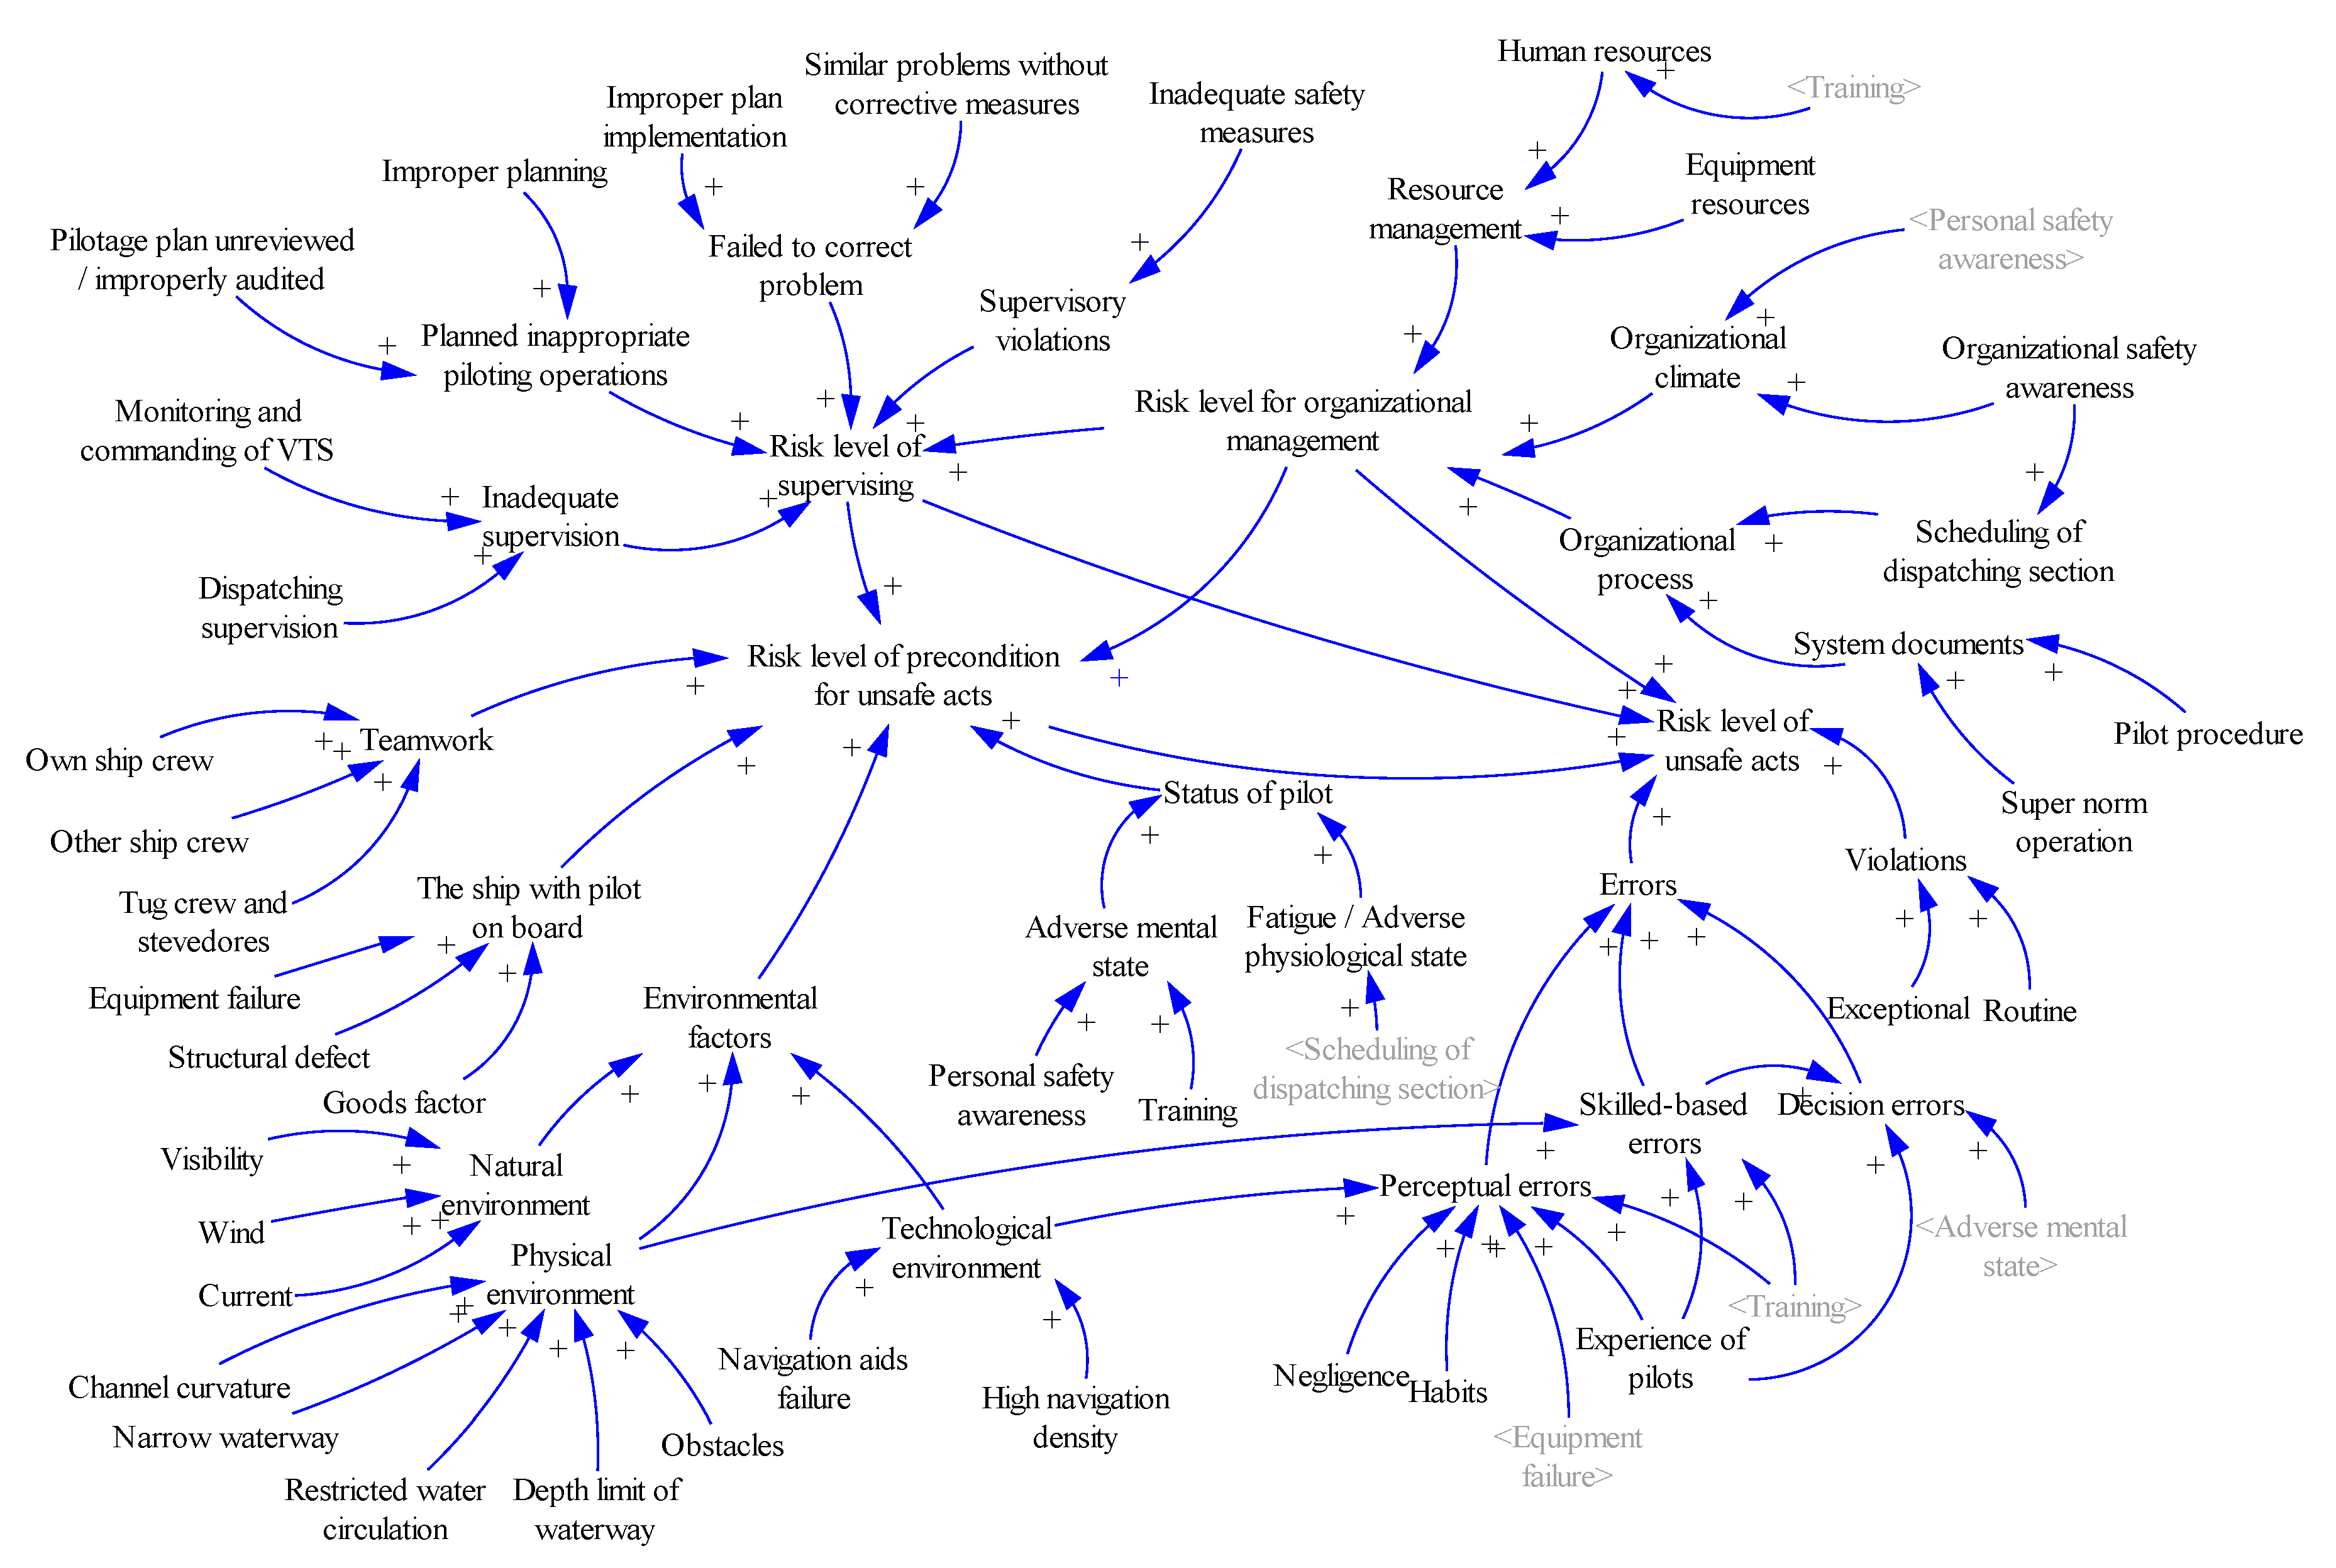
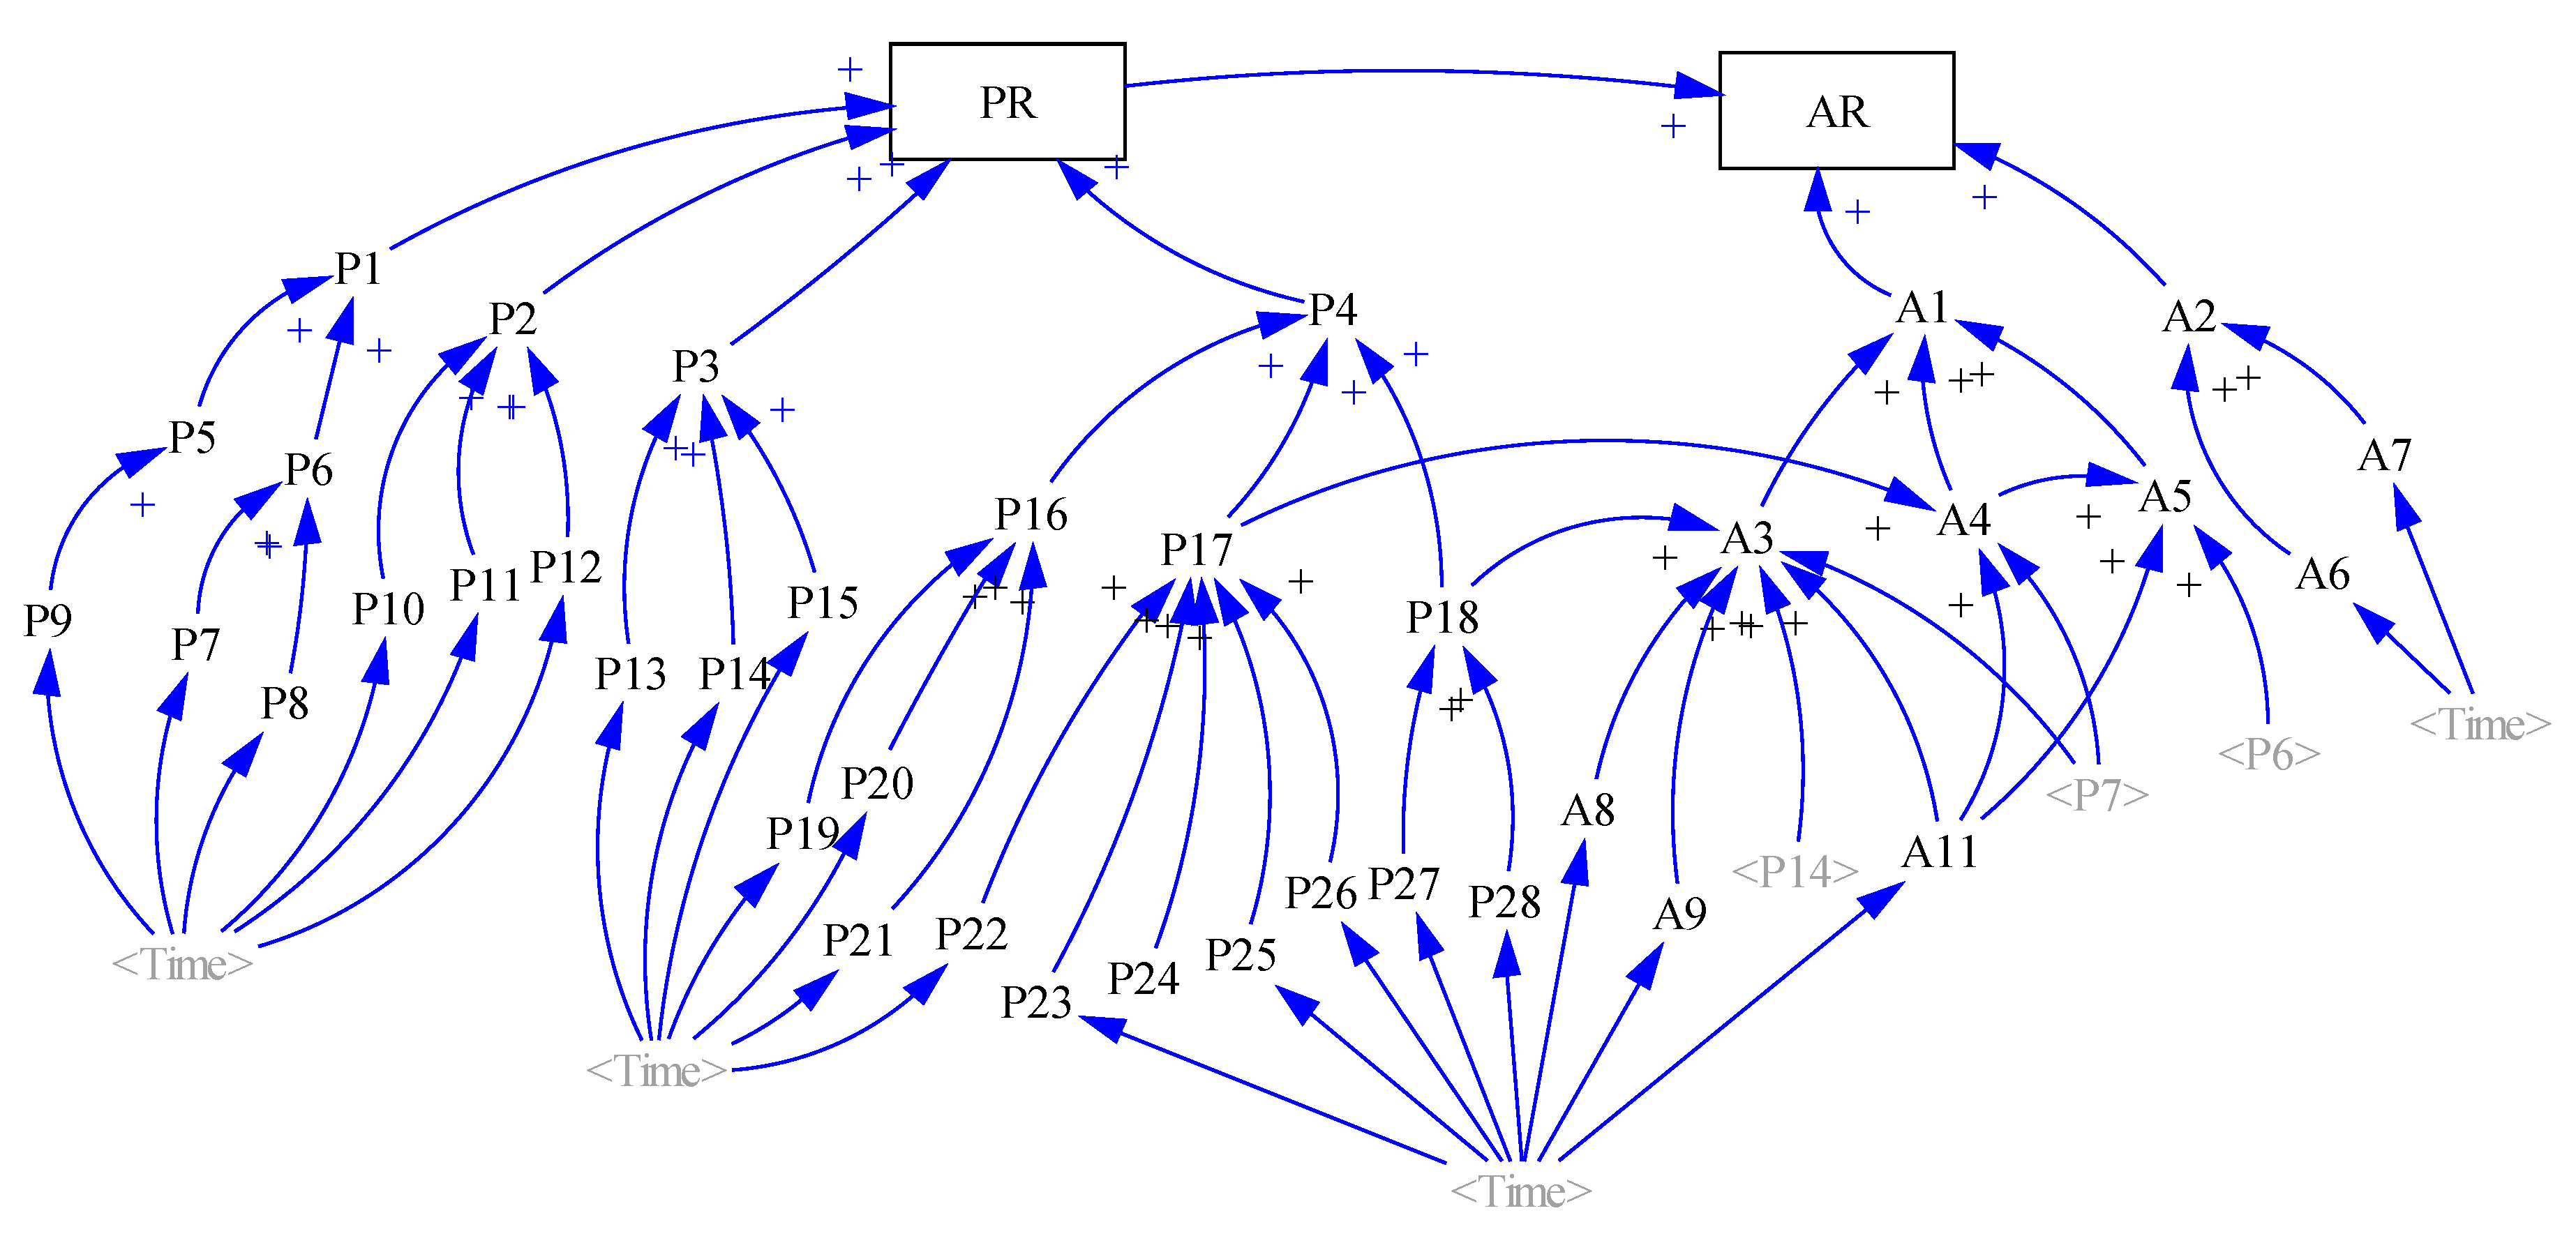
4.1. Flow Diagram of the HOF Risk Coupling Model in Pilotage

According to the causal relationship SD model in Section 3.5.2, it is easy to get the flow diagram of the HOF risk coupling model. For ease of expression, the nodes of the HOF risk coupling model are shown in Table 1. The LNs are all table functions according to the risk of the foundational RCEs in the PA data of the Shanghai port over 22 years. INs are auxiliary variables, and RNs are status variables. The INs and RNs can be calculated according to its sub-nodes and SD equation.
According to the theory of SD, there will be six combinations of two-HOF coupling model flow diagrams, four combinations of three-HOF coupling model flow diagrams, and one combination of four-HOF coupling model flow diagram in pilotage, which are V1: AR–MR, V2: AR–SR, V3: AR–PR, V4: SR–MR, V5: PR–MR, V6: PR–SR, V7: AR–MR–SR, V8: AR–MR–PR, V9: AR–SR–PR, V10: MR–SR–PR; V11: AR–MR–SR–PR, respectively. Because the layer of unsafe acts is closely related to the layer of preconditions for unsafe acts in the process of pilotage operations, one additional combination of the four-RCEs coupling model flow diagram is added; that is, V12: P1–P2–P3–P4. An example V3: AR–PR is shown in Figure 5.

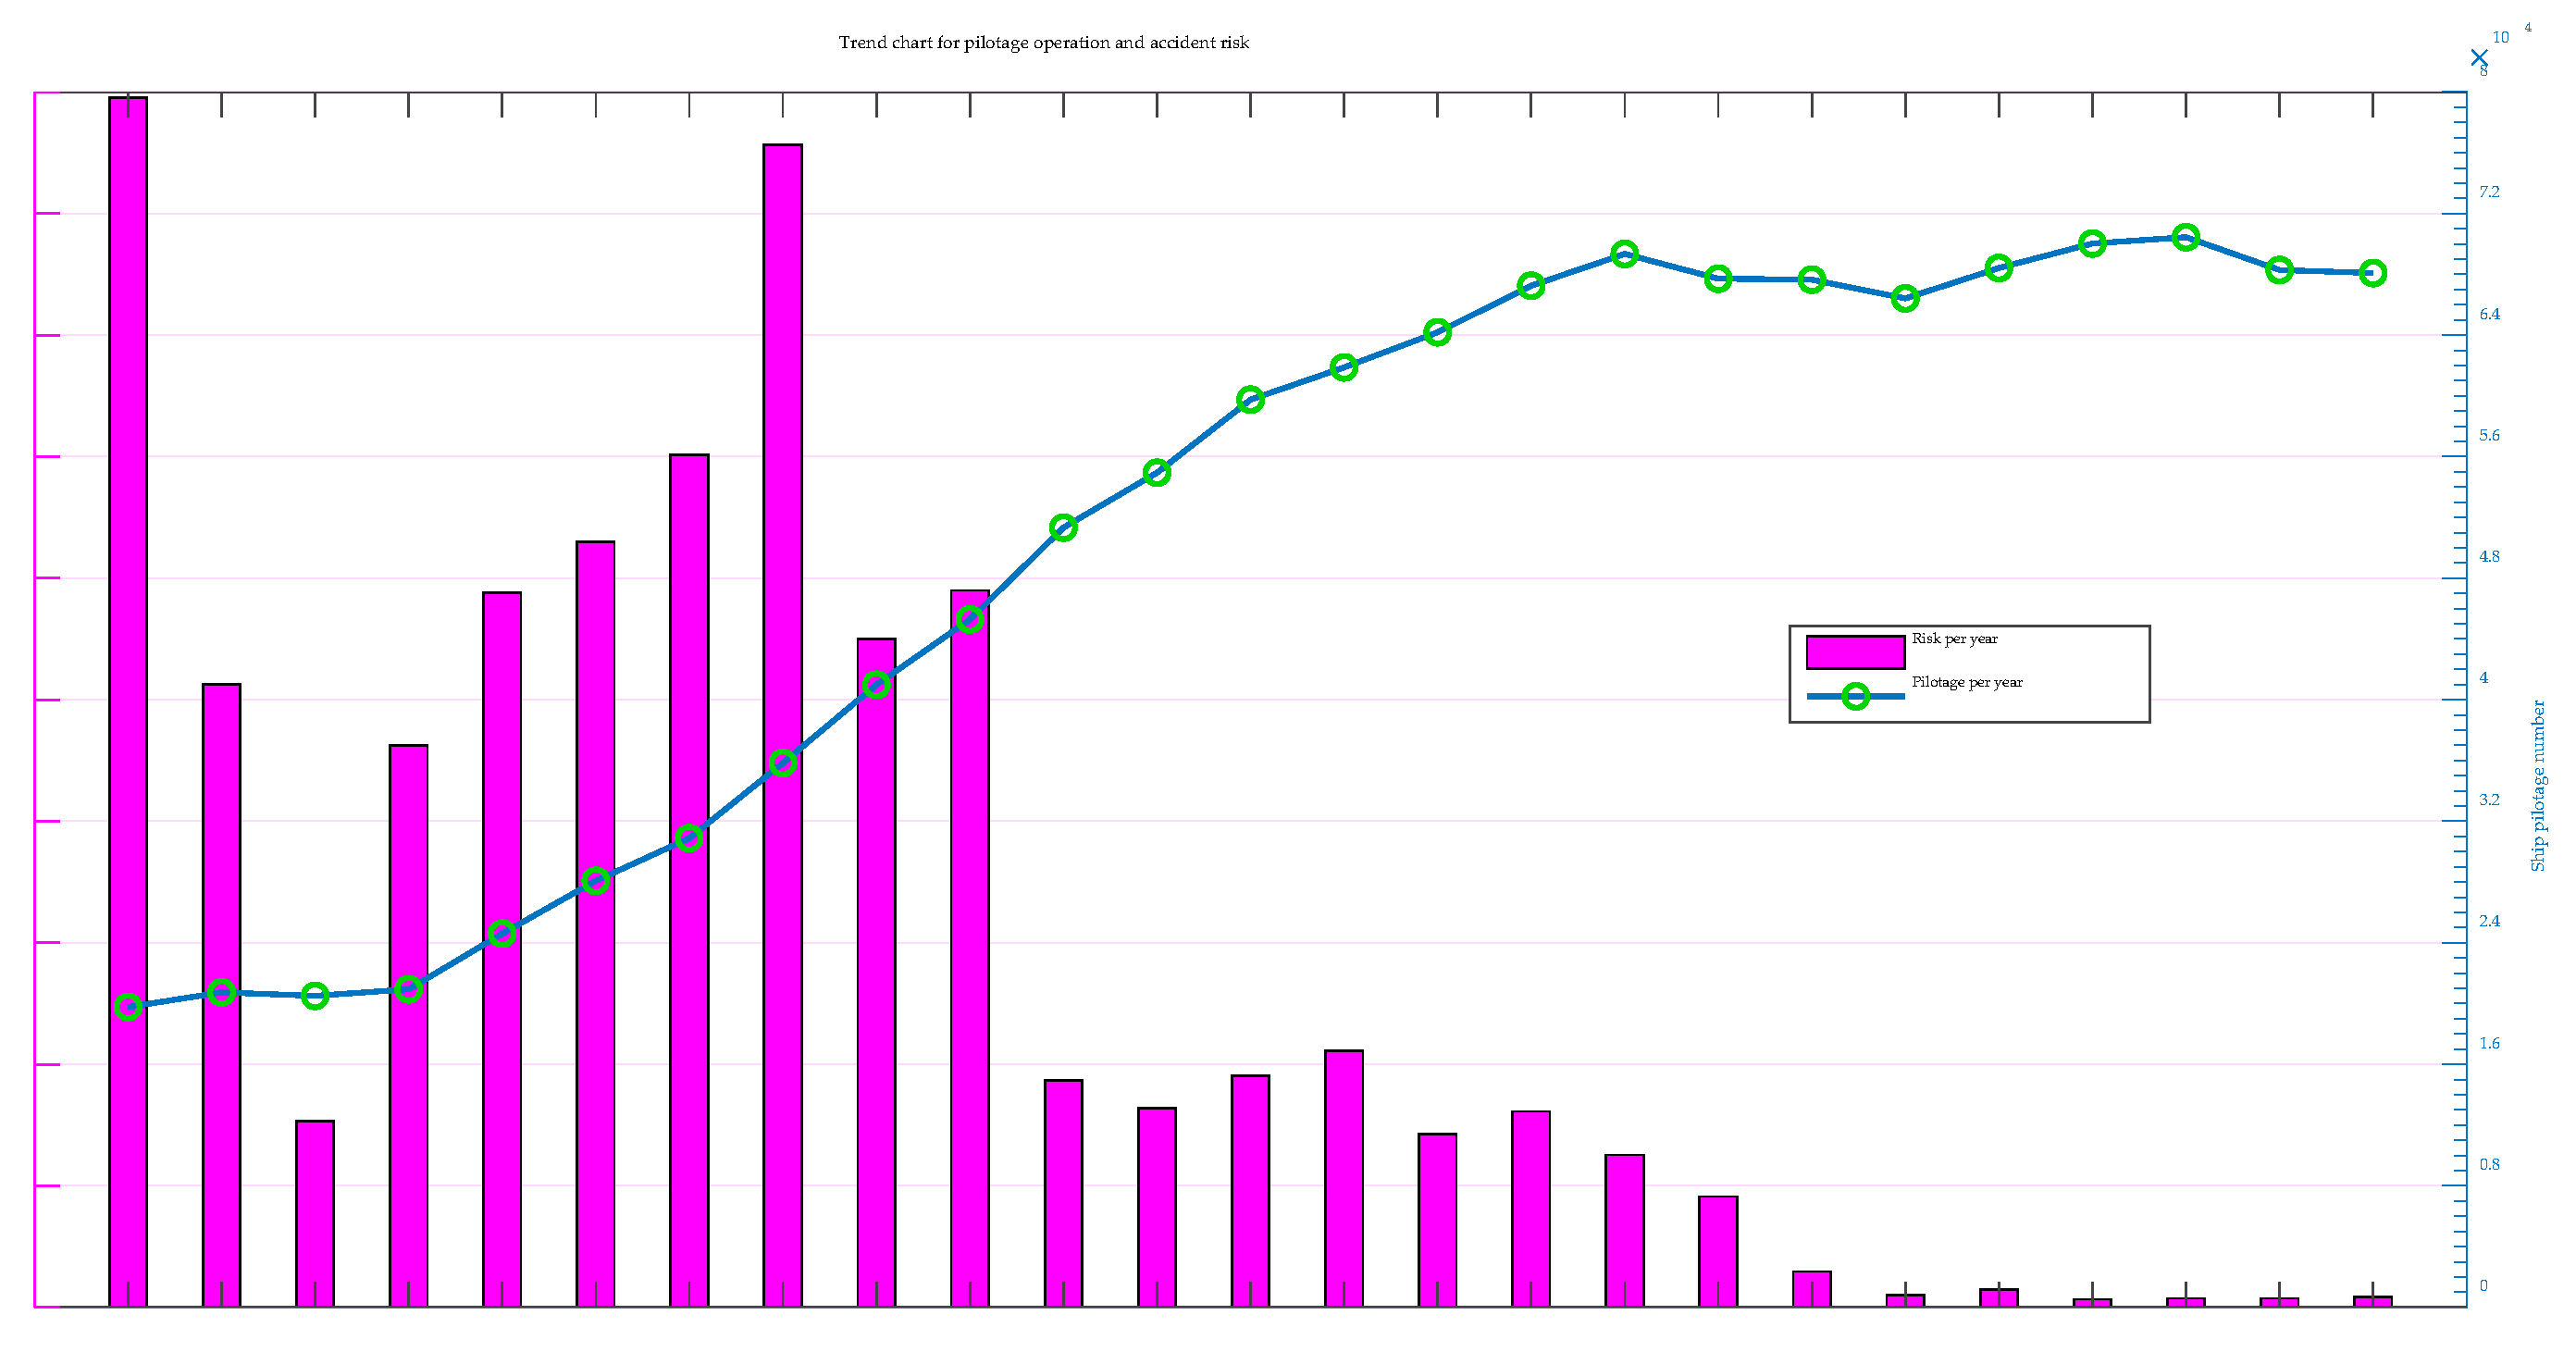
4.2. Data Acquisition

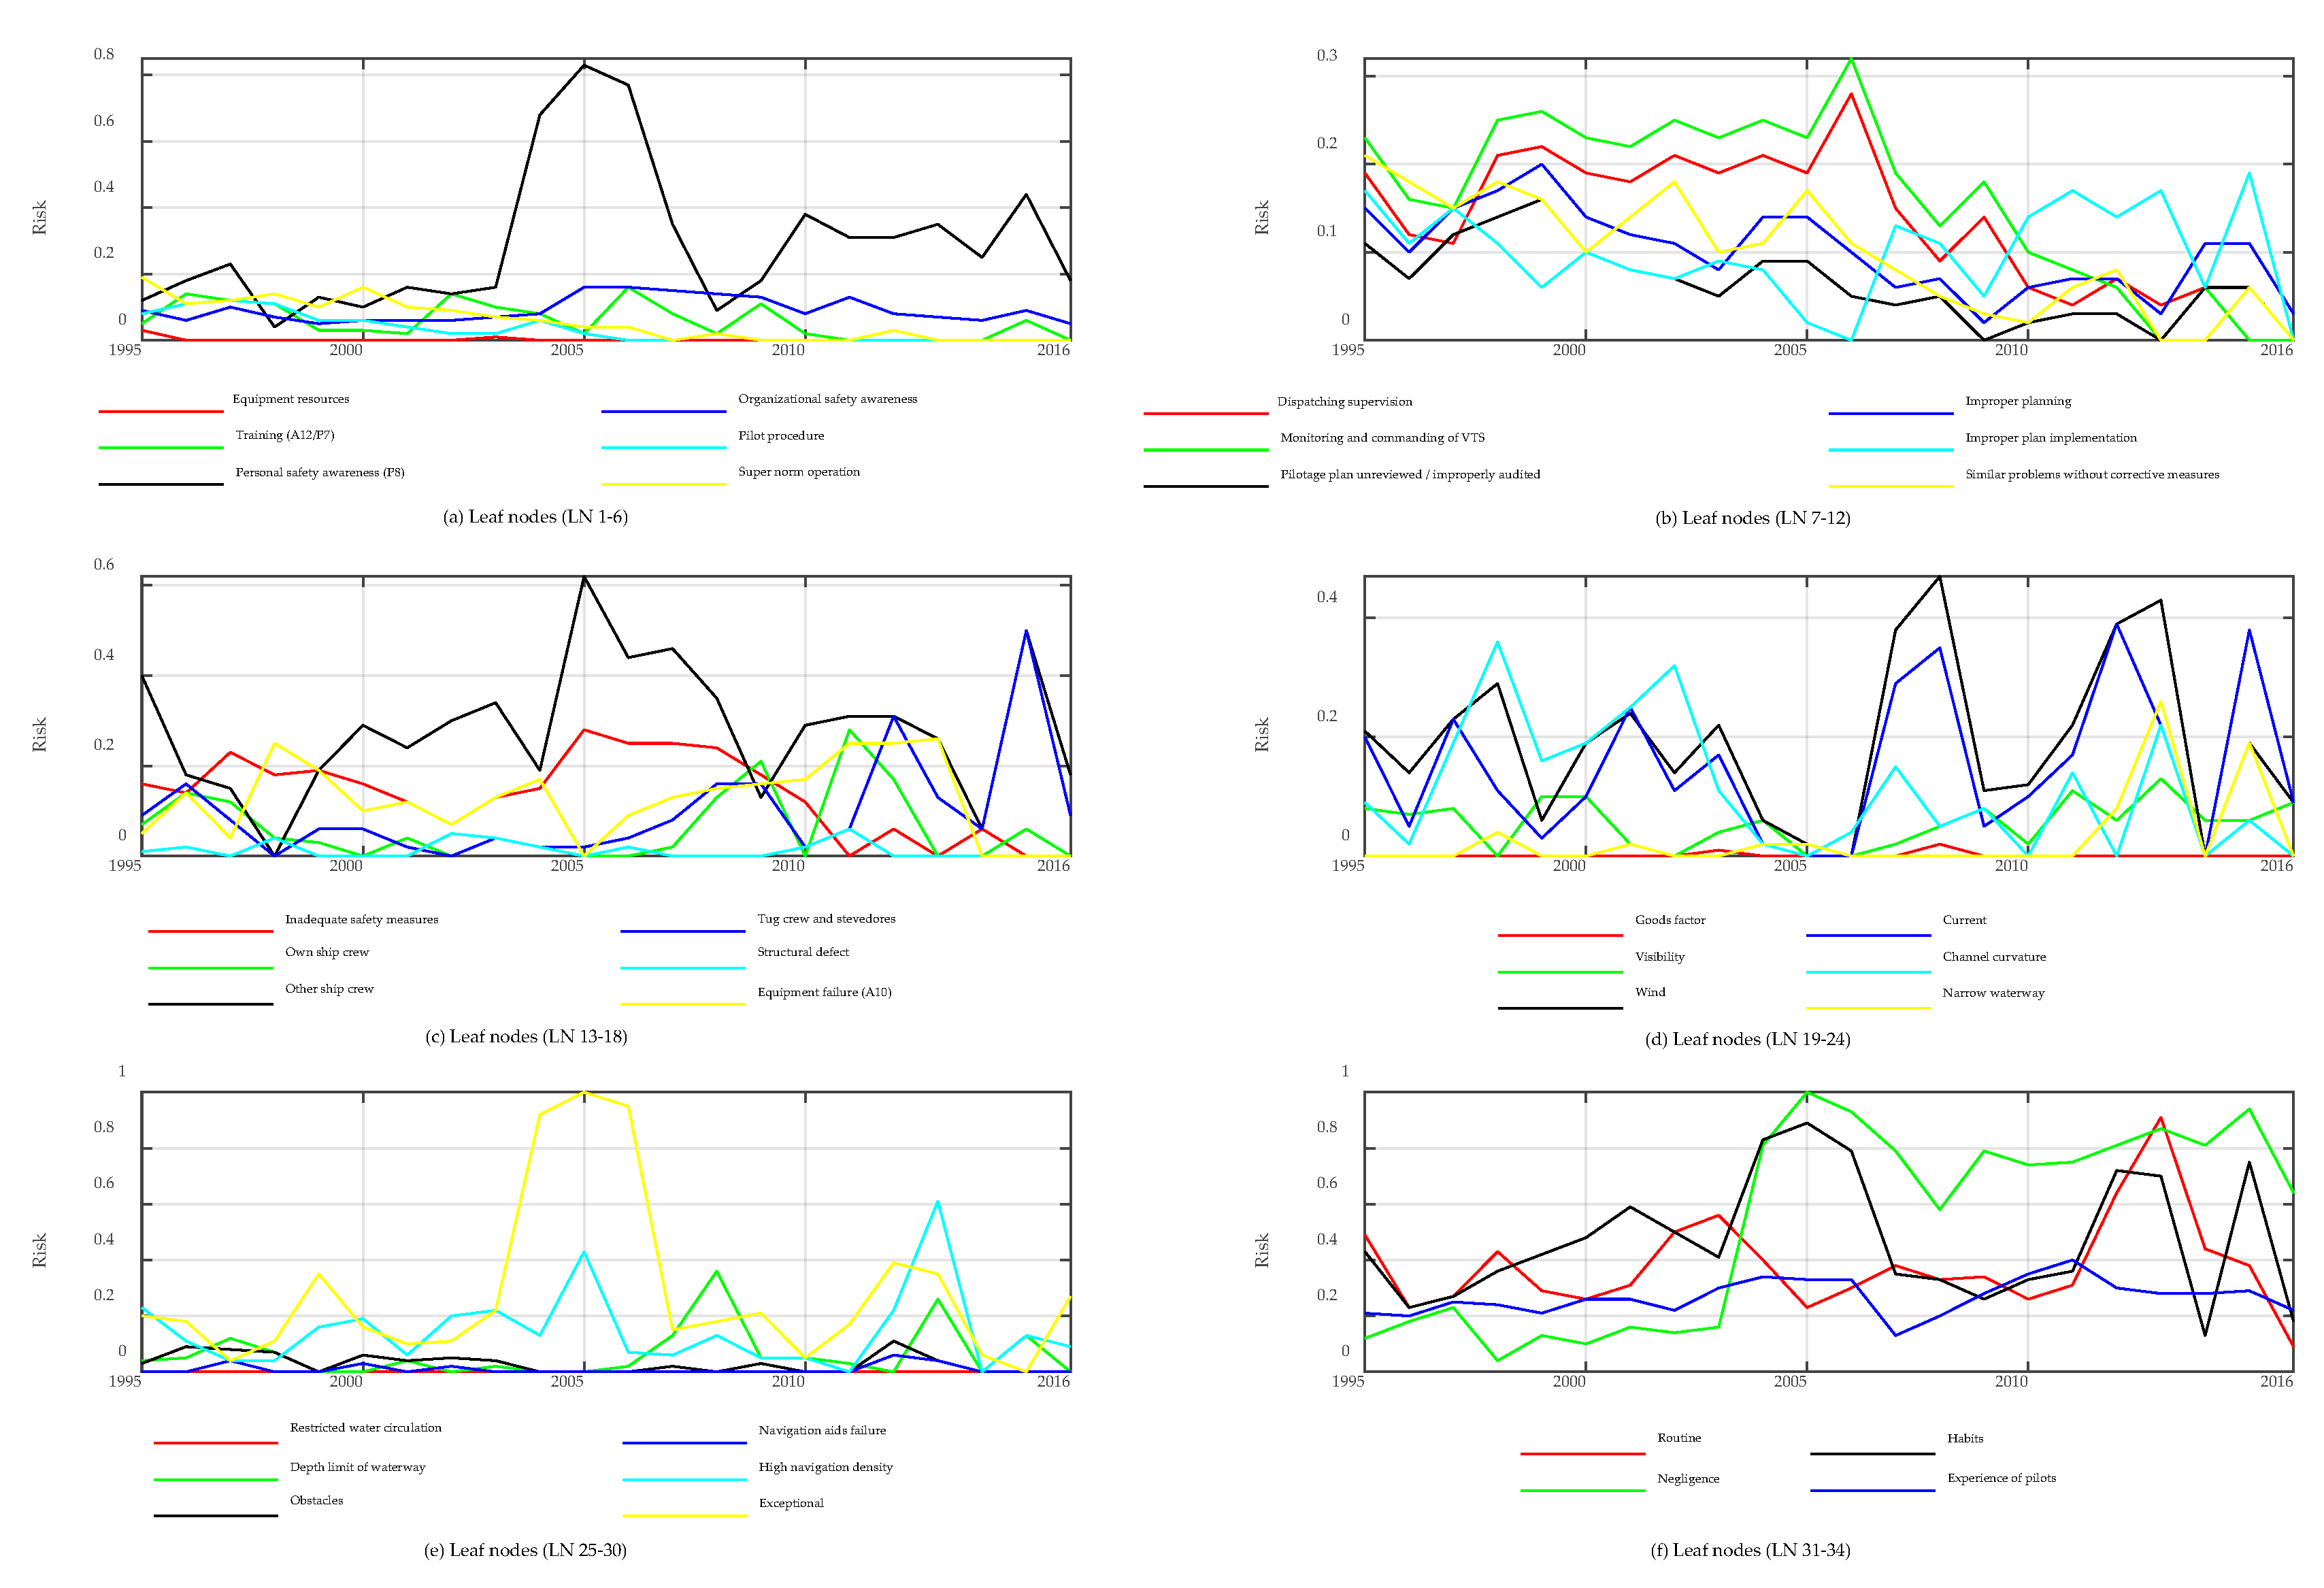
4.2.1. Risk of Foundational RCEs

According to Equation (3), the risk of each foundational RCE from 1995 to 2016 can be obtained. Figure 6 shows the contribution of 38 foundational RCEs to PAs each year. For example, it can be noted that the influence of wind is greater than the influence of visibility.

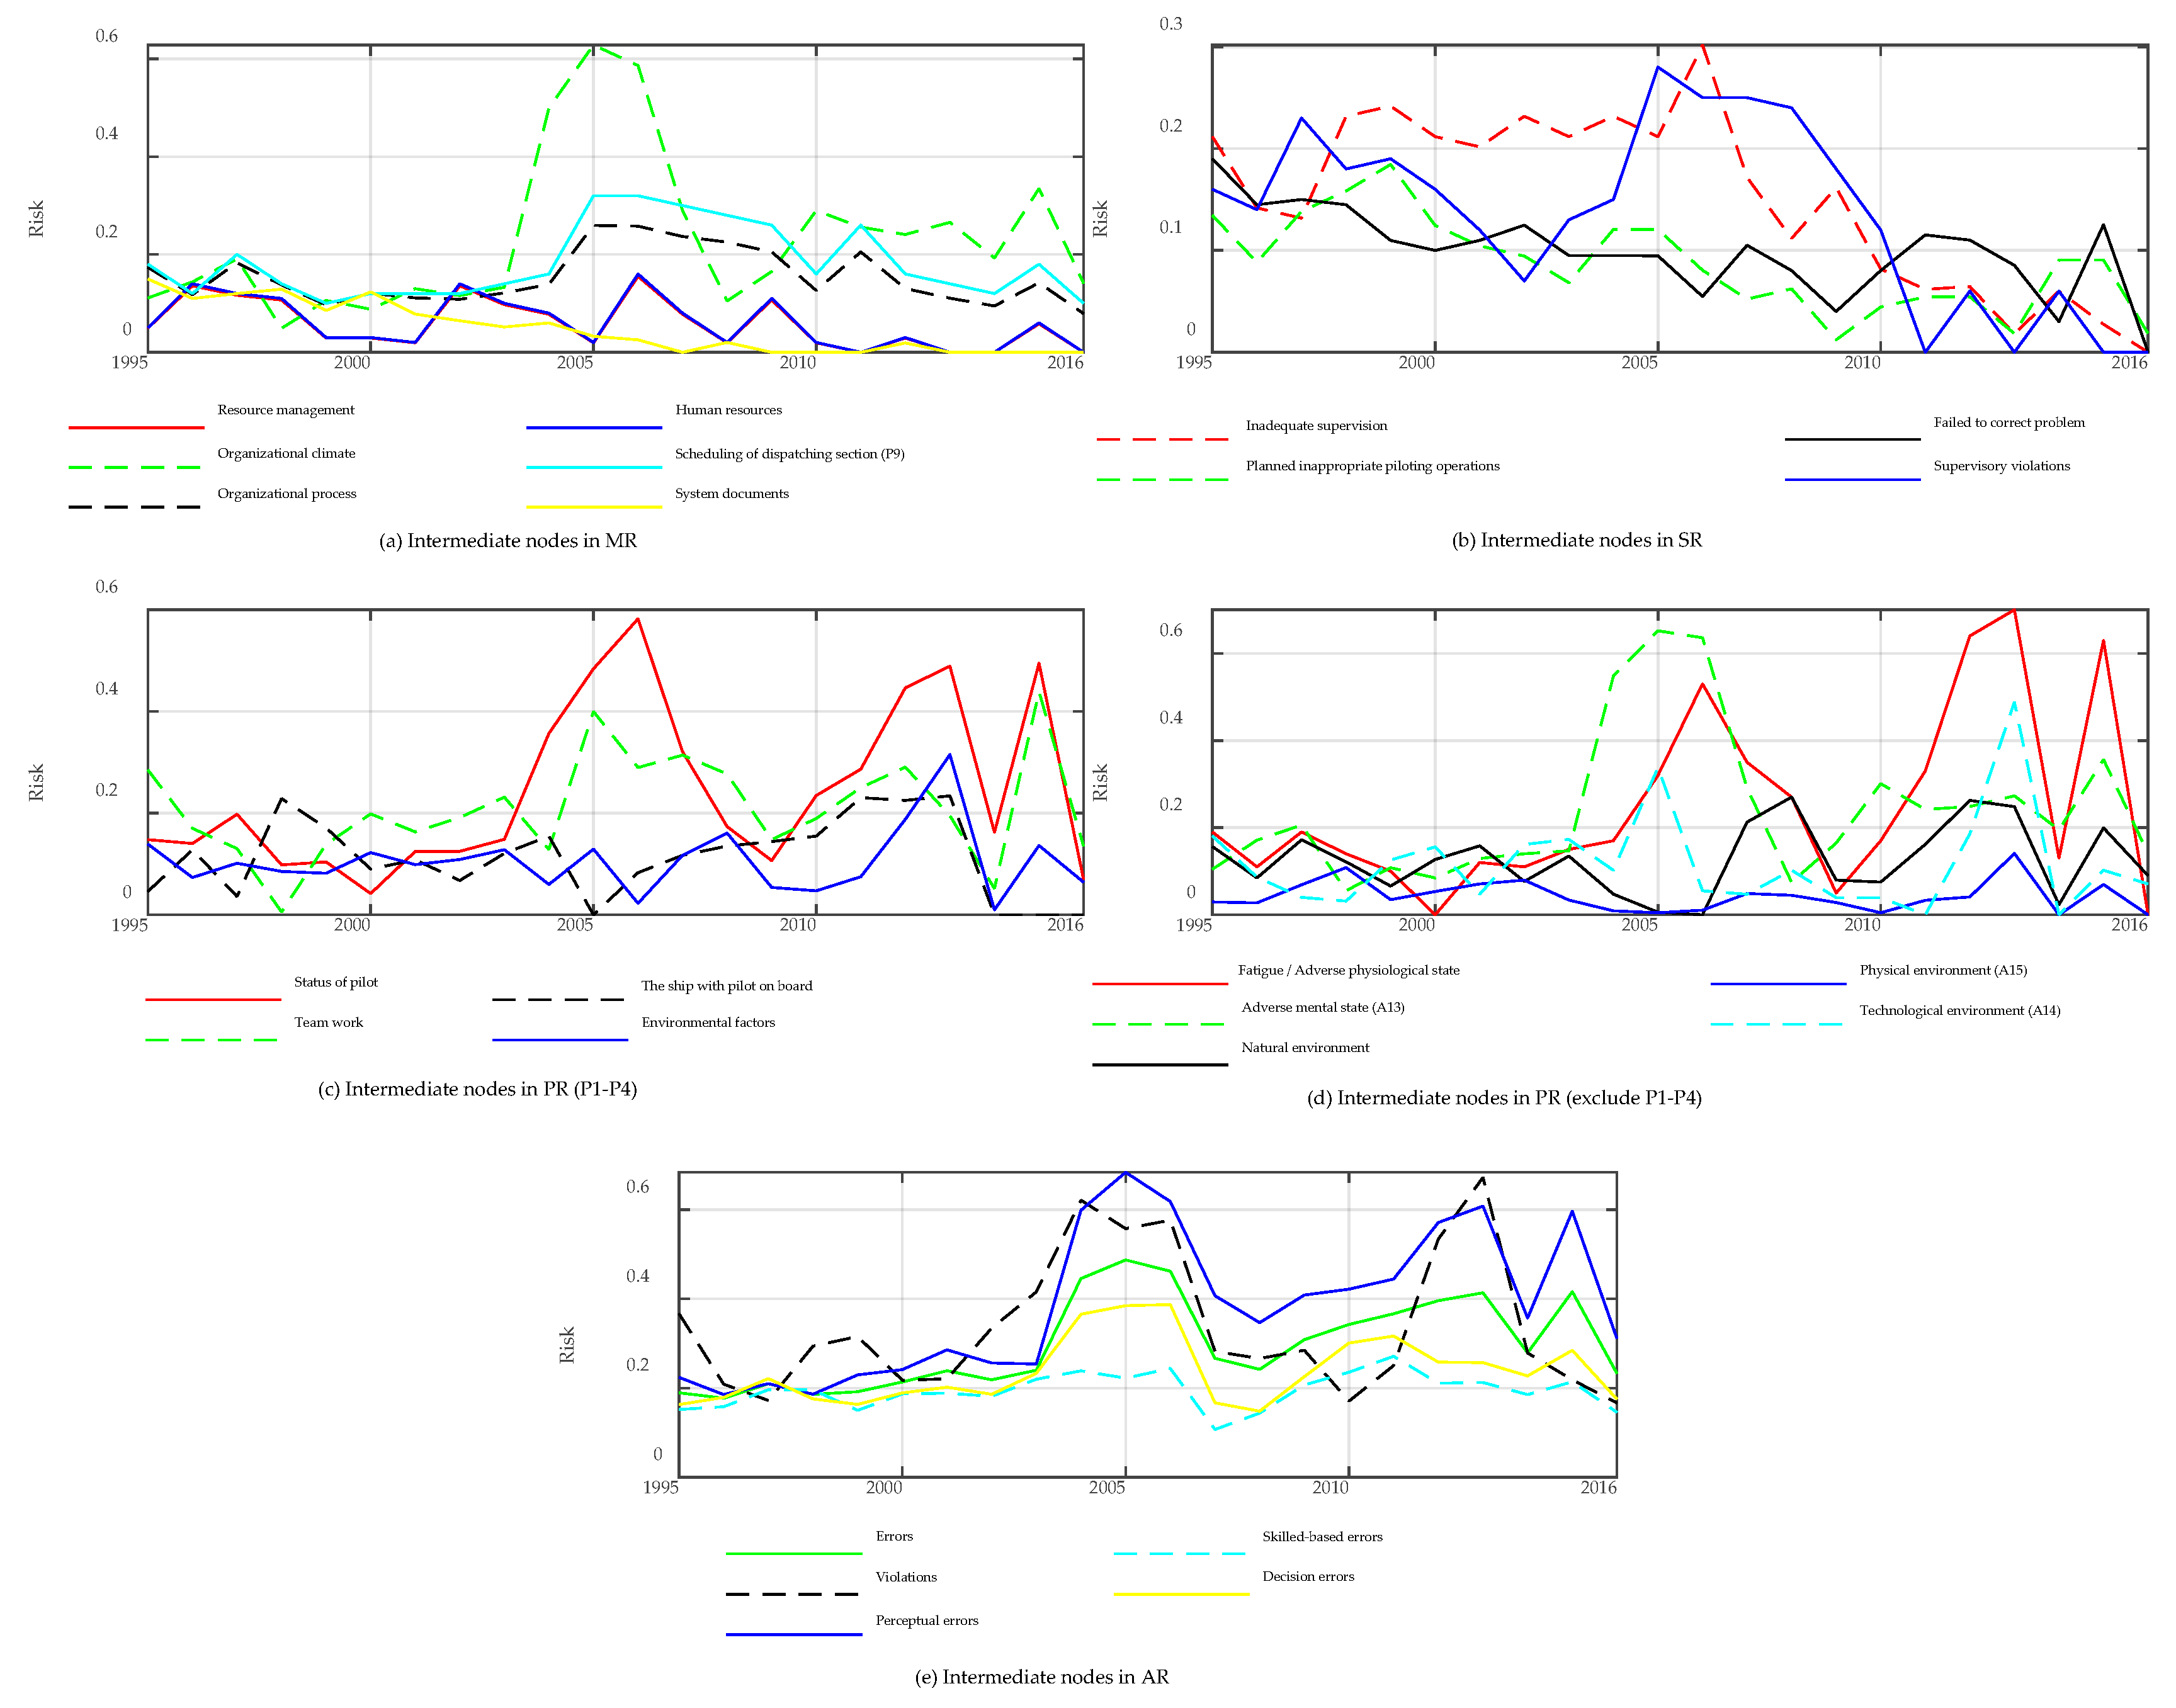
4.2.2. Risk of Upper RCEs

To determine RCE weights, many scholars used subjective methods, such as expert judgment. However, the results obtained with such methods are relatively uncertain. In this paper, the weight of the RCEs is determined by the contribution of the RCEs to the PA, the actual result from historical data.
The risk of each foundational RCE can be obtained according to Equations (3) and (4). As an example, the risk of the foundational RCEs of the coupling model V3: AR–PR is shown in Table 2.
The weight of the foundational RCEs can be obtained according to Equation (5). The example of the coupling model V3: PRAR is shown in Table 3.

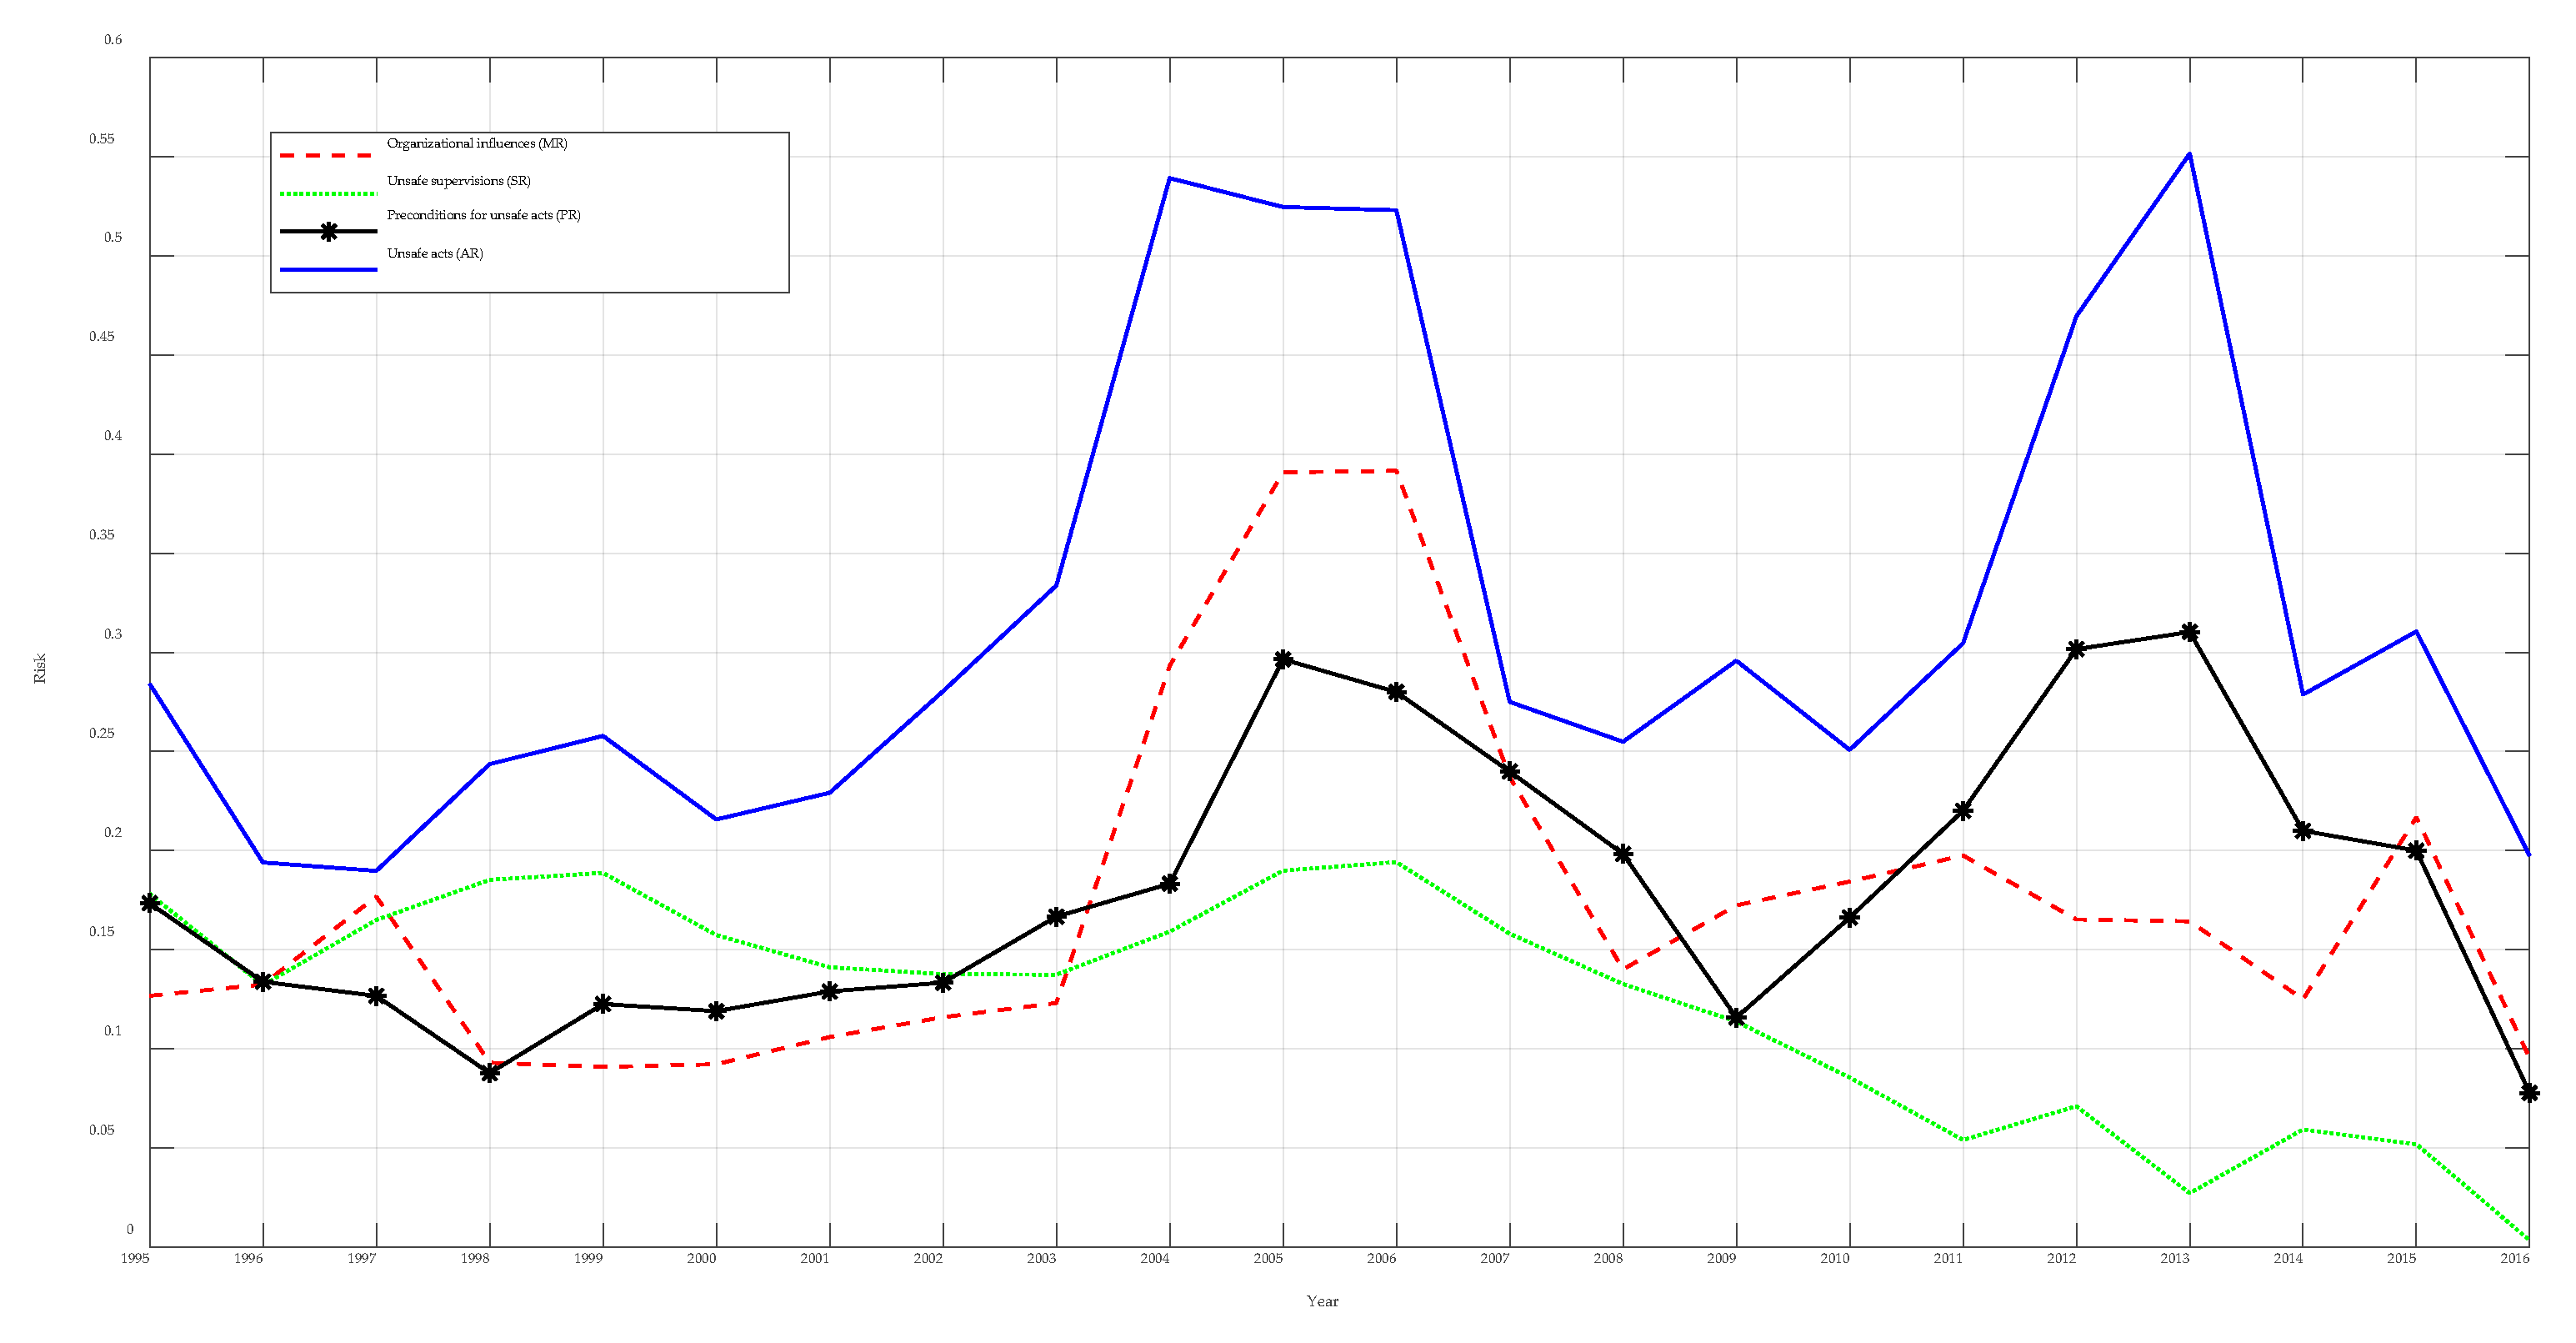
4.3. Dynamics Simulation

Using Equation (6), the risk of the upper RCEs can be obtained, and then Equation (5) can be used to calculate the weight of them.
Taking the coupling model V3: AR–PR as an example, Table 4 shows the risk and weight of the upper RCEs.
By inputting risk and weight calculated in the previous section into the simulation model established by Vensim PLE 8.0.5 and using Equation (6), the HOF risk level of HFACS in each year from 1995 to 2016 can be obtained, as shown in Figure 7.

4.4. Analysis of RCEs in Pilotage Operation

The results of the SD simulations show that the risk level of unsafe acts is the highest, with a comprehensive contribution value of 0.318, followed by precondition for unsafe acts with a value of 0.181, organizational influences 0.174, and unsafe supervisions 0.124. Figure 8 shows the trend of the overall contribution of 28 INs in pilotage.

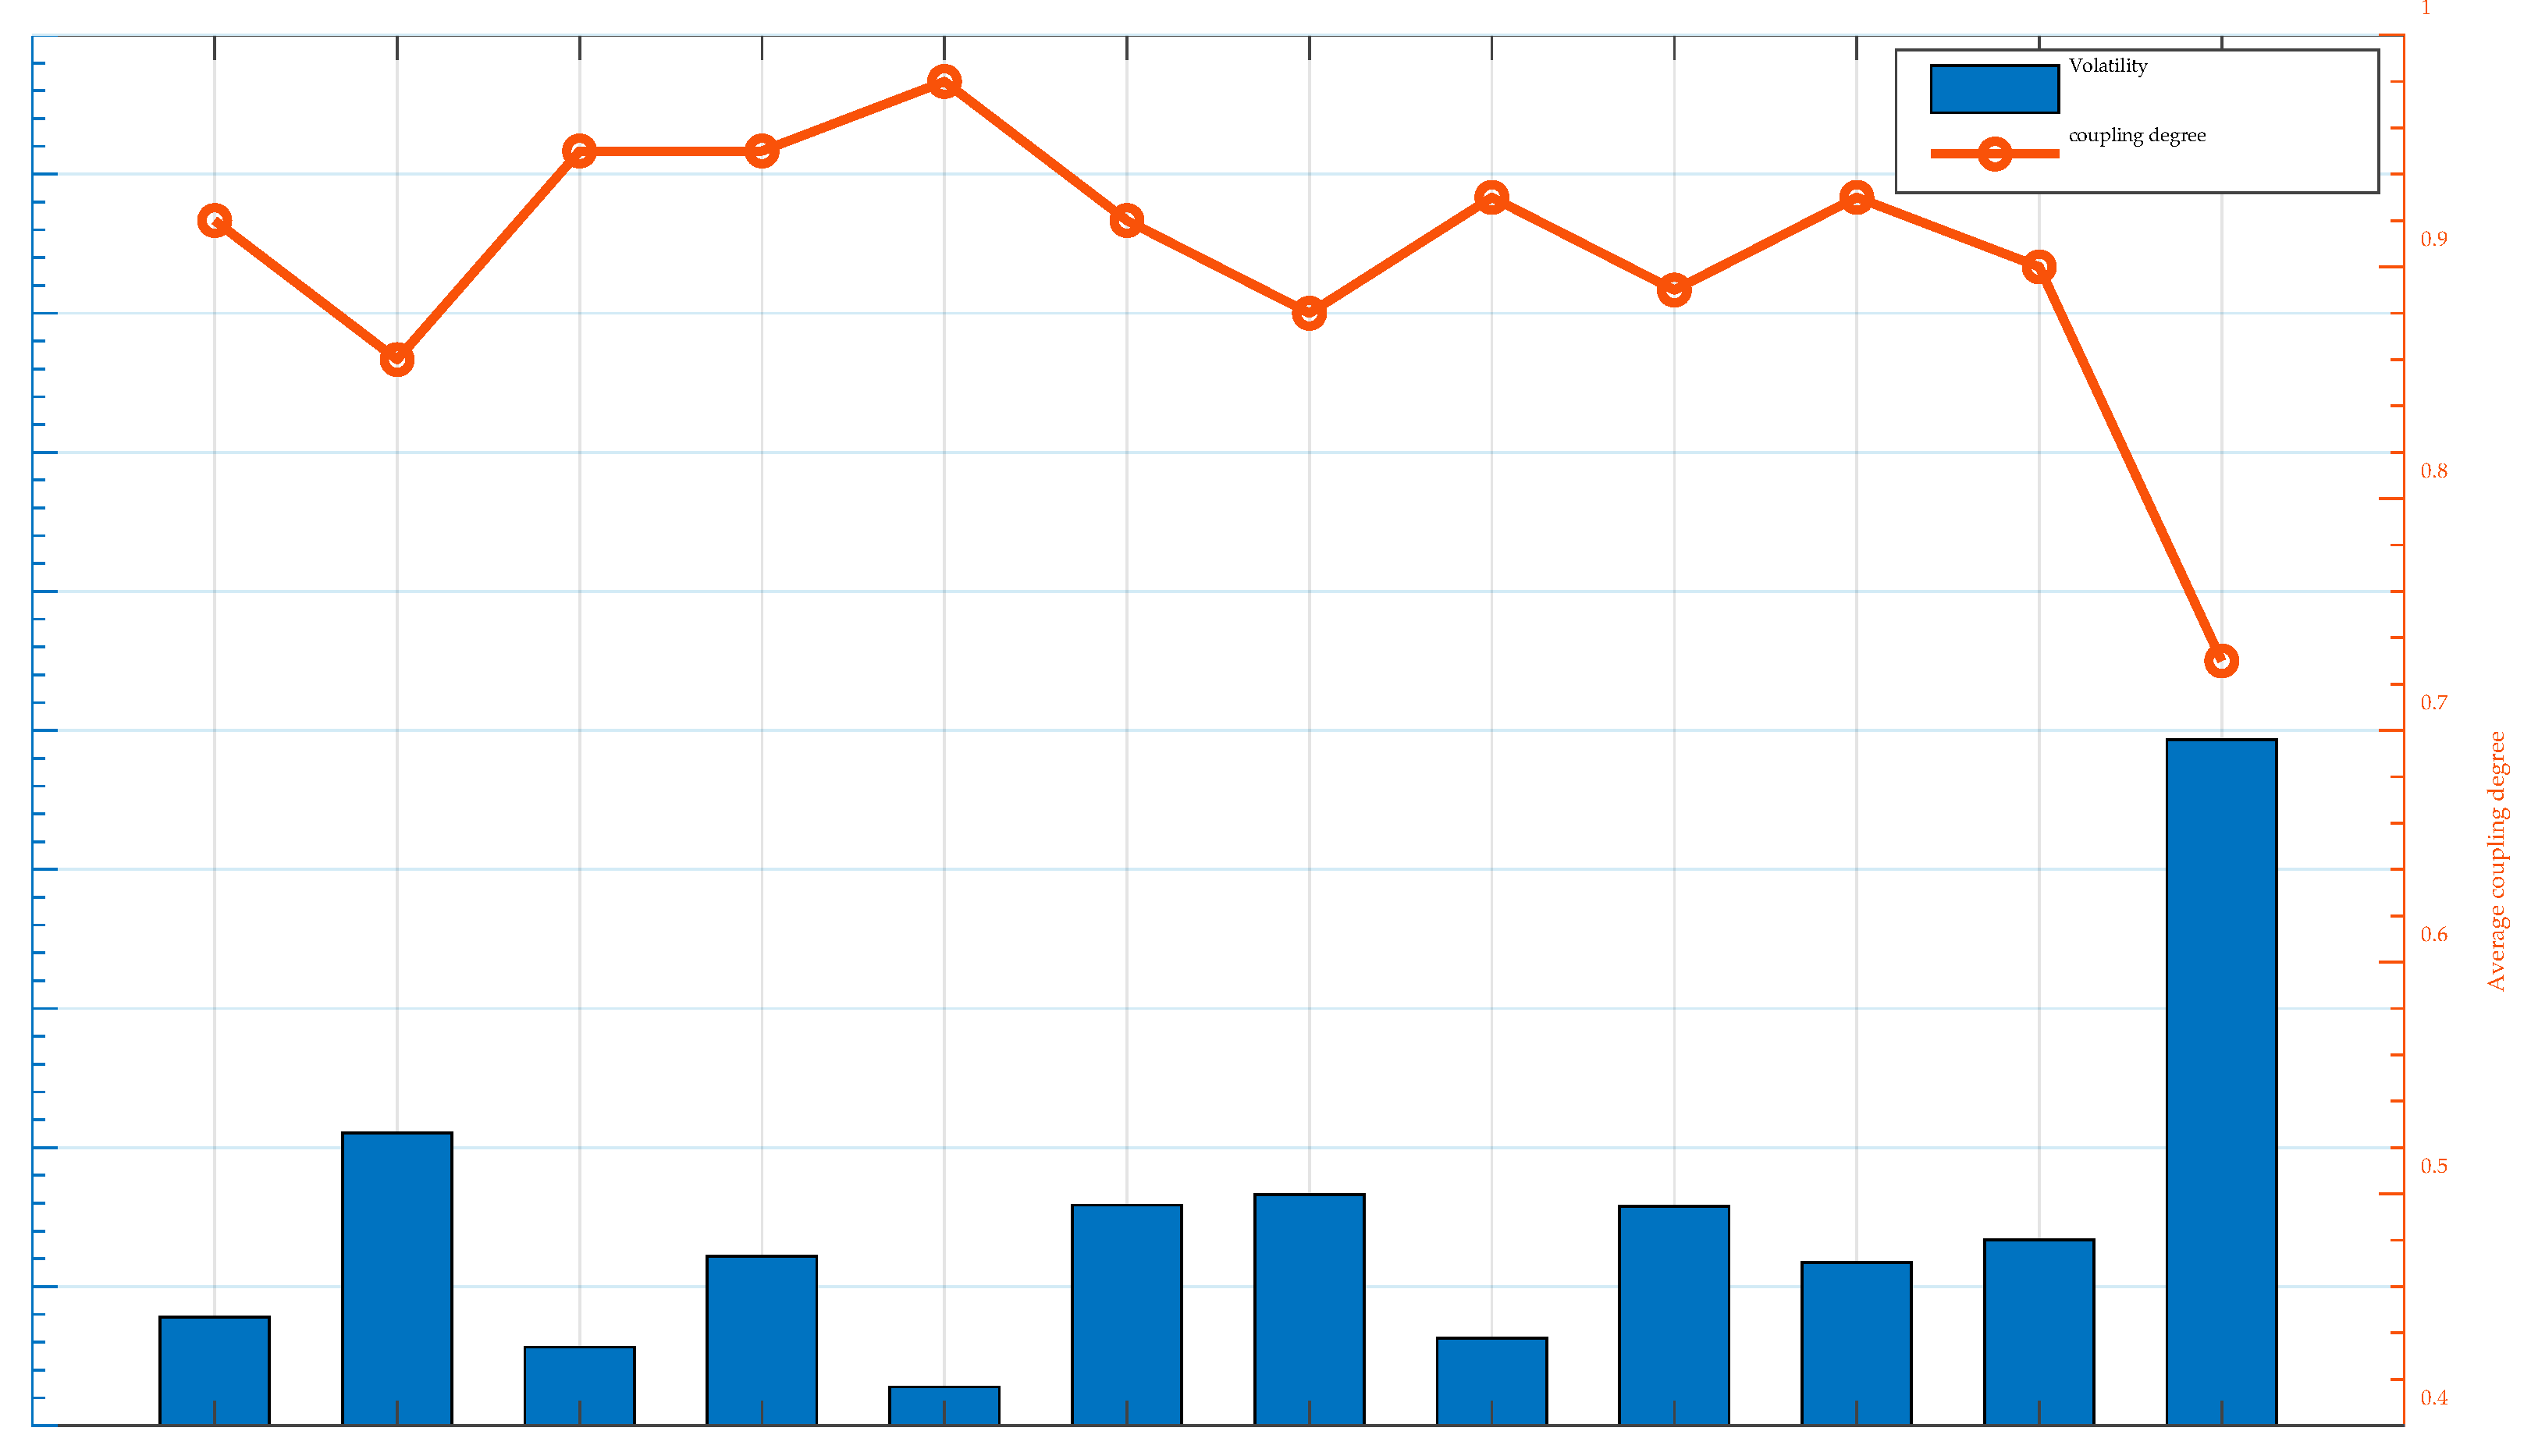
4.5. Risk Coupling and Volatility Judgment

Putting the above risk values into Equations (1) and (2), the average coupling degrees of the coupling risk systems are obtained.
In order to judge the degree of fluctuation or stability of the coupling system, a coefficient of variation (CV) method is introduced to calculate the CV of the coupling system [47]. The larger the CV is, the stronger the volatility of the coupling system is.
η = ( σ / μ ) × 100 %
where η , σ , and μ are the CV, standard deviation, and average of the coupling degree C , respectively.
The average coupling degrees and CVs are shown in Figure 9.

5. Analysis and Discussion

5.1. Risk Analysis of HOF RCEs

At the layer of unsafe acts, the factors that have a higher impact on the pilotage safety include “negligence”, “habits”, and “the experience of pilots” in “perceptual error”, “routine”, and “exceptional” in “violations”, the risk of which were 0.532, 0.469, 0.268, 0.379, and 0.281, respectively. Among them, the “experience of pilots” also affects “skilled-based errors” and “decision errors”, which shows that maritime pilotage is a practical operation industry. The pilot’s own negligence, habits, experience, and violations all directly affect the safety level of maritime pilotage.
At the layer of precondition for unsafe acts, “other ship crew” in “team work” contributed the most to the PAs, with a risk of 0.281, which is in line with the fact that collision accidents accounted for 37% of all the PAs, and that collision accidents with primary and full responsibility of other ships accounted for 68%. The risks of “personal safety awareness” in “status of pilot” and “fatigue” caused by improper scheduling are 0.290 and 0.245, respectively. “Personal safety awareness” corresponds to “negligence” in unsafe acts. “Negligence” is related to “fatigue”, which reflects the heavy workload of maritime pilotage in the Shanghai port. In fact, the pilotage intensity in the Shanghai port is very high: The monthly average number of piloted ships is 25 per pilot and the average pilotage time per ship is 7.5 h. Among the environmental factors, the natural environment contributes the most. Strangely, the effect of wind is greater than that of current and visibility, which are 0.190, 0.150, and 0.056, respectively, which is inconsistent with the traditional idea that “poor visibility has a great influence on maritime pilotage”. This may be because the pilots know that the risk of poor visibility is extremely high, which increases their safety awareness. The risk of “equipment failure” in “piloted ship” is the largest with 32 “out of control” accidents due to equipment failure.
At the layers of unsafe supervisions and organizational influences, the average risk of nearly all the RCEs are less than 0.2, indicating that while the management of the shore-based department has affected the pilots to a certain extent, in the actual pilotage the pilot has a direct bearing on the safety of the pilotage operations. The only RCE whose risk exceeds 0.2 is “personal safety awareness” caused by “organizational climate”, indicating that the safety atmosphere of the pilot station affects the pilot’s safety awareness. Then, poor safety awareness is conducive to the pilot’s negligence and indirectly affects the unsafe acts of the pilots, which leads to the accident in the end. This is an important path to accidents caused by RCEs in pilotage.
Based on the opinions solicited from seven experts from the SHPA, those RCEs with a contribution value of 0.2 or more needed special attention and immediate corrective action; those RCEs with a contribution value of 0.1–0.2 need attention; while a value below 0.1 indicates a low-risk level.

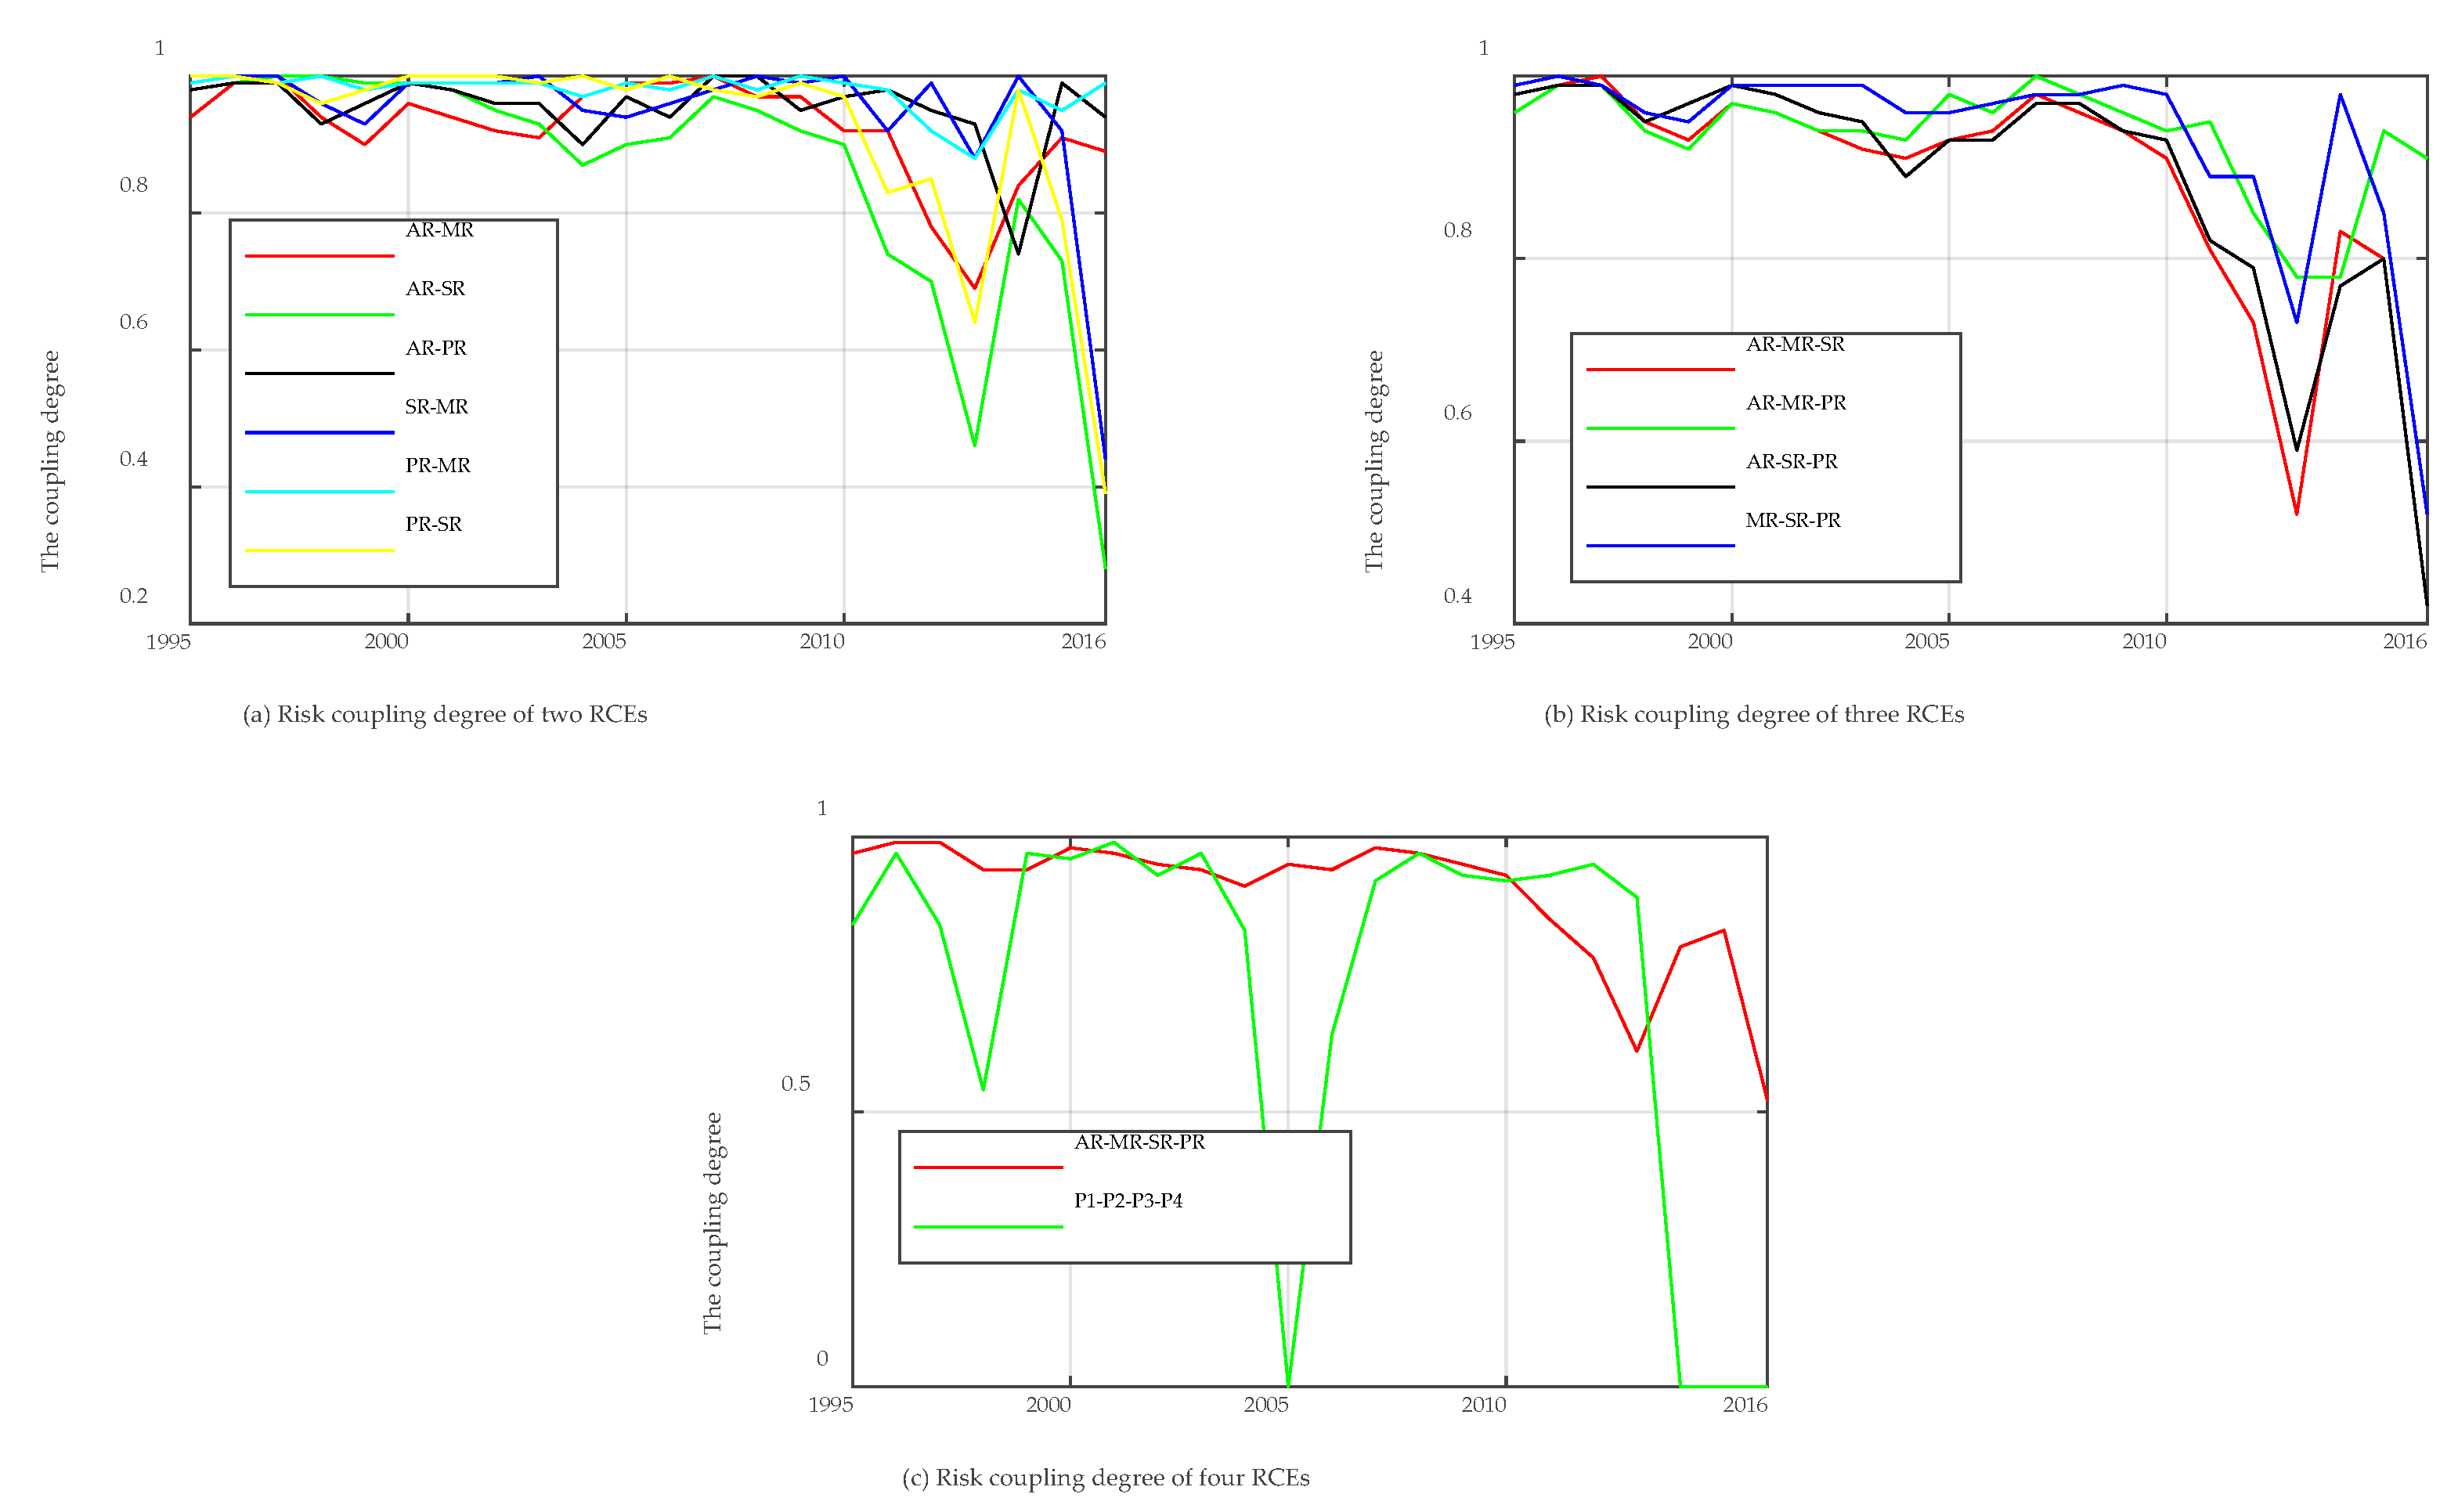
5.2. Coupling Analysis of HOF RCEs

In the two-factor coupling, it can be seen from Figure 9 that the average coupling degree of V3, V4, and V5 exceeds 0.9, but the volatility of V4 is higher. It is necessary to pay attention to the coupling risk between the layer of unsafe acts and the layer of precondition for unsafe acts. The layer of organizational influences and the precondition for unsafe acts also deserve attention because the scheduling of dispatching section, safety awareness, and personnel training in the layer of organizational influences all affect the sub-RCEs of the precondition for unsafe acts. Figure 10a indicates the dynamic changes of the two-factor coupling each year. From 2010, the coupling degree has decreased, and the volatility is becoming larger. This may be due to the fact that the number of pilotages was stabilized every year, and the rate of PAs has been decreasing. As the safety situation improves, the risk level shows some contingencies.
In the three-factor and four-factor coupling, the average coupling degrees are all around 0.9, and only V8 has a slightly better stability. In this case, special attention needs to be paid to the fact that the error chain for the occurrence of an accident has been formed, and measures must be taken to reduce the risk of a certain factor so that the coupling effect can be reduced to ensure pilotage safety.
Regarding V12, it can be found from Figure 9 and Figure 10c that the volatility is large, and the coupling degree varies greatly, because P1, P2, P3, and P4 are all sub-RCEs of the precondition for unsafe acts. The coupling degree shows a two-level appearance. Pilotage risk is mainly determined by the pilot; that is, the layer of unsafe acts.
As shown in Figure 10a,b, the coupling degree shows some volatility and a downward trend after 2010. This may indicate that with the promulgation of the STCW Convention Manila Amendment in 2010, the pilot station and shipping companies have made improvements in management, with more and more standardized management and stricter system requirements. The Manila Amendment also introduced mandatory ECDIS training, which forces shipping companies to provide more adequate training to seafarers. These improvements reduce the risk of shore-based supervisions and organizational influence.

6. Conclusions

This paper proposes a method of SD for studying the HOFs system and the coupling effect between factors. Risks at different HOF layers are calculated based on the HFACS model with historical data (the database of PAs in Shanghai port). The RCEs related to the PAs were identified and the risks were quantified. The coupling degree and volatility of different RCEs were calculated using the coupling degree function and the coefficient of variation method. This method provides a new tool to analyse and make sense of maritime pilotage accidents, especially the coupling of different factors. The model and algorithm of SD simulation reasoning and the related characteristics of risk coupling are verified using the cases of historical PAs from the SHPA.
Some conclusions can be drawn here. Firstly, the approach to risk reasoning with an HFACS-based SD simulation can effectively measure risk of RCEs for PAs. Four RCEs (negligence, habit, pilotage experience, and violations) in unsafe acts and two RCEs (teamwork and personal safety awareness) in precondition for unsafe acts contribute the most to maritime PAs and need attention from pilots and the pilot station. Furthermore, the calculation of the risk coupling degree shows that the risk coupling between different RCEs is different. Through the calculation of the volatility of the coupling degree, it is found that the randomness of the risk coupling becomes larger, and the safety situation of maritime pilotage has been improving. This may indicate that the safety regulations implemented recently have improved safety management ashore. Moreover, pilots’ unsafe acts may deserve more attention in the future so that early warning can be made to improve safety.
This research also has a number of limitations. First, the 890 PAs in the dataset include many types of accidents. Although all of them are deemed to be worthy of investigation by the SHPA, some of them are more serious and cause more damage than others. In this research, the severity and type of accidents are not considered. In future research, it may be fruitful to examine whether risk coupling effects differ in relation to severity level and/or type of accidents. This can generate new knowledge about risk management in the maritime pilotage. Second, although the PAs are real, the analysis of them cannot be completely free from subjectivity. Which PA to investigate and which information to include are a subjective decision made by the SHPA. Furthermore, it is likely that some accidents are not reported by the pilots and thus unknown to the SHPA. These PAs would not be included in the SHPA dataset. All these factors are likely to introduce some bias.

Author Contributions

Conceptualization, S.H. and X.Z.; methodology, Y.X.; software, X.Z.; validation, S.H. and X.Z.; formal analysis, Y.X and X.Z.; investigation, X.Z.; resources, S.H. and Y. X.; data curation, S.H. and X.Z.; writing—original draft preparation, X.Z.; writing—review and editing, S.H., L.T. and X.Z.; visualization, X.Z.; supervision, W.C. and L.T.; project administration, W.C.; funding acquisition, W.C. All authors have read and agreed to the published version of the manuscript.

Funding

This research received no external funding.

Acknowledgments

The authors would like to thank the Shanghai Harbour Pilot Association for its support in data provision. The authors would also like to thank the anonymous reviewers for their constructive suggestions.

Conflicts of Interest

The authors declare no conflict of interest.

References

  1. Hu, S.; Fang, Q.; Xia, H.; Xi, Y. Formal safety assessment based on relative risks model in ship navigation. Reliab. Eng. Syst. Saf. 2007, 92, 369–377. [Google Scholar] [CrossRef]
  2. Fang, Q.; Hu, S. Application of formal safety assessment to the risk assessment of the ship-pilotage. J. Harbin Eng. Univ. 2006, 27, 329–334. [Google Scholar]
  3. Xi, Y.T.; Yang, Z.L.; Fang, Q.G.; Chen, W.J.; Wang, J. A new hybrid approach to human error probability quantification–applications in maritime operations. Ocean Eng. 2017, 138, 45–54. [Google Scholar] [CrossRef]
  4. Maritime Safety Administration (MSA). Report on the Investigation of the Collision between SANCHI and CF CRYSTAL; Maritime Safety Administration (MSA): Shanghai, China, 2018.
  5. Volovoi, V.; Valenzuela, R.C. On compact modeling of coupling effects in maintenance processes of complex systems. Int. J. Eng. Sci. 2012, 59, 193–210. [Google Scholar] [CrossRef]
  6. Shanghai Harbour Pilot Association; Shanghai Maritime University. Formal Safety Assessment on Pilotage Risk in Shanghai Port (1995–2016); Shanghai Harbour Pilot Association; Shanghai Maritime University: Shanghai, China, 2018. [Google Scholar]
  7. Hetherington, C.; Flin, R.; Mearns, K. Safety in shipping: The human element. J. Saf. Res. 2006, 37, 401–411. [Google Scholar] [CrossRef] [PubMed]
  8. Manuele, F.A. Reviewing Heinrich: Dislodging two myths from the practice of safety. Prof. Saf. 2011, 56, 52–61. [Google Scholar]
  9. Cooper, S.; Ramey-Smith, A.; Wreathall, J.; Parry, G. A Technique for Human Error Analysis (ATHEANA); Nuclear Regulatory Commission: Rockville, MD, USA, 1996.
  10. Marseguerra, M.; Zio, E.; Librizzi, M. Quantitative developments in the cognitive reliability and error analysis method (CREAM) for the assessment of human performance. Ann. Nucl. Energy 2006, 33, 894–910. [Google Scholar] [CrossRef]
  11. Li, P.; Chen, G.; Dai, L.; Zhang, L. A fuzzy Bayesian network approach to improve the quantification of organizational influences in HRA frameworks. Saf. Sci. 2012, 50, 1569–1583. [Google Scholar] [CrossRef]
  12. Sotiralis, P.; Ventikos, N.P.; Hamann, R.; Golyshev, P.; Teixeira, A. Incorporation of human factors into ship collision risk models focusing on human centred design aspects. Reliab. Eng. Syst. Saf. 2016, 156, 210–227. [Google Scholar] [CrossRef]
  13. Edwards, E. Man and Machine: Systems for Safety. In Proceedings of British Airline Pilots Association Technical Symposium; British Airline Pilots Association: London, UK, 1972; pp. 21–36. [Google Scholar]
  14. Hawkins, F. Human Factors education in European air transport operations. In Breakdown in Human Adaptation to ‘Stress’; Springer: Berlin/Heidelberg, Germany, 1984; pp. 329–362. [Google Scholar]
  15. Kawano, R. Steps Toward the Realization of “Human-Centered Systems”-An Overview of the Human Factors Activities at TEPCO. In Proceedings of the 1997 IEEE Sixth Conference on Human Factors and Power Plants, 1997.’Global Perspectives of Human Factors in Power Generation’, Orlando, FL, USA, 8–13 June 1997; pp. 27–32. [Google Scholar]
  16. Chang, Y.; Wang, Y. Significant human risk factors in aircraft maintenance technicians. Saf. Sci. 2010, 48, 54–62. [Google Scholar] [CrossRef]
  17. Salmon, P.M.; Cornelissen, M.; Trotter, M.J. Systems-based accident analysis methods: A comparison of Accimap, HFACS, and STAMP. Saf. Sci. 2012, 50, 1158–1170. [Google Scholar] [CrossRef]
  18. Shappell, S.A.; Wiegmann, D.A. The Human Factors Analysis and Classification System—HFACS; The National Technical Information Service: Springfield, VI, USA, 2000.
  19. Daramola, A.Y. An investigation of air accidents in Nigeria using the Human Factors Analysis and Classification System (HFACS) framework. J. Air. Transp. Manag. 2014, 35, 39–50. [Google Scholar] [CrossRef]
  20. Zhou, T.; Zhang, J.; Baasansuren, D. A hybrid HFACS-BN model for analysis of Mongolian aviation professionals’ awareness of human factors related to aviation safety. Sustainability. 2018, 10, 4522. [Google Scholar] [CrossRef] [Green Version]
  21. Xia, N.; Zou, P.X.; Liu, X.; Wang, X.; Zhu, R. A hybrid BN-HFACS model for predicting safety performance in construction projects. Saf. Sci. 2018, 101, 332–343. [Google Scholar] [CrossRef]
  22. Li, C.; Tang, T.; Chatzimichailidou, M.M.; Jun, G.T.; Waterson, P. A hybrid human and organisational analysis method for railway accidents based on STAMP-HFACS and human information processing. Appl. Ergon. 2019, 79, 122–142. [Google Scholar] [CrossRef] [Green Version]
  23. Zhan, Q.; Zheng, W.; Zhao, B. A hybrid human and organizational analysis method for railway accidents based on HFACS-Railway Accidents (HFACS-RAs). Saf. Sci. 2017, 91, 232–250. [Google Scholar] [CrossRef]
  24. Zhang, M.; Zhang, D.; Goerlandt, F.; Yan, X.; Kujala, P. Use of HFACS and fault tree model for collision risk factors analysis of icebreaker assistance in ice-covered waters. Saf. Sci. 2019, 111, 128–143. [Google Scholar] [CrossRef]
  25. Yıldırım, U.; Başar, E.; Uğurlu, Ö. Assessment of collisions and grounding accidents with human factors analysis and classification system (HFACS) and statistical methods. Saf. Sci. 2019, 119, 412–425. [Google Scholar] [CrossRef]
  26. Uğurlu, Ö.; Yıldız, S.; Loughney, S.; Wang, J. Modified human factor analysis and classification system for passenger vessel accidents (HFACS-PV). Ocean Eng. 2018, 161, 47–61. [Google Scholar] [CrossRef] [Green Version]
  27. Theophilus, S.C.; Esenowo, V.N.; Arewa, A.O.; Ifelebuegu, A.O.; Nnadi, E.O.; Mbanaso, F.U. Human factors analysis and classification system for the oil and gas industry (HFACS-OGI). Reliab. Eng. Syst. Saf. 2017, 167, 168–176. [Google Scholar] [CrossRef]
  28. Liu, R.; Cheng, W.; Yu, Y.; Xu, Q.; Jiang, A.; Lv, T. An impacting factors analysis of miners' unsafe acts based on HFACS-CM and SEM. Process. Saf. Environ. 2019, 122, 221–231. [Google Scholar] [CrossRef]
  29. Lenné, M.G.; Salmon, P.M.; Liu, C.C.; Trotter, M. A systems approach to accident causation in mining: An application of the HFACS method. Accid. Anal. Prev. 2012, 48, 111–117. [Google Scholar] [CrossRef] [PubMed]
  30. Hu, S.; Li, Z.; Xi, Y.; Gu, X.; Zhang, X. Path Analysis of Causal Factors Influencing Marine Traffic Accident via Structural Equation Numerical Modeling. J. Mar. Sci. Eng. 2019, 7, 96. [Google Scholar] [CrossRef] [Green Version]
  31. Sapateiro, C.; Baloian Tataryan, N.; Antunes, P.; Zurita Alarcón, G. Developing a mobile collaborative tool for business continuity management. J. Univ. Comput. Sci. 2011, 17, 164–182. [Google Scholar]
  32. Dai, T.; Wang, H. The human factors analysis of marine accidents based on Goal Structure Notion. In Proceedings of the IEEE International Conference on Industrial Engineering and Engineering Management, Singapore, 6–9 December 2011; pp. 1883–1887. [Google Scholar]
  33. Underwood, P.; Waterson, P. Systemic accident analysis: Examining the gap between research and practice. Accid. Anal. Prev. 2013, 55, 154–164. [Google Scholar] [CrossRef] [Green Version]
  34. Underwood, P.; Waterson, P. Systems thinking, the Swiss Cheese Model and accident analysis: A comparative systemic analysis of the Grayrigg train derailment using the ATSB, AcciMap and STAMP models. Accid. Anal. Prev. 2014, 68, 75–94. [Google Scholar] [CrossRef] [Green Version]
  35. Rasmussen, J. Risk management in a dynamic society: A modelling problem. Saf. Sci. 1997, 27, 183–213. [Google Scholar] [CrossRef]
  36. Leveson, N. A new accident model for engineering safer systems. Saf. Sci. 2004, 42, 237–270. [Google Scholar] [CrossRef] [Green Version]
  37. Peng, M.; Peng, Y.; Chen, H. Post-seismic supply chain risk management: A system dynamics disruption analysis approach for inventory and logistics planning. Comput. Oper. Res. 2014, 42, 14–24. [Google Scholar] [CrossRef]
  38. Hollnagel, E. FRAM: The Functional Resonance Analysis Method: Modelling Complex Socio-Technical Systems; CRC Press: Boca Raton, FL, USA, 2017. [Google Scholar]
  39. Maritime Safety Committee (MSC); Marine Environment Protection Committee (MEPC). Revised Guidelines for Formal Safety Assessment (FSA); International Maritime Organization (IMO): London, UK, 2018. [Google Scholar]
  40. Wang, R.; Cheng, J.; Zhu, Y.; Lu, P. Evaluation on the coupling coordination of resources and environment carrying capacity in Chinese mining economic zones. Resour. Policy 2017, 53, 20–25. [Google Scholar] [CrossRef]
  41. Liu, W.-W.; Sun, R.; Li, Q. Measurement of coupling degree between regional knowledge innovation and technological innovation: An empirical analysis based on provincial panel data in China during 2010–2014. J. Interdiscip. Mathematics 2017, 20, 125–139. [Google Scholar] [CrossRef]
  42. Chauvin, C.; Lardjane, S.; Morel, G.; Clostermann, J.P.; Langard, B. Human and organisational factors in maritime accidents: Analysis of collisions at sea using the HFACS. Accid. Anal. Prev. 2013, 59, 26–37. [Google Scholar] [CrossRef]
  43. Chen, S.; Wall, A.; Davies, P.; Yang, Z.; Wang, J.; Chou, Y. A Human and Organisational Factors (HOFs) analysis method for marine casualties using HFACS-Maritime Accidents (HFACS-MA). Saf. Sci. 2013, 60, 105–114. [Google Scholar] [CrossRef]
  44. Kwak, D.; Heo, J.; Park, S.; Seo, S.; Kim, J. Energy-efficient design and optimization of boil-off gas (BOG) re-liquefaction process for liquefied natural gas (LNG)-fuelled ship. Energy 2018, 148, 915–929. [Google Scholar] [CrossRef]
  45. Jeong, B.; Lee, B.S.; Zhou, P.; Ha, S.-m. Evaluation of safety exclusion zone for LNG bunkering station on LNG-fuelled ships. J. Mar. Eng. Technol. 2017, 16, 121–144. [Google Scholar] [CrossRef] [Green Version]
  46. Suraji, A.; Duff, A.R.; Peckitt, S.J. Development of causal model of construction accident causation. J. Constr. Eng. Manag. 2001, 127, 337–344. [Google Scholar] [CrossRef]
  47. Brown, C.E. Coefficient of variation. In Applied Multivariate Statistics in Geohydrology and Related Sciences; Springer: Berlin/Heidelberg, Germany, 1998; pp. 155–157. [Google Scholar]
Figure 1. Ship pilotage number and accident risk in the Shanghai port from 1995 to 2019.
Jmse 08 00144 g001
Figure 2. Research framework.
Jmse 08 00144 g002
Figure 3. Causal relationship flow graph in the complex human factors analysis and classification system (HFACS) system.
Jmse 08 00144 g003
Figure 4. Causal relationship system dynamics (SD) model of maritime pilotage based on the HFACS model (Note: When an RCE appears the second time, the software producing this diagram will automatically put it in <…>).
Jmse 08 00144 g004
Figure 5. Coupling model flow diagram, for example, V3: AR–PR.
Jmse 08 00144 g005
Figure 6. The risk of 38 leaf nodes (including 4 overlapping leaf nodes) from 1995 to 2016.
Jmse 08 00144 g006
Figure 7. HOF risk level of HFACS from 1995 to 2016.
Jmse 08 00144 g007
Figure 8. The risk of 28 intermediate nodes (including four overlapping intermediate nodes (INs)) from 1995 to 2016.
Jmse 08 00144 g008
Figure 9. Average coupling degree and CV of the coupling systems. Note: V1: AR–MR, V2: AR–SR, V3: AR–PR, V4: SR–MR, V5: PR–MR, V6: PR–SR, V7: AR–MR–SR, V8: AR–MR–PR, V9: AR–SR–PR, V10: MR–SR–PR; V11: AR–MR–SR–PR, V12: P1–P2–P3–P4, respectively.
Jmse 08 00144 g009
Figure 10. The coupling degrees.
Jmse 08 00144 g010
Table 1. Node system of the human-organizational factors (HOF) risk coupling model in pilotage.
Nodes No. in HFACSComponents and MeaningNodes No. in CategoryNodes No. in HFACSComponents and MeaningNodes No. in Category
MRRisk level for organizational influencesRN1P10Own ship crewLN14
M1Resource managementIN1P11Other ship crewLN15
M2Organizational climateIN2P12Tug crew and stevedoresLN16
M3Organizational processIN3P13Structural defectLN17
M4Human resourcesIN4P14Equipment failure (A10)LN18
M5Equipment resourcesLN1P15Goods factorLN19
M6Training (A12/P7)LN2P16Natural environmentIN17
M7Personal safety awareness (P8)LN3P17Physical environment (A15)IN18
M8Organizational safety awarenessLN4P18Technological environment (A14)IN19
M9Scheduling of dispatching section (P9)IN5P19VisibilityLN20
M10System documentsIN6P20WindLN21
M11Pilot procedureLN5P21CurrentLN22
M12Super norm operationLN6P22Channel curvatureLN23
SRRisk level of supervisingRN2P23Narrow waterwayLN24
S1Inadequate supervisionIN7P24Restricted water circulationLN25
S2Planned inappropriate piloting operationsIN8P25Depth limit of waterwayLN26
S3Failed to correct problemIN9P26ObstaclesLN27
S4Supervisory violationsIN10P27Navigation aids failureLN28
S5Dispatching supervisionLN7P28High navigation densityLN29
S6Monitoring and commanding of VTSLN8ARRisk level of unsafe actsRN4
S7Pilotage plan unreviewed/improperly auditedLN9A1ErrorsIN20
S8Improper planningLN10A2ViolationsIN21
S9Improper plan implementationLN11A3Perceptual errorsIN22
S10Similar problems without corrective measuresLN12A4Skilled-based errorsIN23
S11Inadequate safety measuresLN13A5Decision errorsIN24
PRRisk level of preconditions for unsafe actsRN3A6ExceptionalLN30
P1Status of pilotIN11A7RoutineLN31
P2TeamworkIN12A8NegligenceLN32
P3The ship with pilot on boardIN13A9HabitsLN33
P4Environmental factorsIN14A10Equipment failure (P14)LN18
P5Fatigue/Adverse physiological stateIN15A11Experience of pilotsLN34
P6Adverse mental state (A13)IN16A12Training (M6/P7)LN2
P7Training (M6/A12)LN2A13Adverse mental state (P6)IN16
P8Personal safety awareness (M7)LN3A14Technological environment (P18)IN19
P9Scheduling of dispatching section (M9)IN5A15Physical environment (P17)IN18
Table 2. The risk of the foundational risk causal elements (RCEs) of the coupling model V3: AR–PR.
Foundational RCEsP7P8P9P10P11P12P13P14P15P19
r i ¯ 0.0590.2110.1810.0610.2810.0980.0120.1230.0010.056
Foundational RCEsP20P21P22P23P24P25P26P27P28A6
r i ¯ 0.1900.1500.1120.0290.0000.0620.0300.0090.1460.281
Foundational RCEsA7A8A9A10A11
→A3
A12
→A3
A11
→A4
A12
→A4
A11
→A5
A13
r i ¯ 0.3790.5320.4690.1230.2680.0590.2680.0590.2680.177
Table 3. The weight of the foundational RCEs of the coupling model V3: AR–PR.
Foundational RCEsP7P8P9P10P11P12P13P14P15P19
wi0.2200.7801.0000.1390.6380.2230.0900.9000.0100.140
Foundational RCEsP20P21P22P23P24P25P26P27P28A6
wi0.4810.3780.4820.1230.0000.2660.1280.0560.9440.425
Foundational RCEsA7A8A9A10A11
→A3
A12
→A3
A11
→A4
A12
→A4
A11
→A5
A13
wi0.5750.3350.2950.0770.1690.0370.6620.1470.4150.274
Table 4. The risk and weight of the upper RCEs of the coupling model V3: AR–PR.
Upper RCEsPRP1P2P3P4P5P6P16P17P18
ut0.1680.1790.2090.1120.1330.1810.1770.1560.0780.138
wt0.2100.2830.3310.1760.2100.5060.4940.4200.2080.372
Upper RCEsARA1A2A3A4→A1A5A14A15A4→A5--
ut0.2860.2950.3370.3850.2010.2220.1380.0780.201--
wt--0.3690.4220.4770.2490.2750.0870.1920.311--

