Article

Evaluation of a Dynamic Bioremediation System for the Removal of Metal Ions and Toxic Dyes Using Sargassum Spp.

by
J. Luis López-Miranda
1,*,
Rodolfo Silva
2,
Gustavo A. Molina
1,
Rodrigo Esparza
1,
A. R. Hernandez-Martinez
1,
J. Hernández-Carteño
3 and
Miriam Estévez
1,*
1
Centro de Física Aplicada y Tecnología Avanzada, Universidad Nacional Autónoma de México, Boulevard Juriquilla 3001, Querétaro 76230, Mexico
2
Instituto de Ingeniería, Universidad Nacional Autónoma de México, Edificio 17, Ciudad Universitaria, Coyoacán 04510, Mexico
3
Departamento de Ingeniería Ambiental, Universidad Politécnica del Estado de Guerrero, Carretera Federal Iguala Taxco Km 105 Puente Campuzano, Taxco de Alarcón Guerrero 40321, Mexico
*
Authors to whom correspondence should be addressed.
J. Mar. Sci. Eng. 2020, 8(11), 899; https://doi.org/10.3390/jmse8110899
Submission received: 11 October 2020 / Revised: 1 November 2020 / Accepted: 3 November 2020 / Published: 11 November 2020
(This article belongs to the Special Issue Ocean Conservation and Pollution in an Era of Blue Economy)

Abstract

:
This work presents the results obtained in the design and manufacture of a simple, economic and ecological filter based on Sargassum spp. (Sspp), consisting of the species S. natans and S. fluitans, for the elimination of organic and inorganic toxic substances. The main objective is to make use of Sspp, as the massive amounts of this alga arriving at the Mexican Caribbean coast have caused serious problems over recent years. The toxic substances treated were organic dyes (methyl blue, methyl orange and methyl red) and the metal ion, lead (II). To obtain optimal removal conditions, grinding of the Sspp used, its mass and humidity were evaluated. In the design of the filter the area, flow rate and the number of layers were evaluated. Removal rates of almost 100%, 65% and 25% were obtained for methylene blue, methyl red and methyl orange respectively, and in the case of lead (II), values up to 95% were obtained. After the tests, the Sspp was characterized, using Fourier Transform Infrared (FTIR) spectroscopy and scanning electron microscopy, showing the presence of the dyes and the ionic species. These results demonstrate the efficiency of the dynamic Sspp-based filtration system proposed, which can be industrially scaled for the treatment of water contaminated with these kinds of substances.

Graphical Abstract

1. Introduction

The discharge of untreated, or partially treated, wastewaters and industrial effluents into natural ecosystems can create serious issues in the environment as we know it, since these are a source of esthetic degradation, eutrophication and perturbations in aquatic life [1,2,3,4]. Many water pollutants, including organic compounds, especially synthetic azo dyes (–N=N–), come from industries such as pharmaceuticals, food, laboratory printing and textiles [5,6,7]. Most of these are highly carcinogenic, even in minimal amounts [8]. Therefore, the elimination of such pollutants is of great importance to society.
Azo dyes contain molecular aromatic complexes, which makes them difficult to degrade. They are very stable to ultraviolet radiation, oxidizing agents, solar light irradiation and biochemical treatment (e.g., aerobic digestion) [8,9]. Methyl red and orange are carcinogenic water-soluble azo dyes that are widely used in textile dyeing, manufacturing, printing, tattooing, cosmetics, plastics and food industries, as well as in research laboratories, because of their chemical stability and versatility [10,11,12]. Methylene blue is also often discharged into the wastewater from these industries. Categorized in the cationic azo dye group (thiazine) [13], while methylene blue is not very hazardous, various negative effects on living beings have been reported [14]. These include respiratory problems, nausea, jaundice, skin irritation, mental confusion, cyanosis, profuse sweating, convulsions, dyspnea, tachycardia, tissue necrosis and methemoglobinemia [15].
Toxic metals are also often found in wastewater. Of these, lead is considered one of the most toxic. Lead (Pb) is easily accumulated in the human body, mainly in the bones, and can cause neurotoxicity [16]. Inorganic lead compounds are classified as probably carcinogenic to humans (Group 2A) by the International Agency for Research on Cancer (IARC) [17]. Safe, efficient, inexpensive removal of these dangerous dyes and metals, such as Pb from industrial wastewater, is an urgent matter. To make such a process environmentally friendly is a further requisite if we are to avoid adding to the already dangerous cocktail of contaminants in our environment.
Water can be purified by a variety of methods, including coagulation, flocculation, ozonation, reverse osmosis and adsorption [18]. Biosorption (the ability of a non-living organism to allow the passive removal of different substances through its capture/binding in aqueous solution) is considered promising for removing toxic elements from industrial effluents as it is a safe, simple and cost-competitive process [19,20]. Algae have been found to be suitable biosorbents because of their rapid and easy growth and their wide availability [21]. Algal cell walls offer a host of functional groups since they are highly porous and easily permeable to small ionic species [22,23], including amino, carboxyl, sulfate, phosphate and imidazoles, associated with polysaccharides (alginate and fucoidan), alginic acid and proteins for binding various pollutants [24,25]. In this sense, filtration systems can be classified into static and dynamic. A static system is one in which there is no change in its variables over time. On the other hand, in a dynamic system, some or several variables are time-dependent. In the specific case of a filtration system, a static system is one in which the pollutant and biosorbent are in a container, with continuous stirring, without changes in flow or concentration over time. In a dynamic system, such as the one on which this work is based, the pollutant in aqueous solution is in constant flow, so the characteristics and properties of the filter medium are different and depend directly on time.
In recent years, a brown alga has become extremely noticeable in many coastal areas. Sargassum spp. (Sspp) (muticum, glaucescens, filipendula, etc.) is so prevalent that it has become an environmental disaster in some places. From 2011, coasts of the Mexican Caribbean, other areas of the Caribbean and Africa, have faced a series of threats from the massive influx of this seaweed [26,27,28,29,30]. Several marine ecosystems are dying (e.g., corals, seagrasses) due to the reduction of light, which affects photosynthesis, and the increased pH of the water (reduction of calcium carbonate saturation), which is endangering the existence of several species. In a cascading process, ecosystem services are being lost. In addition, socioeconomic impacts, such as the loss of tourism and the costs of disposal, as well as health impacts (the production of dangerous gasses in the decomposition process), are taking a toll in many coastal regions. In 2018, an estimated 20 million m3 of Sspp arrived along the Mexican Caribbean coast, costing hoteliers and the government several million USD for its urgent removal from the beaches. There is, therefore, an economic reason to make use of the Sspp in the effective and environmentally friendly removal of contaminants from aquatic systems, through the process of biosorption. As well as being an inexpensive process, removing the Sspp from the coast would also be beneficial to the local community.
The main component responsible for metal sorption in seaweeds is alginate, which is present in the form of a gel in its cell walls. This material is easily penetrable by small metal cations, which makes seaweeds suitable biosorbents, with a high sorption potential. It is reported [31] that the biosorption process of methylene blue by Sspp is due to electrostatic attractions, n–π interactions and hydrogen bonds with methylene blue nitrogen.
In this work, the biosorption of lead, methyl orange, methyl red and methylene blue via a simple dynamic filtration system is evaluated. Two species of Sargassum were used, S. natans and S. fluitans, collected on the Mexican Caribbean coast. Results obtained in this work show that the Sargassum species S. natans and S. fluitans have a high adsorption capacity for the azo dyes, in particular for methylene blue, and for lead (II) cations. Sspp also requires a short time to reach equilibrium, suggesting that it could be used as a low-cost biosorbent in industrial-scale, efficient and economic wastewater treatments.

2. Materials and Methods

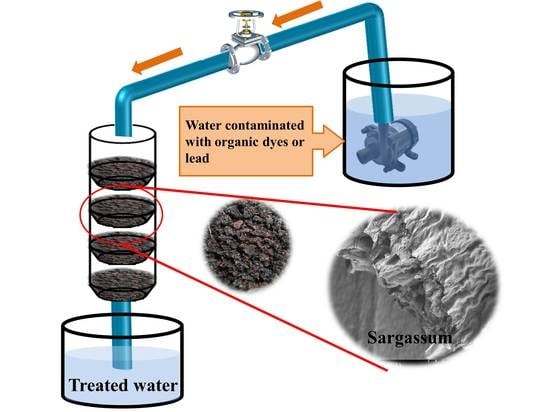
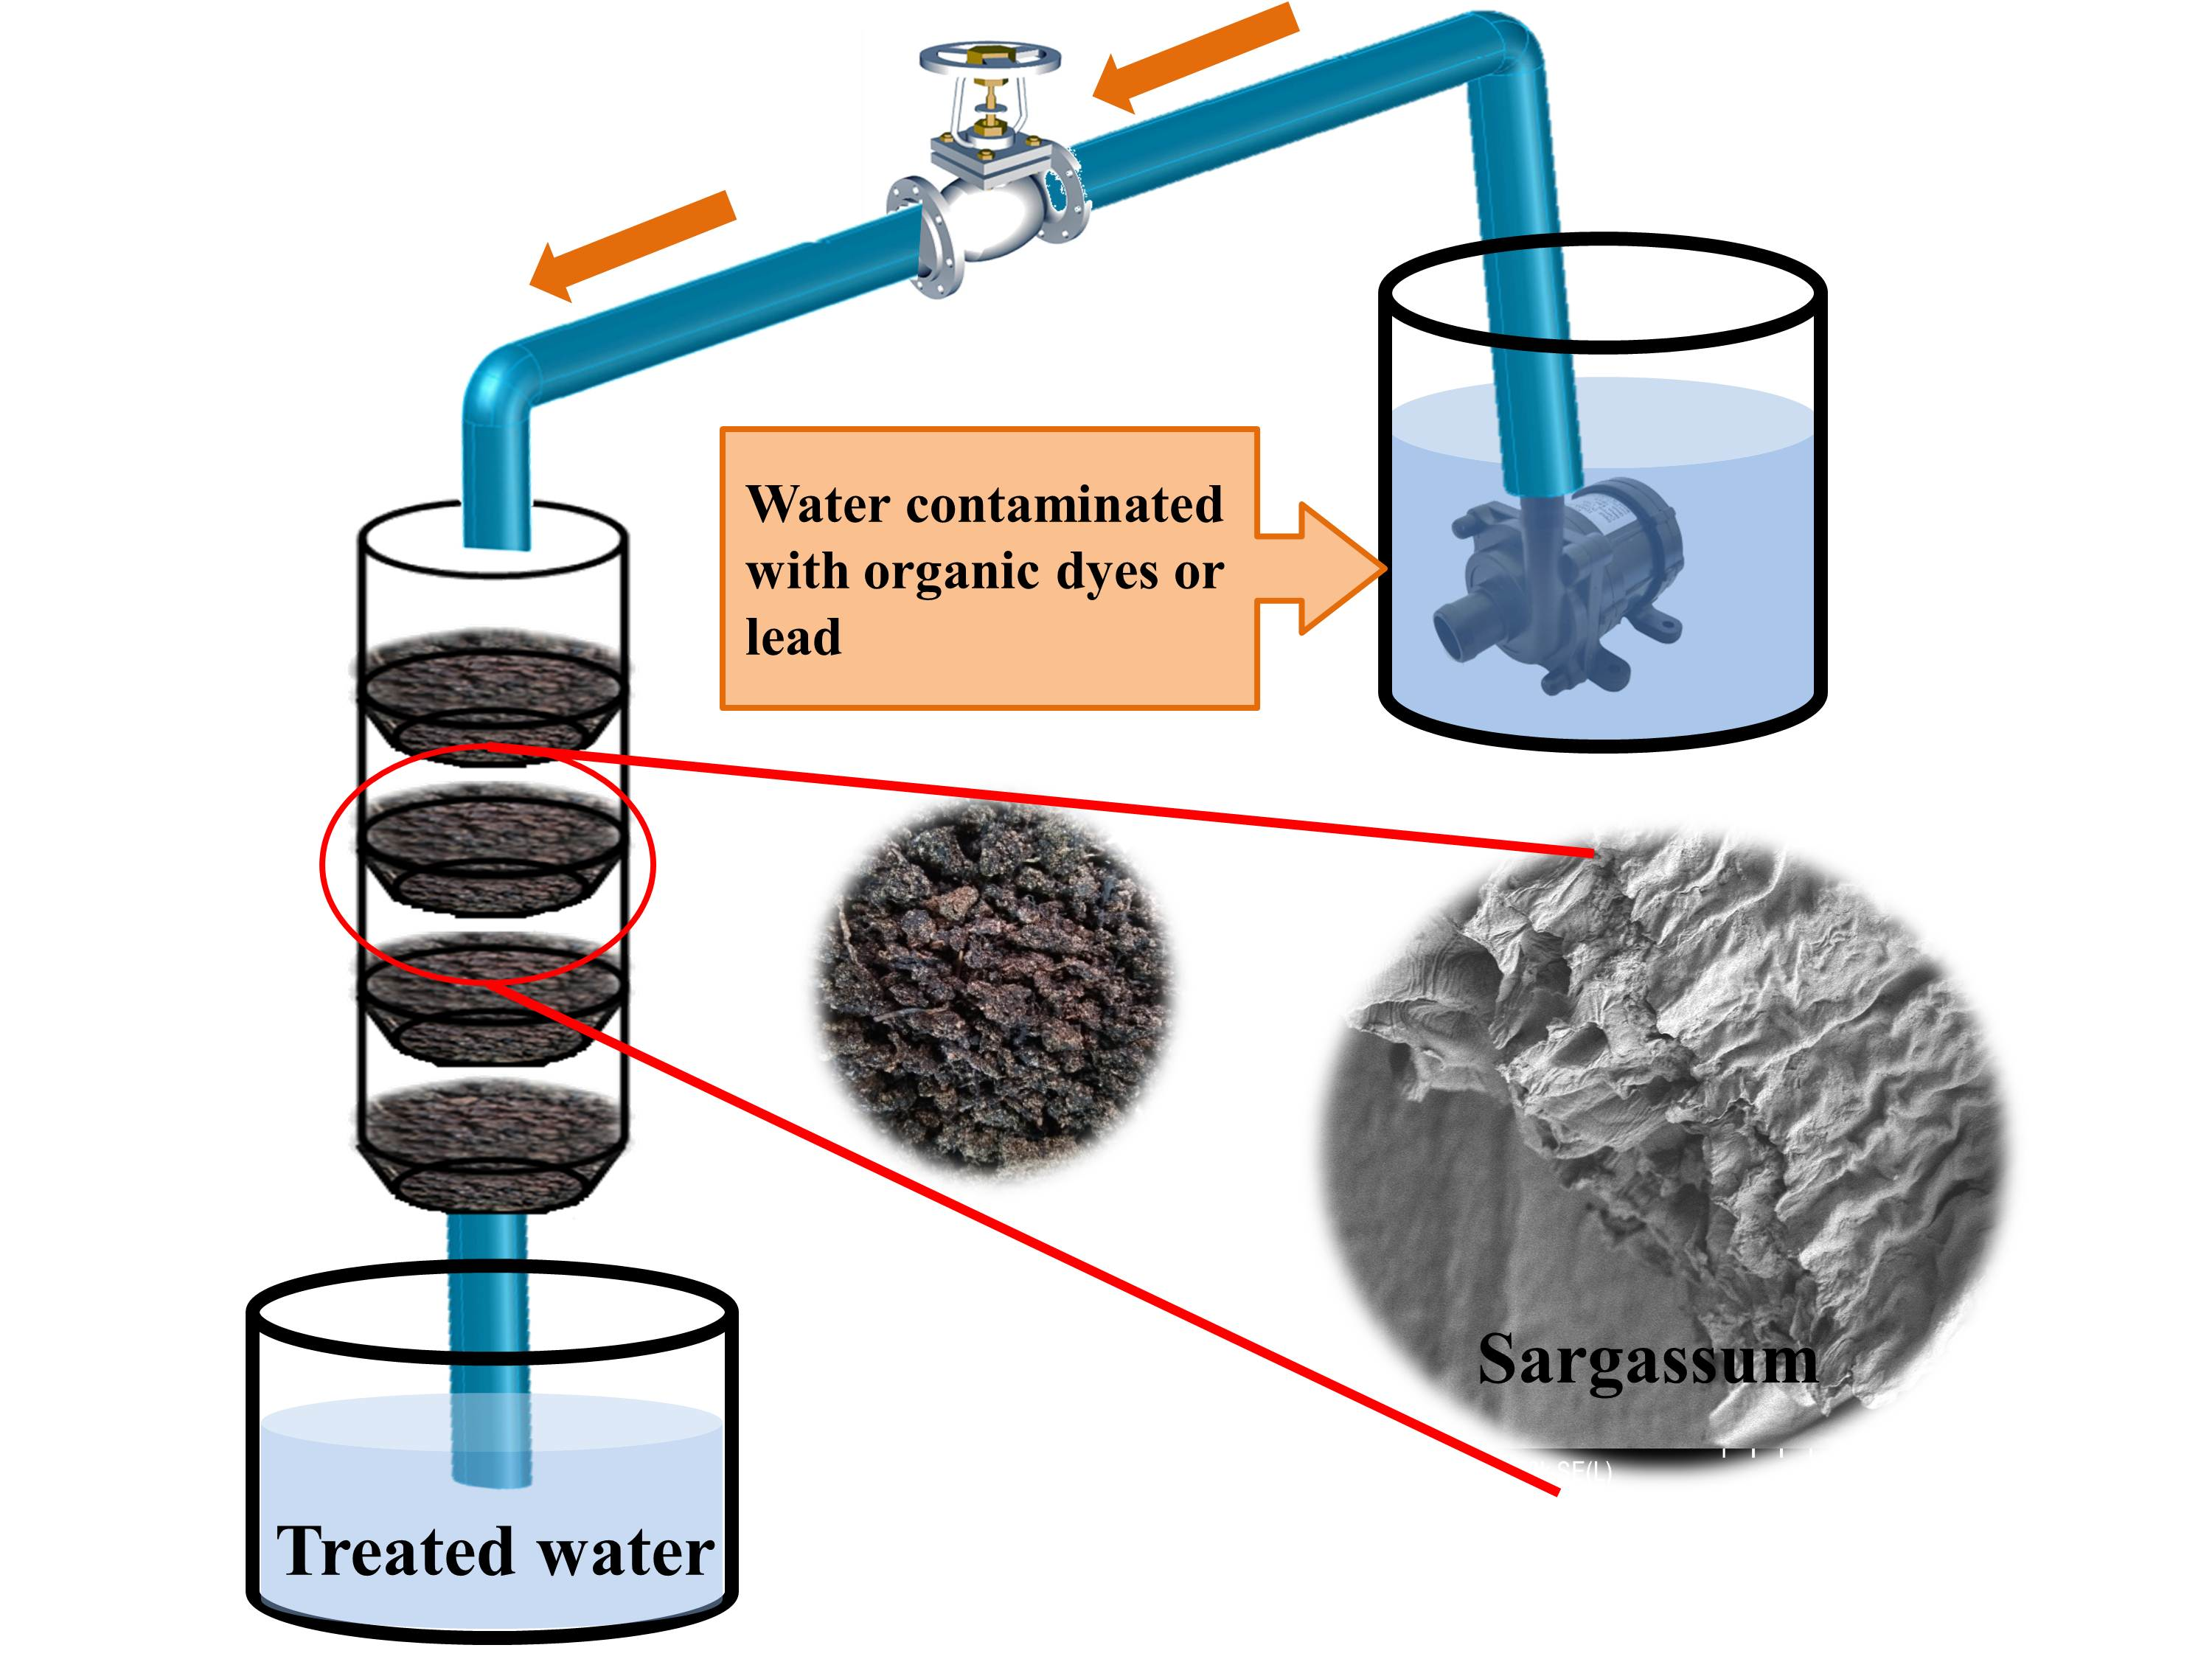
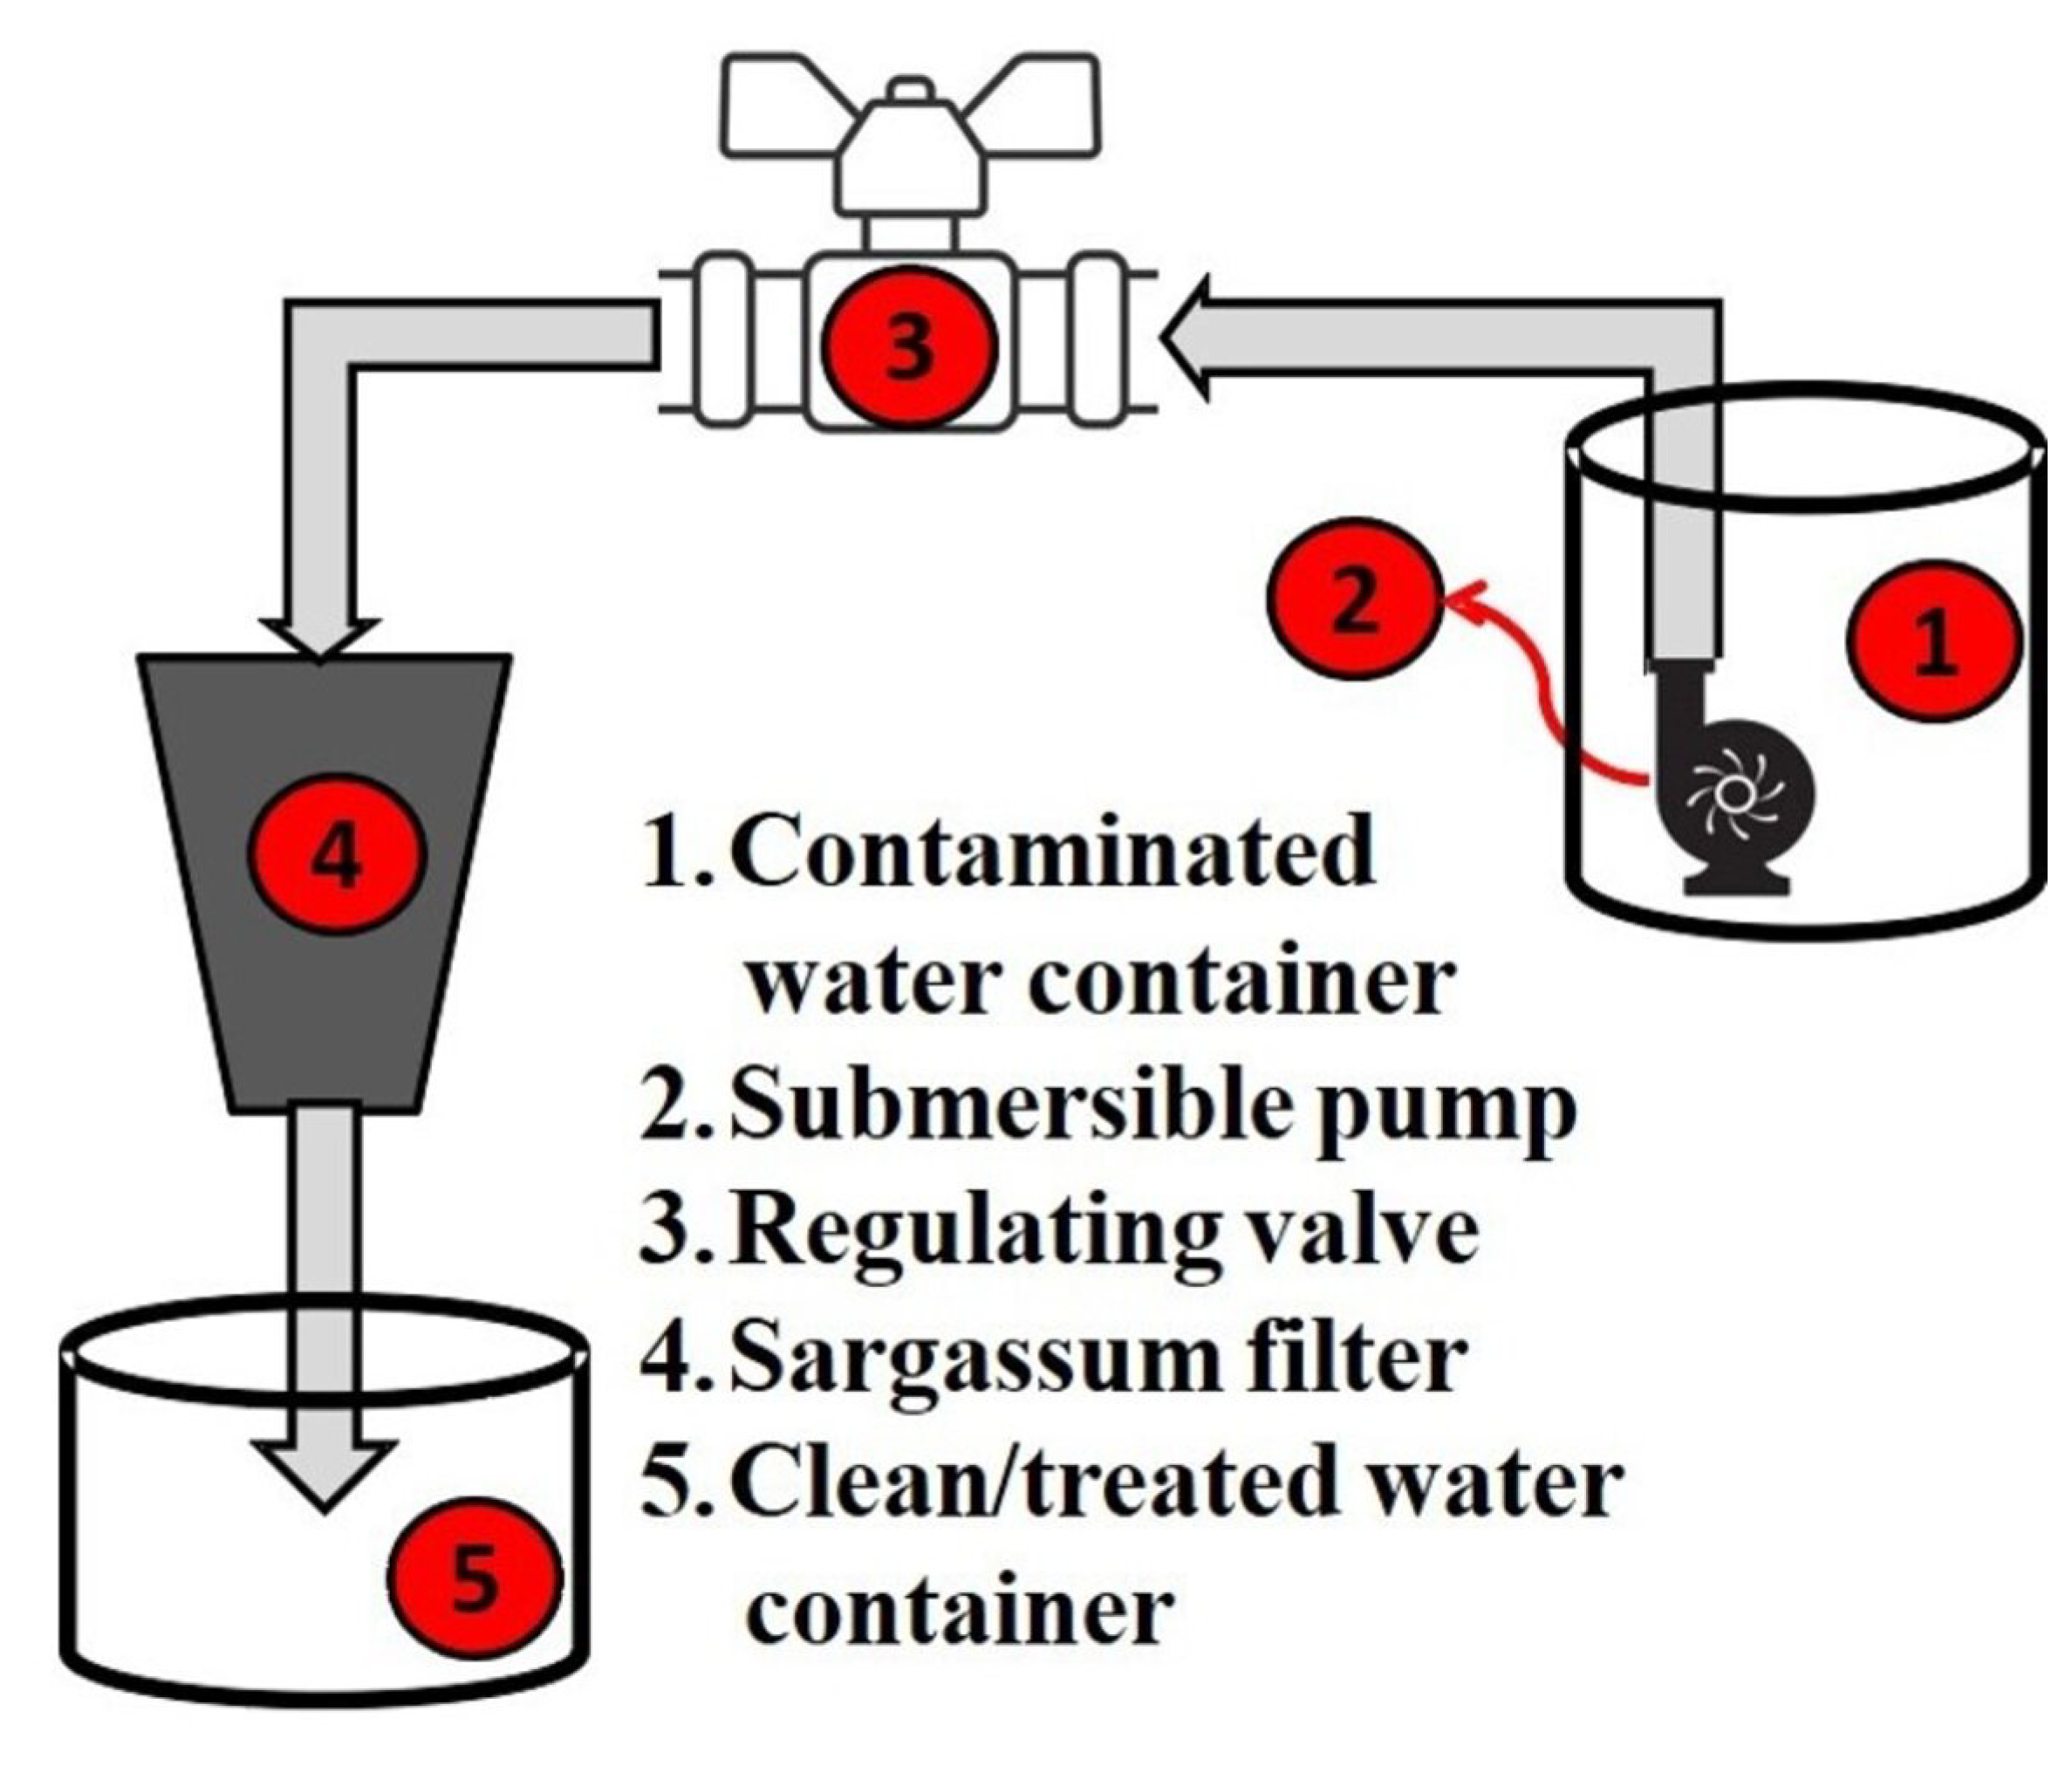
2.1. Filter System based on Sargassum spp. (Sspp)

To obtain the optimum filtration system, various parameters were evaluated, such as chemical treatment, grinding and the mass of the Sspp used, filter diameter, the number of layers, the flow rate of the solution and the degree of humidity of the Sspp. All these parameters were evaluated only with methylene blue. The best result obtained in each experiment was selected to establish the optimal conditions. From these results, the filtration system for the investigation was assembled (Scheme 1). Therefore, the removal of methyl orange, methyl red and lead was carried out using the same filtration system established from the methylene blue results. Contaminated water is placed in a container, which has a submersible pump. This liquid is pumped through a regulating valve, which controls the water flow entering the filter. The filter consists of four layers, each containing 1.75 g of Sspp. The purified liquid is collected in another container. Every 10 min, this container was replaced by another and the volume of liquid removed at each time interval was collected for subsequent Ultraviolet-Visible (UV-Vis) analysis. In this way, 8 separate samples were obtained, since the duration of each experiment was 80 min.

2.2. Materials

In this project, Sargassum ssp., collected from the Mexican Caribbean coast, were used. Sargassum spp. consists of a mixture of two different species: Sargassum fluitans (Figure 1a) and Sargassum natans (Figure 1b). Methylene blue, methyl orange and methyl red, all reagent grade, were employed as dyes. The lead ion removal was evaluated using lead nitrate (Pb (NO3)2, American Chemical Society (ACS) reagent grade ≥ 99%). All reagents were purchased from Sigma-Aldrich. All solutions were prepared using deionized water.

2.2.1. Chemical Treatment of the Sargassum spp. (Sspp)

After collection, the Sspp was washed several times with tap water, and then with distilled water, to remove any litter and impurities. Then, it was dried in the sun for 48 h to remove all moisture. The Sspp was then subjected to chemical treatment with the aim of increasing the number of carboxylic groups. This was achieved through the oxidation of β glycosidic linkage, which reduces molecular weight and deproteinate and increases reducing sugar of the sample. This may increase the ability to chelate different toxic elements or substances [32]. For this process, 20 g of clean, dry Sspp was mixed with 1 L of a 10% solution of hydrogen peroxide (H2O2). The mixture was stirred magnetically for two hours. Finally, the chemically treated Sargassum sp. (CT-Sspp) was dried in an amber vacuum desiccator for 48 h and stored for later use.

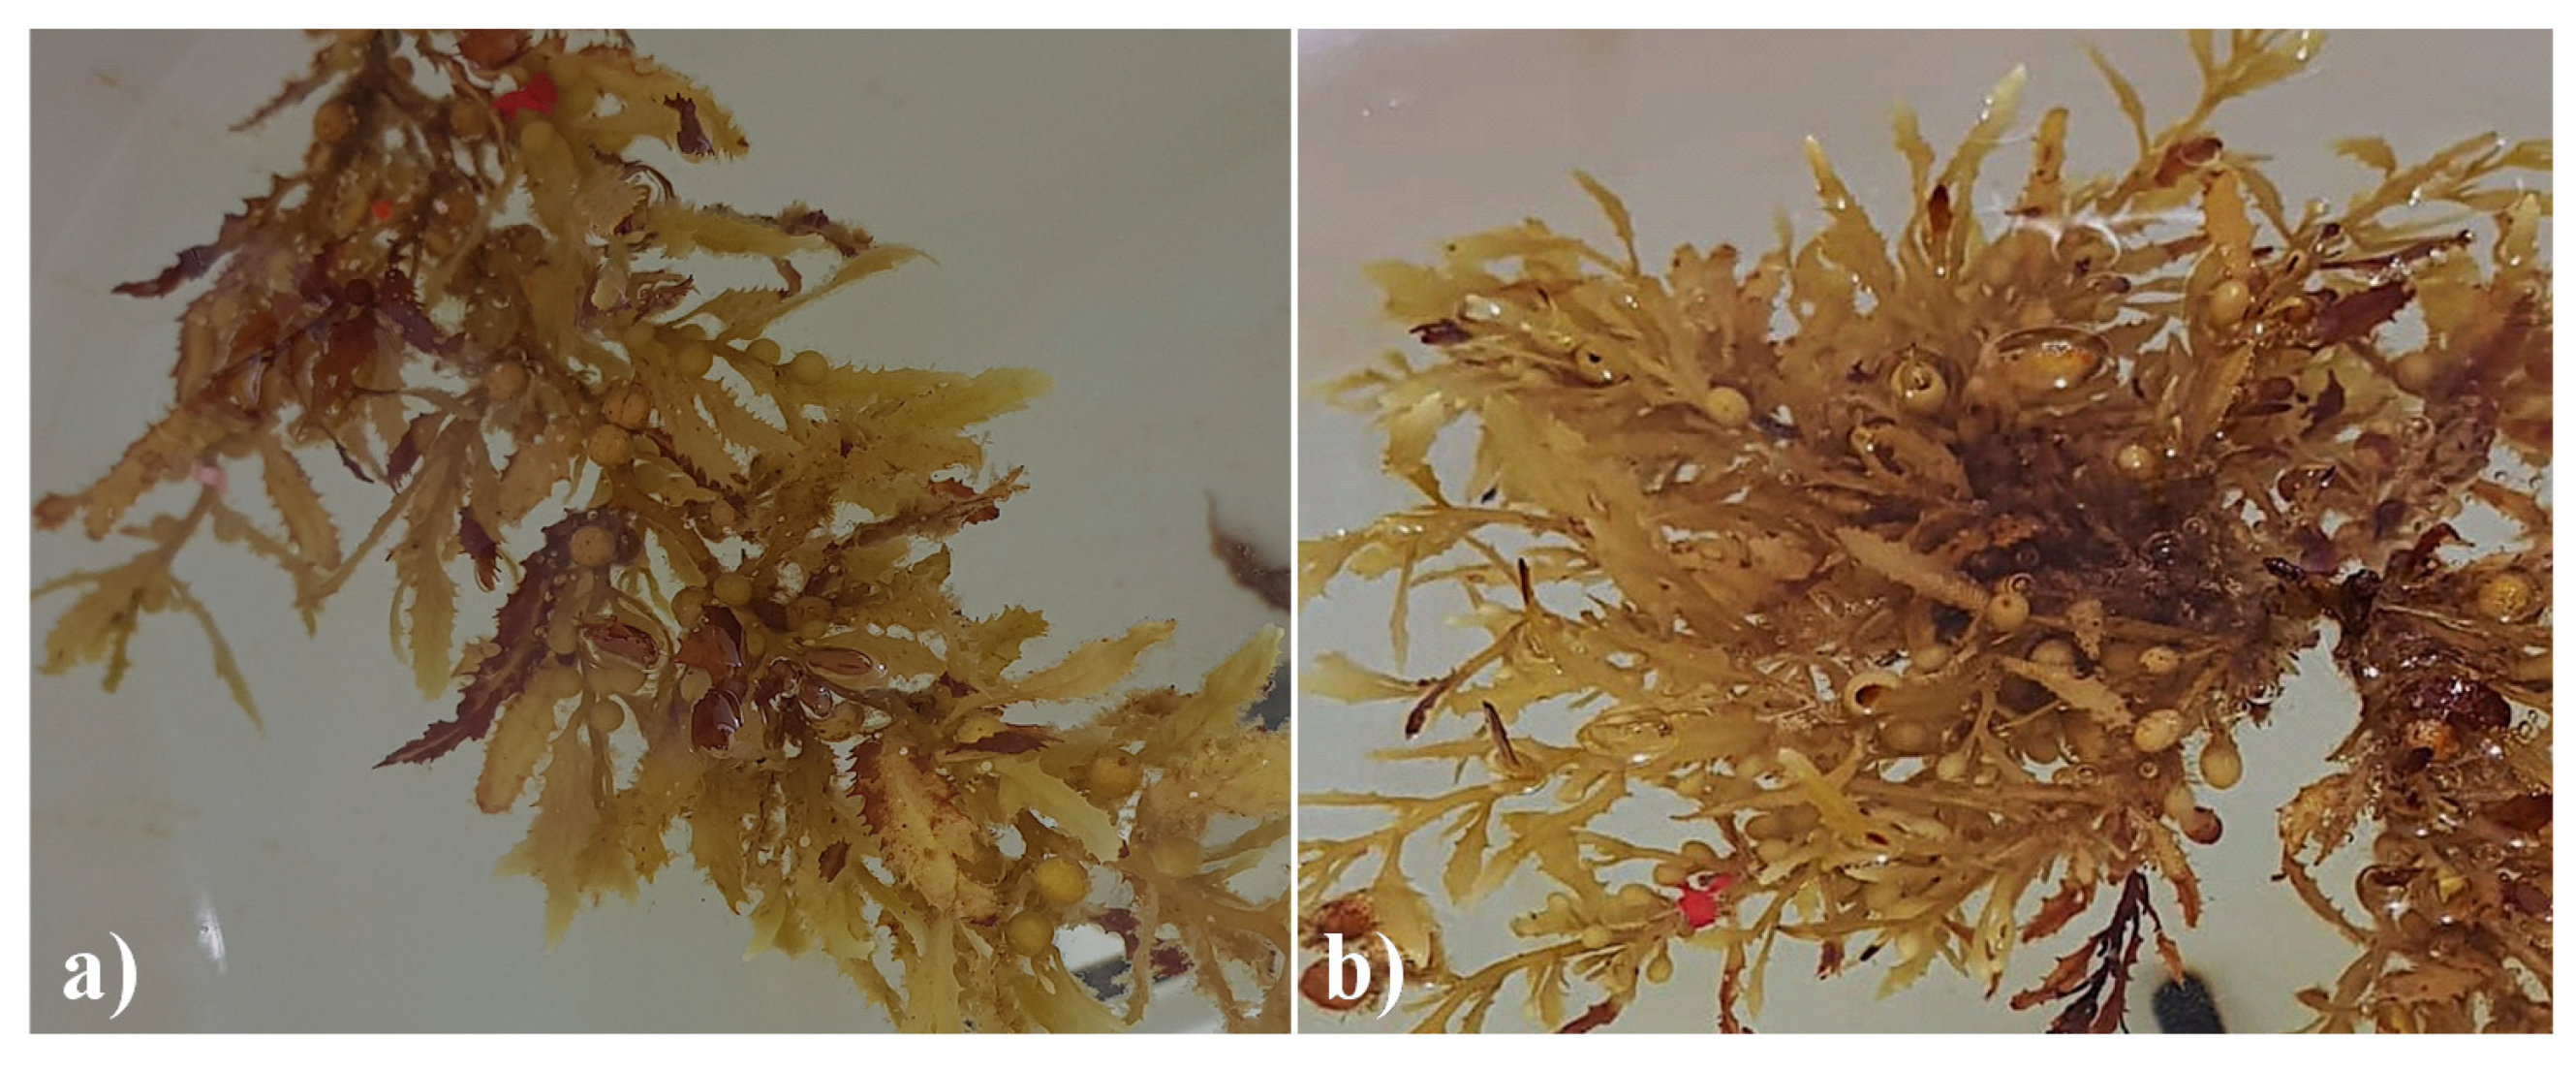
2.2.2. Characterization of the Sargassum spp. (Sspp).

The characteristic molecular vibrational modes from the functional groups of Sspp and CT-Sspp were determined using Fourier Transform Infrared (FTIR) spectroscopy, using Perkin Elmer Spectrum Two equipment (Waltham, MA, United States), with attenuated total reflectance (ATR) in an interval from 600 to 4000 cm−1. The Sspp was evaluated using a Hitachi SU8230 cold-field emission microscope operating at 3 keV. It should be noted that analyses were carried out before and after the samples were exposed to the contaminants.

2.2.3. Evaluation of Variables in the Filtration System

To optimize the elements of the filtration system, various parameters were examined. The amount of Sspp was varied to determine the ideal amount to remove the pollutants: amounts of 1, 5 and 7 g were evaluated. The effect of the surface area of Sspp was analyzed by decreasing the size of the Sspp particles, using crushed and ground Sspp. To increase the contact area between the Sspp and the water, the size of the filter was considered, diameters of 1.27 cm (0.5 inches), 2.54 cm (1 inch) and 3.81 cm (1.5 inches) were tested. The effect of residence time was examined, by regulating the flow of water, using three values (3, 5 and 9 mL/s). The distribution of the Sspp inside the filter was also evaluated, by varying the number of layers of the filter: 1, 2 and 4 layers. Finally, the removal rate in the early stages of the process was evaluated by varying the percentage of Sspp moisture (20%, 30% and 50%).

2.3. Analysis of the Samples Obtained by Biosorption

The samples obtained from the filtration were analyzed using UV-Vis spectroscopy, a fast and efficient technique, to determine the concentration of methylene blue, methyl orange, methyl red and Pb2+. In the UV-Vis spectrum, these organic dyes have a resonance effect because there is a change in energy levels in the Π-type bonds that are conjugated, also called the absorption band. The absorption bands of methylene blue, methyl orange and methyl red are situated at 664, 464 and 400 nm, respectively. As Pb2+ does not have an absorption band, a complex based on 1,2-Diaminocyclohexane-N,N,Ní,Ní-tetraacetic acid (DACT) was synthesized and this showed an absorption band centered at 247 nm. The methodology to obtain this compound is described fully in Reference [33]. An initial Pb2+ solution was prepared by dissolving nitric acid lead (II) nitrate in 500 mL of deionized H2O for a 100 mg*L−1 concentration; then, 10 mL of this solution was diluted up to 100 mL for an initial concentration of 10 mg*L−1. Under this condition, the initial pH was 7.8. The calibration curves and the analysis of the samples obtained were performed by UV-Vis spectroscopy in a METASH 6000 M spectrometer. The analyses were performed using quartz cuvettes. The degree of concentration of each substance was made based on previously established calibration curves, using standards at various defined concentrations. The removal percentage of each substance was determined from the initial concentration and its concentration in each of the 8 samples, using the following equation:
% R e m o v a l = C 0 C i C 0 × 100
where C0 is the initial concentration in parts per million (PPM) of the substance evaluated and Ci is the concentration of the measured sample (PPM), obtained from the calibration curves. The results were plotted on removal percentage versus time graphs. The concentration measurements at the different time intervals were analyzed and fitted to a first order reaction, whose equation is described as follows:
C i = C 0 e k t + A
where k is the constant rate (s−1), t is the time (s) and A is an offset constant.

3. Results

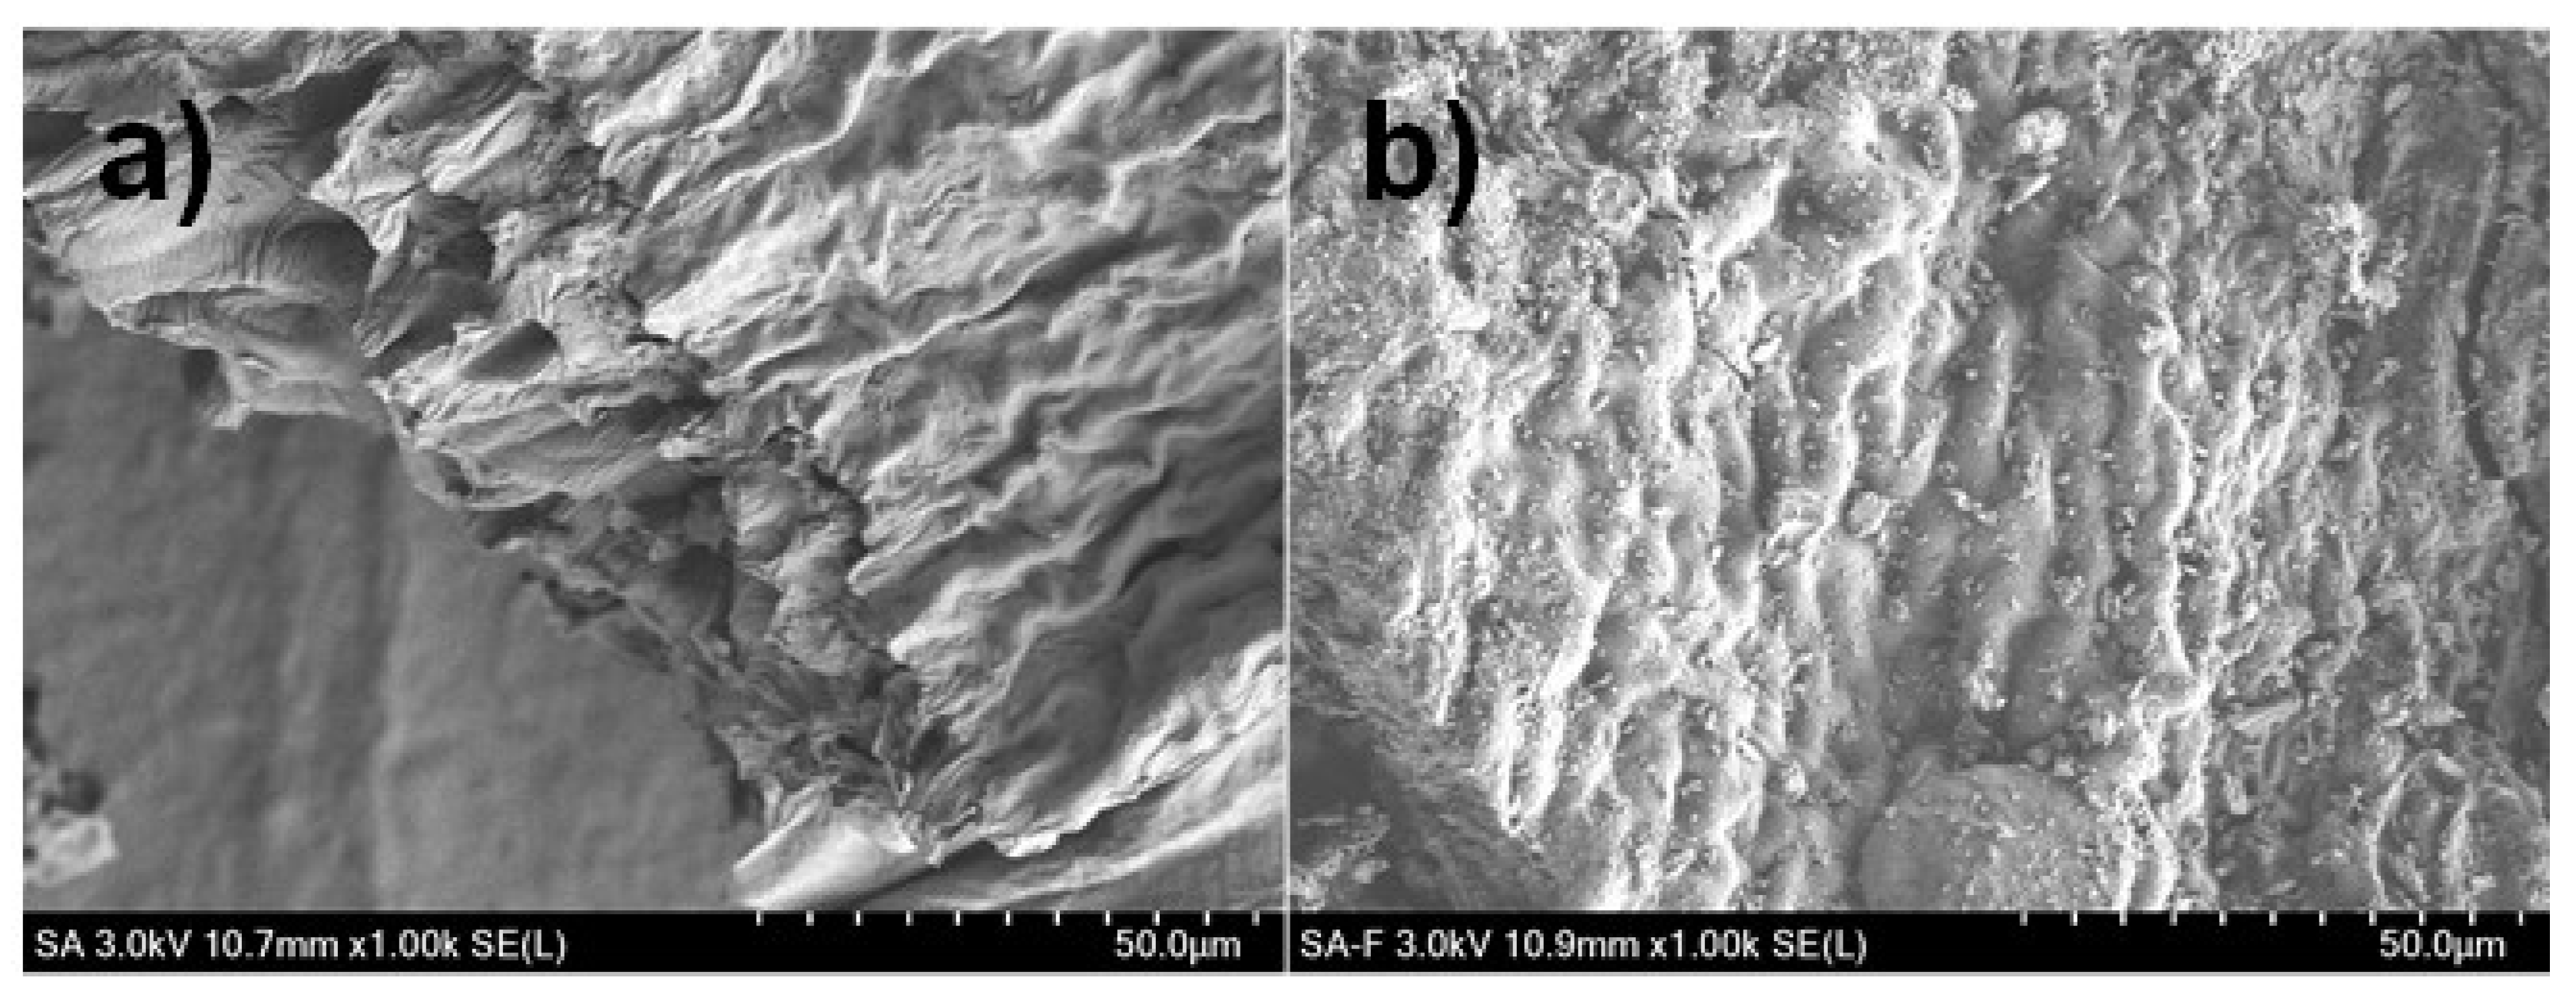
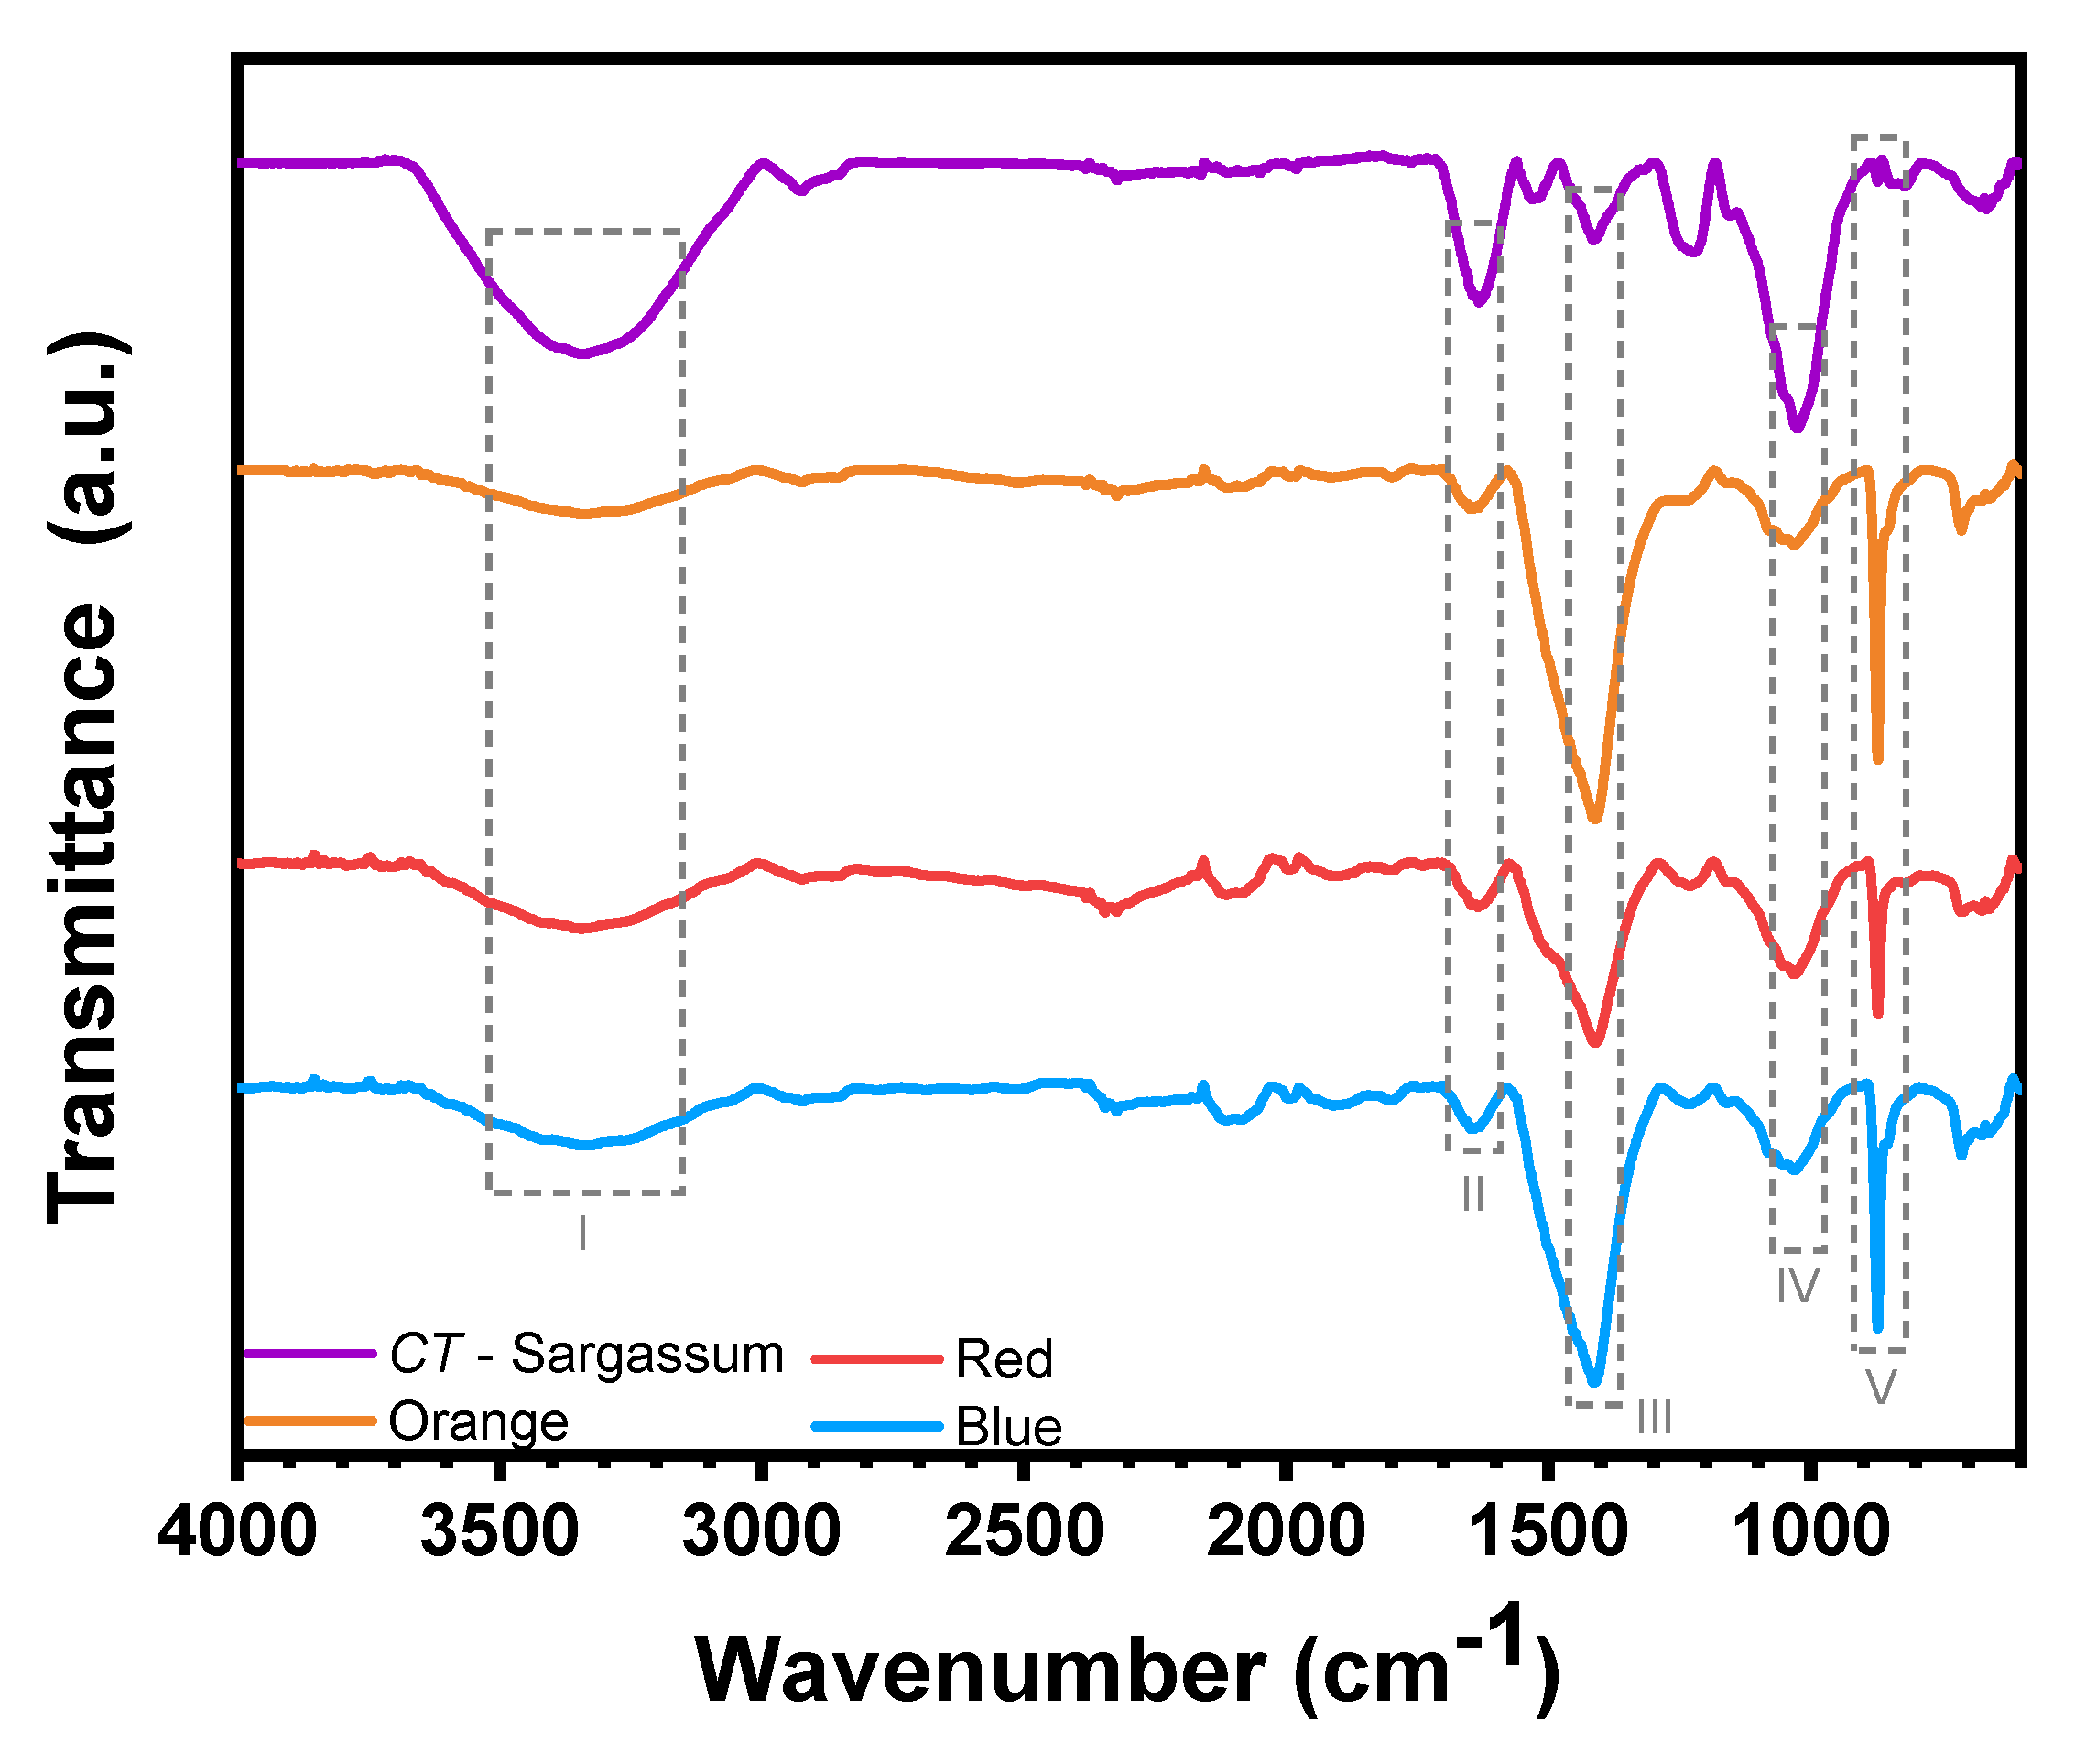
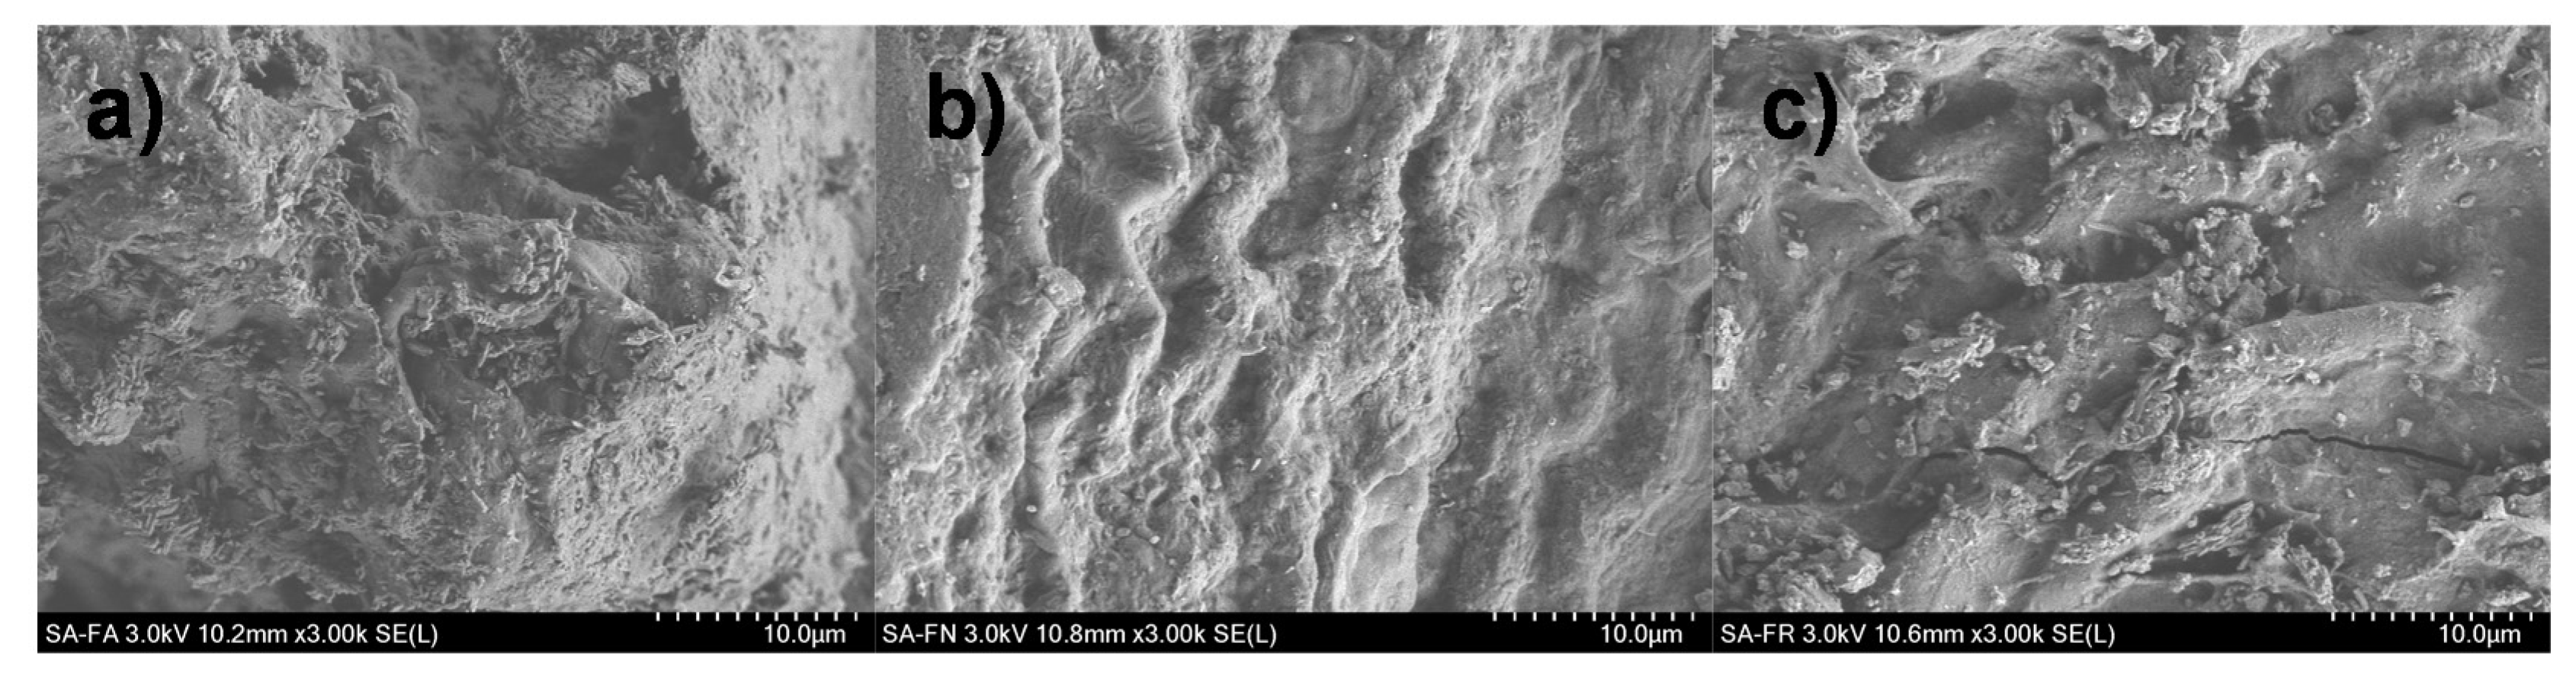
3.1. Characterization of Sargassum spp. by Scanning Electron Microscopy (SEM) and FTIR

Dry, clean Sargassum spp. (Sspp) was characterized by scanning electron microscopy (SEM) before and after the chemical treatment to observe its morphology, as shown in Figure 2. The physical processing caused disruption to the cells of the macroalgae, exposing the intracellular content. In Figure 2a, the pore structure of the Sspp is clearly observed. The structured arrangement of the interconnected tube cells is visible, and the cell wall of the intercellular matrix remains almost intact. However, in Figure 2b, it can be seen that the surface morphology of the sample was significantly changed, due to the impregnation of hydrogen peroxide (H2O2). The pore structure on the surface of the sample is partially destroyed, probably caused by strong cross-linking between the OH+ and negatively charged chemical groups in the cells. The surface is now rough and irregular.
Figure 3 shows the FTIR spectra for dry Sspp and chemically treated Sspp (CT-Sspp). The performed vibrational assignment indicates that the main macromolecular structure is not damaged by the chemical treatment. The characteristic bands of the polysaccharide groups present in their structure [32] are located at 3000–3500 cm−1 from OH symmetric stretching, at 1410 cm−1 from a combination of C–O and O–H deformation vibrations and finally, the bands present at 1219 cm−1 and 1023 cm−1 are both related to C–O stretching vibration. However, differences were found between the dry and CT-Sspp samples due to the effect of the H2O2 in the chemical treatment. In the dry Sspp, two peaks were found at 3365 cm−1 and 3274 cm−1, corresponding to N–H and O–H stretch vibration respectively, while in the CT-Sspp, there is only one peak assigned to an O–H symmetric stretching vibration. The disappearance of the N–H stretching vibration has been observed in other polysaccharides, such as chitosan, suggesting that terminal NH2 groups are removed from chains during the chemical treatment due to the deamination side reactions [34]. Dry Sspp had two peaks at 2977 and 2926 cm−1 for symmetric and asymmetric C–H vibrations, while in the CT-Sspp, only the peak from symmetric stretching (2926 cm−1) was seen.
On the other hand, a shift from 1601 cm−1 to 1615 cm−1 was found for treated and dry Sspp, indicating a modification in the C=O vibrational state from a change in the polysaccharide structure from the cyclic to the non-cyclic form, as part of the structural changes from the chemical treatment. The modifications on the signals corresponding to the –OH vibration could be related to an increasing number of carboxyl groups, due to the oxidation cleavage of the β-glycosidic groups, which is confirmed with an increase on the C–O band at 1219 cm−1 and a decrease in the band of the glycosidic linkage vibration present at 873 cm−1.
These results agree with works of other authors. For example, Sargassum boveanum has been reported [35] in the region of 400 to 4000 cm−1, in which bands related to –OH broad stretch for high concentration of alcohols or phenols are found. Also, bands located from C–O stretching from C=O and C–C stretching from phenol rings were found. Another example of concordance with the proposed vibrational assignment is the report from Sargassum wightii [36], in which bands of about 600–800 cm−1 and bands around 1258 cm−1 related to S=O and C–C–O vibration from lignin were presented. Also, bands located at 3371 and 3408 cm−1 corresponding to N–H and O–H stretching of the polysaccharides were observed. This indicates that the Sargassum sp. studied in the present work has low quantities of sulfonated polysaccharides. Moreover, as previously mentioned, the amino groups were removed, and an increasing number of carboxylic groups was formed from deamination and from molecular structure degradation from the oxidized cleavage of β-glycosidic linkages. Thus, the structure of the residue and the reducing end has been modified [35]. In summary, the chemical treatment caused changes in the chemical structure and there were more functional groups available for the adsorption of toxic substances.

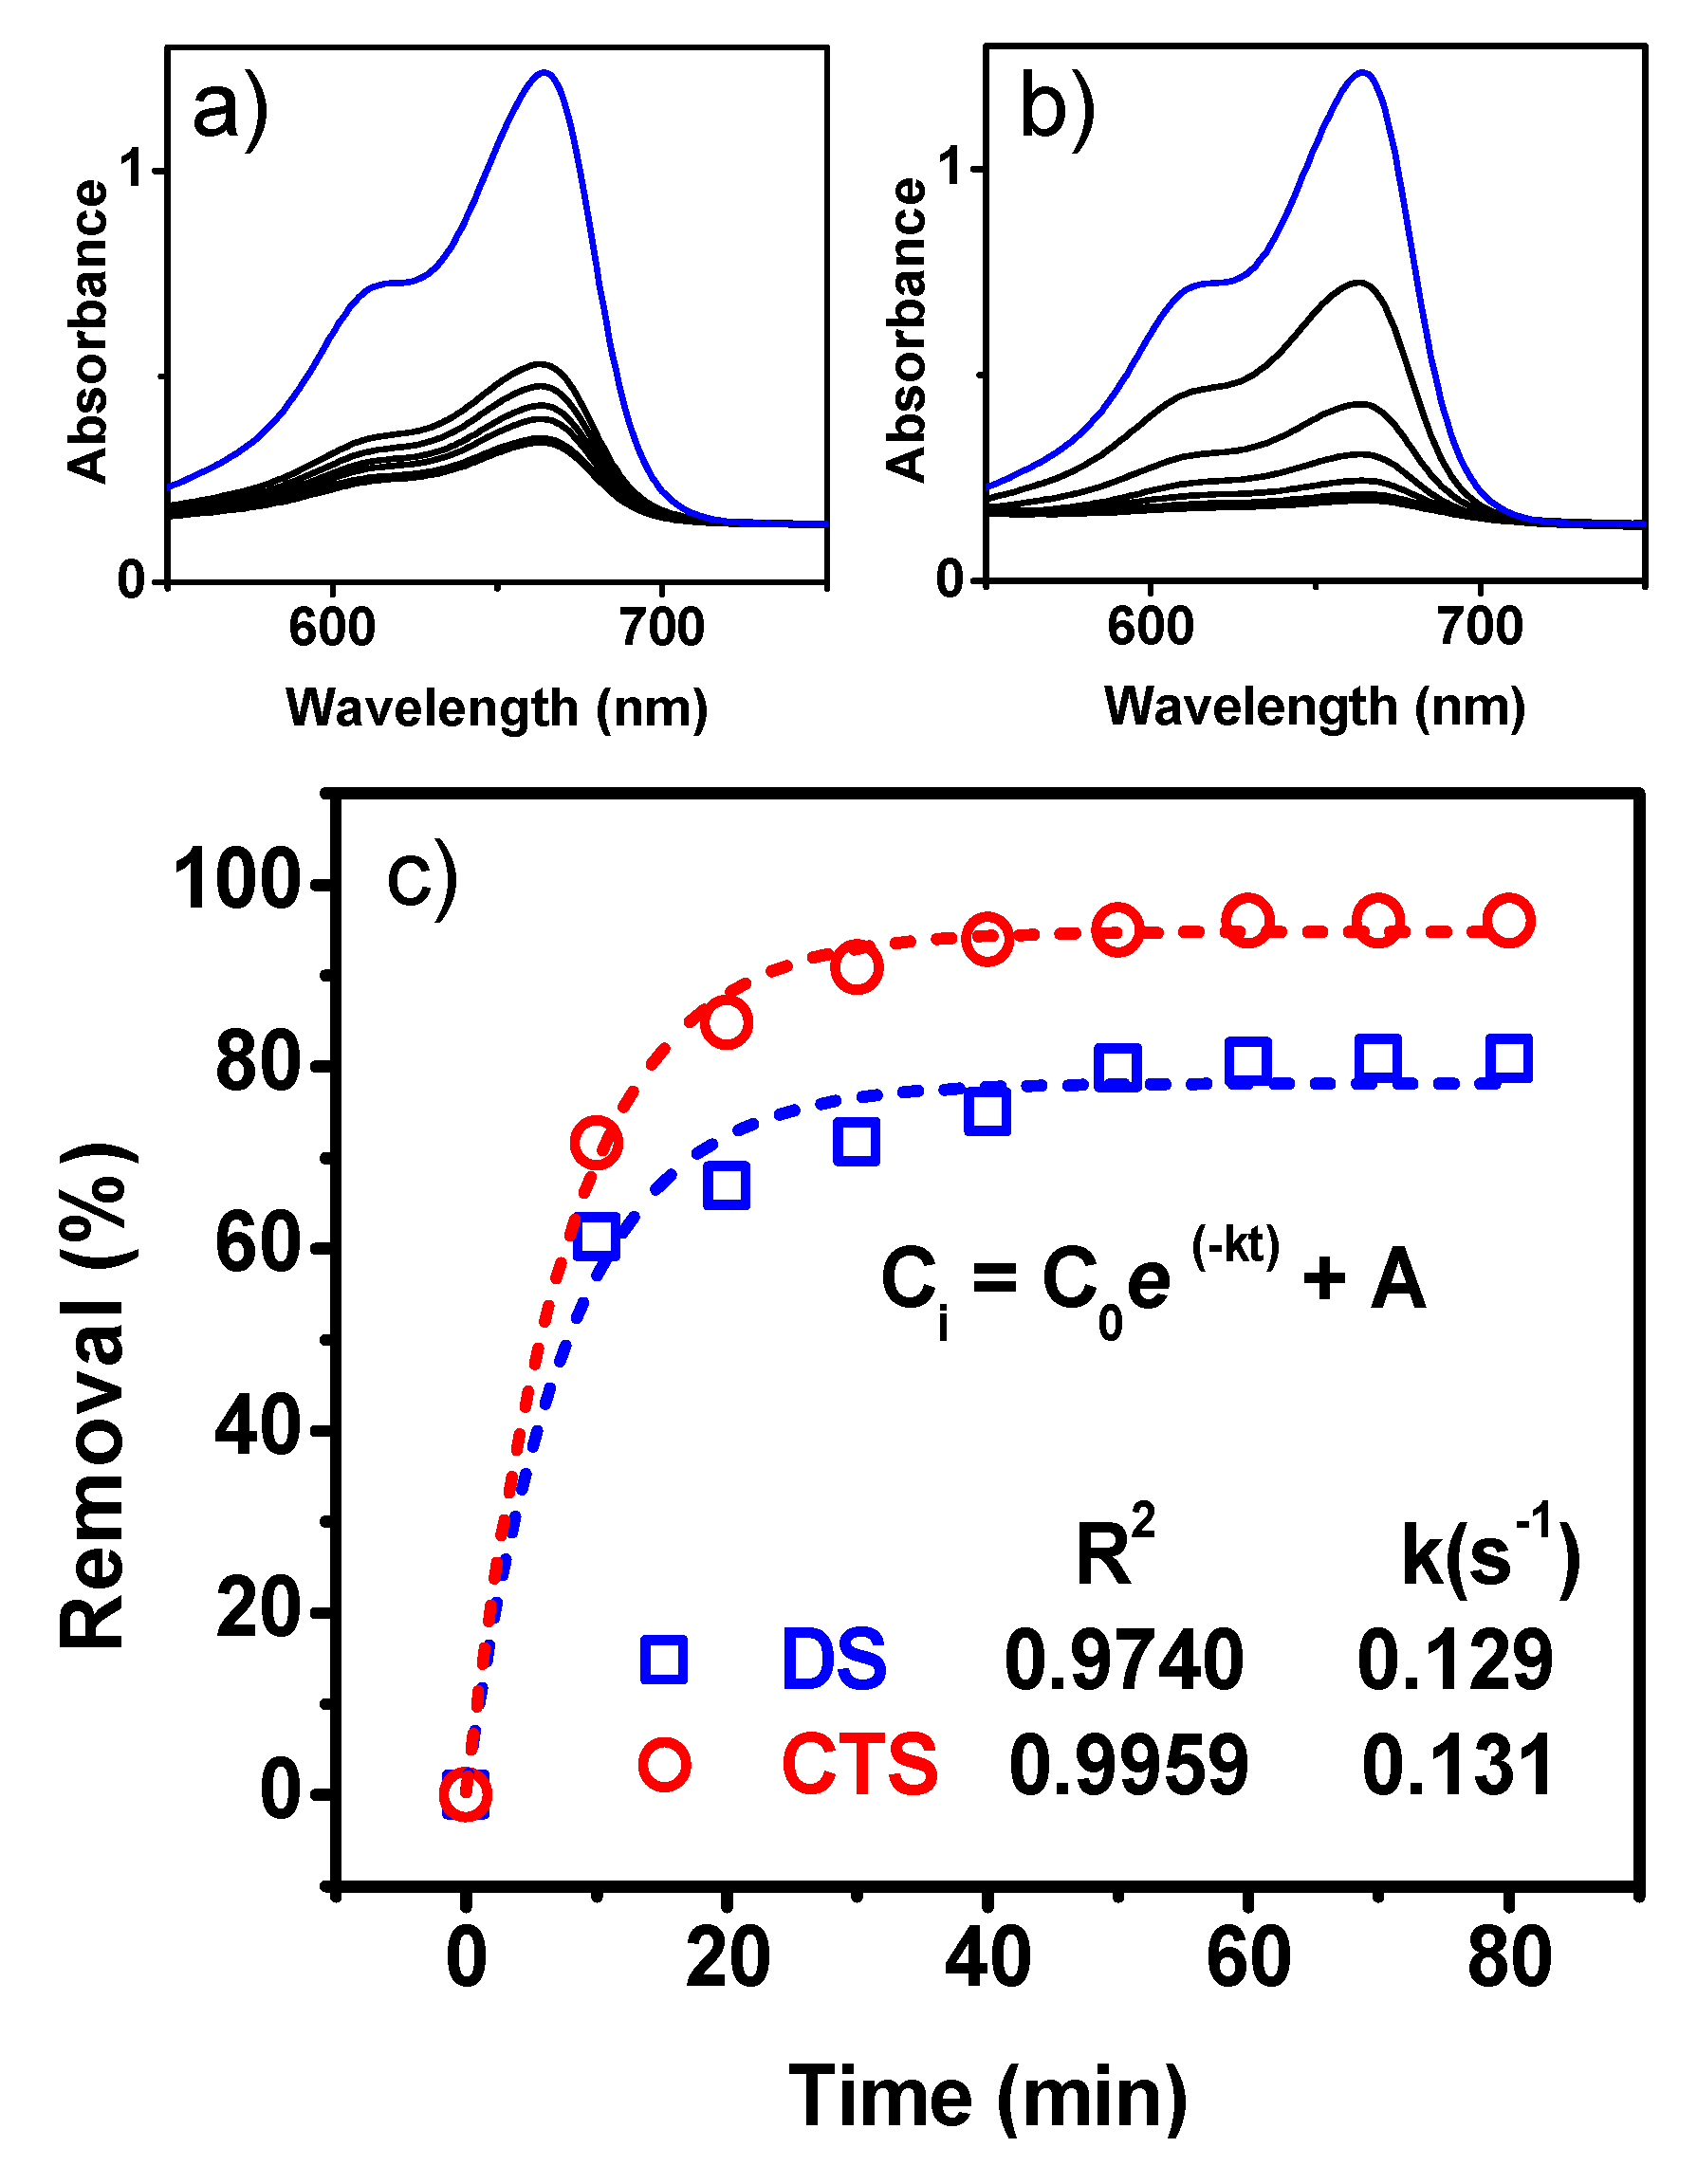
3.2. Effect of Chemical Treatment of Sargassum spp.

As has been reported, H2O2 modifies the structural chains of the biomass, leading to an increase in the absorption of the substances evaluated [32,34]. The degree of removal of methylene blue was analyzed. Figure 4 shows the evaluation of chemically treated Sspp in methylene blue removal. Figure 4a,b shows the UV-Vis spectra, taken every 10 min, for dry Sspp and CT-Sspp, respectively. There is a decrease in the intensity of the methylene blue absorption band, meaning a decrease in the concentration of the dye. The decrease in the spectra intensity is less for dry Sspp than for CT-Sspp. Figure 4c shows the removal rate curves obtained from the UV-Vis spectra data. The removal of methylene blue, using non-treated Sspp, was approximately 80%, while with CT-Sspp, the removal was close to 95%. However, in both cases, these removal rates were reached very slowly, after 60 min. Finally, the removal rate was also notably higher in the case of chemically modified Sspp (k = 0.131 s−1) compared to non-modified Sspp (k = 0.129 s−1). Therefore, the chemical treatment of Sspp improves the rate and efficiency of methylene blue removal.

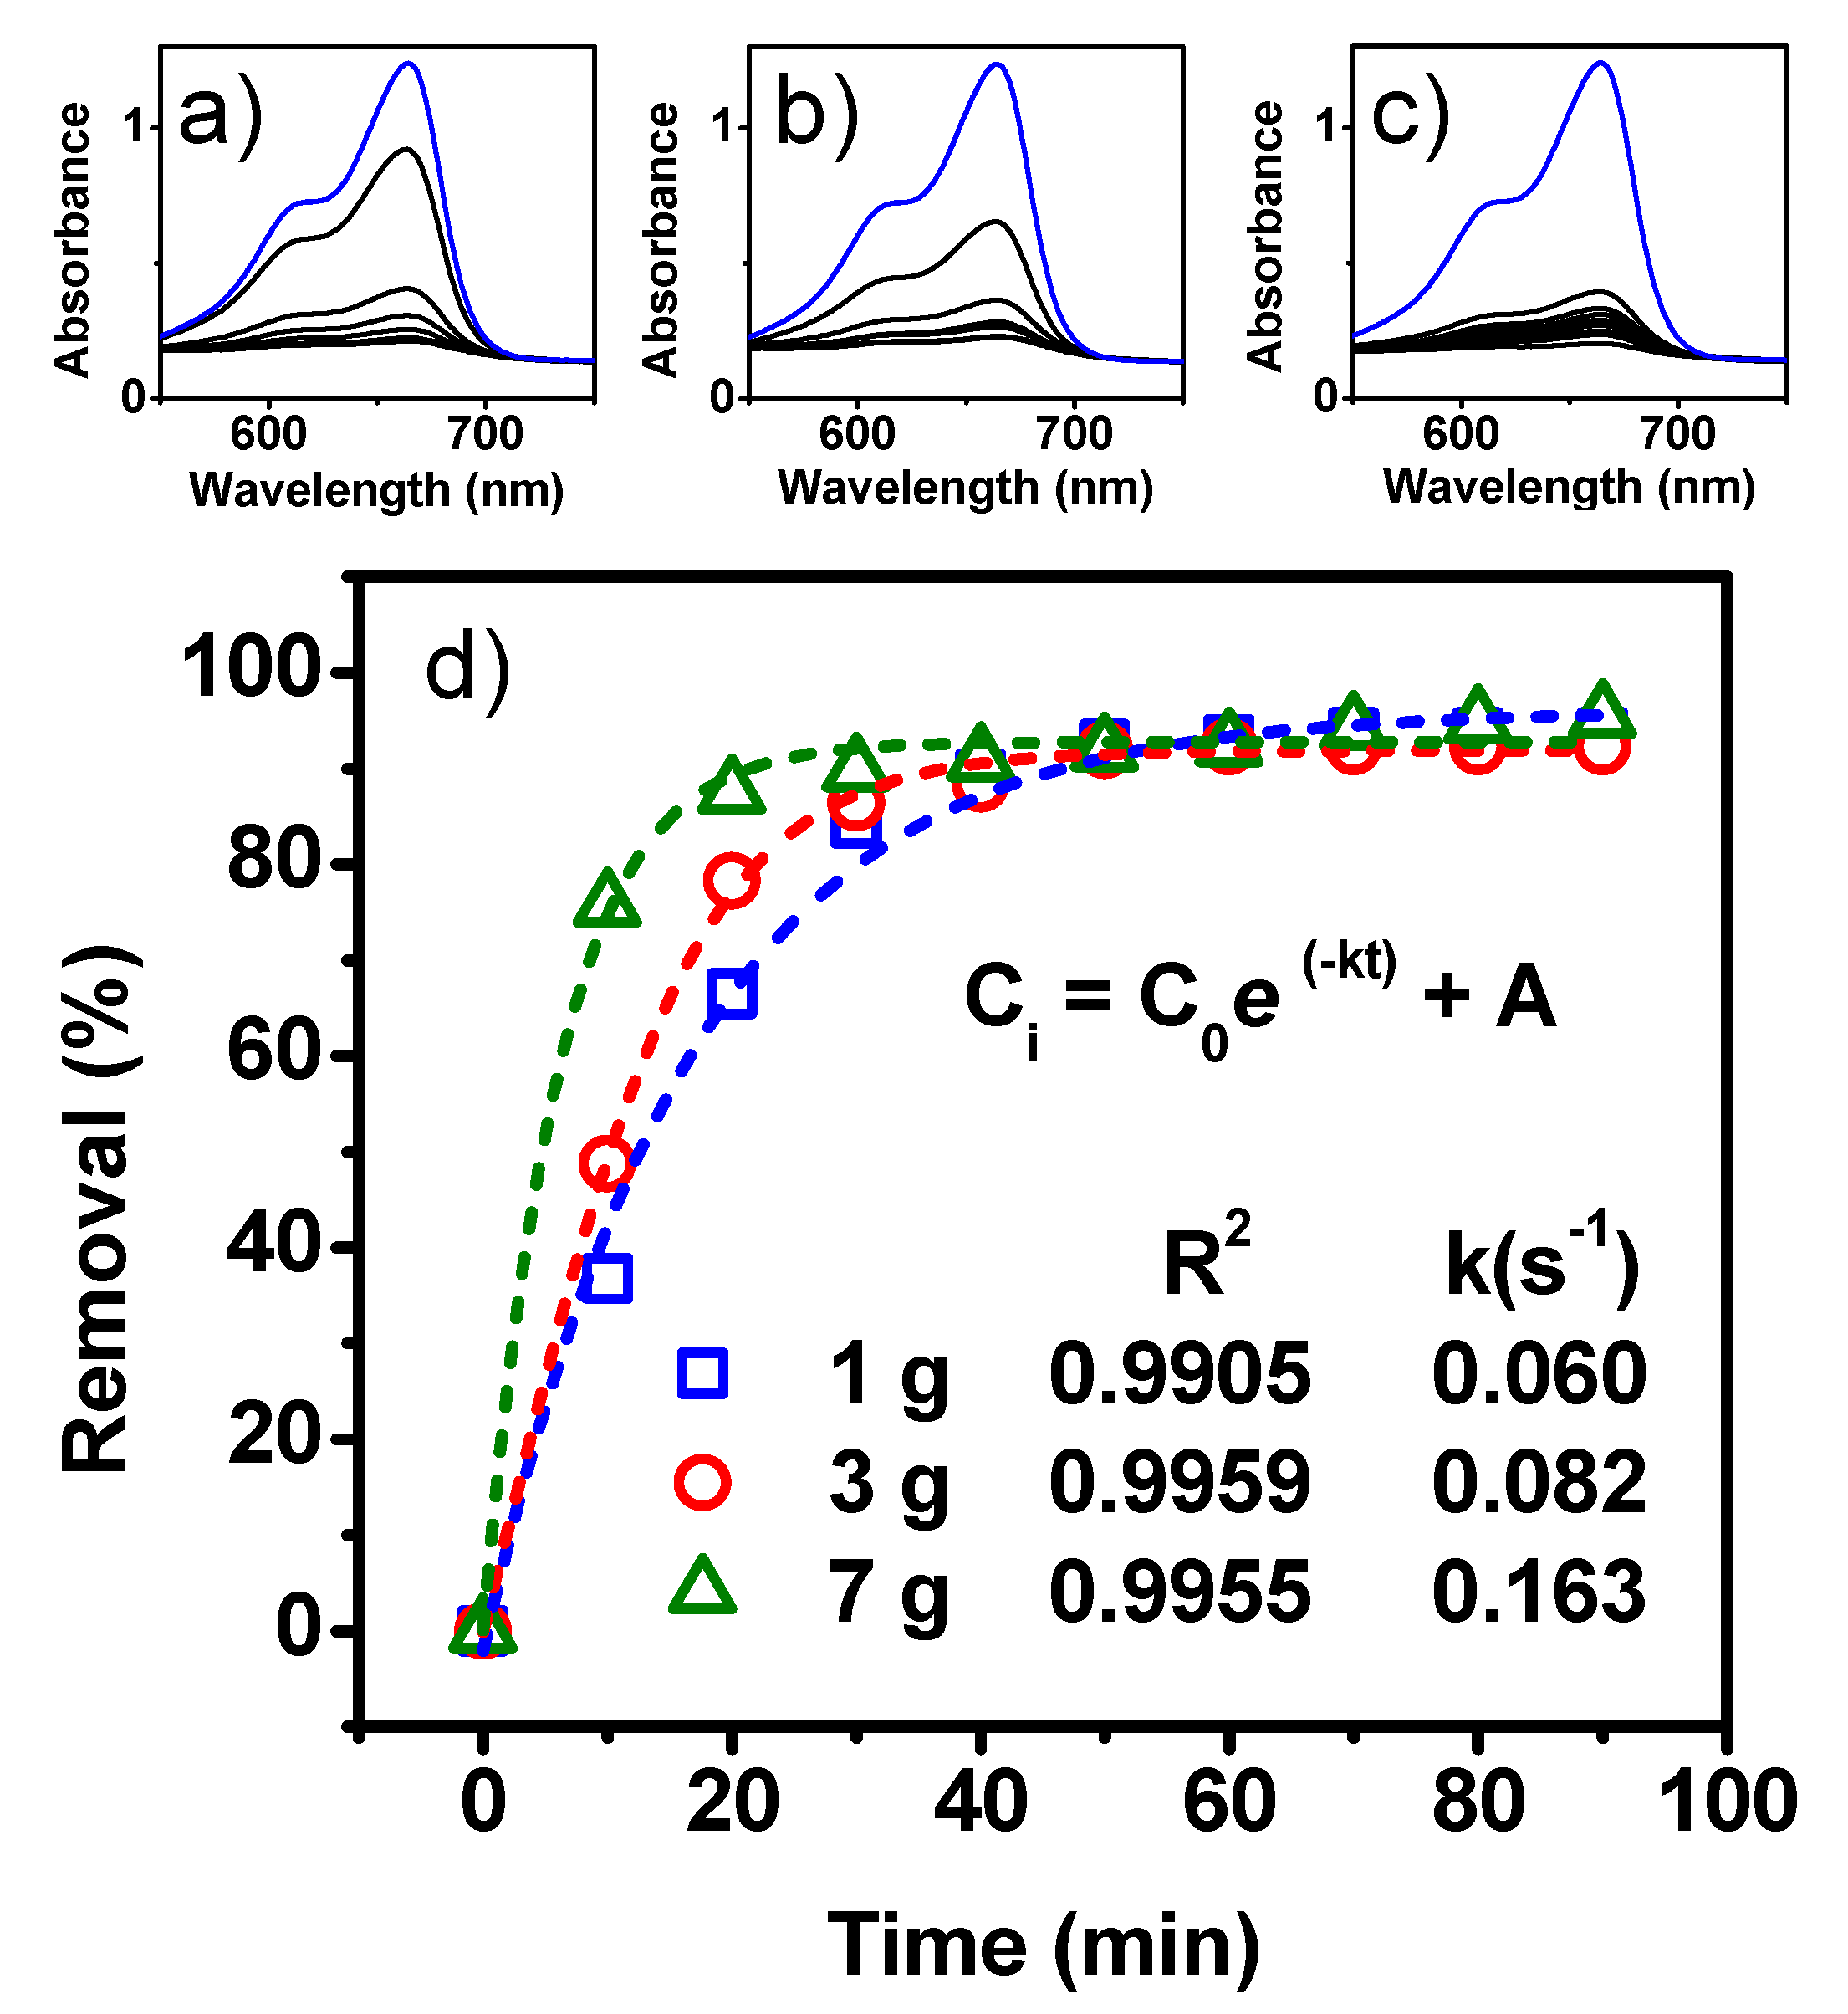
3.3. Amount of Sargassum spp. in Filters

Once it was demonstrated that Sspp could remove methylene blue, the amount of CT-Sspp used in the filters was increased, in order to improve the rate and the amount of removal. Figure 5 shows the results of methylene blue removal, with varying masses of CT-Sspp: 1, 3 and 7 g. The samples were taken every 10 min and characterized by UV-Vis (Figure 5a, b and c, respectively). As observed, the absorption band of methylene blue decreases with time, indicating its removal. Figure 5d shows the removal curves obtained from the spectra, where both the rate and the removal efficiency can be determined. As can be seen, the efficiency of the three conditions evaluated is very similar, around 90%. However, it should be noted that in the case of 7 g of CT-Sspp, the removal rate was considerably higher. This data can be corroborated by comparing the rate constants obtained in each curve. The values of this constant were 0.06, 0.082 and 0.163 s−1 for 1, 3 and 7 g of CT-Sspp, respectively. With 7 g of CT-Sspp, a high level of methylene blue removal was achieved in a short time.

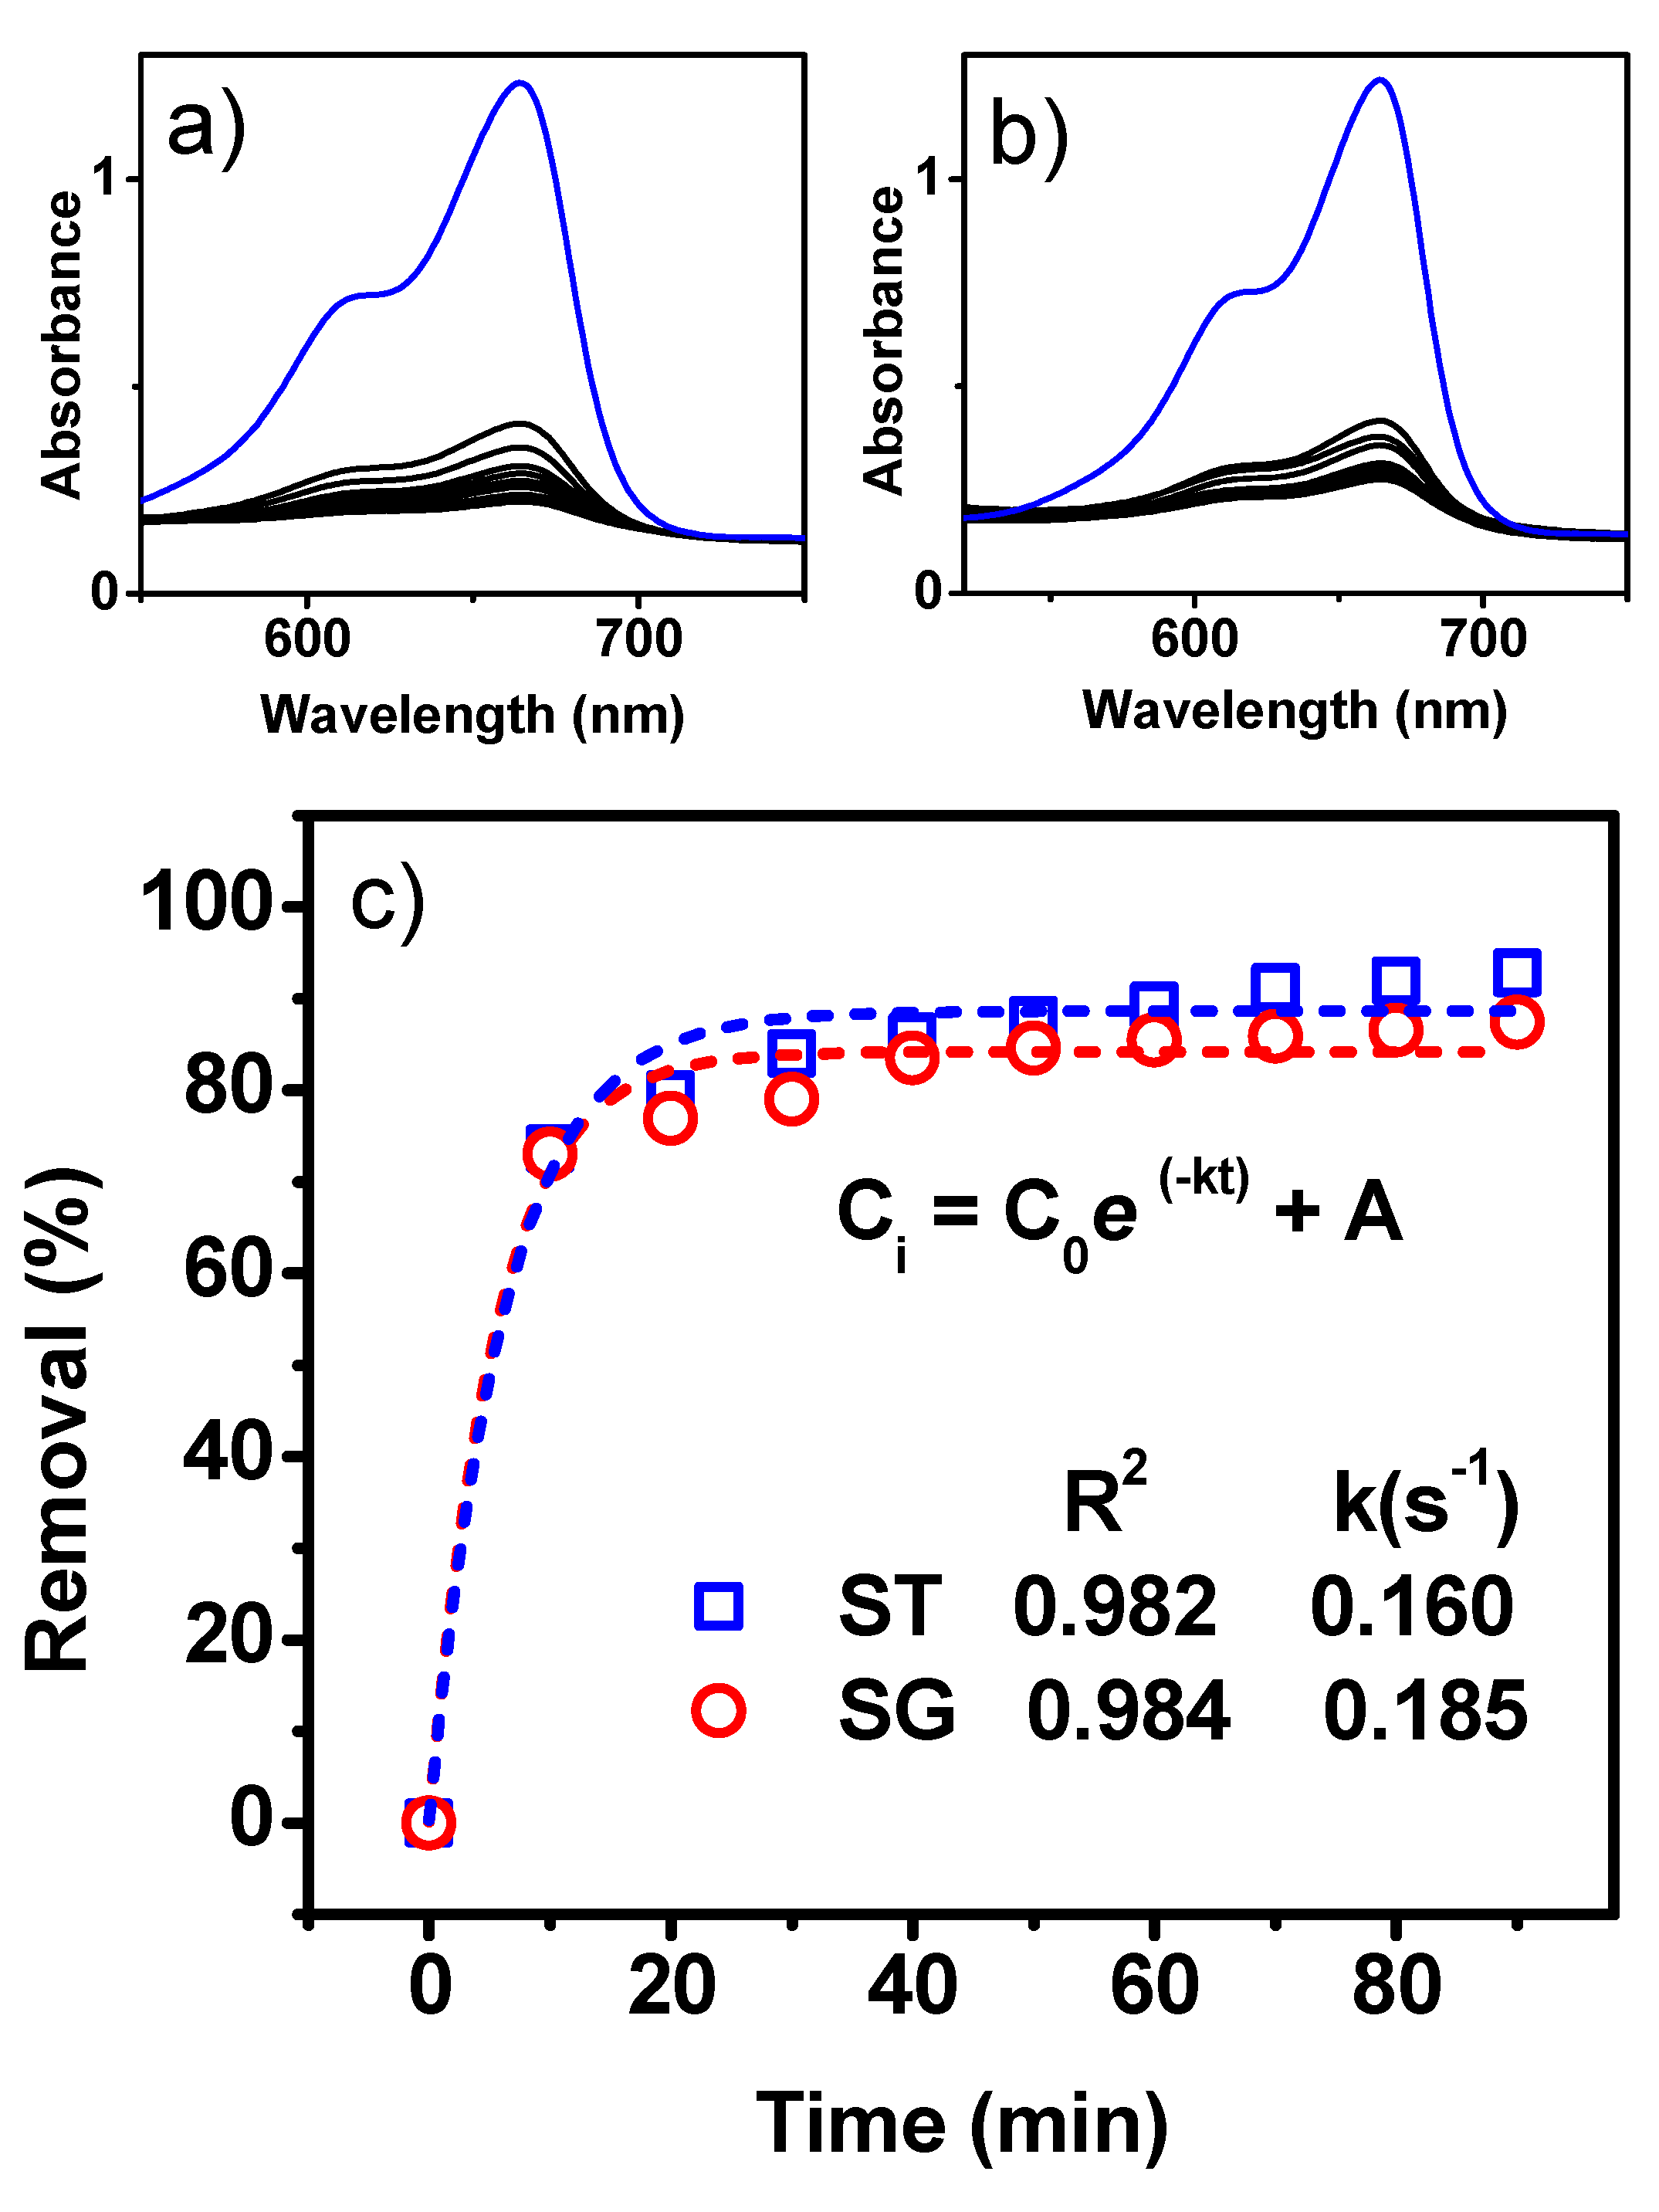
3.4. Mechanically Treated Sargassum spp.

To increase the exposed surface area of the CT-Sspp, two mechanical processes were applied to it: crushing and grinding. Figure 6 shows the results of methylene blue removal using 7 g CT-Sspp subjected to these mechanical treatments. Figure 6a,b shows the UV-Vis spectra recorded every 10 min, when crushed and ground CT-Sspp was used, respectively. In both cases, a rapid decrease in the absorption band of the dye is appreciated. However, after a short time, removal became constant and complete removal did not occur. The outflow gradually narrowed, until a plug was produced, preventing the flow of water. This was due to the rapid and significant compaction of the CT-Sspp because of the reduction in particle size caused by the mechanical treatment. Figure 6c shows the curves obtained from the UV-Vis spectra. In the first stages, the curves are very similar; later, a slightly better performance for the crushed CT-Sspp is seen. However, no improvement in total removal was obtained with respect to experiments without mechanical treatment, so it was decided to use CT-Sspp without mechanical treatment in the experiments.

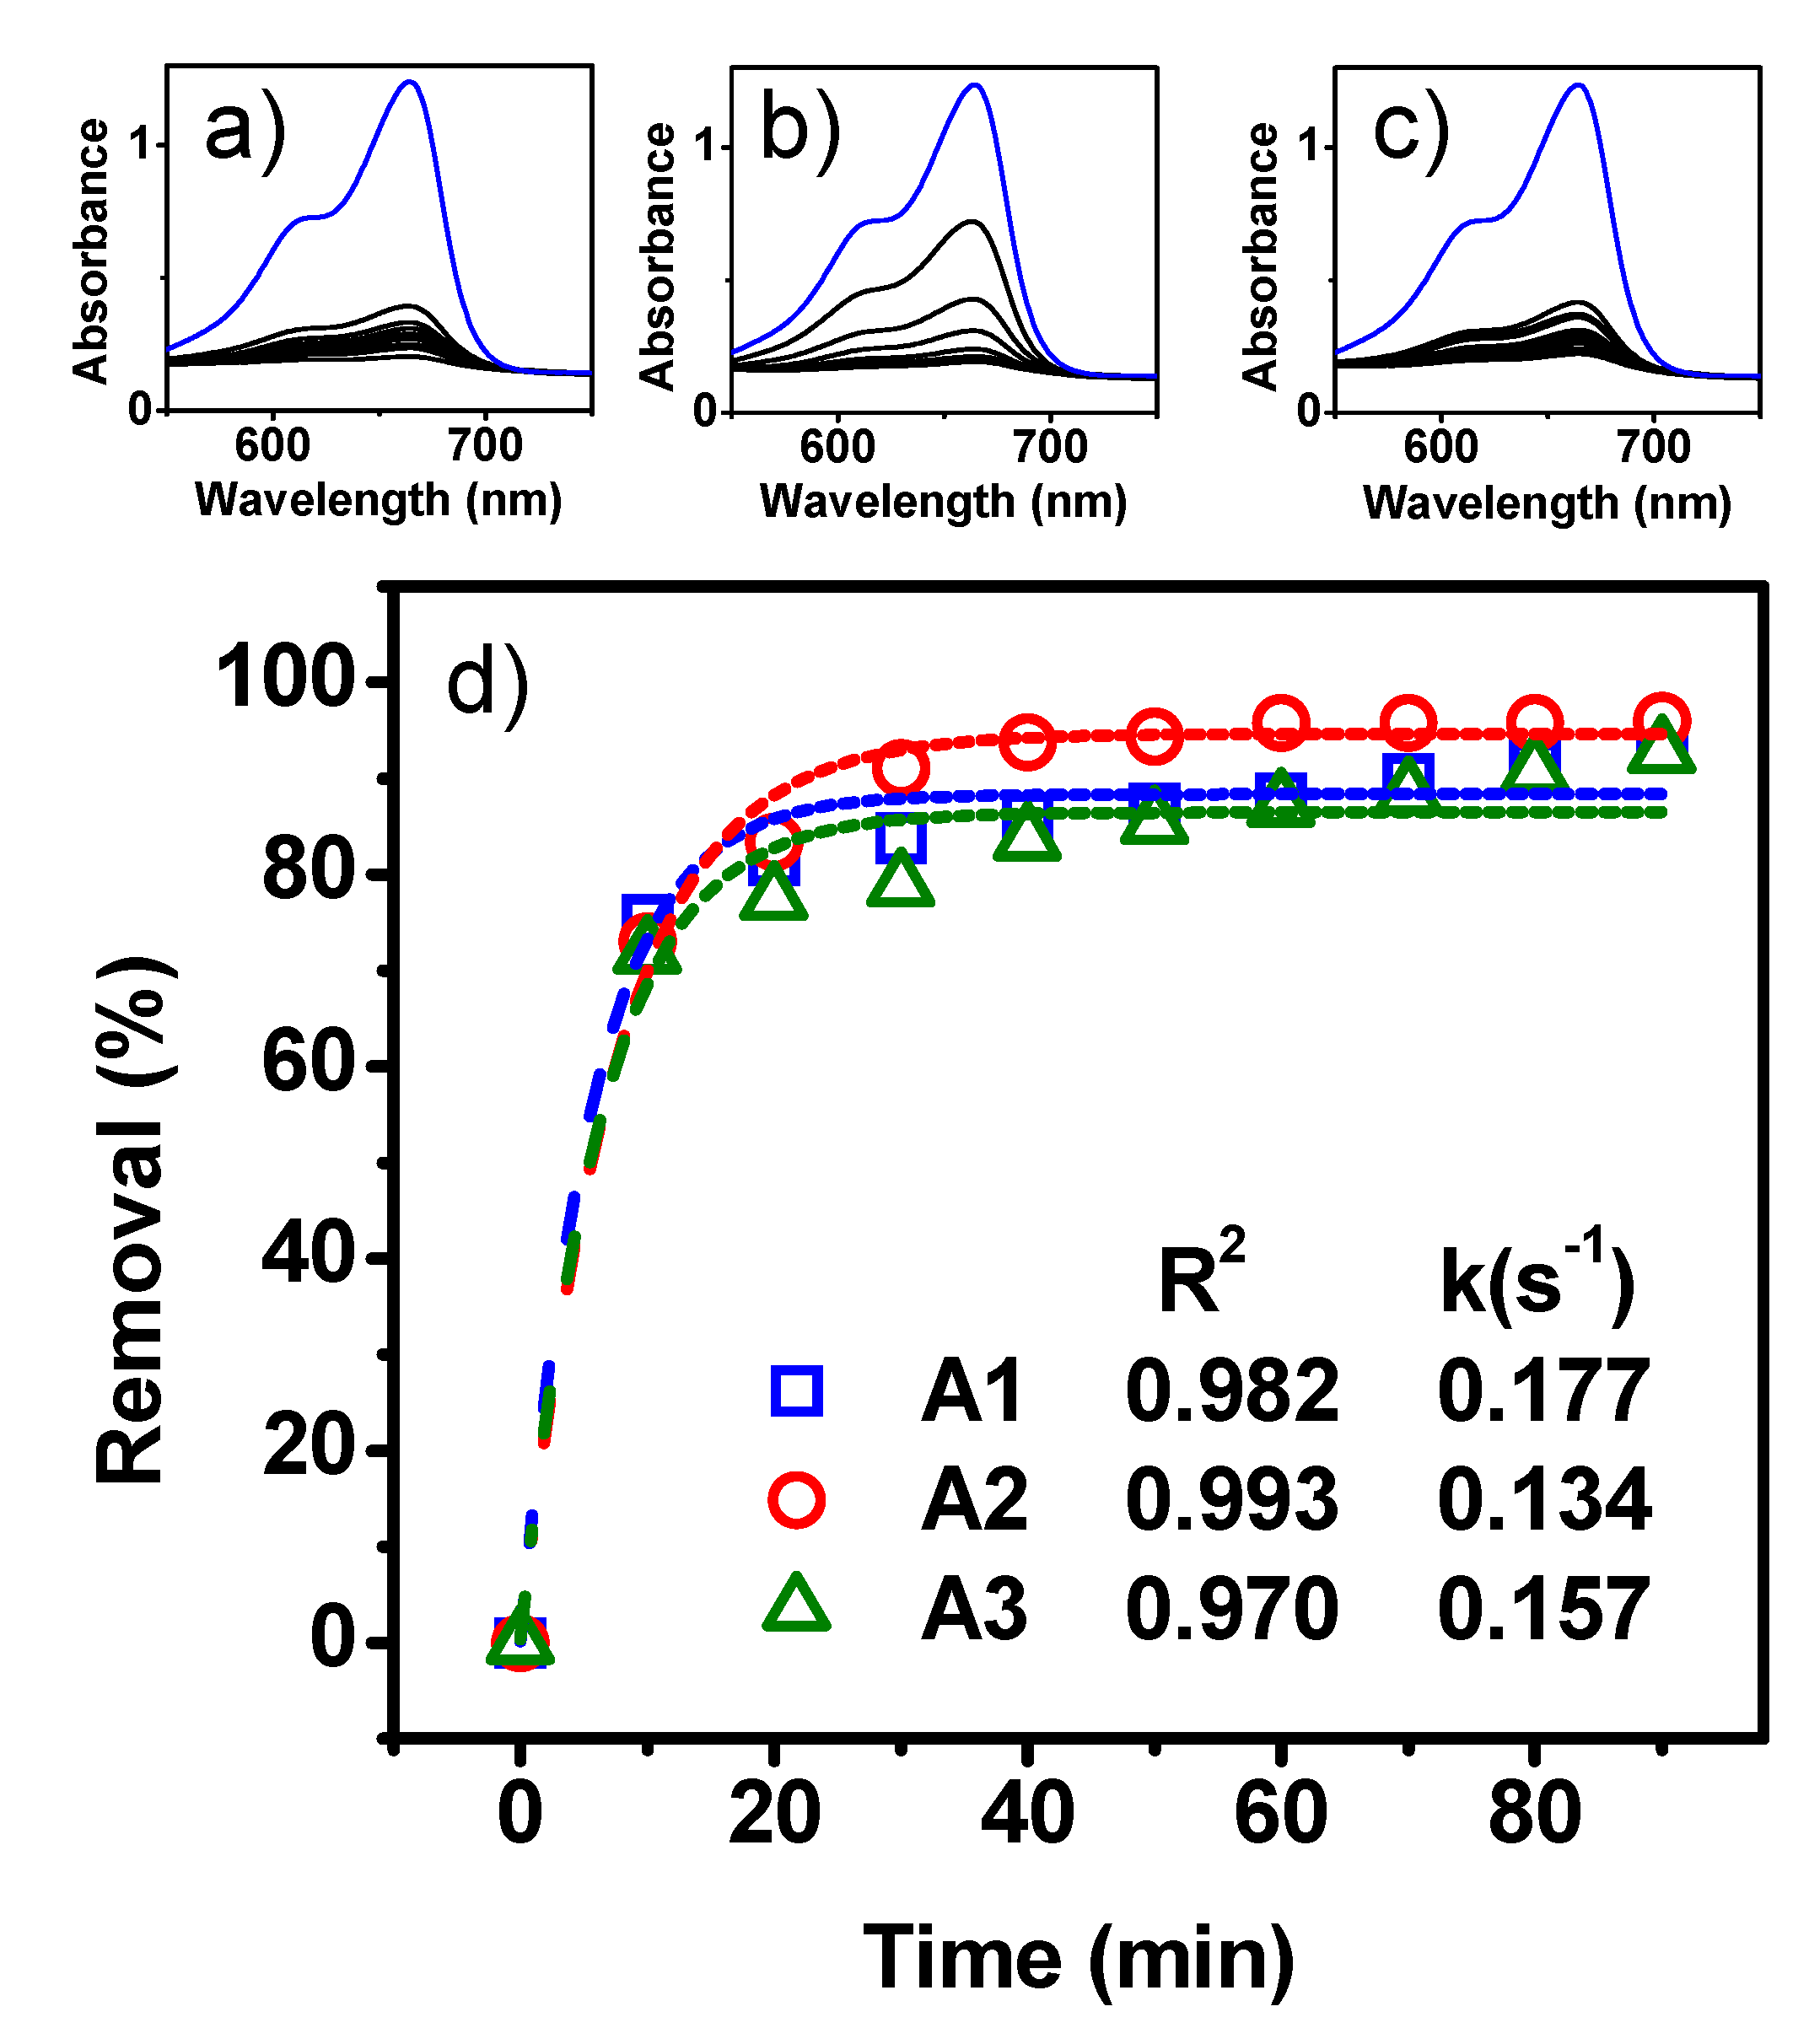
3.5. Evaluation of Filter Diameter

Figure 7a, b and c shows the results of methylene blue removal with varying filter diameters, showing the UV-Vis spectra for the diameters of A1 = 1.27 cm (0.5 inches), A2 = 2.54 cm (1 inch) and A3 = 3.81 cm (1.5 inches), respectively. For the 1.27 cm diameter (Figure 7a), the absorption band of the dye decreases rapidly, at first. However, after a short time, the spectra show no significant changes. Figure 7b, corresponding to a filter of 2.54 cm of diameter, shows a constant decrease in the absorption band of methylene blue. When the diameter was increased to 3.81 cm (Figure 7c), a rapid decrease in the absorption band was observed in the first spectrum. However, afterwards, the spectra recorded only a very slight decrease. These results are most noticeable in the removal curves shown in Figure 7d. The removal percentage in the first 10 min is very similar in the three curves, but, as time advances, the removal is more efficient with a filter of 2.54 cm, reaching 95% removal. Therefore, a filter of 2.54 cm (1 inch) diameter was selected for the subsequent experiments.

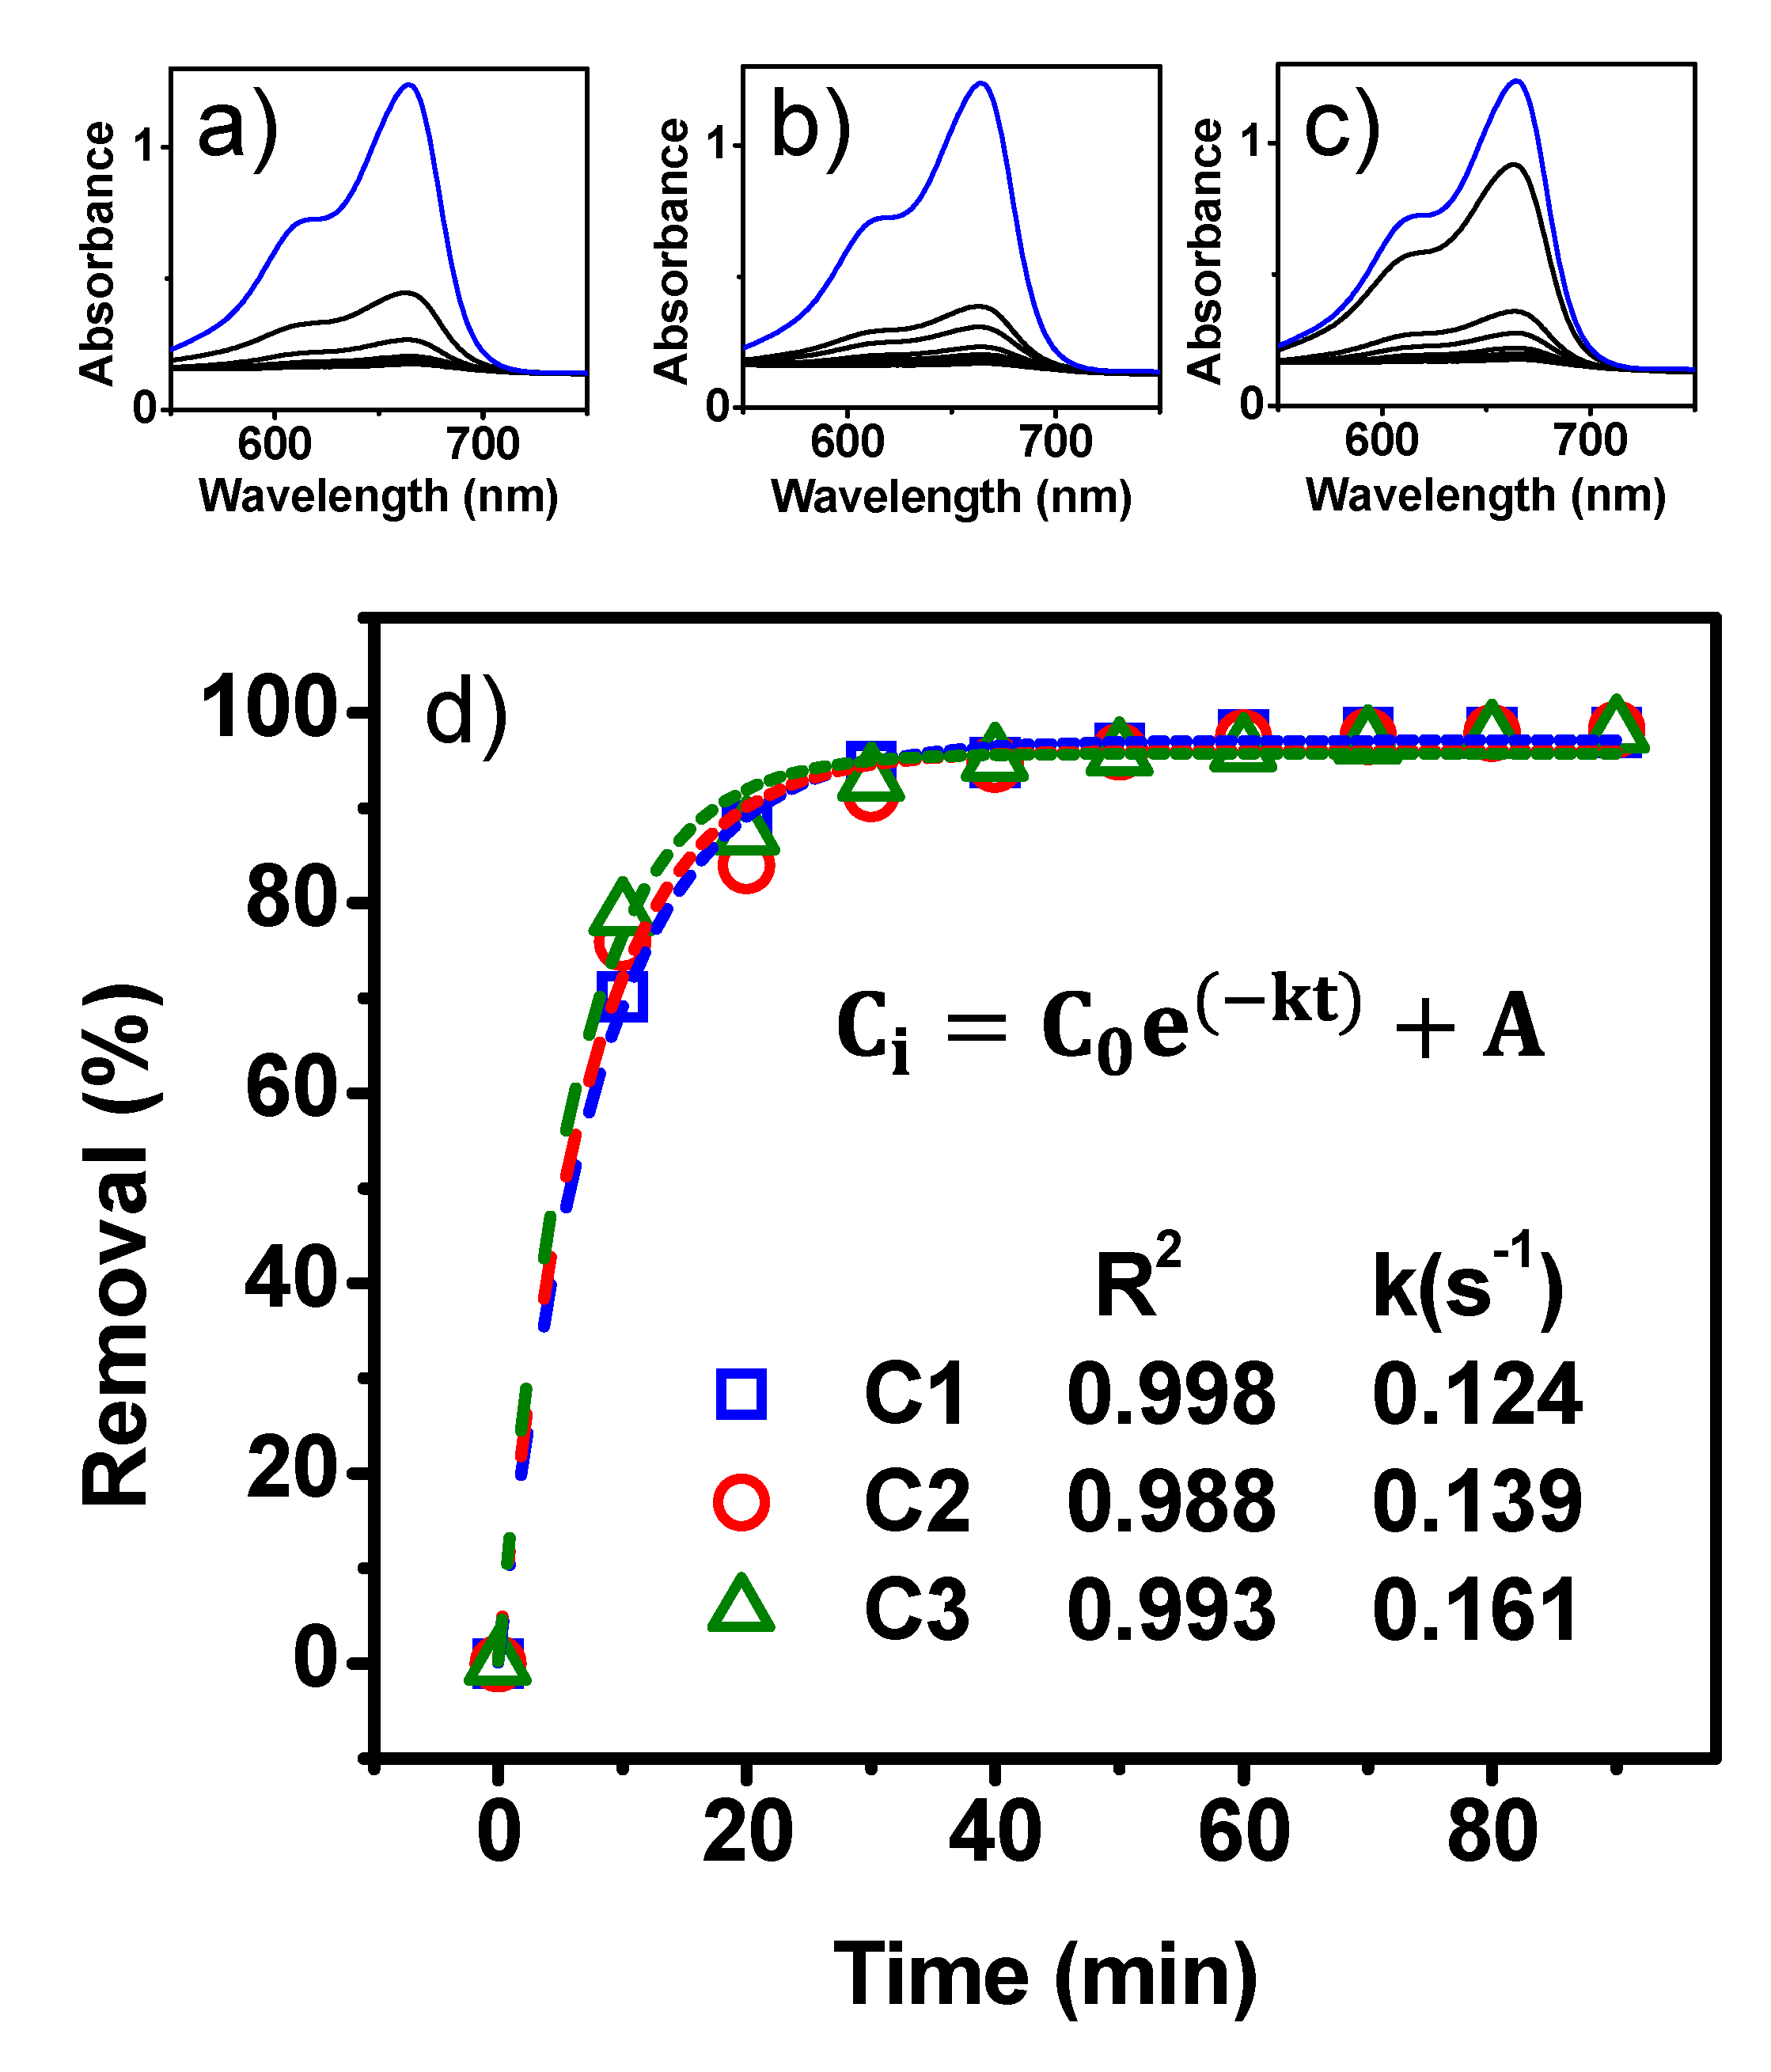
3.6. Evaluation of Filter Layers

In order to increase the percentage and rate of methylene blue removal, the amount of CT-Sspp (7 g) was divided into various numbers of layers. The results are shown in Figure 8. The UV-Vis spectra of methylene blue using C1 = 2, C2 = 3 and C3 = 4 layers of CT-Sspp are shown in Figure 8a, b and c, respectively. In all cases, the behavior is similar, that is, the signal or absorption band, corresponding to the dye, decreases rapidly in the first spectrum until it is no longer appreciated in the last measurements. Figure 8d shows the removal curves where the evolution of each condition can be seen in greater detail. Comparing the three curves, it can be seen that when 4 layers were used, the greatest efficiency was observed from the first measurement, 80%. Total removal was very similar in the three experiments, of approximately 98%. Regarding the rate constants, values of 0.124, 0.139 and 0.161 s−1 were obtained for 2, 3 and 4 layers, respectively. As can be observed, the removal rates for the entire experiment are very similar. However, a better dye removal should be noted in the early stages when the Sargassum is distributed in 4 layers. Therefore, the use of 4 layers gives the highest rate of methylene blue removal. These results show a notable improvement with respect to those that had been obtained so far. Therefore, for subsequent experiments, the system had four layers of CT-Sspp, equally divided.

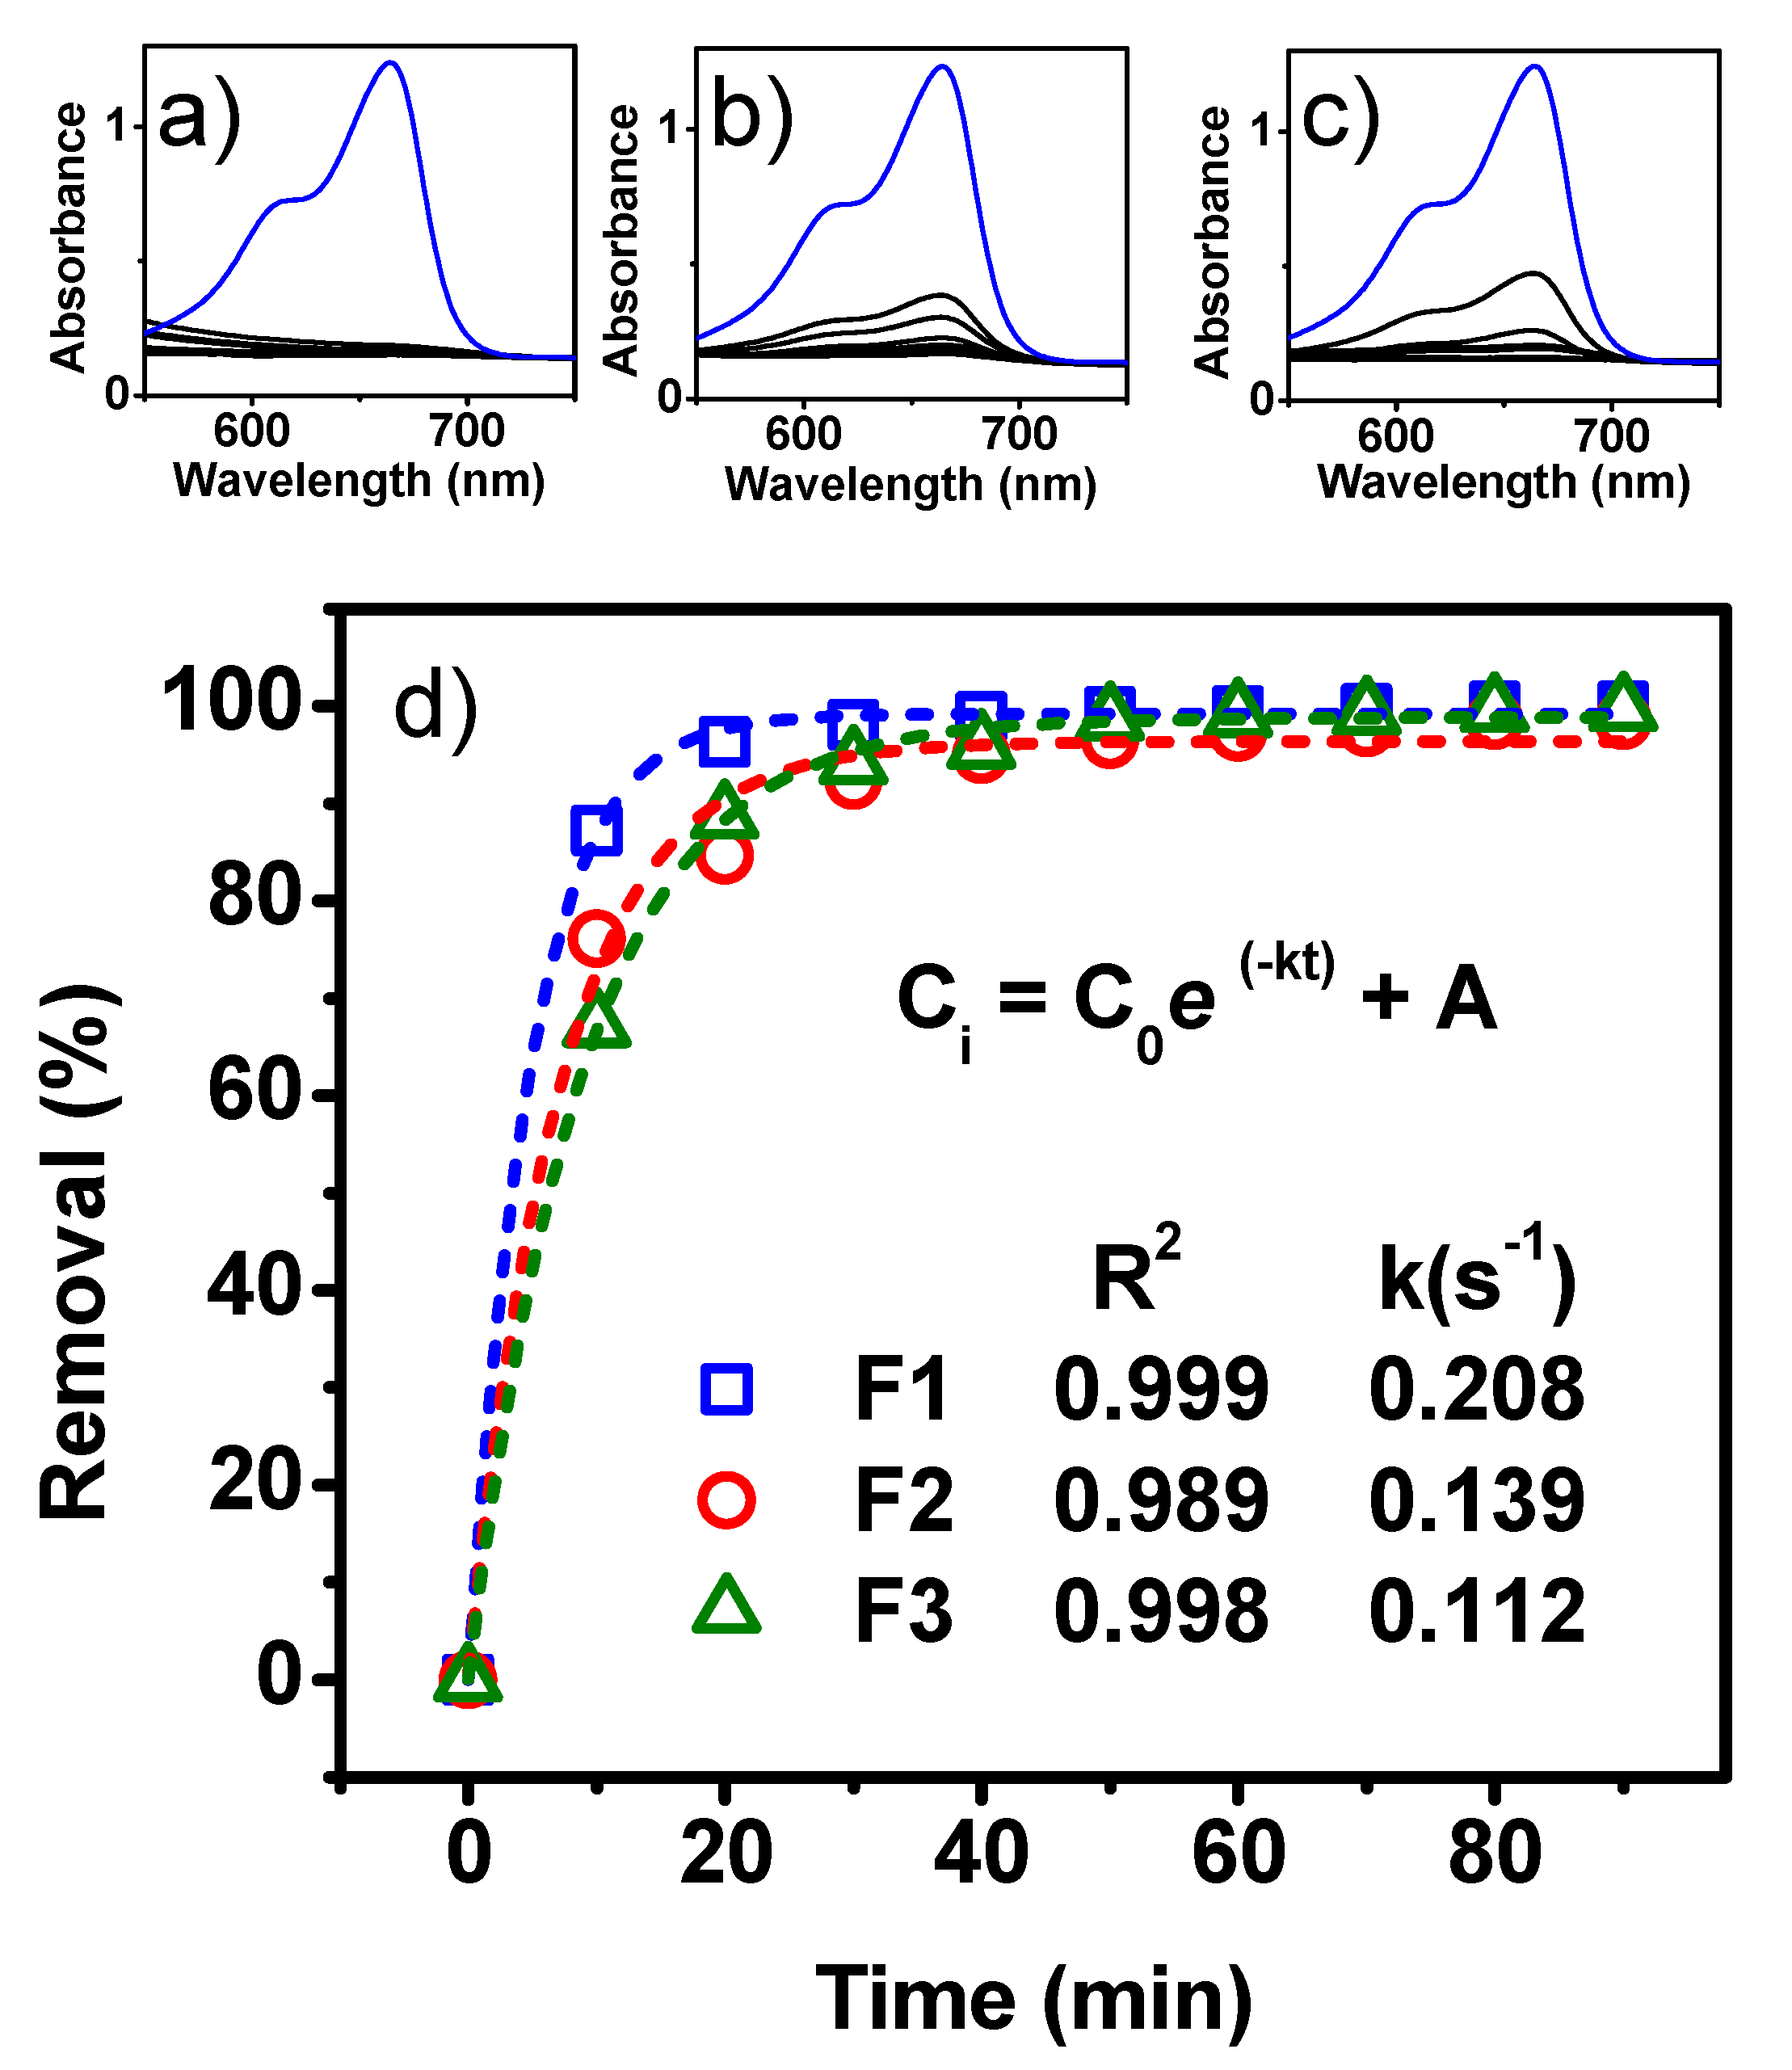
3.7. Evaluation of Water Flow Rate

By regulating the flow, the residence time of the fluid in the filter is altered, which may result in an increase in the removal efficiency. Figure 9 shows the results obtained by varying the fluid flow to the filter inlet. Figure 9a, b and c shows the UV-Vis spectra of methylene blue for flows of 3 (F1), 5 (F2) and 9 mL/s (F3), respectively. In all cases, the absorption band of methylene blue decreases rapidly. This happens faster as the flow is decreased. Thus, when the flow was 3 mL/s, the first spectrum did not show the dye absorption band, suggesting a high removal. Figure 9d shows the removal curves for the three flows. The total removal of the three evaluated flows are similar. The flows of 5 and 9 mL/s show similar behavior, with the first flow being slightly more efficient. When the flow was 3 mL/s, it is observed that in the first measurement, a removal of approximately 87% was obtained. After 30 min, 98% methylene blue removal was achieved. After this time, removal continued slowly, reaching an efficiency close to 100%. This flow rate gave the best result, as it increases the contact time of the CT-Sspp and the fluid, thereby significantly increasing the removal rate of methylene blue.

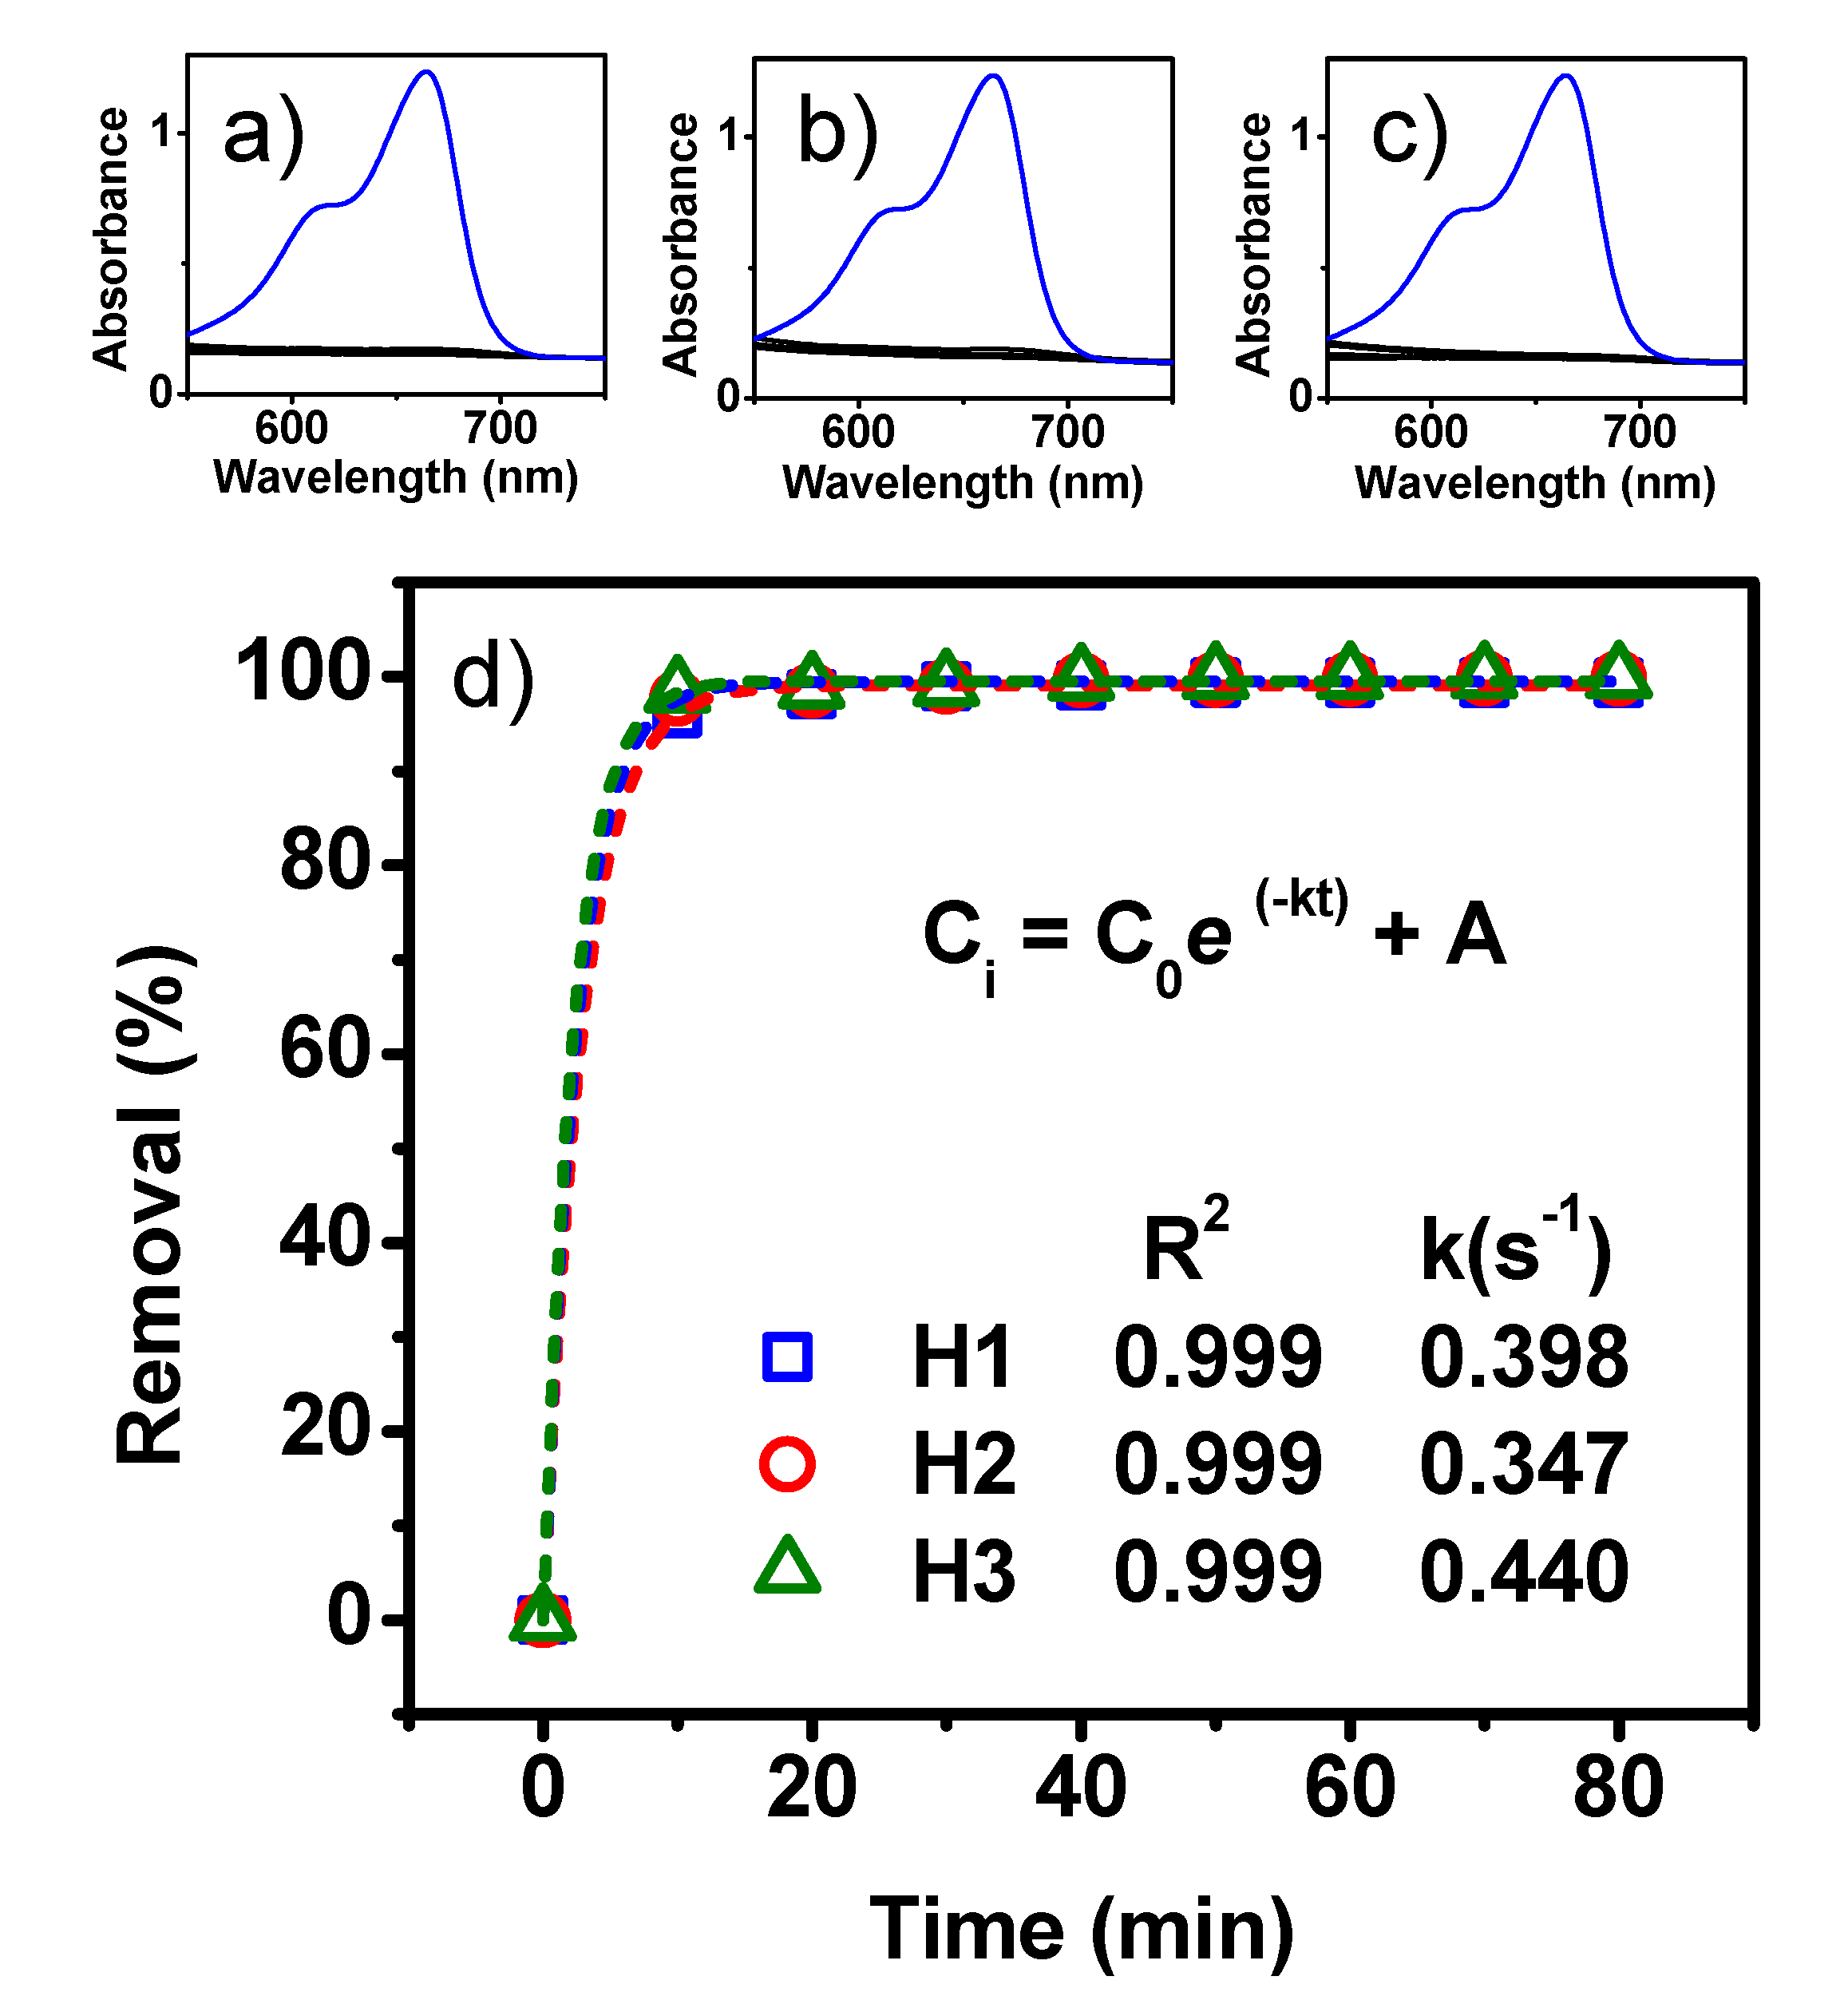
3.8. Evaluation of Sargassum spp. Humidity in the Filters

The potential of CT-Sspp to remove contaminants such as methylene blue is demonstrated above. However, maximum removal is obtained after 20 to 30 min, meaning that in the first 30 min, the water still contains a considerable amount of the dye. Therefore, improving the efficiency of the system in the initial phase would be beneficial. Detailed analysis shows that the time of residence inside the filter was very short. As the experiment proceeds, the CT-Sspp expands as it absorbs the liquid, leading to an increase in residence time. In some cases, the outlet duct actually became plugged. Therefore, the CT-Sspp was moistened before being placed in the filter.
Figure 10 shows the results for the different humidity values of the CT-Sspp in dye removal. Figure 10a, b and c shows the UV-Vis spectra for humidity of H1 = 20 wt%, H2 = 30 wt% and H3 = 50 wt%, respectively. In all three cases, the absorption band of methylene blue disappears after 10 min and remains unchanged until 80 min. Figure 10d shows the removal curves for the three cases, showing similar patterns to those seen in the spectra. The first measurement, after 10 min, sees a 98% removal, increasing to slightly more than 99%. As there was no significant difference between the three humidity values, it was decided to moisten the CT-Sspp at only 20 wt%. In this way, a high degree/rate/amount of methylene blue was removed from the earliest stages of the process.

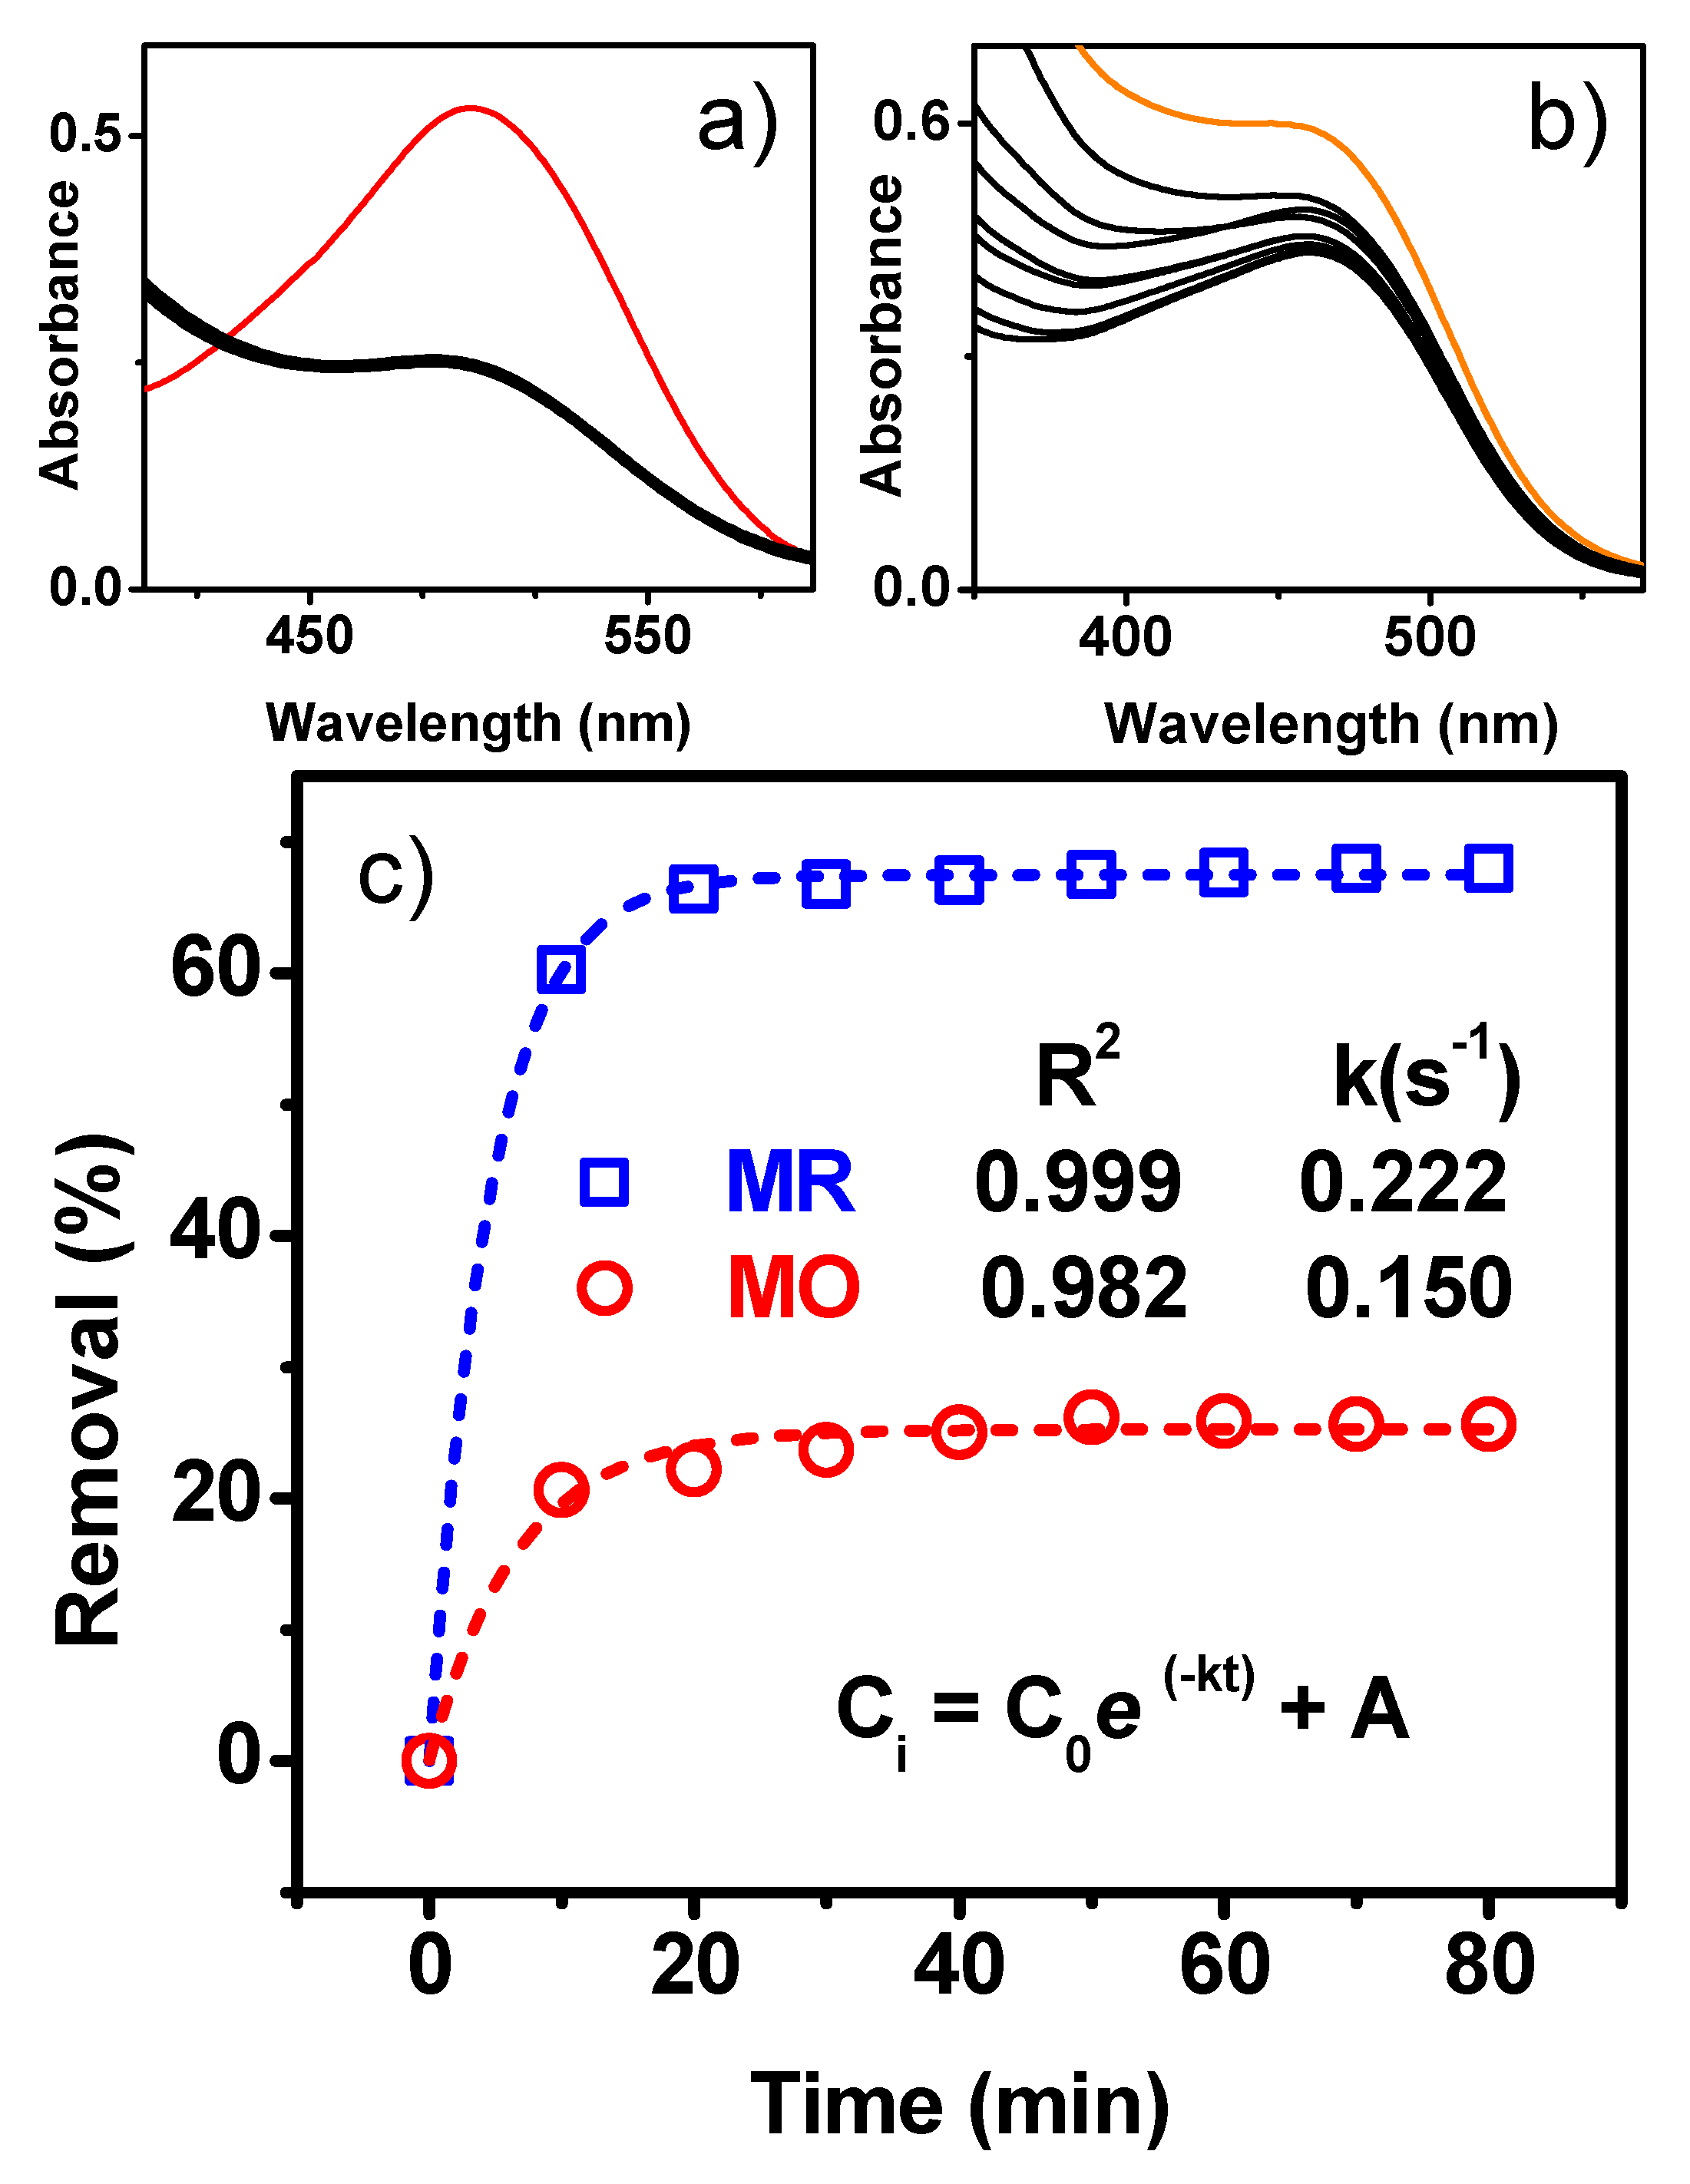
3.9. Removal of Methyl Orange and Methyl Red

Once the ideal parameters and conditions were established for methylene blue removal, methyl orange and methyl red removal was considered. The results of both are shown in Figure 11. Figure 11a shows the methyl red UV-Vis spectra recorded every 10 min. This dye has an absorption band at 400 nm. There is a significant decrease in the intensity of the absorption band after the first sample, which means that a significant amount of the dye was removed by the CT-Sspp. However, in subsequent samples, there are no significant changes to the spectra, suggesting that dye removal had stopped. This may be due to saturation in the removal capacity of the CT-Sspp. Figure 11b shows the UV-Vis spectra for methyl orange samples. In this case, the absorption band of this dye is at 465 nm. In the first samples, the absorption band decreases slowly over time. In the final samples, there are insignificant changes in the spectra, indicating a halt in the dye removal process. Figure 11c shows the removal curves for methyl red and methyl orange obtained from the UV-Vis data. In the case of methyl red, a 60% removal is observed in the first 10 min. Subsequently, only small changes are observed, reaching a total removal of approximately 68%. As regards methyl orange, a slow absorption is observed for the first 30 min. Subsequently, no significant changes were observed, achieving only 25% removal. The rate constants were 0.222 and 0.15 s−1 for methyl red and orange, respectively. These results are in agreement with the observations of the UV-Vis spectra and demonstrate the ability of CT-Sspp to remove this kind of dye. However, a complete removal of methyl red and methyl orange is not possible as they are azo dyes and early saturation of the biosorbent may occur [37]. Although complete elimination of methyl orange was not achieved (25%), the results are important, since this dye is difficult to eliminate from aqueous solutions due to its high solubility. The same percentage of methylene dye removal (25%) is reported elsewhere [38], after 48 and 24 h, using pure alginate and alginate combined with TiO2 photocatalyst, respectively. Maximum elimination (40% and 100%, respectively) was achieved after 96 h. On the other hand, Tabaraki and Sadeghinejad [39] reported the removal of 13.25% of this dye, using Sargassum ilicifolium as biosorbent. Therefore, the filtration system described in this paper is seen to be simple, fast, efficient and competitive for a persistently high removal of these dyes. For methyl red, there are no reports using similar removal methods.
In Figure 12, the FTIR spectra of the CT-Sspp is compared with its spectra after the removal of the dyes studied. Five different zones are marked to make accurate comparisons of the observed chemical structure changes in the functional groups’ vibrations. In the first zone, a major change in the hydroxyl band is seen at 3300 cm−1, that is assigned to O–H symmetric vibration, since the intensity is reduced, and the band is wider. This indicates that hydrogen bonding between any of these dyes and CT-Sspp is the principal mechanism for the bio-absorption recorded. There is also a change in the intensity of the band present at 1615 cm−1 in zone II (its intensity is reduced). This indicates a contribution in the dye uptake by charge interaction from a donor-accepting group, e.g., the possible interaction between the partially negative charge in the carboxyl groups from Sspp and the positive charge from amine/sulfate/carboxylic groups present in the dyes. This interaction is confirmed by observing the changes in the bands in zone III and zone IV. In zone IV, it is observed that the band assigned to C–OH located at 1023 cm−1 decreased, since the carboxylic group is now negatively charged. In zone III, there is an increase in the assigned stretching absorption band at 1410 cm−1 from the combined interaction of C–O and O–H, indicating that the interaction from the carbonyl group is higher. Additional confirmation for hydrogen bonding is seen in zone V, where the band at 872 cm−1 assigned to an OH–O deformation out of plane increased from this kind of interaction. With the charge interaction and hydrogen bonding mechanism that has been previously proposed [31], a scheme of how the dyes can interact with the polysaccharide structure of CT-Sspp is shown in Scheme 2.
SEM images were obtained to understand the impact of the dyes on the CT-Sspp. The changes in Sspp morphology are generally due to the breaking of the cross-links between the dyes and the negatively charged chemical groups of the cell wall. Figure 13a shows the SEM image of the CT-Sspp sample loaded with methylene blue, where the methylene blue molecules attach to the CT-Sspp surface and fill the pores. Figure 13b shows the CT-Sspp sample loaded with methyl orange, where the surface became rough with numerous agglomerates. Some methyl orange crystals were even observed. The surface of the sample is similar in appearance to the sample before loading. However, this surface change indicates that methyl orange molecules were sorbed by the CT-Sspp. After sorption, the methyl red molecules remain as aggregates on the CT-Sspp surface (Figure 13c). Like the CT-Sspp sample with methyl orange, the surface shows similar characteristics to a sample before loading with methyl red.
The physicochemical parameters and the removal percentages obtained in the removal of the dyes are summarized in Table 1. It can be seen that the efficiency and/or the rate of methylene blue removal was improved with the parameters implemented, up to a value of almost 100%, in a short period of time. As regards methyl orange and methyl red, only one experiment was carried out, using those parameters giving the best results for methylene blue.

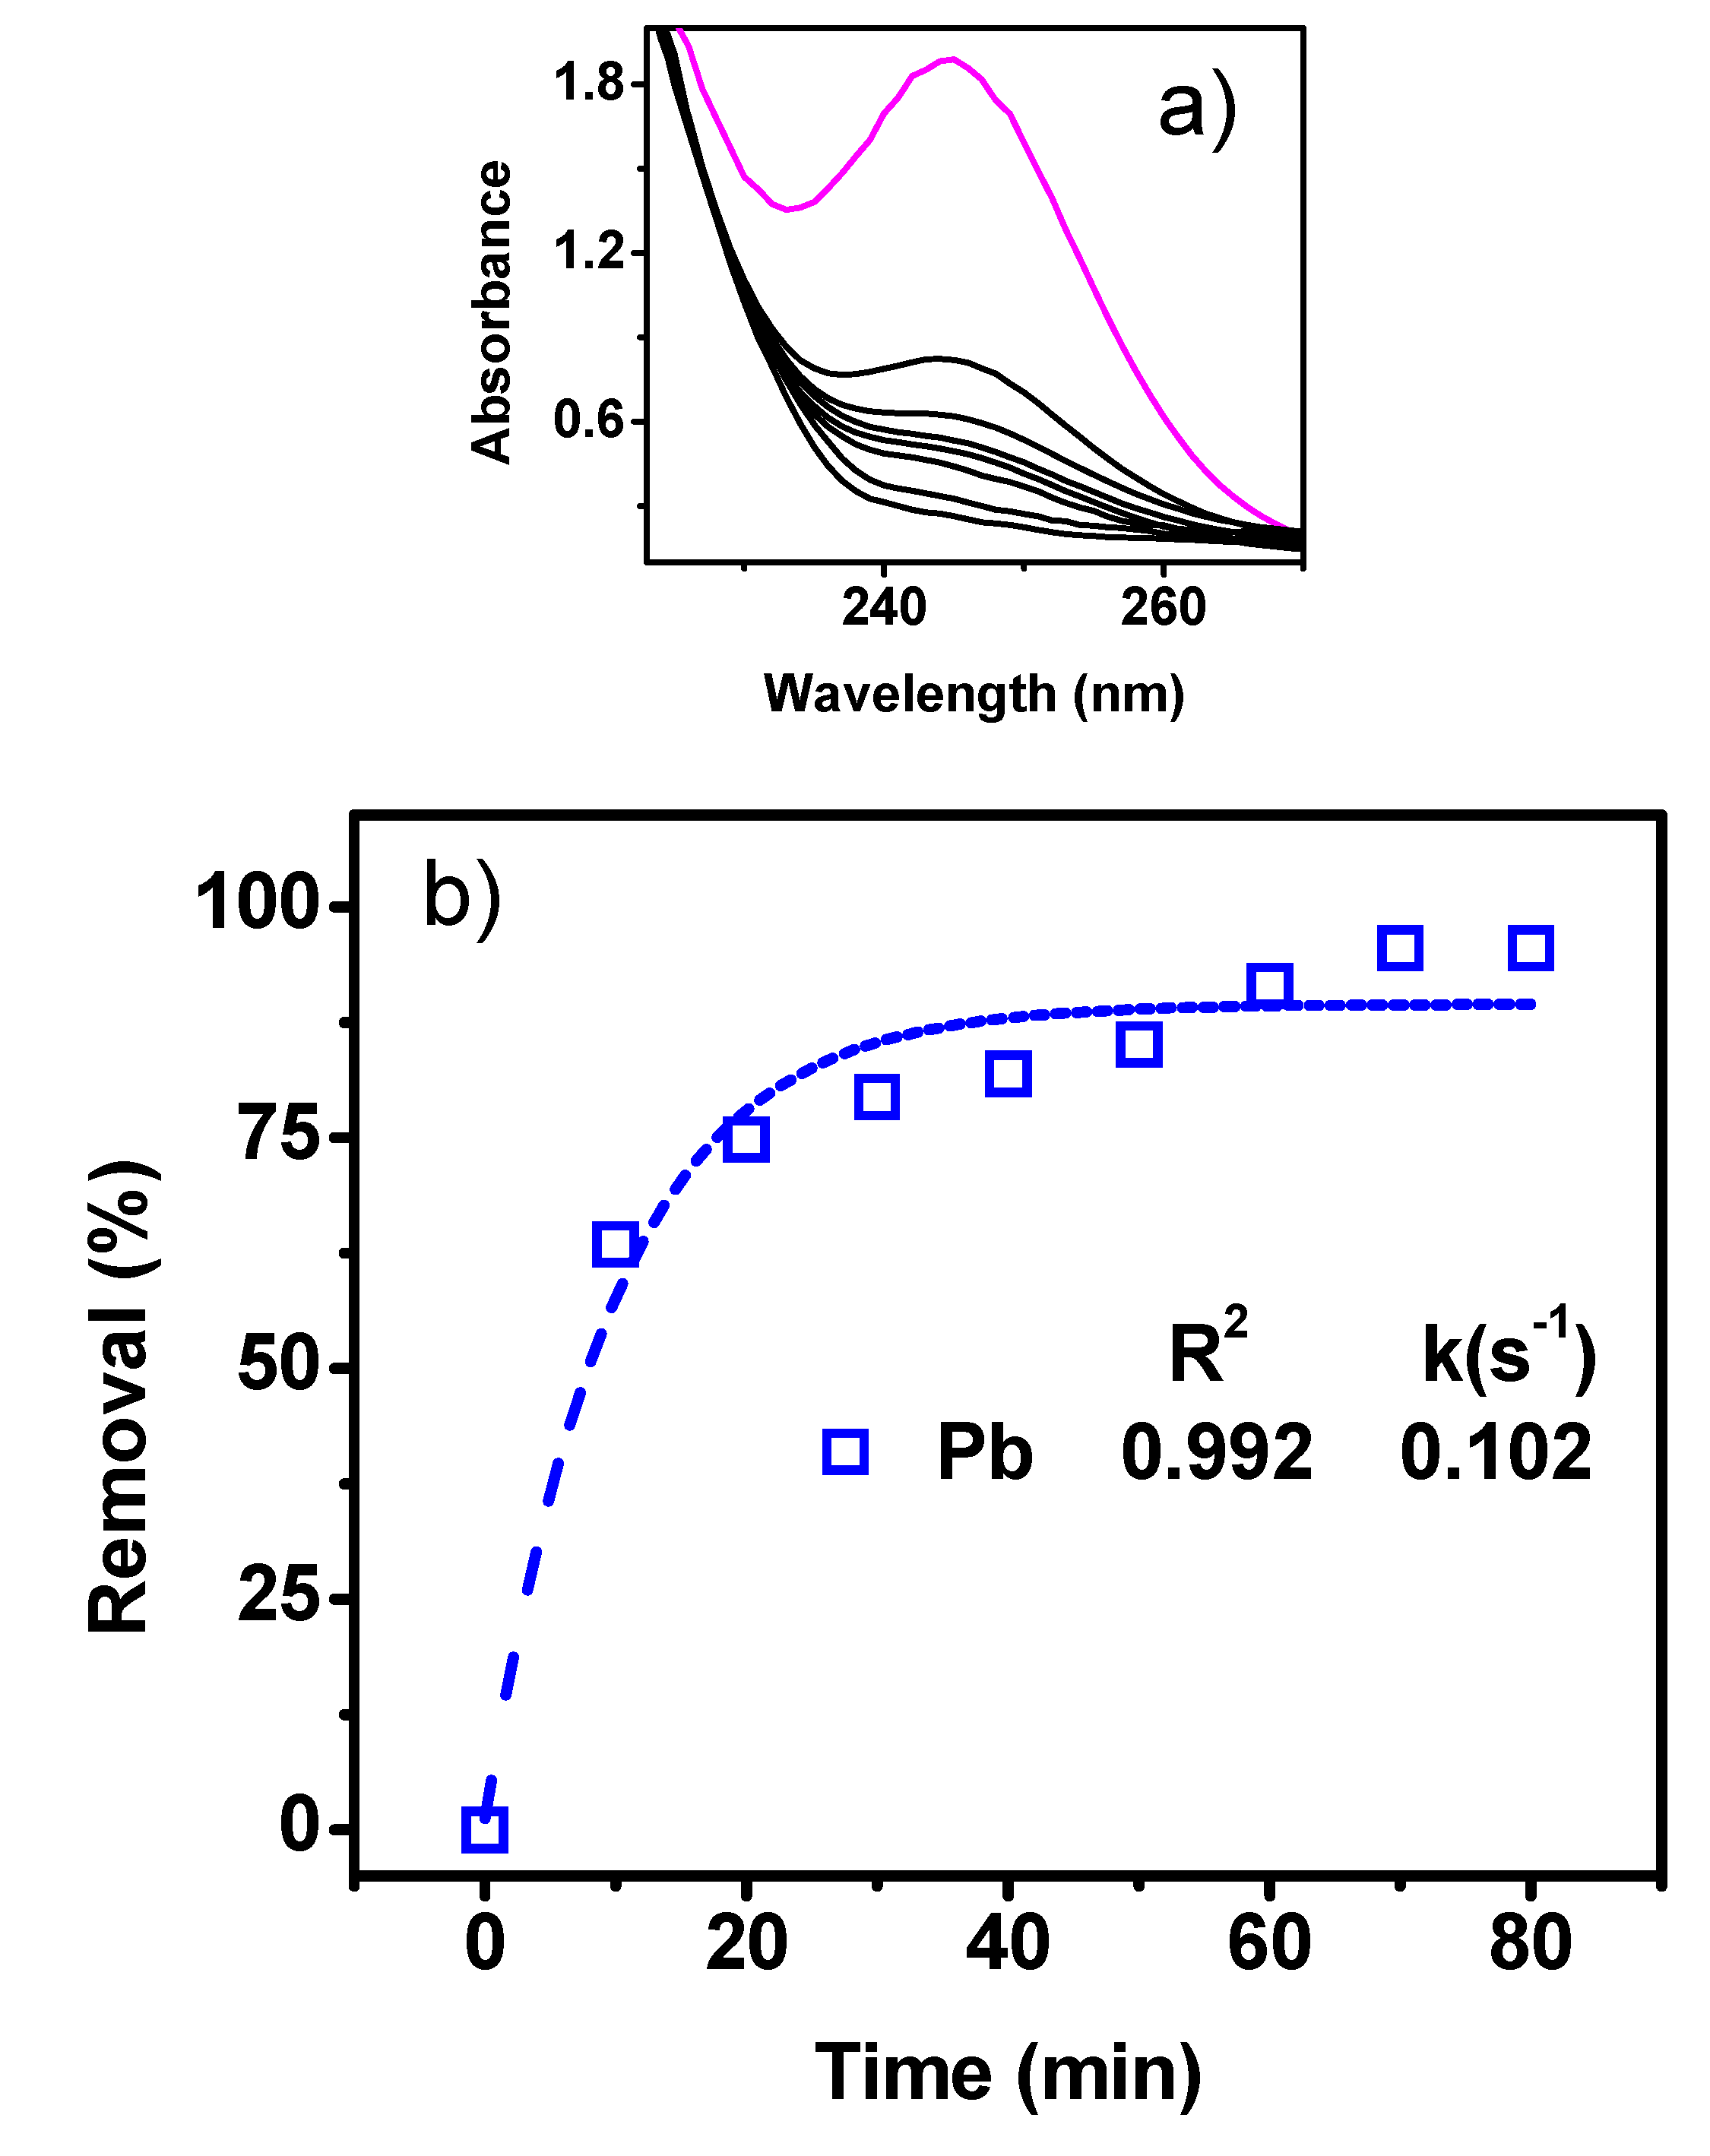
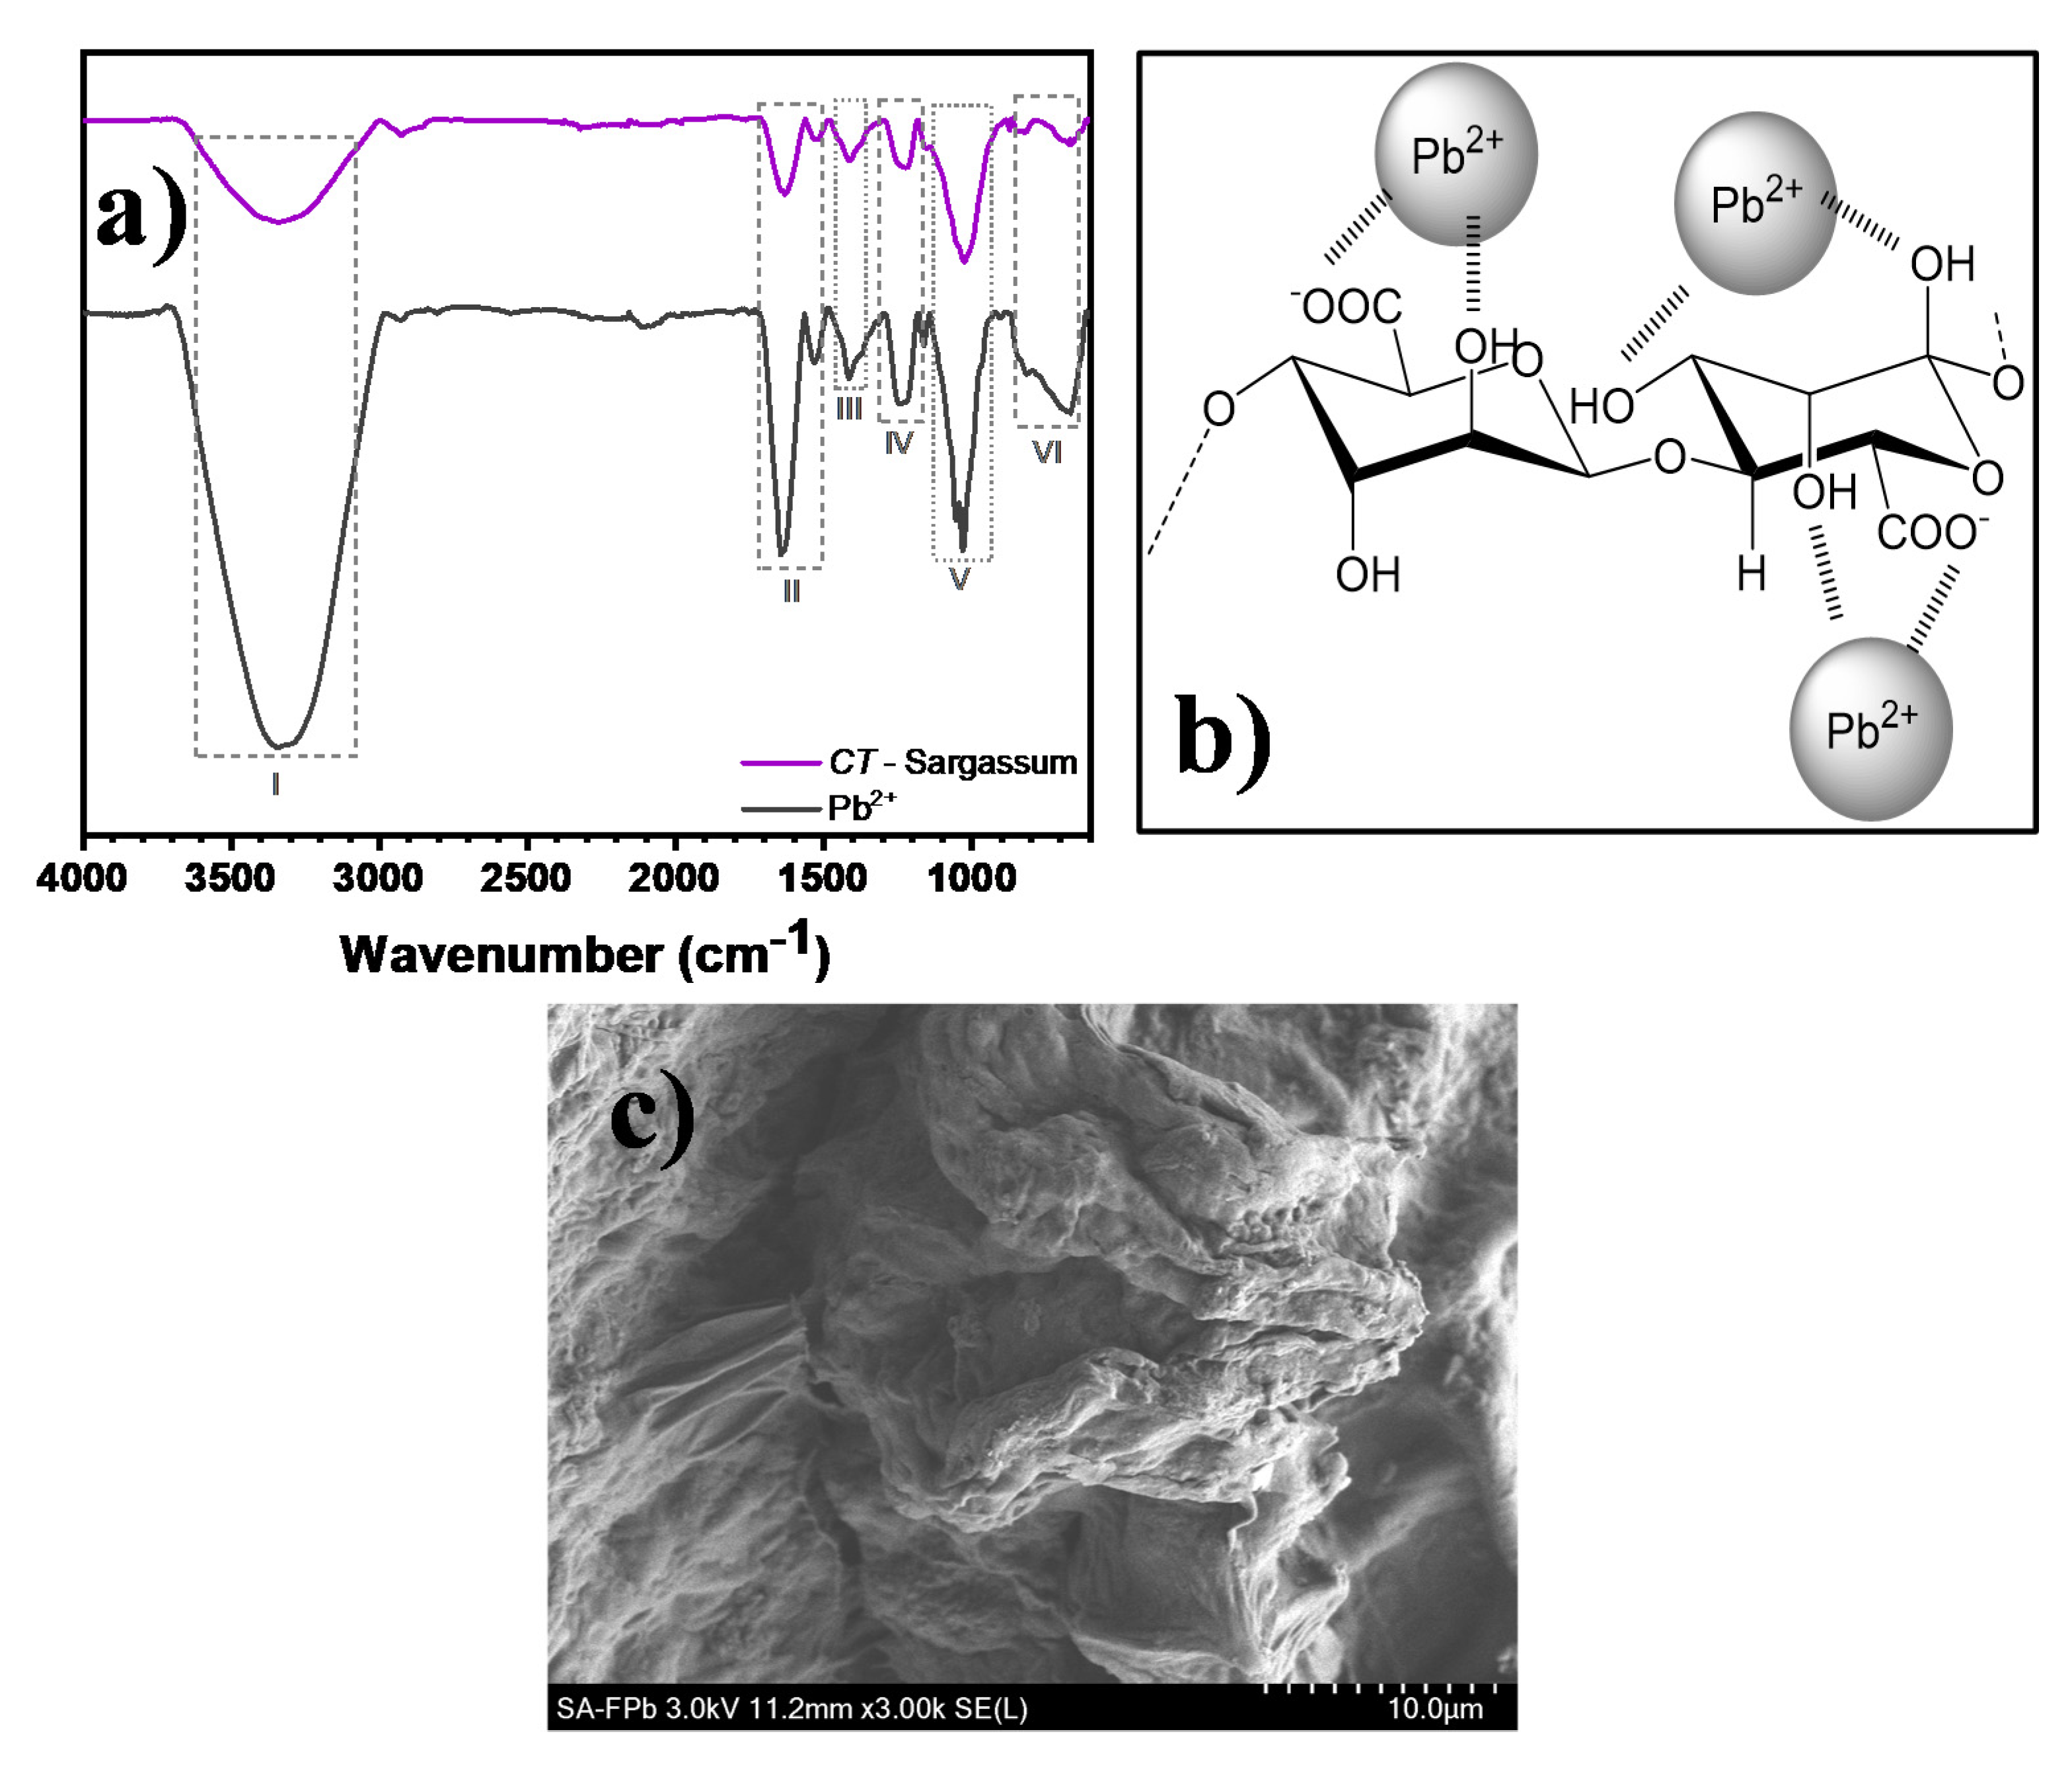
3.10. Removal of Pb Ions

Figure 14 shows the results obtained for the removal of Pb ions. In Figure 14a, the lead compound is shown on the UV-Vis spectra as a band at 245 nm. In the first spectrum, there was a rapid decrease in the intensity of the band. Subsequently, the decrease in band intensity continues at a slower rate. After 80 min, the spectra did not show significant changes. Figure 14b shows the removal curves obtained from the UV-Vis spectra. The removal percentage after 40 min is close to 90%. Lead removal continues, reaching 95% after 80 min. The rate constant obtained from this curve was 0.068 s−1. These results demonstrate the ability of CT-Sspp to remove metals such as lead.
Figure 15a shows the FTIR analysis of the CT-Sspp after lead (II) ions removal. Zones of interest are marked by dashed rectangles. Significant changes are seen, specifically in zone I, zone II and zone IV. First, the change in zone I is from the O–H symmetric stretching band, which is augmented and slightly sharper. This is because of the interaction between the CT-Sspp and lead (II), in which chelation is now the main process [40]. This is confirmed when zone II to zone V are analyzed: the interactions from diverse carbonyl vibration modes are being affected by chelation. In zone II, the intensity of the C=O band at 1615 cm−1 is increased, indicating a change from a donor-accepting group (e.g., a proton from Pb2+). This effect is also accompanied by an increase on the stretching band of C–O from zone II, at 1410 cm−1. An increase on the asymmetric stretching vibration band from C–O, at 1219 cm−1, and an increase from the band located at 1023 cm−1 assigned to C–OH stretch from the polysaccharide cyclic structure in the zones III and IV respectively, is also observed. All changes seen in the vibrational modes are related to the electrostatic interaction. Finally, in zone VI, the band at 672 cm−1, which comes from the interaction between the organic molecule and lead, is wider and has higher intensity. This type of interaction has been seen in the synthesis of lead nanoparticles [41], and is related to Pb–O asymmetric bending vibration (Figure 15b).
Figure 15c shows a SEM image of CT-Sspp after lead removal. When the CT-Sspp samples were exposed to the metal solution (Pb), the structure continuity and the free area between the intracellular spaces were broken. In addition, morphological changes were clearly seen in the cell wall matrix, such as shrinking, sticking of layers and a tendency for the cell wall to be deformed. Similar changes in the cell wall matrix of different Sargassum spp. biomass when they were enriched with ions via biosorption have been observed by other authors [42,43].

3.11. Comparison of Substance Removal using Sargassum spp.

Table 2 shows a comparison of the results obtained in this work with those reported elsewhere. The species of Sargassum used and the removal percentages are included. As can be seen in Table 2, all the previous works concern static systems, and to the best of the authors’ knowledge, this is the first study on this kind of dynamic system, where a scalable filter is proposed as a device for the removal of toxic substances. It is therefore difficult to compare the results of the various other works. An increase in the contact area of the filter produces a later breakthrough time. This produces greater uptake capacity, since the pollutant has a higher residence time with the adsorbate and has sufficient time to diffuse to the active moieties, responsible for the removal process. On the other hand, many other factors may influence the removal capacity, for example, composition, functionalization and modification treatments of Sargassum spp.

4. Conclusions

This work describes the evaluation of six variables to obtain the ideal parameters for a filtration system to remove methylene blue, methyl orange, methyl red and lead ions using chemically treated Sargassum spp. Unlike methods based on acids or alkalis, the hydrogen peroxide treatment is easy to handle, has great availability and is environmentally friendly since it decomposes in water and oxygen. The variables analyzed were the grinding depth, mass, filter area, flow rate, number of layers and relative moisture of the Sargassum spp. used. The use of the Sargassum spp. in an effective, economic filtration system serves as an incentive to remove it adequately from places where it is currently causing severe environmental problems. The filtration system is a clean, safe and environmentally friendly process. A decrease in the particle size of CT-Sargassum spp. did not show better results, as the filter became clogged due to the absorption of water by the CT-Sargassum spp. Increasing the mass of CT-Sargassum spp. used in the filter gave greater removal at a faster rate. The diameter of the filter used and the water flow were also evaluated. In the first case, the highest removal was obtained when a 1 inch diameter filter was used. In the second case, it was observed that as the flow decreases, the removal rate and efficiency increase: a flow of 3 mL/s was found to be the optimum rate of flow. With respect to the number of layers (plates), as expected, removal was greater with an increased number of adsorption layers. In this work, a maximum of 4 layers were used. The experiments performed show that the Sargassum spp.-based water filter system was efficient. The efficiency and the rate of removal were different for each substance. The total removal of methylene blue, methyl red and methyl orange was 99%, 68% and 25%, respectively. Regarding lead ions, the removal percentage obtained was 95%. These results demonstrate the ability of CT-Sargassum spp. to trap and remove specific water-soluble toxic substances from water. This kind of dynamic biosorbent filter system is therefore an eco-friendly, scalable and cost-effective option for domestic, agricultural and industrial purposes. The future work of the present study is to evaluate the removal of pollutants using real samples taken from effluents of rivers, lakes or seas, which contain various pollutants at different concentrations.

Author Contributions

Conceptualization—J.L.L.-M., R.S., G.A.M., R.E., A.R.H.-M. and M.E.; Funding acquisition—R.S.; Investigation—J.H.-C.; Methodology—J.L.L.-M., G.A.M., R.E., A.R.H.-M. and M.E.; Project administration—M.E.; Resources—M.E.; Supervision—M.E.; Validation—J.L.L.-M., G.A.M., R.E., A.R.H.-M. and M.E.; Visualization—J.L.L.-M. and G.A.M.; Writing—original draft, J.L.L.-M., R.S., G.A.M., R.E., A.R.H.-M. and M.E.; Writing—review and editing, R.S., R.E. and M.E. All authors have read and agreed to the published version of the manuscript.

Funding

This research was funded by the Consejo Nacional de Ciencia y Tecnología (CONACYT) as part of the Centro Mexicano de Innovación en Energía del Océano (CEMIE-Océano).

Acknowledgments

The authors are grateful to SENER-CONACyT for the funding of this research through the CeMIE-Oceano project. Thanks also go to the Laboratorio Nacional de Caracterización de Materiales “LaNCaM” at the CFATA-UNAM. Thanks to technicians Bernardino Rodríguez-Morales, Angel Luis Rodríguez-Morales and Gerardo Fonseca of the UNAM Juriquilla Campus for their technical support; to Brenda Contreras for support in the infrared spectroscopy characterization; to Karla Irene Melo-Guerrero and Teresita de Jesus Guzman-Arias for their participation in the summer research supported by the “Delfín Program under the supervision of A.R Hernandez-Martinez; to Inés Hernández and Bibiana González for their participation in the project during the research stay, under the supervision of J. Luis López-Miranda. Thanks to the Servicio Académico de Monitoreo Meteorológico y Oceanográfico (SAMMO) of the Academic Unit of Reef Systems Puerto Morelos (UASAPM) of the ICML of UNAM, Edgar Escalante Mancera, Miguel Ángel Gómez Reali and Maria Guadalupe Barba Santos, for collecting and sending the Sargasso samples.

Conflicts of Interest

The authors declare no conflict of interest. The funders had no role in the design of the study; in the collection, analyses, or interpretation of data; in the writing of the manuscript, or in the decision to publish the results.

References

  1. Lachheb, H.; Puzenat, E.; Houas, A.; Ksibi, M.; Elaloui, E.; Guillard, C.; Herrmann, J.-M. Photocatalytic degradation of various types of dyes (Alizarin S, Crocein Orange G, Methyl Red, Congo Red, Methylene Blue) in water by UV-irradiated titania. Appl. Catal. B 2002, 39, 75–90. [Google Scholar] [CrossRef]
  2. Liu, S.; Pan, G.; Yang, H.; Cai, Z.; Zhu, F.; Ouyang, G. Determination and elimination of hazardous pollutants by exploitation of a Prussian blue nanoparticles-graphene oxide composite. Anal. Chim. Acta. 2019, 1054, 17–25. [Google Scholar] [CrossRef]
  3. Zhang, S.; Li, B.; Wang, X.; Zhao, G.; Hu, B.; Lu, Z.; Wen, T.; Chen, J.; Wang, X. Recent developments of two-dimensional graphene-based composites in visible-light photocatalysis for eliminating persistent organic pollutants from wastewater. Chem. Eng. J. 2020, 390, 124642. [Google Scholar] [CrossRef]
  4. Ferdowsi, M.; Ramirez, A.A.; Jones, J.P.; Heitz, M. Elimination of mass transfer and kinetic limited organic pollutants in biofilters: A review. Int. Biodeterior. Biodegrad. 2017, 119, 336–348. [Google Scholar] [CrossRef]
  5. Abd El-Rahim, W.M.; Moawad, H.; Azeiz, A.Z.A.; Sadowsky, M.J. Optimization of conditions for decolorization of azo-based textile dyes by multiple fungal species. J. Biotechnol. 2017, 260, 11–17. [Google Scholar] [CrossRef] [PubMed]
  6. Benkhaya, S.; Mrabet, S.; El Harfi, A. A review on classifications, recent synthesis and applications of textile dyes. Inorg. Chem. Commun. 2020, 115, 107891. [Google Scholar] [CrossRef]
  7. Muniyasamy, A.; Sivaporul, G.; Gopinath, A.; Lakshmanan, R.; Altaee, A.; Achary, A.; Chellam, P.V. Process development for the degradation of textile azo dyes (mono-, di-, poly-) by advanced oxidation process-Ozonation: Experimental & partial derivative modelling approach. J. Environ. Manage. 2020, 265, 110397. [Google Scholar] [CrossRef] [PubMed]
  8. Brown, M.A.; De Vito, S.C. Predicting azo dye toxicity. Crit. Rev. Env. Sci. Technol. 1993, 23, 249–324. [Google Scholar] [CrossRef]
  9. Noman, M.; Shahid, M.; Ahmed, T.; Niazi, M.B.K.; Hussain, S.; Song, F.; Manzoor, I. Use of biogenic copper nanoparticles synthesized from a native Escherichia sp. as photocatalysts for azo dye degradation and treatment of textile effluents. Environ. Pollut. 2020, 257, 113514. [Google Scholar] [CrossRef] [PubMed]
  10. Đurđić, K.I.; Ostafe, R.; Đelmaš, A.Đ.; Popović, N.; Schillberg, S.; Fischer, R.; Prodanović, R. Saturation mutagenesis to improve the degradation of azo dyes by versatile peroxidase and application in form of VP-coated yeast cell walls. Enzym. Microb. Technol. 2020, 136, 109509. [Google Scholar] [CrossRef] [PubMed]
  11. Semião, M.A.; Haminiuk, C.W.I.; Maciel, G.M. Residual diatomaceous earth as a potential and cost effective biosorbent of the azo textile dye Reactive Blue 160. J. Environ. Chem. Eng. 2020, 8, 103617. [Google Scholar] [CrossRef]
  12. Jadhav, J.; Parshetti, G.; Kalme, S.; Govindwar, S.P. Decolourization of azo dye methyl red by Saccharomyces cerevisiae MTCC 463. Chemosphere 2007, 68, 394–400. [Google Scholar] [CrossRef] [PubMed]
  13. Rożek, P.; Król, M.; Mozgawa, W. Lightweight geopolymer-expanded glass composites for removal of methylene blue from aqueous solutions. Ceram. Int. 2020, 46, 19785–19791. [Google Scholar] [CrossRef]
  14. Beh, J.H.; Lim, T.H.; Lew, J.H.; Lai, J.C. Cellulose nanofibril-based aerogel derived from sago pith waste and its application on methylene blue removal. Int. J. Biol. Macromol. 2020, 160, 836–845. [Google Scholar] [CrossRef] [PubMed]
  15. Geed, S.R.; Samal, K.; Tagade, A. Development of adsorption-biodegradation hybrid process for removal of methylene blue from wastewater. J. Environ. Chem. Eng. 2019, 7, 103439. [Google Scholar] [CrossRef]
  16. Huy, D.H.; Seelen, E.; Liem-Nguyen, V. Removal mechanisms of cadmium and lead ions in contaminated water by stainless steel slag obtained from scrap metal recycling. J. Water Process. Eng. 2020, 36, 101369. [Google Scholar] [CrossRef]
  17. Shi, L.; Wang, N.; Hu, X.; Yin, D.; Wu, C.; Liang, H.; Cao, W.; Cao, H. Acute toxic effects of lead (Pb2+) exposure to rare minnow (Gobiocypris rarus) revealed by histopathological examination and transcriptome analysis. Environ. Toxicol. Pharmacol. 2020, 78, 103385. [Google Scholar] [CrossRef]
  18. Hu, Y.; Liu, F.; Sun, Y.; Xu, X.; Chen, X.; Pan, B.; Sun, D.; Qian, J. Bacterial cellulose derived paper-like purifier with multifunctionality for water decontamination. Chem. Eng. J. 2019, 371, 730–737. [Google Scholar] [CrossRef]
  19. Beni, A.A.; Esmaeili, A. Biosorption, an efficient method for removing heavy metals from industrial effluents: A review. Environ. Technol. Innov. 2020, 17, 100503. [Google Scholar] [CrossRef]
  20. Bazzazzadeh, R.; Soudi, M.; Valinassab, T.; Moradlou, O. Kinetics and equilibrium studies on biosorption of hexavalent chromium from leather tanning wastewater by Sargassum tenerrimum from Chabahar-Bay Iran. Algal Res. 2020, 48, 101896. [Google Scholar] [CrossRef]
  21. Rubin, E.; Rodriguez, P.; Herrero, R.; Cremades, J.; Barbara, I.; Sastre de Vicente, M.E. Removal of methylene blue from aqueous solutions using as biosorbent Sargassum muticum: An invasive macroalga in Europe. J. Chem. Technol. Biotechnol. 2005, 80, 291–298. [Google Scholar] [CrossRef] [Green Version]
  22. Thompson, T.; Young, B.; Baroutian, S. Pelagic Sargassum for energy and fertiliser production in the Caribbean: A case study on Barbados. Renew. Sust. Energ. Rev. 2020, 118, 109564. [Google Scholar] [CrossRef]
  23. de Souza Coração, A.C.; dos Santos, F.S.; Duarte, J.A.D.; Lopes-Filho, E.A.P.; de Paula, J.C.; Rocha, L.M.; Krepsky, N.; Fiaux, S.B.; Teixeira, V.L. What do we know about the utilization of the Sargassum species as biosorbents of trace metals in Brazil? J. Environ. Chem. Eng. 2020, 8, 103941. [Google Scholar] [CrossRef]
  24. Júnior, W.N.; Silva, M.; Vieira, M. Competitive fixed-bed biosorption of Ag (I) and Cu (II) ions on Sargassum filipendula seaweed waste. J. Water Process. Eng. 2020, 36, 101294. [Google Scholar] [CrossRef]
  25. Vijayaraghavan, K.; Teo, T.T.; Balasubramanian, R.; Joshi, U.M. Application of Sargassum biomass to remove heavy metal ions from synthetic multi-metal solutions and urban storm water runoff. J. Hazard. Mater. 2009, 164, 1019–1023. [Google Scholar] [CrossRef]
  26. Johnson, D.R.; Ko, D.S.; Franks, J.S.; Moreno, P.; Sanchez-Rubio, G. The Sargassum Invasion of the Eastern Caribbean and Dynamics of the Equatorial North Atlantic. In Proceedings of the 65th Gulf and Caribbean Fisheries Institute, Santa Marta, Colombia, 5–9 November 2013; pp. 102–103. [Google Scholar]
  27. Silva, R.; Mendoza, E.; Mariño-Tapia, I.; Martínez, M.L.; Escalante, E. An artificial reef improves coastal protection and provides a base for coral recovery. J. Coast. Res. 2016, 75, 467–471. [Google Scholar] [CrossRef]
  28. van Tussenbroek, B.I.; Arana, H.A.H.; Rodríguez-Martínez, R.E.; Espinoza-Avalos, J.; Canizales-Flores, H.M.; González-Godoy, C.E.; Barba-Santos, M.G.; Vega-Zepeda, A.; Collado-Vides, L. Severe impacts of brown tides caused by Sargassum spp. on near-shore Caribbean seagrass communities. Mar. Pollut. Bull. 2017, 122, 272–281. [Google Scholar] [CrossRef]
  29. Wang, M.; Hu, C.; Barnes, B.B.; Mitchum, G.; Lapointe, B.; Montoya, J.P. The great Atlantic Sargassum belt. Sci. 2019, 365, 83–87. [Google Scholar] [CrossRef]
  30. Chávez, V.; Uribe-Martínez, A.; Cuevas, E.; Rodríguez-Martínez, R.E.; van Tussenbroek, B.I.; Francisco, V.; Estévez, M.; Celis, L.B.; Monroy-Velázquez, L.V.; Leal-Bautista, R.J.W. Massive Influx of Pelagic Sargassum spp. on the Coasts of the Mexican Caribbean 2014–2020: Challenges and Opportunities. Water 2020, 12, 2908. [Google Scholar]
  31. Hannachi, Y.; Hafidh, A. Biosorption potential of Sargassum muticum algal biomass for methylene blue and lead removal from aqueous medium. Int. J. Environ. Sci. Technol. 2020, 17, 3875–3890. [Google Scholar] [CrossRef]
  32. Chen, X.; Zhang, R.; Li, Y.; Li, X.; You, L.; Kulikouskaya, V.; Hileuskaya, K. Degradation of polysaccharides from Sargassum fusiforme using UV/H2O2 and its effects on structural characteristics. Carbohydr. Polym. 2020, 230, 115647. [Google Scholar] [CrossRef]
  33. Krzek, J.; Apola, A.; Stolarczyk, M.; Rzeszutko, W. Spectrophotometric determination of Pb(II), Fe(III) and Bi(III) in complexes with 1,2-diaminocyclohexane-N,N,N’,N’-tetraacetic acid (DACT). Acta Pol. Pharm. 2007, 64, 3–8. [Google Scholar]
  34. Qin, C.; Du, Y.; Xiao, L. Effect of hydrogen peroxide treatment on the molecular weight and structure of chitosan. Polym. Degrad. Stab. 2002, 76, 211–218. [Google Scholar] [CrossRef]
  35. Momeni, S.; Nabipour, I. A simple green synthesis of palladium nanoparticles with Sargassum alga and their electrocatalytic activities towards hydrogen peroxide. Appl. Biochem. Biotech. 2015, 176, 1937–1949. [Google Scholar] [CrossRef] [Green Version]
  36. Kannan, S. FT-IR and EDS analysis of the seaweeds Sargassum wightii (brown algae) and Gracilaria corticata (red algae). Int. J. Curr. Microbiol. Appl. Sci. 2014, 3, 341–351. [Google Scholar]
  37. Singh, P.K.; Singh, R.L. Bio-removal of azo dyes: A review. Int. J. Appl. Sci. Biotechnol. 2017, 5, 108–126. [Google Scholar] [CrossRef]
  38. Shen, T.; Jiang, C.; Wang, C.; Sun, J.; Wang, X.; Li, X. A TiO2 modified abiotic–biotic process for the degradation of the azo dye methyl orange. Rsc Adv. 2015, 5, 58704–58712. [Google Scholar] [CrossRef]
  39. Tabaraki, R.; Sadeghinejad, N. Biosorption of six basic and acidic dyes on brown alga Sargassum ilicifolium: Optimization, kinetic and isotherm studies. Water Sci. Technol. 2017, 75, 2631–2638. [Google Scholar] [CrossRef] [PubMed]
  40. Saldarriaga-Hernandez, S.; Hernandez-Vargas, G.; Iqbal, H.M.N.; Barceló, D.; Parra-Saldívar, R. Bioremediation potential of Sargassum sp. biomass to tackle pollution in coastal ecosystems: Circular economy approach. Sci. Total Environ. 2020, 715, 136978. [Google Scholar] [CrossRef]
  41. Arulmozhi, K.; Mythili, N. Studies on the chemical synthesis and characterization of lead oxide nanoparticles with different organic capping agents. Aip Adv. 2013, 3, 122122. [Google Scholar] [CrossRef]
  42. Raize, O.; Argaman, Y.; Yannai, S. Mechanisms of biosorption of different heavy metals by brown marine macroalgae. Biotechnol. Bioeng. 2004, 87, 451–458. [Google Scholar] [CrossRef] [Green Version]
  43. Michalak, I.; Chojnacka, K.; Marycz, K. Using ICP-OES and SEM-EDX in biosorption studies. Microchim. Acta 2011, 172, 65–74. [Google Scholar] [CrossRef] [Green Version]
  44. Esmaeili, A.; Saremnia, B.; Kalantari, M. Removal of mercury (II) from aqueous solutions by biosorption on the biomass of Sargassum glaucescens and Gracilaria corticata. Arab. J. Chem. 2015, 8, 506–511. [Google Scholar] [CrossRef] [Green Version]
  45. Seolatto, A.A.; Martins, T.D.; Bergamasco, R.; Tavares, C.R.G.; Cossich, E.S.; da Silva, E. Biosorption study of Ni2+ and Cr3+ by Sargassum filipendula: Kinetics and equilibrium. Braz. J. Chem. Eng. 2014, 31, 211–227. [Google Scholar] [CrossRef]
  46. Mahmood, Z.; Zahra, S.; Iqbal, M.; Raza, M.A.; Nasir, S. Comparative study of natural and modified biomass of Sargassum sp. for removal of Cd 2+ and Zn 2+ from wastewater. Appl. Water Sci. 2017, 7, 3469–3481. [Google Scholar] [CrossRef] [Green Version]
  47. Veit, M.T.; da Cunha Gonçalves, G.; Fagundes-Klen, M.R.; Da Silva, E.A.; Tavares, C.R.G.; Honorio, J.F. Organic leaching and metal removal with < i> Sargassum filipendula. Acta Sci. Technol. 2014, 36, 429–435. [Google Scholar] [CrossRef] [Green Version]
  48. Arumugam, S.; Tvn, P.; Krishnan, S. Removal Of Nickel And Copper From Aqueous Solution By Sargassum SP.To Remediates Metal Contaminated Industrial Effluents. Int. J. Appl. Bioeng. 2009, 3, 26–30. [Google Scholar] [CrossRef]
Scheme 1. Components of the Sargassum spp. (Sspp)-based filtration.
Jmse 08 00899 sch001
Figure 1. The Sargassum species used in this work, (a) S. fluitans and (b) S. natans.
Jmse 08 00899 g001
Figure 2. Scanning electron microscopy (SEM) images of Sargassum spp. (a) dried and (b) chemically treated (CT).
Jmse 08 00899 g002
Figure 3. Fourier Transform Infrared (FTIR) analysis of dry Sargassum spp. and CT-Sargassum spp.
Jmse 08 00899 g003
Figure 4. Evaluation of chemical modifications to Sargassum spp. in methylene blue removal: (a) and (b) Ultraviolet-Visible (UV-Vis) spectra of methylene blue using dry Sargassum spp. (DS) and CT-Sargassum spp. (CTS), respectively. (c) Methylene blue removal rate curves.
Jmse 08 00899 g004
Figure 5. Evaluation of amounts of CT-Sargassum spp. in methylene blue removal: (a,b,c) UV-Vis spectra using 1, 3 and 7 g of CT-Sargassum spp., respectively. (d) Methylene blue removal rate curves.
Jmse 08 00899 g005
Figure 6. Evaluation of mechanical processes applied to Sargassum spp. in methylene blue removal: (a,b) UV-Vis spectra using crushed (ST) and ground (SG) CT-Sargassum spp., respectively. (c) Removal curves for each condition.
Jmse 08 00899 g006
Figure 7. Evaluation of filter diameter in methylene blue removal: (a,b,c) UV-Vis spectra when using A1 = 1.27 cm (0.5 inches), A2 = 2.54 cm (1 inch) and A3 = 3.81 cm (1.5 inches) diameter filters, respectively. (d) Removal speed curves for each condition.
Jmse 08 00899 g007
Figure 8. Evaluation of the number of filter layers in methylene blue removal: (a,b,c) UV-Vis spectra for C1 = 2, C2 = 3 and C3 = 4 layers, respectively. (d) Removal curves for each condition.
Jmse 08 00899 g008
Figure 9. Evaluation of varying the water flow in methylene blue removal: (a,b,c) UV-Vis spectra for 3 (F1), 5 (F2) and 9 mL/s (F3), respectively. (d) Removal curves for each condition.
Jmse 08 00899 g009
Figure 10. Evaluation of humidity percentages of the CT-Sargassum spp. in methylene blue removal: (a,b,c) UV-Vis spectra for H1 = 20 wt%, H2 = 30 wt% and H3 = 50 wt%, respectively. (d) Removal curves for each condition.
Jmse 08 00899 g010
Figure 11. Organic dye removal using the CT-Sargassum spp. filter: (a) UV-Vis spectra of methyl red (MR), (b) UV-Vis spectra of methyl orange (MO). The spectra were recorded every 10 min. (c) Removal curves for methyl red and methyl orange.
Jmse 08 00899 g011
Figure 12. FTIR analysis of CT-Sargassum spp. after filtration. Five different zones of interest are marked by dashed lines (I, II, III, IV and V).
Jmse 08 00899 g012
Scheme 2. Hydrogen bonding and electrostatic interaction between the polysaccharides present in the CT-Sargassum spp. and the different dyes, (a) methyl orange, (b) methylene blue and (c) methyl red.
Jmse 08 00899 sch002
Figure 13. SEM analysis of CT-Sargassum spp. after the removal of: (a) methylene blue, (b) methyl orange and (c) methyl red.
Jmse 08 00899 g013
Figure 14. Removal of lead ions: (a) UV-Vis spectra of Pb complex: the spectra were recorded every 10 min. (b) Removal curves for lead.
Jmse 08 00899 g014
Figure 15. Analysis of CT-Sargassum spp. after Pb2+ removal through the filtration system. (a) FTIR spectrum with six zones of interest marked, (b) proposed chelation scheme for Pb2+ and the polysaccharides present in CT-Sargassum spp. and (c) SEM image.
Jmse 08 00899 g015
Table 1. Physicochemical parameters and removal percentages obtained from the organic dye absorption experiments.
R2K (s−1)Removal (%)
Methylene Blue
Chemical Modification
Dry0.97400.12980.86
Treated0.99590.13195.99
Sargassum Mass
1 g0.99050.06093.67
3 g0.99590.08292.25
7 g0.99550.16395.39
Mechanical Treatment
crushing0.9820.16092.79
grinding0.9840.18587.42
Filter Diameter
0.5 in0.9820.17794.64
1 in0.9930.13496.01
1.5 in0.9700.15792.74
Number of Layers
20.9980.12497.91
30.9880.13998.02
40.9930.16198.25
Flow Rate
9 mL/s0.9980.11299.64
5 mL/s0.9890.13998.45
3 mL/s0.9990.20899.74
Humidity
20%0.9990.39899.34
30%0.9990.34799.79
50%0.9990.44099.91
Methyl Orange
**0.9820.15025.66
Methyl Red
**0.9990.22267.97
** The best conditions obtained for methylene blue were reproduced for the removal of these substances.
Table 2. Comparison of results reported which used Sargassum species for substance removal.
Sargassum SpeciesSubstances RemovedPollutant Inlet Concentration (PPM)% RemovalDeviceReference
Sargassum natanes and
Sargassum fluitanes
Methylene blue499FilterThis work
Methyl orange325
Methyl red668
Pb2+5095
Sargassum muticumMethylene blue50 96 *Bed column[30]
Pb2+50 96 *
Sargassum
glaucescens
Hg2+0.2–195Rotary shaker[44]
Sargassum filipendulaNi2+59 and 14730 and 45Agitation[45]
Cr3+52 and 13988 and 52
Sargassum sp.Cd2+595Agitation[46]
Zn2+5 90
Sargassum filipendulaCr3+12179Agitation[47]
Ni2+20552
Sargassum sp.Cu2+346 87Agitation[48]
Ni2+182 80
* These results were obtained after the parameter optimizations of approximately 29 experiments and passing from batch, centrifugation and then applied in a bed column with a flow rate of 25 mL/min.
Publisher’s Note: MDPI stays neutral with regard to jurisdictional claims in published maps and institutional affiliations.

