Article

The Effects of Ocean Acidification and Warming on Growth of a Natural Community of Coastal Phytoplankton

1
Ballast Water Center, Korea Institute of Ocean Science and Technology, Geoje 53201, Korea
2
Division of Environmental Science and Engineering, Pohang University of Science and Technology, Pohang 37673, Korea
3
Department of Ocean Environmental Sciences, Chungnam National University, Daejeon 34134, Korea
4
Division of Polar Ocean Sciences, Korea Polar Research Institute, Incheon 21990, Korea
5
Marine Ecosystem Research Center, Korea Institute of Ocean Science and Technology, Busan 49111, Korea
*
Author to whom correspondence should be addressed.
J. Mar. Sci. Eng. 2020, 8(10), 821; https://doi.org/10.3390/jmse8100821
Submission received: 10 October 2020 / Accepted: 16 October 2020 / Published: 20 October 2020
(This article belongs to the Section Marine Biology)

Abstract

:
An in situ mesocosm experiment was performed to investigate the combined effects of ocean acidification and warming on the coastal phytoplankton standing stock and species composition of a eutrophic coastal area in the temperate-subtropical region. Experimental treatments of natural seawater included three CO2 and two temperature conditions (present control: ~400 μatm CO2 and ambient temperature, acidification conditions: ~900 μatm CO2 and ambient temperature, and greenhouse conditions: ~900 μatm CO2 and ambient temperature +3 °C). We found that increased CO2 concentration benefited the growth of small autotrophic phytoplankton groups: picophytoplankton (PP), autotrophic nanoflagellates (ANF), and small chain-forming diatoms (DT). However, in the greenhouse conditions, ANF and DT abundances were lower compared with those in the acidification conditions. The proliferation of small autotrophic phytoplankton in future oceanic conditions (acidification and greenhouse) also increased the abundance of heterotrophic dinoflagellates (HDF). These responses suggest that a combination of acidification and warming will not only increase the small autotrophic phytoplankton standing stock but, also, lead to a shift in the diatom and dinoflagellate species composition, with potential biogeochemical element cycling feedback and an increased frequency and intensity of harmful algal blooms.

1. Introduction

Over the past few centuries, anthropogenic emissions of carbon dioxide (CO2) have resulted in an increase in the atmospheric CO2 concentration from average preindustrial levels of ~280 parts per million volume (ppmv) to more than 400 ppmv in 2014 [1]. Moreover, atmospheric CO2 is predicted to nearly double to 750 ppmv within the next 100 years [2]. The increase in atmospheric CO2 not only leads to ocean warming, via the greenhouse effect, but, also, ocean acidification through an increase in CO2 dissolved in the sea surface, a decrease in sea surface pH, and a decrease in the saturation state of calcium carbonates in the ocean [3]. The Intergovernmental Panel on Climate Change (IPCC) 2014 report projects an additional 1–6 °C temperature increase and ~0.3 pH unit decrease in the sea surface within this century [4]. The current pace of climate change is unprecedented throughout geological history, and some coastal waters will be subjected to temperature increases exceeding 2 °C [5].
These altered oceanographic conditions may impact marine phytoplankton [6,7]. Therefore, numerous laboratory and mesocosm-based experiments have been carried out to examine the effects of ocean acidification on cultured and natural phytoplankton species, and some of the most common observations have involved the fertilization effect of increased CO2 on primary production [8,9,10,11,12]. Recent modeling studies have also suggested that the growth of marine phytoplankton will increase by 40% if CO2 levels increase to 700 ppm [9,13]. These research results showed that, although phytoplankton have evolved carbon-concentrating mechanisms (CCMs) to facilitate the uptake of bicarbonate (HCO3−1) and its conversion to CO2, increased CO2 concentrations may still be beneficial for their growth, because they could help to reduce the metabolic cost of CCMs [3]. However, since CCM efficiencies differ between phytoplankton species, subtle changes in or neutral effects on the phytoplankton standing stock and primary production have also been reported [14,15,16].
In addition to ocean acidification, ocean warming is probably the most widely recognized consequence of climate change. Previous studies have shown that ocean warming can both enhance phytoplankton primary production to a greater extent than a CO2 concentration increase [17,18] and affect the phytoplankton size distribution, which triggers a dominance of nanophytoplankton and picophytoplankton (PP) [19,20]. Ocean warming also strongly influenced the phytoplankton community structure and species composition by altering biophysical activities across all trophic levels [17,18]. In the future, ocean acidification and warming are expected to occur simultaneously, and thus, it is predicted that there will be changes in the phytoplankton community structure and species composition compared with the current marine ecosystem. This is assumed to have implications for the turnover of organic matter and biogeochemical cycling and might influence the efficiency of the biological pump [20]. Ideally, their effects on natural phytoplankton communities should be investigated in unison, as the combined effects of ocean acidification and warming might be completely different from that of either stressor alone [17,21].
Mesocosm experiments, comprising natural plankton communities, are ideal platforms for assessing the potential effects of increased pCO2 and temperature, as they allow for species interaction and competition in a quasi-natural environment [22,23]. To do this, we conducted a mesocosm experiment on the southern coast of Korea under control (i.e., present), ocean acidification (i.e., high CO2), and combined ocean acidification and warming (i.e., greenhouse) conditions to investigate the responses of natural phytoplankton communities from community (picophytoploankton (PP), autotrophic nanoflagellate (ANF), diatoms (DT), and dinoflagellates (DINO)) to species level (DT and DINO). Our research results are then discussed in light of the following questions: (i) What are the effects of high pCO2 on the growth of phytoplankton in eutrophic coastal waters? (ii) How do phytoplankton standing stock and species composition change under the greenhouse treatments? and (iii) Is the growth of small-sized phytoplankton and heterotrophic dinoflagellates promoted under acidification and greenhouse treatments? The increases in water temperature and pCO2 applied during our mesocosm experiments were within the range projected by the IPCC 2007 for the end of this century [24].

2. Materials and Methods

2.1. Experimental Design

The study was conducted for 21 days (from 21 November to 11 December 2008) at the South Sea Institute of the Korea Institute of Ocean Science and Technology in Jangmok (34.6° N, 128.5° E) near the southern coast of Korea. The experiment involved mesocosm enclosures of 2400 L (1 m in diameter and 3 m in height), in triplicate, which were used to simulate three sets of conditions based on model projections under the A2 Scenario of the Intergovernmental Panel on Climate Change Special Report on Emissions Scenarios [25]: (i) present control (~400 μatm CO2 and ambient temperature), (ii) acidification conditions (~900 μatm CO2 and ambient temperature), and (iii) greenhouse conditions (~900 μatm CO2 and ~3 °C warmer than ambient temperature) (Figure 1). The target seawater pCO2 levels and temperature increase were achieved by mixing CO2-saturated seawater with ambient seawater and by circulating warm water through tubing wrapped around the seawater mixers in the enclosures, respectively. A detailed description can be found elsewhere [26,27]. Prior to filling the enclosures, 13.5 tons of seawater was passed through a mesh with a pore size of 100 μm to remove large heterotrophic grazers. To initiate the development of a phytoplankton bloom, the same amounts of nutrients were added to each enclosure on day 0, yielding initial concentrations of ~50 μmol L−1 Si (Si(OH)4), ~2.5 μmol L−1 P (HPO42−), and ~33 μmol L−1 N (NO3 + NO2). To enhance the distribution homogeneity of the phytoplankton populations, we gently mixed the seawater for 20 min prior to daily sampling using bubble-mediated mixers [27]. All the enclosures were sampled daily at 13:00 h from a ~1-m depth using a fluid metering pump to avoid rupturing cells.

2.2. Measurement of Parameters

Temperature and salinity were measured using a multiparameter water quality sonde (YSI-6600). Samples for nutrient (Si, P, and N) analyses were filtered through a 25-mm syringe filter (0.45-μm pore size) into 50-mL acid-cleaned polyethylene tubes and stored at −80 °C until analysis. Nutrient concentrations were analyzed using an autoanalyzer (Quickchem 8000 Flow Injection Analyzer; Lachat, Loveland, CO, USA) following the methods of Parsons et al. [28]. Seawater pCO2 levels were calculated using the total alkalinity and total dissolved inorganic carbon ([CO2] + [HCO3] + [CO32−]) concentrations, which were respectively measured using potentiometric and coulometric titration methods within the VINDTA system (MARIANDA, Kiel, Germany), using the carbonic acid dissociation constants that were provide to be consistent with laboratory and field measurements [29,30,31,32,33,34].
To identify the dominant phytoplankton groups and determine the cell abundances, an aliquot (~500 mL) of seawater sample was immediately preserved with Lugol’s solution (5% final concentration), and the phytoplankton cells were concentrated in sedimentation chambers for ≥48 h. The composition of phytoplankton species was assessed using light microscopy (Zeiss, Axioplan 2) at a magnification of ×200–1000. Species identification was based on Rines [35] and Tomas [36]. The DT and DINO were counted using a light microscope equipped with a Sedgewick Rafter chamber. To estimate the abundance of autotrophic DINO (ADF) and heterotrophic DINO (HDF), 1 L of seawater sample was preserved with formalin (2% final concentration), and the fixed cells were concentrated at 4 °C in the dark for ≥48 h. An aliquot (2–5 mL) of the concentrated sample was further sedimented in a Sedgewick-Rafter chamber and stained with 4’,6-diamidino-2-phenylindole (DAPI; 5% final concentration). The ADF and HDF were enumerated with an inverted epifluorescence microscope (Olympus IX 70) and distinguished by UV and blue-light excitation, which detected the autofluorescence of chlorophyll pigments. Autotrophic nanoflagellates (ANF) were preserved by the addition of glutaraldehyde (1% final concentration). An aliquot (10–30 mL) of the fixed sample was filtered through a black nucleopore filter (0.45-μm pore size); the cells on the filter were stained with DAPI (5 mg.mL−1 final concentration) and proflavin (0.33%) and counted using epifluorescence microscopy (Nikon type 104) at a magnification of ×600–1000. To determine the abundance of PP, ~10 mL of the sample was preserved by the addition of paraformaldehyde (1% w/v) and glutaraldehyde (0.05% v/v) and stored frozen at −80 °C until analysis. The frozen samples were thawed in batches immediately prior to analysis. The cells were concentrated with a black polycarbonate filter (0.2-μm pore size), stained with primulin, and enumerated using epifluorescence microscopy. The growth of the phytoplankton was checked by measuring fluorescence unit (FSU) (Turner Designs 10-AU) daily after incubation, and the growth rates, in doubling per day (μ), were calculated by applying the following equation:
μ = (log2Nt − log2N0)/t
where t is the length of incubation (days), N0 is the cell abundance at the start of the exponential phase, and Nt is the cell abundance at the end of the exponential phase.

2.3. Statistical Analysis

Analysis of variance (ANOVA) was used to determine whether changes in the abundances of phytoplankton groups and species in response to changes in seawater pCO2 and temperature were statistically significant. All datasets met the assumptions of normality and homogeneity of variance. If the ANOVA test identified a significant difference between conditions (p-value < 0.05), Scheffe’s post-hoc test was applied (SPSS Inc., Chicago, IL, USA).

3. Results

3.1. Carbonate Parameters and Temperature Dynamics

The seawater pCO2 values for the acidification and greenhouse treatments (target ~900 μatm) and the control (~400 μatm) remained higher than the respective initial levels of 860 and 370 μatm over eight (for acidification) or 12 (for the other two conditions) days (Figure 2a). Due to the influence of heterotrophic activity, which released CO2 during the pre-bloom period (days 0–5), the seawater pCO2 increased by approximately 30–47% of the initial values. As autotrophic production dominated during the bloom period (days 6–14), pCO2 significantly decreased in all nine enclosures (∆pCO2 270, 610, and 387 μatm for the control, acidification, and greenhouse treatments, respectively), and the values remained approximately constant thereafter. Since the decrease in seawater pCO2 associated with biological production was compensated for only by the influx of CO2 from the atmospheres of the enclosures (treated with the same as the target levels of pCO2), the changes in seawater pCO2 did not rapidly recover. However, large differences in pCO2 between the control and other treatments (approximately 220 and 570 μatm for the acidification and greenhouse treatments after the bloom, respectively) were maintained until the end of the experiment. There was a higher pCO2 level in the greenhouse condition than the acidification condition, which was due to the temperature-induced change in seawater pCO2 (4% pCO2 increase °C1) [37,38] and biological activities (see below).
During the experiment, the pH values were 7.93–8.41 in the control treatments, 7.56–8.06 in the acidification treatments, and 7.59–7.83 in the greenhouse treatments, showing a trend opposite to the seawater pCO2 values (Figure 2b). The ambient seawater temperature in the control gradually decreased from 14 °C on day 0 to 12 °C on day 20, with decreasing air temperature from fall to early winter (Figure 2c). In the greenhouse treatment, an ~2.5 °C elevation in seawater temperature was achieved and maintained throughout the experiment.

3.2. Bloom Development

Following the addition of Si, N, and P to the mesocosm enclosures on day 0, the fluorescence (an indicator of autotrophic phytoplankton biomass) slowly increased during the pre-bloom period (days 0–5), showing no differences among the control and treatment enclosures (Figure 3a).
During the bloom period (days 6–14), the biomass of phytoplankton started to exponentially increase. The upward trend in fluorescence was related to the downward trend in the concentrations of added nutrients (Figure 3b–d). In all enclosures, the concentrations of N and P decreased with a mean daily utilization ratio of 17.0 (∆N/∆P) until they reached below the level of limitation (N < 1 μmol L−1 and p < 0.2 μmol L−1) on day 14 (in the acidification and greenhouse treatments) and 15 (in the control) (Figure 3b,c) (ANOVA, P: p < 0.05 and N: p = 0.072). The rates of decrease in the N and P concentrations were higher under the high-pCO2 conditions (i.e., the acidification and greenhouse treatments) than the control conditions during the bloom period. The peak fluorescence (~12 FSU) was found in the acidification treatment on day 12 and was 1.7 times higher than that in the greenhouse treatment, indicating that the high temperature did not have a synergistic effect (Figure 3a).
During the post-bloom period (days 15–20; N and P not detectable), the exhaustion of N and P was followed by a continuous Si uptake until the end of the experiment (5.98 ± 4.38 μmol L−1 Si on day 20) at a slower rate than previously seen, except in the control (Figure 3d) (ANOVA, p < 0.001). The largest decrease in the concentration of Si in the control coincided with the highest production of biomass in the same conditions during the post-bloom period.

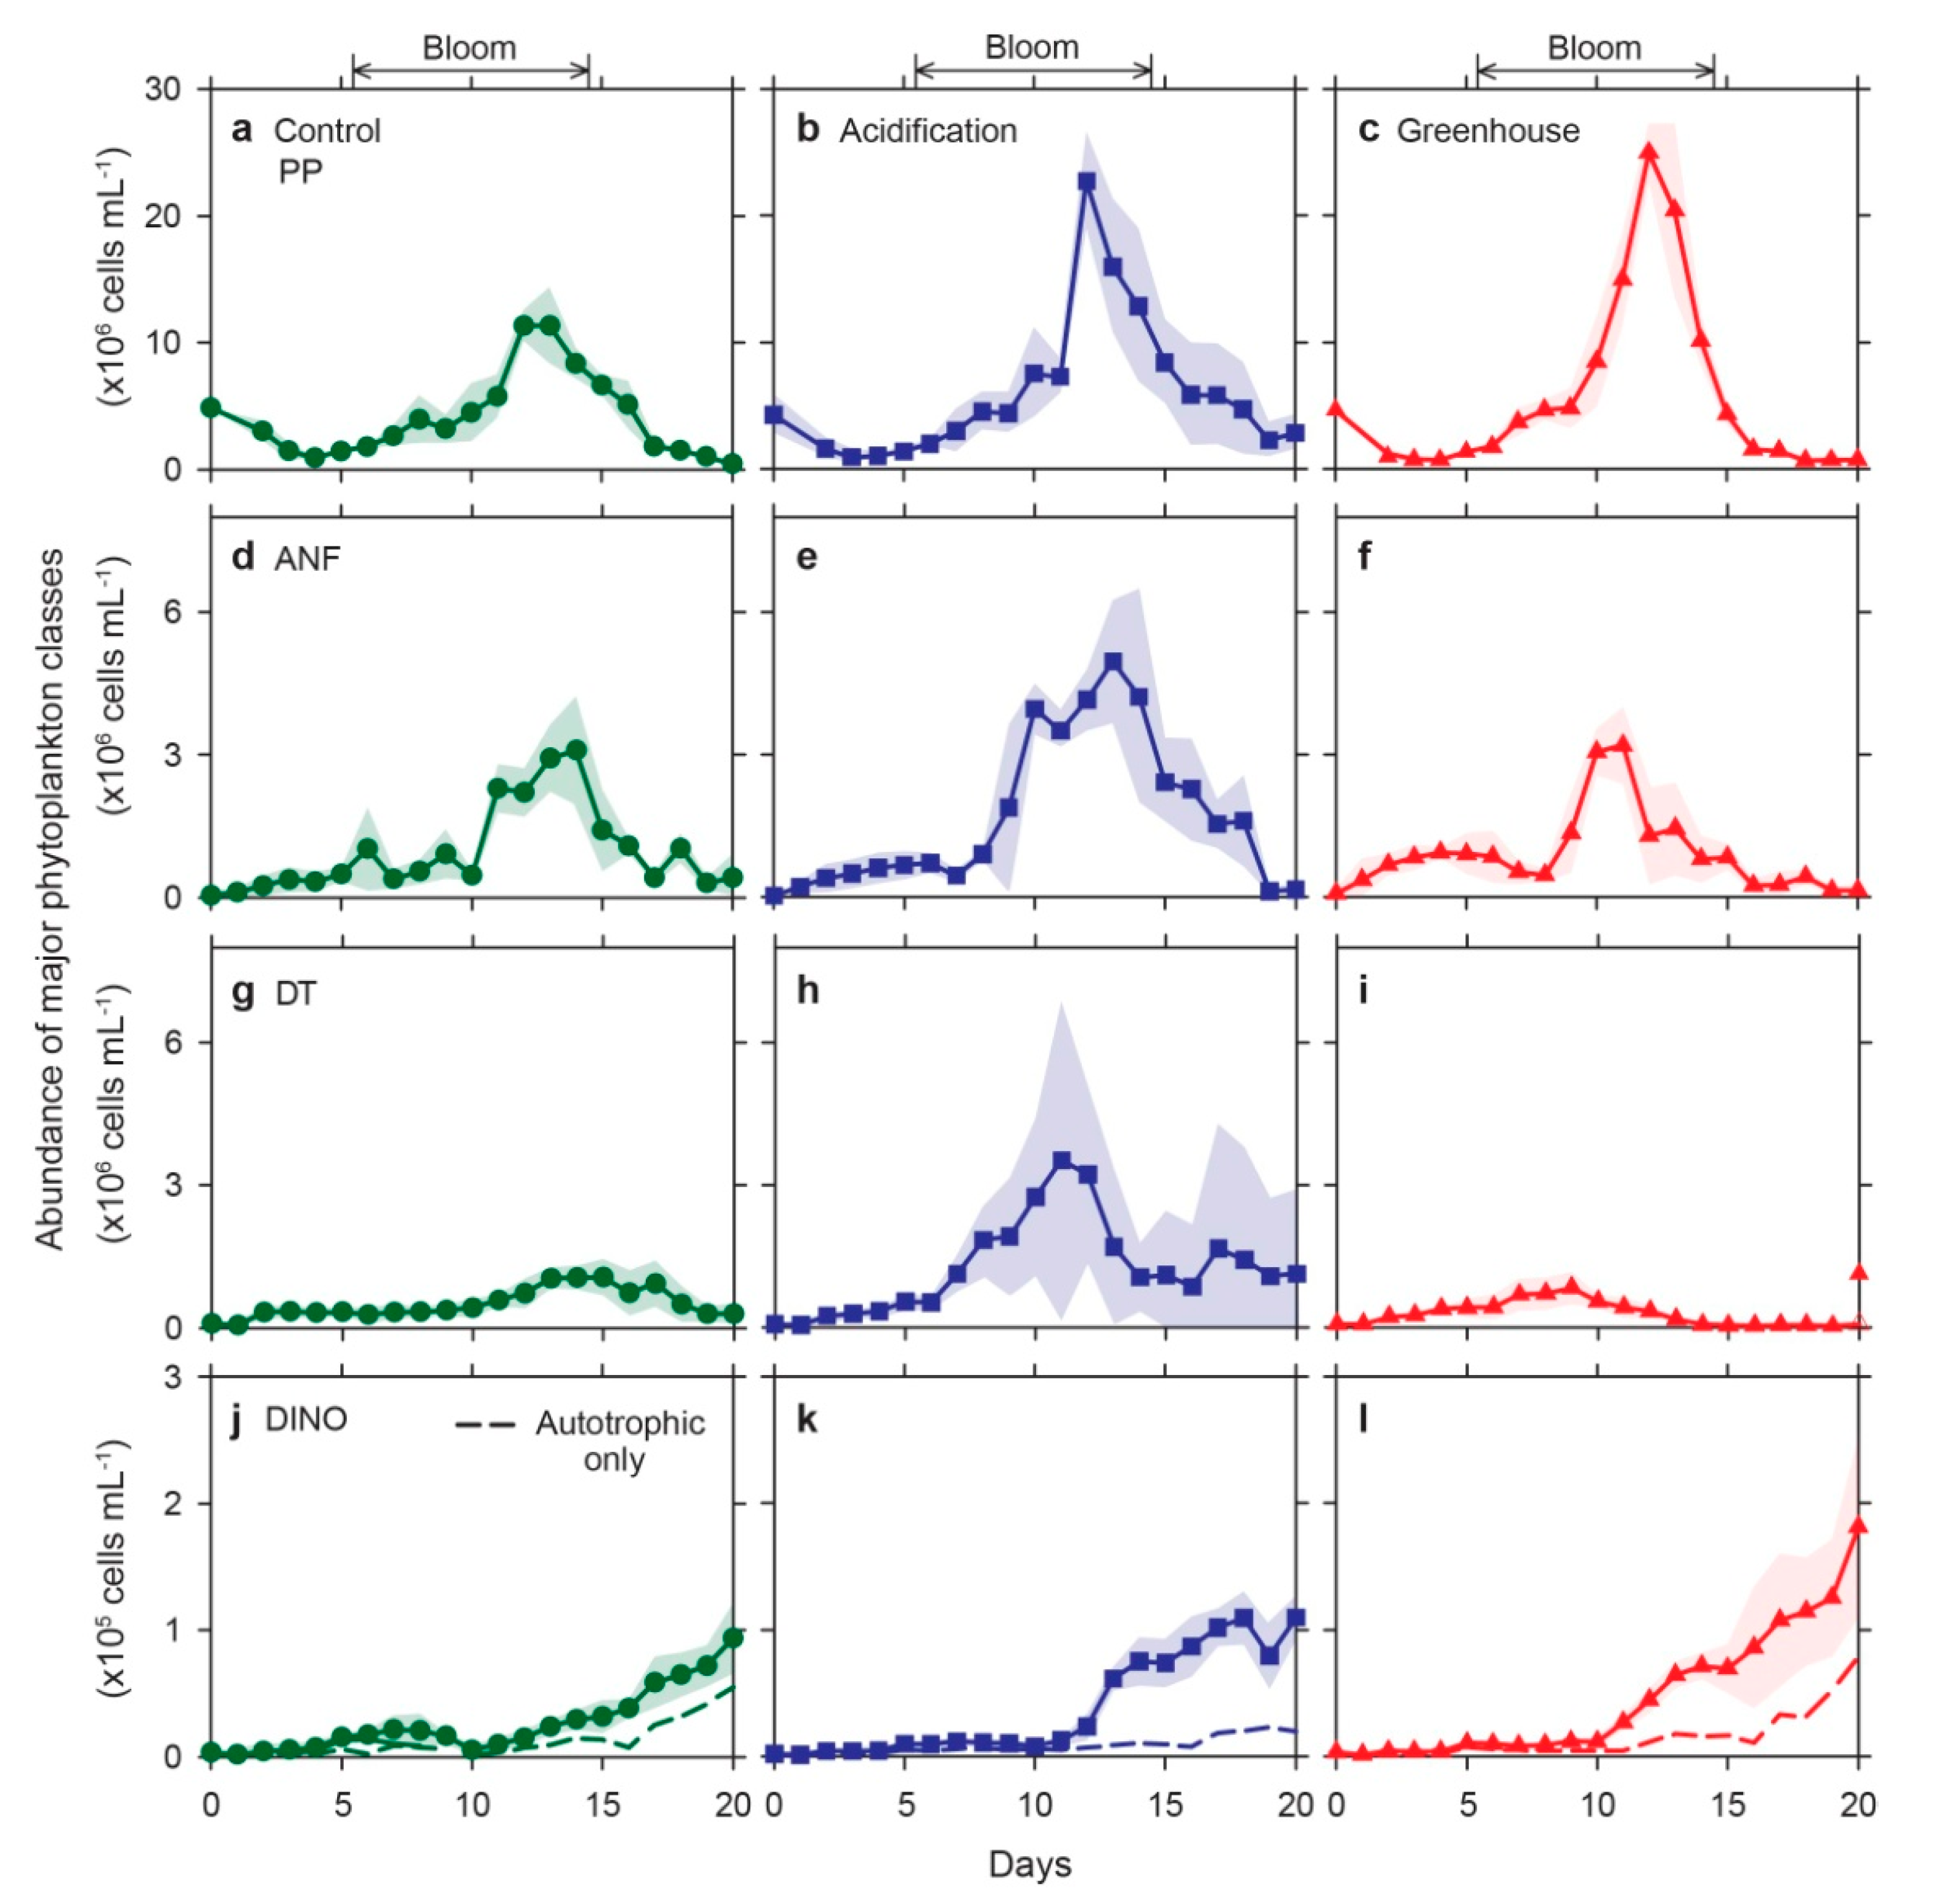
3.3. Population Dynamics of Major Phytoplankton Classes

During the bloom period, the contribution of PP, ANF, DT, and DINO to the total phytoplankton communities in all enclosures was 70%, 20%, 10%, and 0.2%, respectively (Figure 4). The blooms of PP, ANF, and DT under the high pCO2 conditions (the acidification and greenhouse treatments) were initiated a few days earlier than those in the control, and their abundances increased at faster rates (Figure 4 and Table 1), whereas the abundance of ADF showed no substantial increase in any enclosure during the same period. As inferred from the total biomass in the greenhouse conditions (Figure 3a), the elevated temperature with high pCO2 did not synergistically enhance the growth of the major phytoplankton classes (Figure 4); rather, the high temperature of the greenhouse treatment lowered both the growth rate (Table 1) and the dominance of ANF and DT compared with the normal temperature of the acidification treatment, and only PP growth benefited from the higher temperature during the bloom period.
During the post-bloom period, the net cell abundances of PP, ANF, and DT decreased, and they maintained higher concentrations in the acidification than the other conditions (Figure 4). In contrast, the abundance of DINO, specifically HDF, which responded from day 11 when the bloom of other phytoplankton classes reached a plateau, continuously increased in all enclosures until the end of the experiment, reaching a 2.5-times higher cell abundance under the high-CO2 conditions than the control (Figure 4j–l).
Overall, a statistically significant successional shift in major phytoplankton classes was found to be induced by changes in the pCO2 levels and temperature (Table 1). During the bloom period, PP dominated the community in all treatment conditions over 60%, and their mean cell abundances increased in the order of the greenhouse, acidification, and control conditions (Figure 4a–c). The relative abundances of ANF and DT were higher in the acidification conditions (ANF: 20%; p < 0.01 and DT: 18%; p < 0.001) relative to those in both the control (ANF: 18% and DT: 8%) and greenhouse conditions (ANF: 14% and DT: 7%) (Figure 4d–i). During the post-bloom period, the relative abundance of DINO was higher in the greenhouse conditions (8%) than the other two conditions (<3%) (Figure 4j–l; p < 0.001).

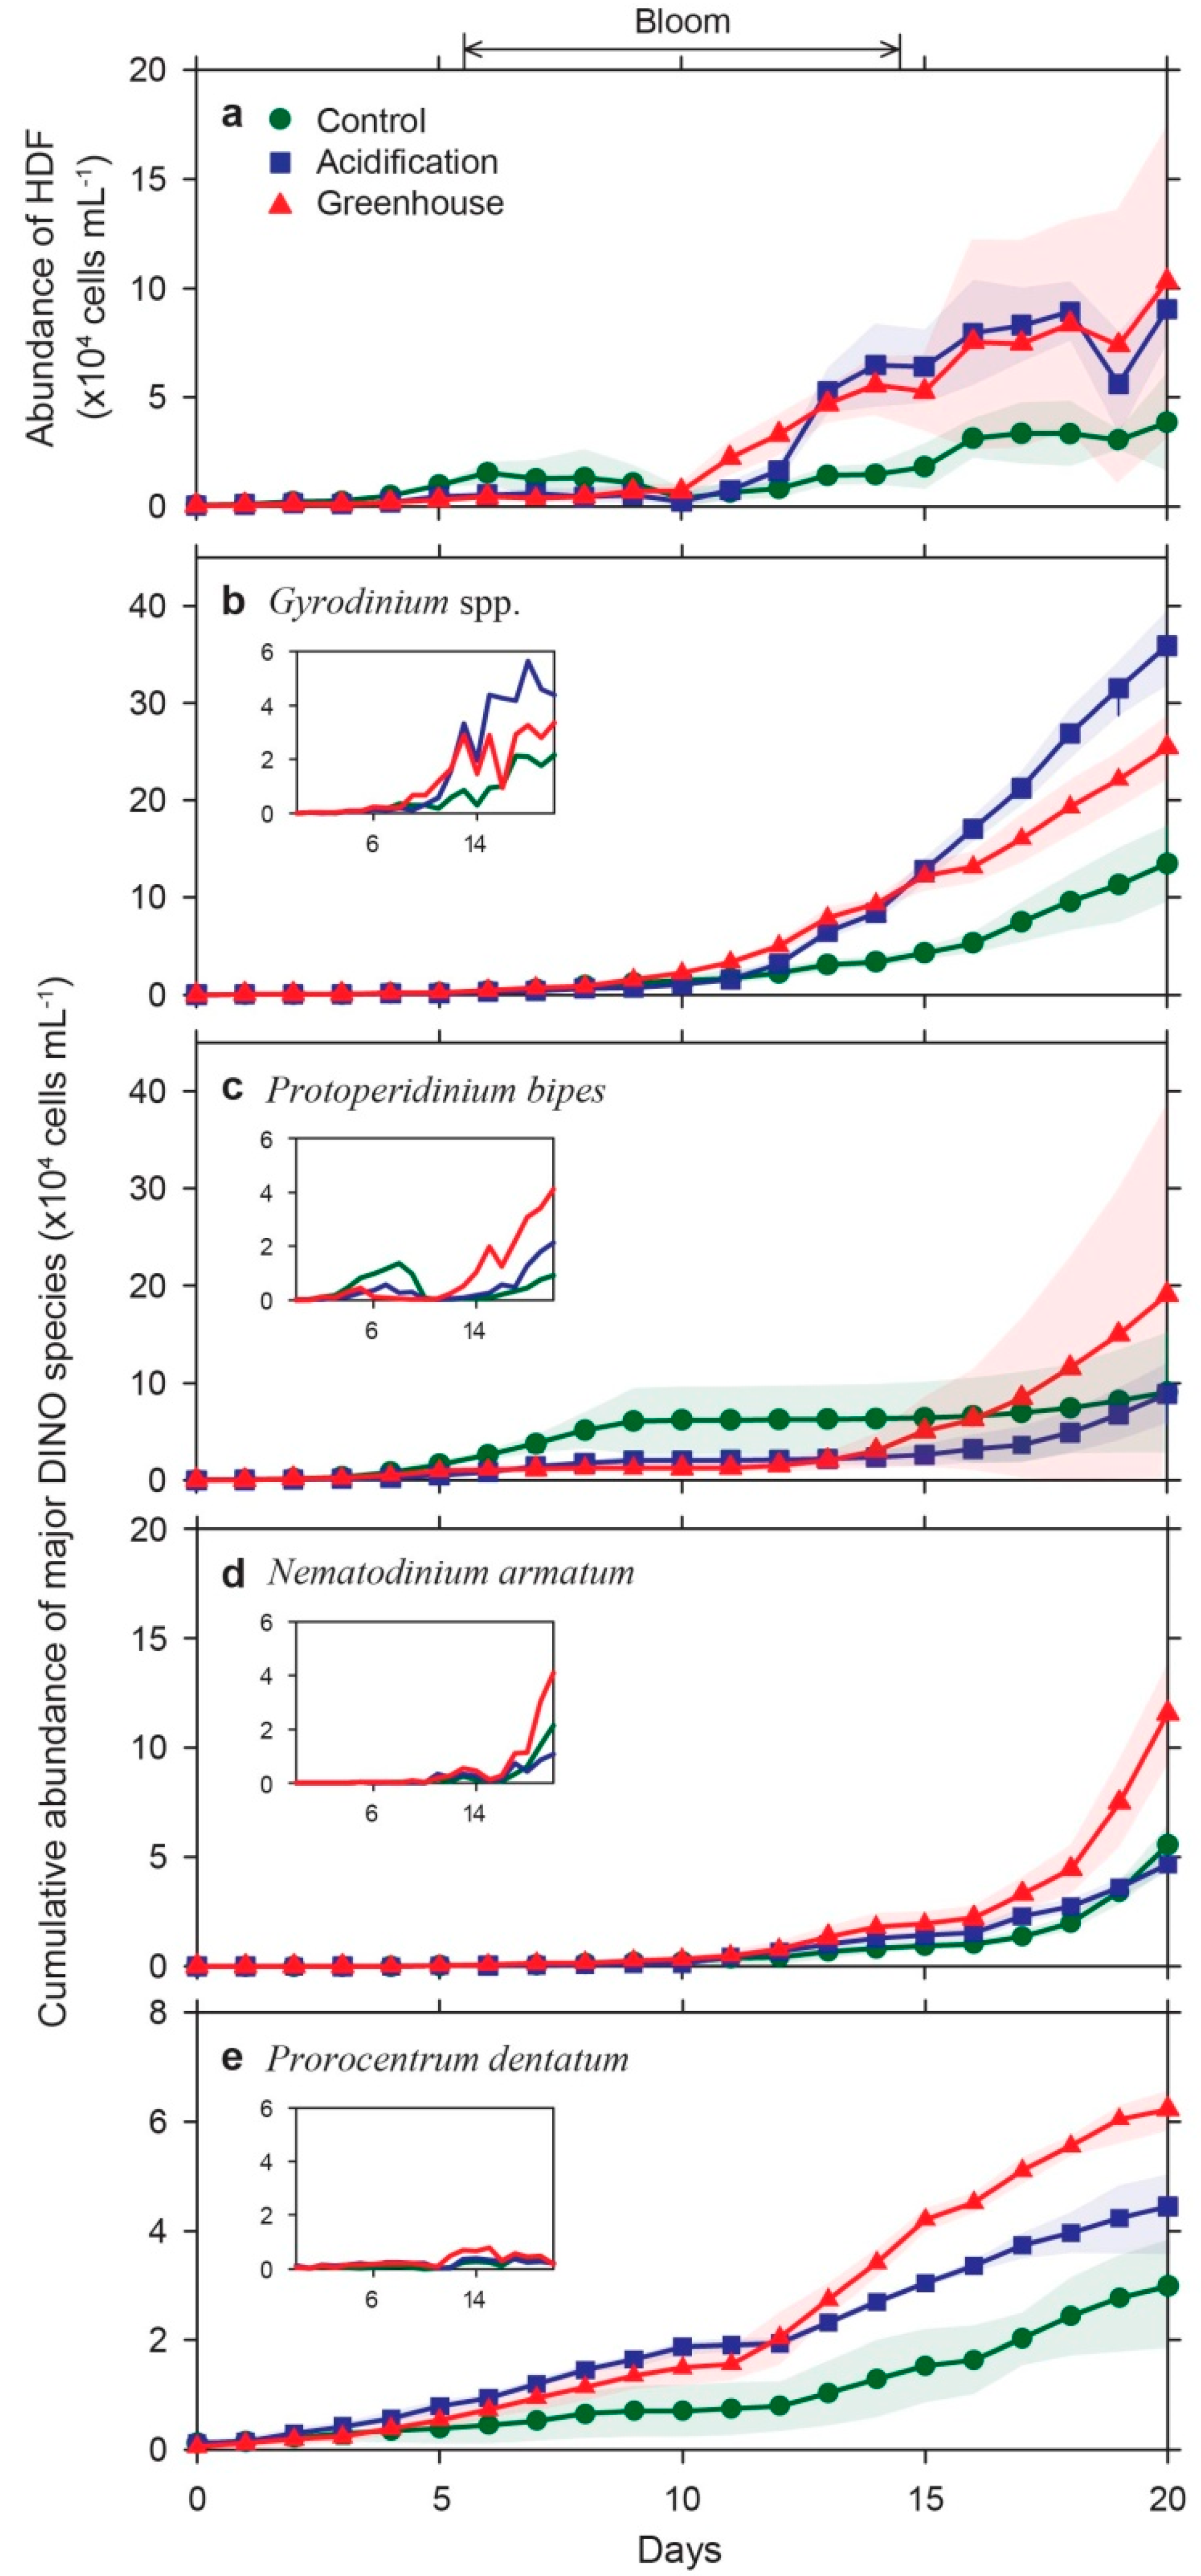
3.4. Species-Specific Growth Response of Diatoms and Dinoflagellates

The population of DT, one of the dominant phytoplankton classes for which the species-specific responses were tested, consisted of a group of small chain-forming species (e.g., Skeletonema spp. and Chaetoceros socialis) and other large diatom species (Cerataulina spp., Chaetoceros decipiens, and Eucampia zodiacus). Skeletonema spp. (~246 µm3), which accounted for up to 75% of the total diatom abundance, grew seven times faster in the acidification treatment than in the control conditions during the bloom period (Figure 5a and Table 1). Similarly, Chaetoceros socialis (77 µm3) exhibited a significantly positive-growth response to the high pCO2 levels in the same treatment (Figure 5b and Table 1). By contrast, all the other large, dominant diatom species (1725–30,906 µm3, with approximately one order of magnitude lower mean cell abundances than the small diatom species) showed their highest cell abundances and growth rates in the control during the late-bloom period (Figure 5c–e and Table 1). In general, the higher temperature in the greenhouse treatment negatively affected the growth of all diatom species (regardless of their size) during the whole experimental period, except Skeletonema spp., which revealed slightly enhanced growth during the bloom period compared with the control (Figure 5a).
The abundance of HDF, accounting for ~50–80% of the total DINO population (Figure 4j–l), increased at considerably higher rates in the acidification and greenhouse treatments compared with the control conditions as a result of the increased abundance of potential prey in the high-pCO2 conditions (Figure 6a). The major DINO species—Gyrodinium spp., Protoperidinium bipes, Nematodinium armatum, and Prorocentrum dentatum—showed enhanced growth in the acidification and greenhouse treatments from the late-bloom to the post-bloom periods (Figure 6b–e). In the greenhouse conditions, the higher temperature with pCO2 stimulated the growth of the majority of the dominant DINO species (Figure 6c–e).

4. Discussion

The major finding of the present study is that the growth of autotrophic phytoplankton populations (ANF, PP, and small chain-forming DT species) may benefit under future oceanic conditions.
CO2 could be a limiting resource for most phytoplankton communities, as the CO2 concentration is usually below that required for the half-saturation of Ribulose-1, 5-bisphosphate Carboxylase Oxygenase (RuBisCO), the core carbon-fixing enzyme in photosynthesis [3,39]. To overcome the CO2 limitation, therefore, most phytoplankton utilize active inorganic carbon-acquisition mechanisms for photosynthesis (carbon-concentrating mechanisms) based on the active uptake of CO2 and/or HCO3 from the environment [40,41]. This hypothesis is consistent with our phytoplankton community response results: shifts in the CO2-dependent phytoplankton communities occurred, but an increased CO2 concentration had a positive effect on their growth. In particular, autotrophic phytoplankton populations, including PP, ANF, and DT, were more abundant in the simulated ocean acidification conditions compared with the control conditions (Table 1 and Figure 4). Until recently, whether phytoplankton will benefit from the projected increase in CO2 was controversial, as CO2 responses vary between phytoplankton groups and species [21,41]. However, there have been clear cases of positive responses by phytoplankton, from small picoplankton to large DT [11,12,42,43], and previous studies have shown that increased CO2 concentrations in coastal eutrophic water enhance the production and productivity of micro-, nano-, pico-sized phytoplankton [44]. Therefore, our results from the eutrophic coastal waters of temperate-subtropical climate regions support the general proposition that increasing CO2 can enhance the growth of the autotrophic phytoplankton community.
During the bloom period in the acidification conditions, the growth responses of the DT species among the autotrophic phytoplankton groups showed that the small chain-forming DT species grew well, whereas large DT species, including Cerataulina spp., Chaetoceros decipiens, and E. zodiacus, did not. These results contrast with previous findings that large phytoplankton species outcompete smaller ones in high-CO2 ocean environments with eutrophication [44]. Therefore, we questioned whether the high concentrations of CO2 in the acidification treatment were causing the lower growth rates of large DT species, and we hypothesized that this growth reduction might be due to nutrient availability, as, along with the CO2 concentration, this is one of the most important parameters for phytoplankton growth. The concentrations of N and P decreased rapidly in the acidification conditions during the bloom period compared with in the control conditions: the small chain-forming DT Skeletonema spp., with high N and P uptakes, contributed to more than 50% of the total DT abundance on days 9 and 12. This led us to believe that Skeletonema spp. pre-emptively absorbed large amounts of nutrients and CO2 for growth; therefore, the growth of other species, such as large DT species, was inhibited as a result of nutrient-depletion in the acidification conditions. Although additional mesocosm experiments are required to verify the direct effect of CO2 on the growth of large DT species, our results suggest that these would flourish as well in acidification conditions as in the control conditions if resources essential for growth were not limited.
Following the bloom periods, shifts in the phytoplankton community were significantly influenced by the abundance of HDF (Figure 6a). We excluded mesozooplankton from the study, because they can significantly affect the growth of the phytoplankton community, and thus, HDF were the main microzooplankton grazers. Previous research suggested that small autotrophic phytoplankton are generally considered prey sources for microzooplankton, and microzooplankton grazing rates are often well-correlated with standing stocks of algal prey [45]. Increases in HDF abundance in both the acidification and greenhouse conditions may also be related to the increased prey availability (estimated based on the abundance of PP, ANF, and small DT species) (Table 1 and Figure 4). Moreover, the increased HDF metabolic rates in the greenhouse conditions may allow HDF to take advantage of an increased prey encounter rate [46]. Therefore, top-down processes by HDF may control both the intensity and duration of small autotrophic phytoplankton blooms in future coastal environments.
Changes in species compositions within the DT and DINO groups were observed between the treatments. Of the 77 species observed during the whole experimental period, 13 dominant phytoplankton (five DT and four DINO) species were selected and analyzed for their response against the rising CO2 and temperature (Table 1). Except for Prorocentrum dentatum (p = 0.05), there were statistically significant differences between the treatments (Table 1). First, Skeletonema spp. and Chaetoceros socialis showed positive responses in the acidification conditions, but they showed no or poor growth in the greenhouse conditions compared with in the control conditions (Figure 5a,b). The lower abundance of Chaetoceros socialis in the greenhouse conditions is understandable, because this species is known to prefer cold-water conditions [47]; however, the low growth of Skeletonema spp. was not fully understood and was only inferred through the grazing activities of HDFs, as the highest growth rates for Skeletonema spp. were found at temperatures between 20 °C and 30 °C [48]. In contrast, the large, centric DT species Cerataulina spp., Chaetoceros decipiens, and E. zodiacus did not exhibit positive growths in the acidification and greenhouse condition experiments (Figure 5c–e). The most dominant dinoflagellate species (Gyrodinium spp., Protoperidinium bipes, N. armatum, and Prorocentrum dentatum) exhibited positive growth in all the future oceanic conditions (Table 1 and Figure 6). From this study, we found that, as well as the CO2 and water temperature, nutrient concentrations affected DT growth, and prey abundance affected DINO growth. Therefore, predicting the response of DT and DINO communities in eutrophic coastal waters to future climate scenarios will depend on the physio-ecological characteristics of each species, although, overall, it appears that small DT and HDF species will flourish.
Our results showed that increased CO2 concentrations will benefit the growth of small autotrophic phytoplankton communities. We also found that higher water temperatures had a negative effect on the growth of most autotrophic phytoplankton groups/species, except for PP, compared with the acidification conditions. The proliferation of small phytoplankton groups also affected the abundance of HDF; thus, HDF were abundant in the future oceanic conditions.

Author Contributions

B.H.: sampling, diatom, and dinoflagellate analysis and writing—original draft. J.-M.K. and K.L.: conceptualization and writing—review and editing. P.-G.J., M.-C.J., and K.-H.C.: chlorophyll and nutrient analysis and writing—review. E.J.Y.: autotrophic nanoflagellate and heterotrophic dinoflagellate analysis. J.H.N.: picophytoplankton analysis. K.S.: supervision, conceptualization, and funding acquisition. All authors have read and agreed to the published version of the manuscript.

Funding

This research was supported by the research program of the Korea Institute of Ocean Science and Technology (PE99812).

Acknowledgments

The authors would like to thank Woo-Jin Lee, Ki-Tae Park, and Ju-Hyoung Kim for their help with sampling and analysis.

Conflicts of Interest

The authors declare no conflict of interest. The funders had no role in the design of the study; in the collection, analyses, or interpretation of data; in the writing of the manuscript; or in the decision to publish the results.

References

  1. IPCC. Climate Change 2014: Mitigation of Climate Change. Contribution of Working Group III to the Fifth Assessment Report of the Intergovernmental Panel on Climate Change; Edenhofer, O., Pichs-Madruga, R., Sokona, Y., Farahani, E., Kadner, S., Seyboth, K., Adler, A., Baum, I., Brunner, S., Eickemeier, P., et al., Eds.; Cambridge University Press: Cambridge, UK, 2014. [Google Scholar]
  2. Caldeira, K.; Wickett, M.E. Anthropogenic carbon and ocean pH. Nature 2003, 425, 365. [Google Scholar] [CrossRef] [PubMed]
  3. Sommer, U.; Paul, C.; Moustaka-Gouni, M. Warming and ocean acidification effects on phytoplankton from species shifts to size shifts within species in a mesocosm experiment. PLoS ONE 2015, 10, e0125239. [Google Scholar] [CrossRef] [PubMed] [Green Version]
  4. Field, C.B.; Barros, V.R.; Dokken, D.; Mach, K.; Mastrandrea, M.; Bilir, T.; Cbatterjee, M.; Ebi, K.; Estrada, Y.; Genova, R. IPCC 2014: Summary for policymakers in Climate Change 2014: Impacts, Adaptation, and Vulnerability. Part A: Global and Sectoral Aspects. Contribution of Working Group II to the Fifth Assessment Report of the Intergovernmental Panel on Climate Change. 2014, pp. 1–32. Available online: https://www.ipcc.ch/report/ar5/wg2/ (accessed on 18 October 2020).
  5. Beardall, J.; Stojkovic, S. Microalgae under global environmental change: Implications for growth and productivity, populations and trophic flow. ScienceAsia 2006, 32, 1–10. [Google Scholar] [CrossRef]
  6. Boyd, P.W.; Doney, S.C. Modelling regional responses by marine pelagic ecosystems to global climate change. Geophys. Res. Lett. 2002, 29, 53-1–53-4. [Google Scholar] [CrossRef] [Green Version]
  7. Hays, G.C.; Richardson, A.J.; Robinson, C. Climate change and marine plankton. Trends Ecol. Evol. 2005, 20, 337–344. [Google Scholar] [CrossRef]
  8. Hein, M.; Sand-Jensen, K. CO2 increases oceanic primary production. Nature 1997, 388, 526–527. [Google Scholar] [CrossRef]
  9. Schippers, P.; Lürling, M.; Scheffer, M. Increase of atmospheric CO2 promotes phytoplankton productivity. Ecol. Lett. 2004, 7, 446–451. [Google Scholar] [CrossRef]
  10. Tortell, P.D.; Payne, C.D.; Li, Y.; Trimborn, S.; Rost, B.; Smith, W.O.; Riesselman, C.; Dunbar, R.B.; Sedwick, P.; DiTullio, G.R. CO2 sensitivity of Southern Ocean phytoplankton. Geophys. Res. Lett. 2008, 35. [Google Scholar] [CrossRef] [Green Version]
  11. Egge, J.; Thingstad, J.; Larsen, A.; Engel, A.; Wohlers, J.; Bellerby, R.; Riebesell, U. Primary production during nutrient-induced blooms at elevated CO2 concentrations. Biogeosci. Discuss. 2009, 6, 877–885. [Google Scholar] [CrossRef] [Green Version]
  12. Engel, A.; Borchard, C.; Piontek, J.; Schulz, K.G.; Riebesell, U.; Bellerby, R. CO2 increases 14C primary production in an Arctic plankton community. Biogeosci. Discuss. 2013, 10, 1291–1308. [Google Scholar] [CrossRef] [Green Version]
  13. Fu, F.-X.; Zhang, Y.; Warner, M.E.; Feng, Y.; Sun, J.; Hutchins, D.A. A comparison of future increased CO2 and temperature effects on sympatric Heterosigma akashiwo and Prorocentrum minimum. Harm. Algae 2008, 7, 76–90. [Google Scholar] [CrossRef]
  14. Sciandra, A.; Harlay, J.; Lefèvre, D.; Lemée, R.; Rimmelin, P.; Denis, M.; Gattuso, J.-P. Response of coccolithophorid Emiliania huxleyi to elevated partial pressure of CO2 under nitrogen limitation. Mar. Ecol. Prog. Ser. 2003, 261, 111–122. [Google Scholar] [CrossRef]
  15. Delille, B.; Harlay, J.; Zondervan, I.; Jacquet, S.; Chou, L.; Wollast, R.; Bellerby, R.G.; Frankignoulle, M.; Borges, A.V.; Riebesell, U. Response of primary production and calcification to changes of pCO2 during experimental blooms of the coccolithophorid Emiliania huxleyi. Glob. Biogeochem. Cycles 2005, 19. [Google Scholar] [CrossRef] [Green Version]
  16. Kim, J.-M.; Lee, K.; Shin, K.; Kang, J.-H.; Lee, H.-W.; Kim, M.; Jang, P.-G.; Jang, M.-C. The effect of seawater CO2 concentration on growth of a natural phytoplankton assemblage in a controlled mesocosm experiment. Limnol. Oceanogr. 2006, 51, 1629–1636. [Google Scholar] [CrossRef] [Green Version]
  17. Hare, C.E.; Leblanc, K.; DiTullio, G.R.; Kudela, R.M.; Zhang, Y.; Lee, P.A.; Riseman, S.; Hutchins, D.A. Consequences of increased temperature and CO2 for phytoplankton community structure in the Bering Sea. Mar. Ecol. Prog. Ser. 2007, 352, 9–16. [Google Scholar] [CrossRef] [Green Version]
  18. Kim, J.-H.; Kim, K.; Kang, E.; Lee, K.; Kim, J.-M.; Park, K.; Shin, K.; Hyun, B.; Jeong, H.J. Enhancement of photosynthetic carbon assimilation efficiency of phytoplankton assemblage in the future coastal ocean. Biogeosci. Discuss. 2013, 10. [Google Scholar] [CrossRef]
  19. Sommer, U.; Lewandowska, A. Climate change and the phytoplankton spring bloom: Warming and overwintering zooplankton have similar effects on phytoplankton. Glob. Chang. Biol. 2011, 17, 154–162. [Google Scholar] [CrossRef]
  20. Brussaard, C.P.D.; Noordeloos, A.A.M.; Witte, H.; Collenteur, M.C.J.; Schulz, K.; Ludwig, A.; Riebesell, U. Arctic microbial community dynamics influenced by elevated CO2 levels. Biogeosci. Discuss. 2013, 10, 719–731. [Google Scholar] [CrossRef] [Green Version]
  21. Gao, K.; Helbling, E.W.; Häder, D.-P.; Hutchins, D.A. Responses of marine primary producers to interactions between ocean acidification, solar radiation, and warming. Mar. Ecol. Prog. Ser. 2012, 470, 167–189. [Google Scholar] [CrossRef] [Green Version]
  22. Riebesell, U.; Bellerby, R.; Grossart, H.-P.; Thingstad, F. Mesocosm CO2 perturbation studies: From organism to community level. Biogeosci. Discuss. 2008, 5, 1157–1164. [Google Scholar] [CrossRef] [Green Version]
  23. Riebesell, U.; Czerny, J.; Bröckel, K.; Boxhammer, T.; Büdenbender, J.; Deckelnick, M.; Fischer, M.; Hoffmann, D.; Krug, S.; Lentz, U. A mobile sea-going mesocosm system–new opportunities for ocean change research. Biogeosci. Discuss. 2013, 10, 1835–1847. [Google Scholar] [CrossRef] [Green Version]
  24. IPCC. Climate Change 2007: Contribution of the Working Group III to the Fourth Assessment Report of the Intergovernmental Panel on Climate Change; Metz, B., Davidson, O.R., Bosch, P.R., Dave, R., Meyer, L.A., Eds.; IPCC: Cambridge, UK; New York, NY, USA, 2007. [Google Scholar]
  25. Solomon, S. The Physical Science Basis. Contribution of Working Group I to the Fourth Assessment Report of the Intergovernmental Panel on Climate Change. Intergovernmental Panel on Climate Change (IPCC), Climate Change 2007. 2007. Available online: https://www.ipcc.ch/report/ar4/wg1/ (accessed on 18 October 2020).
  26. Kim, J.-M.; Lee, K.; Shin, K.; Yang, E.J.; Engel, A.; Karl, D.M.; Kim, H.-C. Shifts in biogenic carbon flow from particulate to dissolved forms under high carbon dioxide and warm ocean conditions. Geophys. Res. Lett. 2011, 38. [Google Scholar] [CrossRef] [Green Version]
  27. Kim, J.-M.; Shin, K.; Lee, K.; Park, B.K. In situ ecosystem-based carbon dioxide perturbation experiments: Design and performance evaluation of a mesocosm facility. Limnol. Oceanogr. Methods 2008, 6, 208–217. [Google Scholar] [CrossRef] [Green Version]
  28. Parsons, T.R. A Manual of Chemical & Biological Methods for Seawater Analysis; Elsevier: Amsterdam, The Netherlands, 2013. [Google Scholar]
  29. Mehrbach, C.; Culberson, C.H.; Hawley, J.E.; Pytkowicx, R.M. Measurement of the apparent dissociation constants of carbonic acid in seawater at atmospheric pressure. Limnol. Oceanogr. 1973, 18, 897–907. [Google Scholar] [CrossRef]
  30. Fong, M.B.; Dickson, A.G. Insights from GO-SHIP hydrography data into the thermodynamic consistency of CO2 system measurements in seawater. Mar. Chem. 2019, 211, 52–63. [Google Scholar] [CrossRef]
  31. Lee, K.; Millero, F.J.; Byrne, R.H.; Feely, R.A.; Wanninkhof, R. The recommended dissociation constants for carbonic acid in seawater. Geophys. Res. Lett. 2000, 27, 229–232. [Google Scholar] [CrossRef]
  32. Lueker, T.J.; Dickson, A.G.; Keeling, C.D. Ocean pCO2 calculated from dissolved inorganic carbon, alkalinity, and equations for K1 and K2: Validation based on laboratory measurements of CO2 in gas and seawater at equilibrium. Mar. Chem. 2000, 70, 105–119. [Google Scholar] [CrossRef]
  33. McElligott, S.; Byrne, R.H.; Lee, K.; Wanninkhof, R.; Millero, F.J.; Freely, R.A. Discrete water column measurements of CO2 fugacity and pHT in seawater: A comparison of direct measurements and thermodynamic calculations. Mar. Chem. 1998, 60, 63–73. [Google Scholar] [CrossRef]
  34. Millero, F.J.; Graham, T.B.; Huang, F.; Bustos-Serrano, H.; Pierrot, D. Dissociation constants of carbonic acid in seawater as a function of salinity and temperature. Mar. Chem. 2006, 100, 80–94. [Google Scholar] [CrossRef]
  35. Rines, J.B. The Chaetoceros Ehrenberg (Baciullariophyceae) flora of Narragansett Bay, Rhode Island, USA. Bibl. Phycol. 1988, 79, 1–196. [Google Scholar]
  36. Tomas, C.R. Identifying Marine Phytoplankton; Elsevier: Amsterdam, The Netherlands, 1997. [Google Scholar]
  37. Lee, K.; Millero, F.J.; Campbell, D.M. The reliability of the thermodynamic constants for the dissociation of carbonic acid in seawater. Mar. Chem. 1996, 55, 233–245. [Google Scholar] [CrossRef]
  38. Takahashi, T.; Sutherland, S.C.; Sweeney, C.; Poisson, A.; Metzl, N.; Tilbrook, B.; Bates, N.; Wanninkhof, R.; Feely, R.A.; Sabine, C.; et al. Global sea–air CO2 flux based on climatological surface ocean pCO2, and seasonal biological and temperature effects. Deep Sea Res. Part II Top. Stud. Oceanogr. 2002, 49, 1601–1622. [Google Scholar] [CrossRef]
  39. Falkowski, P.; Raven, J. Aquatic Photosynthesis; Princeton University Press: Princeton, NJ, USA, 2007. [Google Scholar]
  40. Raven, J.A.; Giordano, M.; Beardall, J.; Maberly, S.C. Algal and aquatic plant carbon concentrating mechanisms in relation to environmental change. Photosynth. Res. 2011, 109, 281–296. [Google Scholar] [CrossRef] [Green Version]
  41. Liu, X.; Li, Y.; Wu, Y.; Huang, B.; Dai, M.; Fu, F.; Hutchins, D.A.; Gao, K. Effects of elevated CO2 on phytoplankton during a mesocosm experiment in the southern eutrophicated coastal water of China. Sci. Rep. 2017, 7, 1–14. [Google Scholar] [CrossRef] [PubMed] [Green Version]
  42. Low-Décarie, E.; Bell, G.; Fussmann, G.F. CO2 alters community composition and response to nutrient enrichment of freshwater phytoplankton. Oecologia 2015, 177, 875–883. [Google Scholar] [CrossRef]
  43. Horn, H.G.; Sander, N.; Stuhr, A.; Alguero-Muniz, M.; Bach, L.T.; Loder, M.G.J.; Boersma, M.; Riebesell, U.; Aberle, N. Low CO2 sensitivity of microzooplankton communities in the Gullmar Fjord, Skagerrak: Evidence from a long-term mesocosm study. PLoS ONE 2016, 11, e0165800. [Google Scholar] [CrossRef] [Green Version]
  44. Hernández-Hernández, N.; Bach, L.T.; Montero, M.F.; Taucher, J.; Baños, I.; Guan, W.; Esposito, M.; Ludwig, A.; Achterberg, E.P.; Riebesell, U. High CO2 under nutrient fertilization increases primary production and biomass in subtropical phytoplankton communities: A mesocosm approach. Front. Mar. Sci. 2018, 5, 213. [Google Scholar] [CrossRef]
  45. Rose, J.M.; Feng, Y.; Gobler, C.J.; Gutierrez, R.; Hare, C.E.; Leblanc, K.; Hutchins, D.A. Effects of increased pCO2 and temperature on the North Atlantic spring bloom. II. Microzooplankton abundance and grazing. Mar. Ecol. Prog. Ser. 2009, 388, 27–40. [Google Scholar] [CrossRef] [Green Version]
  46. Calbet, A.; Landry, M.R. Phytoplankton growth, microzooplankton grazing, and carbon cycling in marine systems. Limnol. Oceanogr. 2004, 49, 51–57. [Google Scholar] [CrossRef] [Green Version]
  47. Artamonova, E.; Svenning, J.; Vasskog, T.; Hansen, E.; Eilertsen, H. Analysis of phospholipids and neutral lipids in three common northern cold water diatoms: Coscinodiscus concinnus, Porosira glacialis, and Chaetoceros socialis, by ultra-high performance liquid chromatography-mass spectrometry. J. Appl. Phycol. 2017, 29, 1241–1249. [Google Scholar] [CrossRef]
  48. Yoder, J.A. Effect of temperature on light-limited growth and chemical composition of Skeletonema costatum (BACILLARIOPHYCEAE) 1. J. Phycol. 1979, 15, 362–370. [Google Scholar] [CrossRef]
Figure 1. Photograph of the floating raft, pCO2 concentration regulation units, temperature regulation units, and enclosures of the mesocosm facility. Design and performance of the facility have been described in detail elsewhere [26,27].
Jmse 08 00821 g001
Figure 2. Changes in (a) seawater pCO2; (b) pH; and (c) seawater temperature in the control, acidification, and greenhouse enclosures during the study period. The seawater temperatures in the control and acidification treatments are approximately the same, overlapping with a single graph (control). The green, blue, and red symbols represent the control, acidification, and greenhouse conditions, respectively. The color shading represents the standard deviation (1 σ) from the mean for the replicate mesocosms.
Jmse 08 00821 g002
Figure 3. Changes in (a) fluorescence; (b) N; (c) P; and (d) Si concentrations during the study period. The experiment period was divided into the pre-bloom (days 0–5), the bloom (days 6–14), and the post-bloom periods (days 15–20). The symbols and the color shading represent the same as shown in Figure 2.
Jmse 08 00821 g003
Figure 4. Changes in the cell abundance of major phytoplankton classes during the study period: (ac) picoplankton; (df) autotrophic nanoflagellates; (gi) diatoms; and (jl) dinoflagellates. The symbols and the color shading represent the same as shown in Figure 2.
Jmse 08 00821 g004
Figure 5. Changes in the cumulative cell abundance of major diatom species during the study period: (a) Skeletonema spp.; (b) Chaetoceros socialis; (c) Cerataulina spp.; (d) Chaetoceros decipiens; and (e) Eucampia zodiacus. (Insets) Changes in the cell abundance during the same period. The symbols and the color shading represent the same as shown in Figure 2.
Jmse 08 00821 g005
Figure 6. Changes in (a) the abundance of HDF and (be) the cumulative cell abundance of major dinoflagellate species during the study period: (b) Gyrodinium spp.; (c) Protoperidinium bipes; (d) Nematodinium armatum; and (e) Prorocentrum dentatum. (Insets) Changes in the abundance during the same period. The symbols and the color shading represent the same as shown in Figure 2.
Jmse 08 00821 g006
Table 1. Effects of pCO2 and temperature manipulation on specific growth rates and the mean cell abundance of phytoplankton groups and dominant species in the control, acidification, and greenhouse enclosures. The mean cell abundance and its statistical results were calculated during the bloom period (for PP, ANF, and DT) and the post-bloom period (for DINO).
Phytoplankton ClassesSpeciesSpecific Growth Rate (d−1) ± s.d.Mean Cell Abundance (103 Cells L−1) ± s.d.
ControlAcidificationGreenhouseControlAcidificationGreenhouseF Value
Picophytoplankton (PP)0.26 ± 0.020.40 ± 0.020.42 ± 0.025864 ± 1209 A8894 ± 1332 A,B10,421 ± 1,595 B3.3 *
Autotrophic nanoflagellate (ANF)0.22 ± 0.050.26 ± 0.030.26 ± 0.131541 ± 261 A2743 ± 392 B1435 ± 159 A6.8 **
Diatoms (DT)0.26 ± 0.010.32 ± 0.150.26 ± 0.13576 ± 141 A1976 ± 1297 B478 ± 115 A19.3 ***
Skeletonema spp.0.60 ± 0.250.73 ± 0.110.62 ± 0.04127 ± 53 A1298 ± 673 B315 ± 111 A21.7 ***
Chaetoceros socialis0.48 ± 0.120.65 ± 0.140.32 ± 0.2359 ± 32 A211 ± 311 B5 ± 4 A6.3 **
Cerataulina spp.0.49 ± 0.120.41 ± 0.000.31 ± 0.0666 ± 12 B17 ± 17 A5 ± 1 A14.3 ***
Chaetoceros decipiens0.52 ± 0.040.39 ± 0.080.44 ± 0.0474 ± 25 B27 ± 12 A10 ± 3 A17.6 ***
Eucampia zodiacus0.70 ± 0.250.53 ± 0.030.46 ± 0.0624 ± 7 B9 ± 3 A2 ± 0 A7.3 **
Dinoflagellates (DINO)0.20 ± 0.030.35 ± 0.020.27 ± 0.0260 ± 23 A93 ± 16 B114 ± 39 B14.1 ***
Gyrodinium spp.0.41 ± 0.060.50 ± 0.140.41 ± 0.1516.8 ± 0.6 A45.8 ± 0.8 C26.9 ± 0.4 B40.7 ***
Protoperidinium bipes0.50 ± 0.060.58 ± 0.100.62 ± 0.234.6 ± 0.4 A10.9 ± 0.4 A26.7 ± 0.4 B7.7 *
Nematodinium armatum0.59 ± 0.150.56 ± 0.270.70 ± 0.067.9 ± 0.2 A,B5.6 ± 0.1 A16.3 ± 0.3 B5.1 *
Prorocentrum dentatum0.51 ± 0.210.63 ± 0.150.71 ± 0.082.8 ± 0.02.9 ± 0.14.7 ± 0.1n.s.
s.d. standard deviations. Statistical results were analyzed for the mean cell abundances using one-way ANOVA and Scheffe’s post-hoc test: F-values (p) indicates the level of significance (n.s. not significant, * p < 0.05, ** p < 0.01, and *** p < 0.001). Superscripted letters (A,B and C) indicate significant differences between conditions.
Publisher’s Note: MDPI stays neutral with regard to jurisdictional claims in published maps and institutional affiliations.

