Article

Tidal and Storm Impacts on Hydrodynamics and Sediment Dynamics in an Energetic Ebb Tidal Delta

1
Department of Oceanography & Coastal Sciences, Louisiana State University, Baton Rouge, LA 70803, USA
2
Coastal Studies Institute, Louisiana State University, Baton Rouge, LA 70803, USA
3
Department of Marine Science, Coastal Carolina University, Conway, SC 29528, USA
4
Louisiana Legislative Auditor, Baton Rouge, LA 70802, USA
*
Authors to whom correspondence should be addressed.
J. Mar. Sci. Eng. 2020, 8(10), 810; https://doi.org/10.3390/jmse8100810
Submission received: 9 September 2020 / Revised: 7 October 2020 / Accepted: 10 October 2020 / Published: 19 October 2020

Abstract

:
Bottom-mounted instrumentation was deployed at two sites on a large sandy shoal of an ebb tidal delta offshore of the Port Royal Sound of South Carolina of USA to collect hydrodynamics and sediment dynamics data. One site (“borrow site”) was 2 km offshore in a dredge pit for nearby beach nourishment and the other site (“reference site”) was 10 km offshore. In situ time-series data were collected during two periods after the dredging: 15 March–12 June (spring) and 18 August–18 November (fall) of 2012. Data at the reference site indicated active migrating bedforms from centimeters to decimeters tall, and sediment concentrations were highly associated with semidiurnal and fortnightly tidal cycles. In the fall deployment, waves at the reference site were higher than those at the shallow borrow site. Both Tropical Storm Beryl and Hurricane Sandy formed high waves and strong currents but did not generate the greatest sediment fluxes. The two sites were at different depths and distances offshore, and waves contributed more to sediment mobility at the reference site whereas tidal forcing was the key controlling factor at the borrow site. This study provides valuable datasets for the selection of sites, prediction of pit infilling, and the modeling of storm impact in future beach nourishment and coastal restoration projects.

1. Introduction

Beaches and barrier islands are common sandy sedimentary environments, and their stability forms an integral part of the economy of coastal areas by providing support for tourism and infrastructure protection. Coastal erosion along developed shorelines and coasts, especially during storms and hurricanes, can have adverse effects on beaches and beach-related recreational and economic benefits. Global sea level rise and regional subsidence have caused increased erosion along the highly developed beaches and rapid degradation of many barrier systems around the world. Beach nourishment and barrier island restoration have been adopted as some of the predominant strategies [1,2,3]. However, beach-compatible sand resources are rather limited, and the dredging processes can be very costly.
Ebb tidal deltas of barrier systems are sometimes regarded as potential borrow areas for beach nourishment due to their proximity to beaches and their large volumes of high-quality beach-compatible sand. Ebb tidal deltas here are defined as sizable subaqueous sediment deposits and formed mainly by ebb tidal currents; they are typically “half-circle shaped” and directly offshore of tidal inlets, and an example is in Figure 1A. As the dredging in these areas is becoming more popular in beach nourishment practices, understanding inlet and tidal delta dynamics is crucial to the management of beaches surrounding inlets. Due to the wide range of spatial and temporal scales involved in ebb tidal delta dynamics, time-series data are very necessary to understand the changes that occur on short temporal scales such as hours to weeks. Additionally, the monitoring of borrow sites for beach nourishment projects in the USA is typically done by estimating infilling rates based on bi-annual or annual seafloor mapping techniques and biological sampling. There is, however, a lack of higher-temporal-resolution datasets pertaining to the infilling rates in borrow areas, especially on dynamic and complex ebb tidal deltas. This is most likely because (a) most ebb tidal deltas are located in very energetic wave and tidal environments where anchoring costly instrumentation on mobile sands is quite challenging; (b) mobile sand waves can potentially bury the instrumentation and pose a challenge to equipment retrieval; and (c) biofouling impacts the acoustic and optical sensors and can require costly periodic cleaning and maintenance for longer-term time-series observations.
Despite efforts to monitor borrow sites, typically by surficial sediment sampling and bathymetric surveys, few studies have been conducted to observe the hydrodynamics/sediment dynamics or to model sediment transport during the infilling process at the borrow sites. Therefore, there are still limited data and understanding about the controlling factors affecting infilling rates and infill composition. Robichaux et al. [4] reported that it took about 13 years to fill in a mud-capped dredge pit located at a paleo river channel in the western Louisiana shelf that was impacted by a longshore current and the Atchafalaya River dispersal system. Wang et al. [5] deployed an instrumented tripod in the Sandy Point dredge pit, which was west of the muddy Mississippi subaqueous delta, and reported that the pit was infilled mainly by the deposition of suspended sediments from the Mississippi River plume in summer. However, Chaichitehrani et al. [6] applied a numerical 3D sediment transport model and found that winter cold fronts played a key role in resuspending ambient seafloor sediment and transporting it to the pit. Bergquist et al. [7] reported that sediment infilling time in dredge pits on some ebb tidal deltas in South Carolina can range from a few years to a few decades and is highly dependent on the depth of the dredged pit and the placement of borrow areas in relation to sediment sources.
During the past two decades, there has been rapid development of modeling studies of inlets and ebb tidal deltas. Reed et al. [8], for instance, reported that the Coastal Modeling System (CMS) Flow Model is a coupled time-dependent circulation, sediment transport, and morphodynamic model currently supported under the Coastal Inlets Research Program conducted at the U.S. Army Engineer Research and Development Center and Coastal and Hydraulics Laboratory. Wang et al. [9] used the CMS model to study regional-scale sediment transport and medium-term morphology changes at a dual-inlet system in west-central Florida and reported complicated wave refraction and breaking over the ebb tidal deltas, erosion along the downdrift beach, and accretion at the attachment point. Sánchez and Wu [10] used the CMS model to simulate the depth-averaged sediment transport model with emphasis on morphodynamic processes near coastal inlets and navigation channels and compared their modeling results with measured bathymetry and water-level data. Beck and Kraus [11] studied the Shark River Inlet in New Jersey and found the formation of a new ebb tidal delta due to the placement of 4.8 million m3 of newly nourished sand to the north and south of this inlet and predicted the morphological conditions.
Our study provides valuable and comprehensive datasets of hydrodynamics, sediment dynamics and seabed elevation changes that have been collected under the influence of varying waves, tides, and storm events on a large ebb tidal delta offshore of the Port Royal Sound of South Carolina of USA. The specific objectives of this paper are to (1) quantify the time-series seabed elevation changes on this large sandy shoal at two locations; (2) determine the contribution of wave heights, tidal currents, and winds to sediment transport at each location; (3) estimate the magnitude and direction of sediment transport flux on the energetic ebb tidal delta; and (4) compare hydrodynamics and sediment dynamics between fair-weather and storm conditions. We also seek to determine the controlling factors that were most important for infilling rates of the borrow pit at our study site.

2. Materials and Methods

The study area was located on a portion of a large half-circle-shaped ebb tidal delta southeast of the Port Royal Sound (PRS) in South Carolina, USA, near which multiple pits have been dredged for beach nourishment on Hilton Head Island (HHI) (Figure 1A) [12]. This subaqueous ebb tidal delta is one of the largest along the South Atlantic Bight (from North Carolina to Florida coasts) of the USA. This extensive delta is formed by the interaction of waves and tidal currents within a sand-rich environment and is also adjacent to a large saltwater lagoon system (Figure 1A).
PRS has a large tidal prism, a small freshwater input, and consequently high salinity throughout the sound [13]. Mean spring tidal range in the area can reach 2.5 m, and tidal currents are often found to be strong in the inlet of PRS (deepest depths in the box of Figure 1A). The bottom substrate in the area is underlain by fine and coarse sand; the percentage of mud normally is 5% or less in open-water areas but increases dramatically landward near the marshes or headwaters of tidal creeks [14]. Adjacent to PRS, HHI is a barrier island with ~20 km of sandy beach shoreline (Figure 1A). This island supports a population of more than 34,000 residents and a tourist industry worth nearly one billion dollars annually. The town of Hilton Head has been maintaining a healthy beach for tourism mainly through beach nourishment and has completed three major beach nourishments in 1990, 1997, and 2006/07. The rate of nourishment over the past 30 years appears to have been roughly twice the underlying erosion rate, leaving HHI with significantly more beach/dune area in 2010 [15]. Previous dredge pits have been located on the southwest side of the ebb tidal delta and have been shown to infill with layers of mud and sand. As a result, these pits could not be reused for beach nourishment in 2011–2012 [7].
In our study, two new sites were selected on the northeast side of the ebb tidal delta to compare the hydrodynamics and sediment dynamics: the borrow site (B1) and the “reference site” (R1), which was located further offshore and not directly impacted by the dredging operations (Figure 1B). The borrow site was approximately 2 km offshore, excavated from October 2011 to February 2012 and directly impacted by dredging (trapezoid polygon next to B1, Figure 1B). Approximately 0.76 million m3 of sand were removed, and the ebb tidal delta was dredged down to approximately 6 m below sea surface throughout the entire dredging area. After the dredging, the flat bottom of this dredge pit was used as our study site “B1” (Figure 1B). Xu et al. [12] collected many surficial and down-core sediment samples before, during, and after the dredging and reported that sediments at this dredge pit became slightly finer and carbonate content decreased from 10% to 4%, but the changes in mud content and organic matter were relatively small. This finding indicated that this pit can be potentially reused in the future for beach nourishment. The “reference site” (R1) was similar in size and orientation to the borrow site. This site was located further offshore on the ebb tidal delta, approximately 10 km offshore and at a water depth of ~6 m. The modes of sediment grain sizes in B1 and R1 were generally between 125 and 250 µm [12]. The distances from B1 and R1 to the channel (deeper part in the middle of ebb tidal delta) were similar, although north of the R1 site were large sandy shoals with a complex morphology. East of R1 were developed sand waves with wave heights of 0.5–1.0 m and wave lengths of ~150 m (Figure 1B).
Bottom-mounted instrumentation was deployed on quadrapods at sites B1 and R1 to collect hydrodynamic, sediment transport, and seabed elevation data. In situ time-series observations were collected during two periods after the dredging: 15 March–12 June 2012 (spring deployment) and 18 August–18 November 2012 (fall deployment).
The instrumentation attached to a quadrapod at reference site R1 included an upward-looking Nortek Acoustic Wave and Current profiler (AWAC) to measure directional surface wave spectra and current velocities throughout the water column, a downward-looking 1200 kHz Teledyne RD Instruments Pulse-Coherent Acoustic Doppler Current Profiler (PCADP) to collect high-resolution data of current velocities in the lower 1 m of the water column, and an Aquatec Acoustic Backscatter Sensor (ABS) to measure the concentration profiles of the suspended sediments throughout the bottom boundary layer (BBL). The downward-looking ABS and PCADP were mounted approximately 1.3 m above the seabed when the frame was deployed. The PCADP measured currents with a 10 cm bin size, and the ABS transducers had a higher vertical resolution of 1 cm bin size throughout the profiles. The ABS also measured small-scale changes in the seabed elevation so that the amount of accretion and erosion, as well as bedform activity, could be measured. All instruments were programmed to operate simultaneously in burst mode with a sampling frequency of 1 Hz for 17 min every two hours in the spring deployment, and every three hours in fall deployment. The second bottom-mounted quadrapod was located inside the 6 m deep dredged pit (B1, Figure 1B). Seabed elevation and near-bed wave and current velocity data were collected using a SonTek Acoustic Doppler Velocimeter (ADV), which measured the high-resolution current velocities at approximately 1 m above the bed. The ADV also measured the seabed elevation changes inside the borrow site. All instrumentation at B1 were collected simultaneously with measurements at the R1 site. Due to the large tidal prism and energetic tidal currents, in addition to the shoaling and breaking waves on the shallow and extensive sand banks, the PRS area is notoriously difficult to collect observational data. In this study, instrumentation deployment and retrieval operations were only conducted during slack tides by the divers who secured the quadrapods in the sand with multiple 1.0–1.5 m long sand screws.
Our study area has been under the impacts of tropical storms and hurricanes for decades. Tropical Storm Beryl passed our study area on 26–30 May 2012, had a lengthy and complex genesis, and followed a zigzag track line (Inset in Figure 1A). On 29 May 2012, Beryl developed its maximum wind speed of 60 kt before sweeping right over HHI and study area. Hurricane Sandy brushed the southeastern U.S. coastline on 22–29 October. 2012, with its eye ~500 km east of our study sites. Sandy reached a peak intensity of 85 kt wind speed on October 29, while it turned northwestward toward the mid-Atlantic states and made final landfall near New Jersey (Inset in Figure 1A). Details of the two storms can be found from the website of NOAA National Hurricane Center (www.nhc.noaa.gov). Hourly measured wind speed and direction were utilized from the NOAA NDBC station at Forth Pulaski, Georgia, which was ~40 km southwest of the borrow site (http://www.ndbc.noaa.gov/station_page.php?station=FPKG1) (Figure 1A).
Near-bed wave orbital velocities at reference site R1 were calculated using the AWAC wave data and linear wave theory, measured significant wave height, and dominant period. At the borrow site B1, the wave height and period were determined from horizontal velocities recorded by the ADV via power spectral analysis following Madsen [16], and wave orbital velocities were calculated following Wiberg and Sherwood [17]. The covariance method from Kim et al. [18] was used to estimate bed shear stress, i.e., the Reynolds stress, by utilizing direct measurement of the turbulent velocities such that the measured instantaneous velocity vectors (u) and (w) were separated into mean <u> and turbulent u’ velocity components where u = <u> + u’. Sediment suspension and transport were measured at the R1 site, where sediment concentration profiles and current profiles were measured simultaneously. At the B1 site, the time series of the mean current velocities and measured wave orbital velocities from the ADV were input into a 1D bottom boundary layer developed by Styles and Glenn [19] to calculate vertical profiles of current velocity, suspended sediment concentrations, and suspended sediment transport profiles within the bottom boundary layer because ABS was not deployed at B1.

3. Results

3.1. Spring Deployment

The spring deployment occurred between 15 March and 12 June 2012. Throughout the deployment, hydrodynamic and sediment transport data were successfully collected at reference site R1 by the upward-looking AWAC, the downward-looking PCADP, and the ABS. The ABS collected suspended sediment concentration profiles and seabed elevation data at R1 until 25 April when it malfunctioned. Relative changes in seabed elevation were detected from the downward-looking PCADP throughout the remainder of the deployment (Figure 2). The ADV at borrow site B1 malfunctioned due to a battery issue during spring deployment.

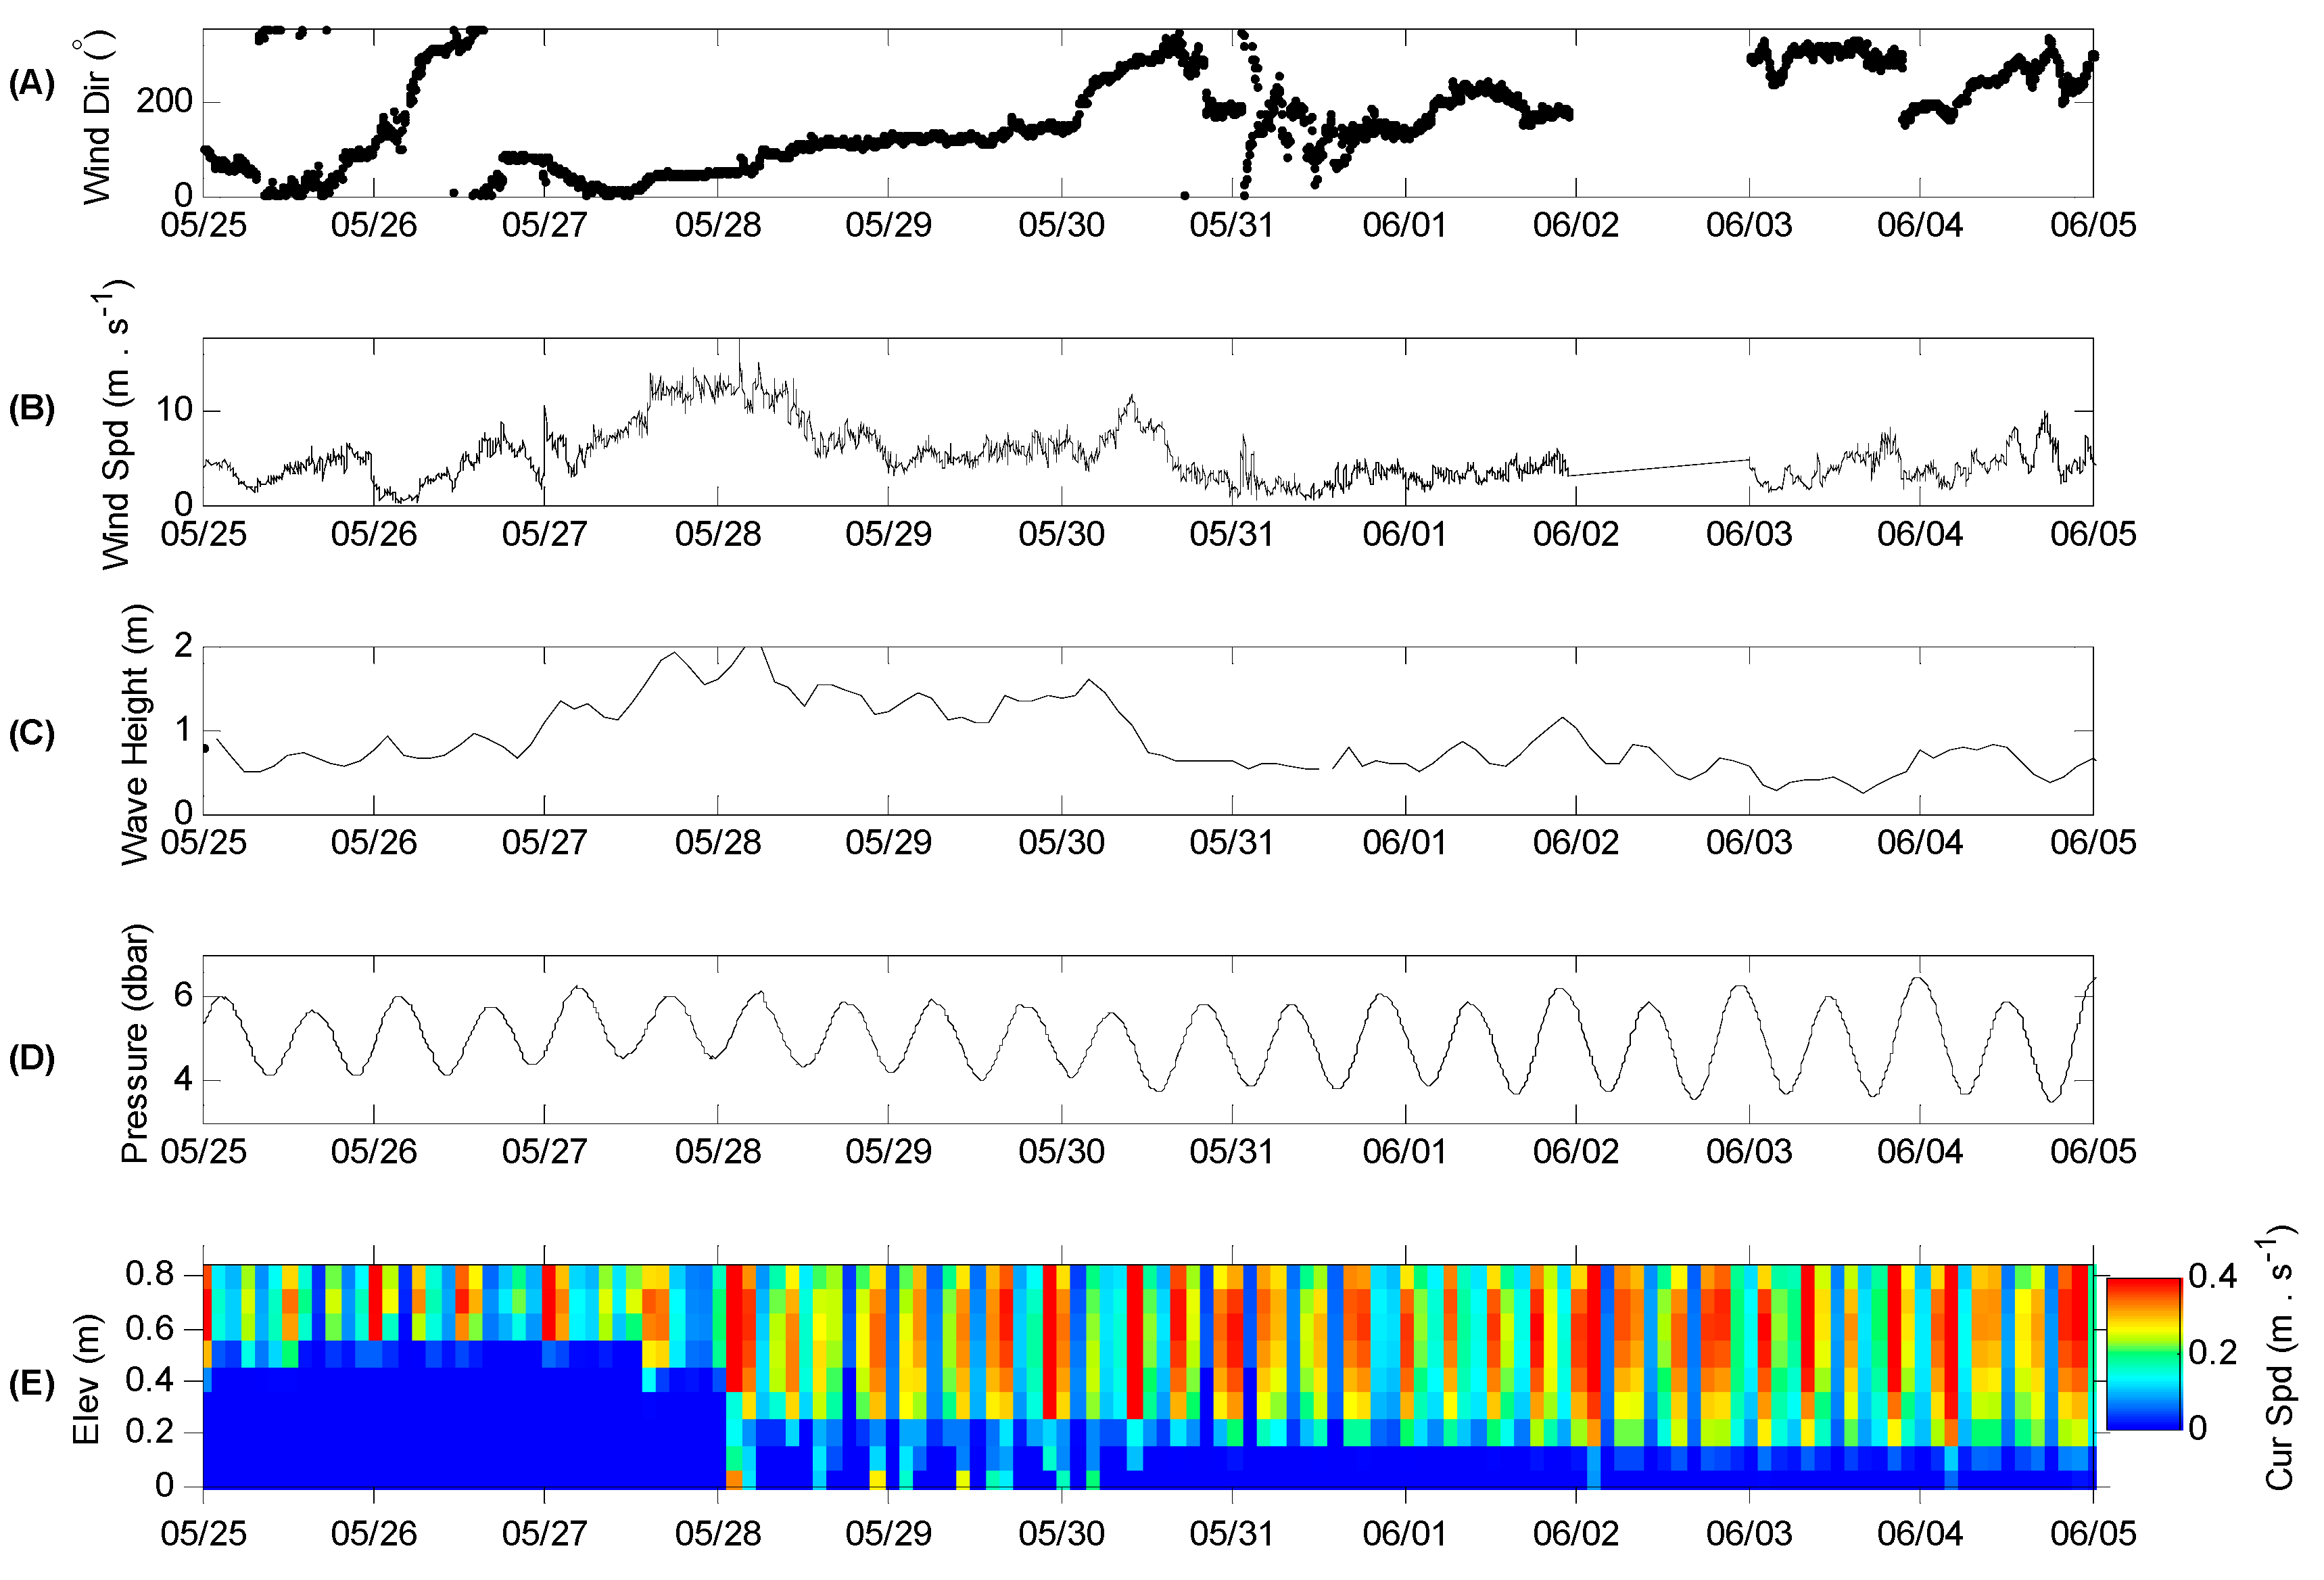
3.1.1. Winds, Waves, and Tides at Reference Site R1

At reference site R1, the significant wave heights ranged from 0.5 to 2.0 m and hourly wind speeds increased above 10 m s−1 only four times throughout the spring deployment. The measured wind speed and wave height data indicate that wave height was highly responsive to increased wind speeds. However, wave heights were more responsive to winds with some long fetches from the northeasterly direction than from the northwesterly direction (Figure 2A–C). For example, northeasterly winds ranged from 8 to 12 m s−1 on March 26 and 27, and significant wave heights increased rapidly from 0.4 to 1.5 m during this time. By contrast, when northwesterly and westerly winds ranged from 10 to 12 m s−1 from 22 to 24 April, wave heights did not increase significantly and remained between 0.5 and 1.0 m (Figure 2A–C). This was likely due to the orientation of the coastline and the sheltering effects from the land. Pressure data from Figure 2D show that tidal ranges varied from about 1.5 m in neap tides to about 2.5 m in spring tides and that the dominant tides are semidiurnal with two highs and two lows per day.

3.1.2. Currents and Sediment at Reference Site R1

Burst-averaged currents within the BBL measured by the downward-facing PCADP ranged from 0.1 m s−1 at slack tide to a maximum of 0.4 m s−1 (Figure 2E). Tidal currents were greatest during the first spring tide of each month in April, May, and June of 2012 when the tidal range exceeded 2 m (Figure 2D,E). Maximum currents within the BBL reached 0.6 m s−1 during spring tides and were of similar magnitudes during the incoming and outgoing tidal cycles. Sediment concentrations increased with depths throughout the BBL (Figure 2E). Sediment concentrations throughout the BBL were highly dependent on the tidal range and resulting strong tidal currents. This can be seen when comparing the AWAC currents velocity profiles (Figure 2D) with the ABS profile data (Figure 2E). These data indicate that tidal currents during both spring and neap tides were capable of suspending sediment in reference site R1.

3.1.3. Tropical Storm Beryl

The largest storm event during the spring deployment was Tropical Storm Beryl, which was a strong pre-season tropical cyclone to make landfall along the U.S. coastline in 2012. Beryl made landfall on 28 May 2012, during which winds speeds at the site increased to 10–16 m s−1 and wave heights rapidly increased to 1.5–2.0 m (Figure 3). On 29 May, the wind speeds decreased to 5 m s−1. Significant wave heights decreased to 1.2 m, and current directions were dominated by the semidiurnal tidal cycle. However, shortly after the waning of the storm, winds continued to wrap back around to northerly again on May 30, causing a delay in the waning of the storm (Figure 3). Significant wave heights increased slightly to about 1.5 m at reference site R1. Subsequently, the storm waned rapidly on 30 May as the winds died down and became calm, and wave heights decreased to 0.5 m.

3.2. Fall Deployment

All instrumentation successfully collected data at both B1 and R1 sites throughout the fall deployment from 15 August to 17 November 2012.

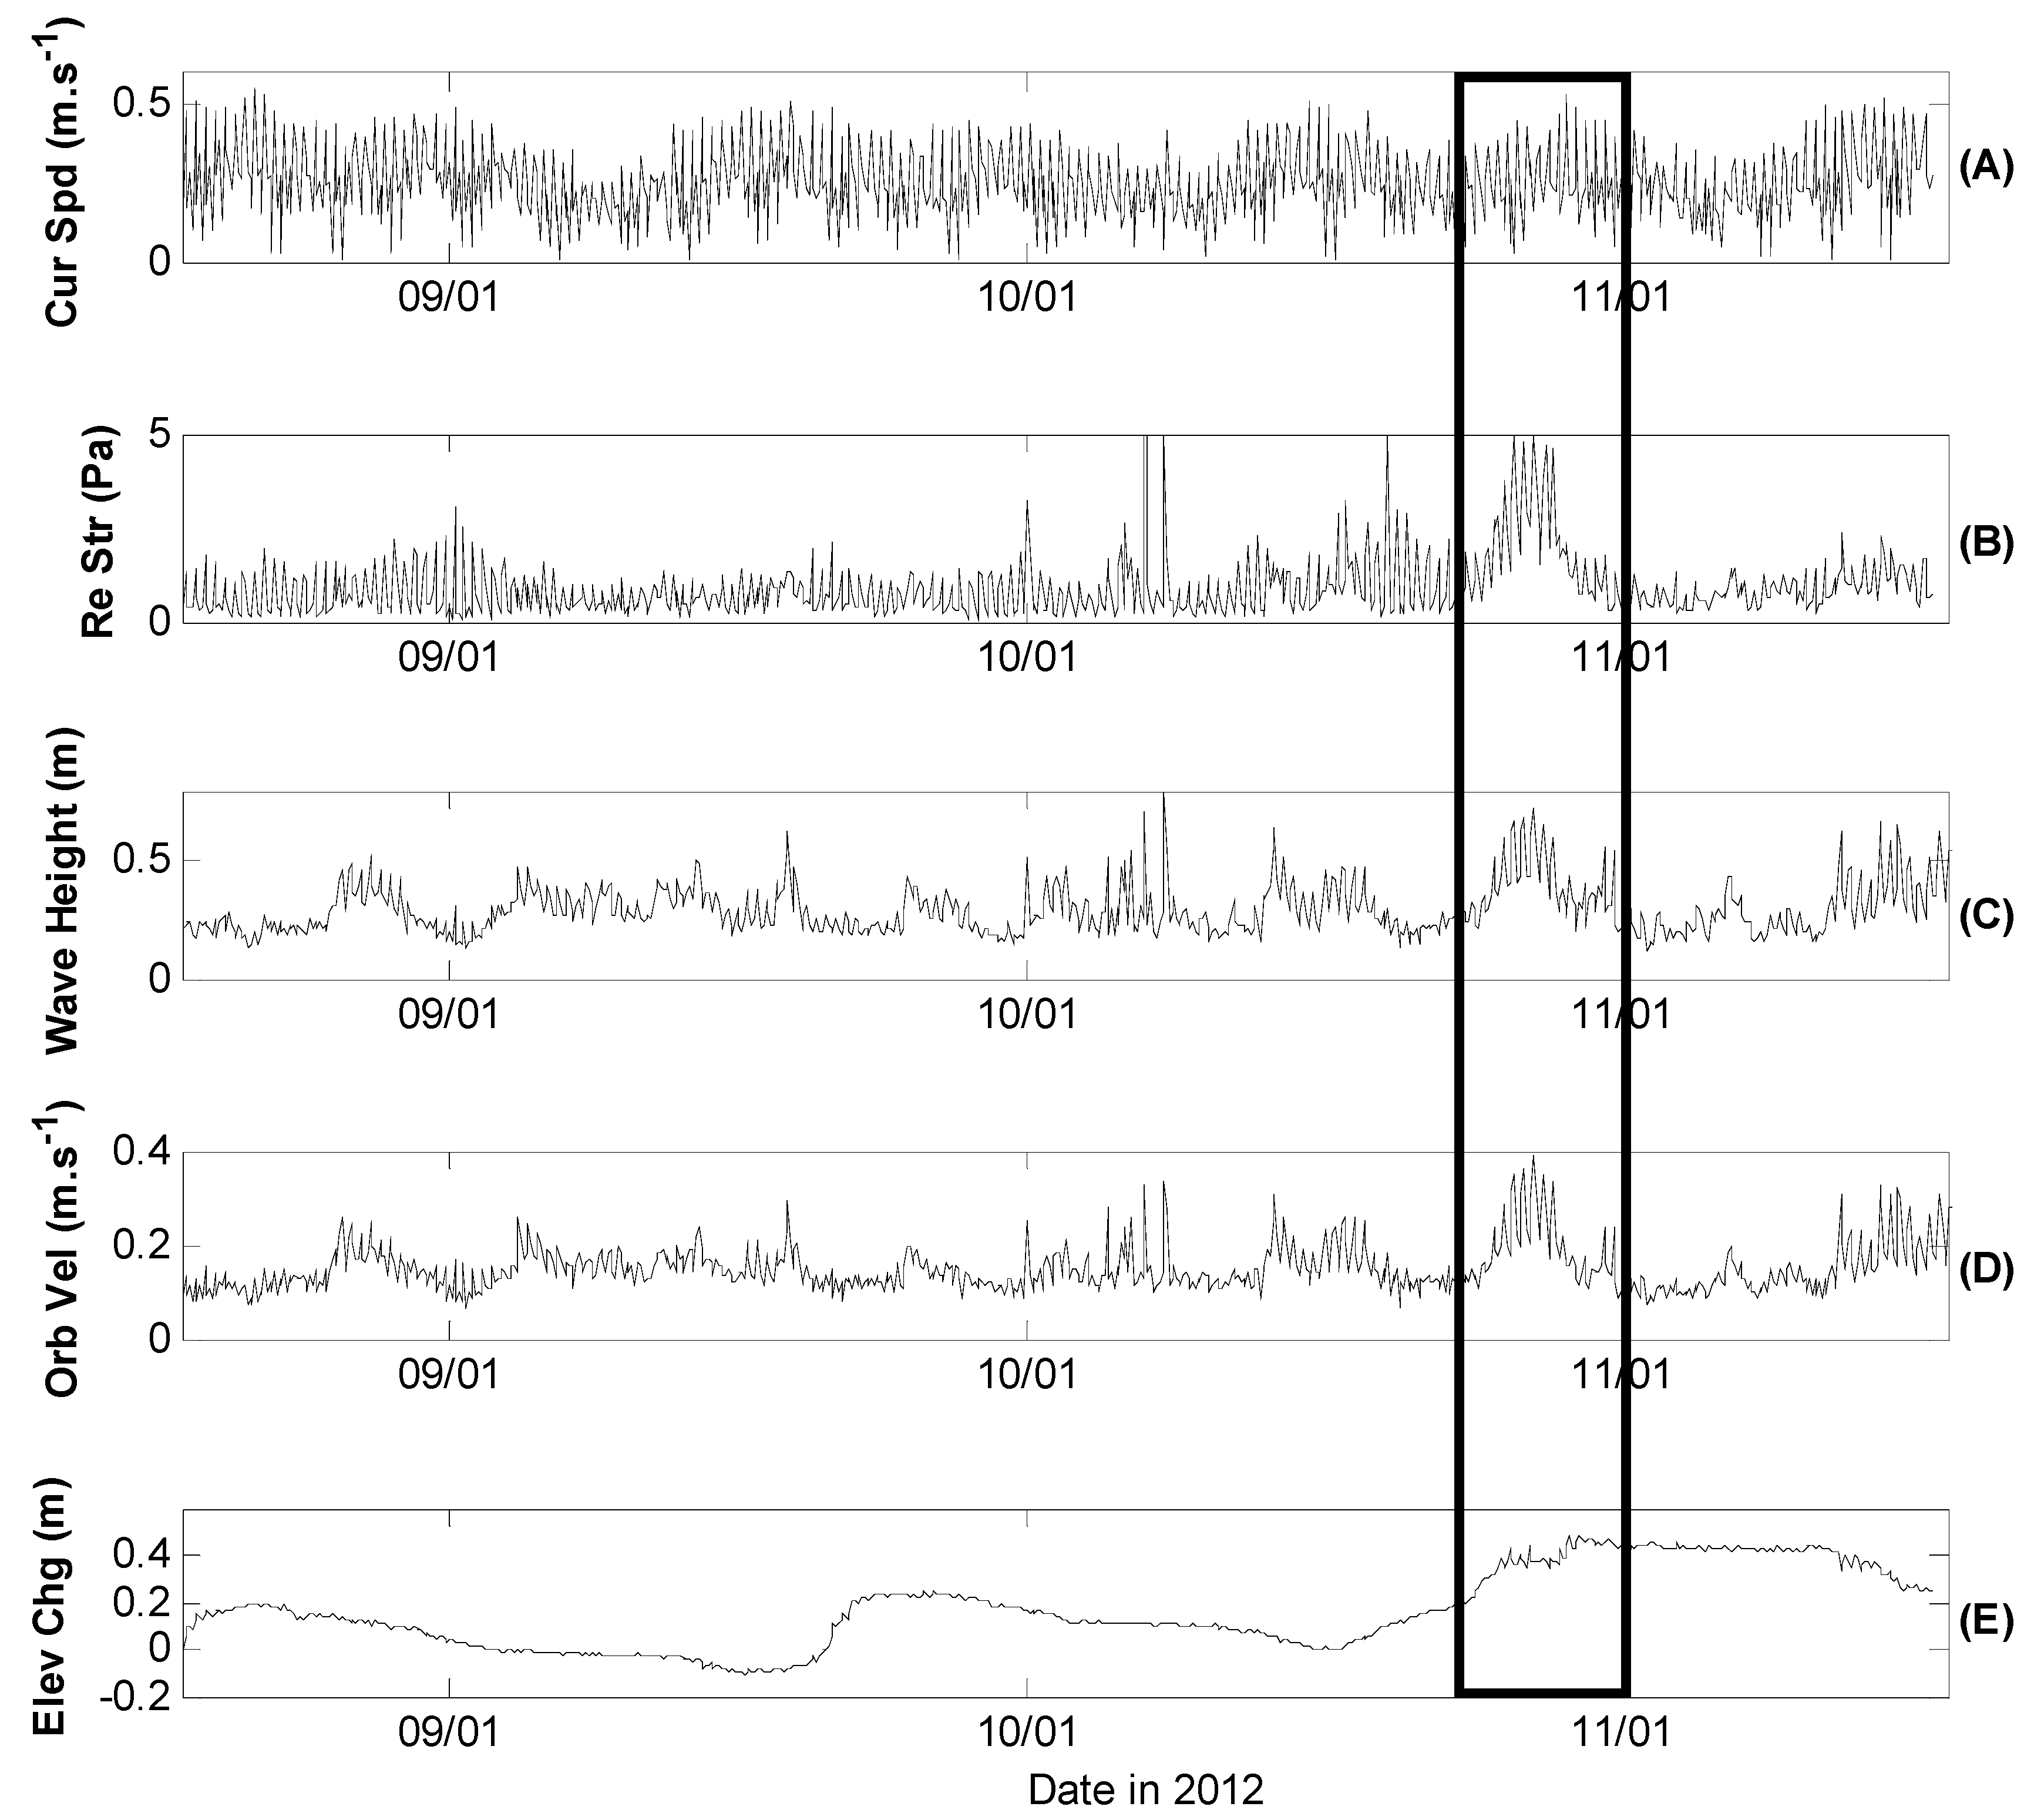
3.2.1. Winds, Waves, and Tides at Reference Site R1

Hourly wind speeds were slightly higher throughout the fall deployment than in the spring deployment and ranged from 0 to 15 m s−1. The strongest winds were typically from northerly or northeasterly directions, or the southerly direction as cold fronts approached the study area (Figure 4). Significant wave heights at reference site R1 were slightly higher than those in spring deployment. Wave heights ranged from 0.5 to 1.5 m, except during Hurricane Sandy when they reached 2 m. The increased wave energy during the fall deployment was primarily due to the direction of the winds, which were more often from the northeast, east, and south directions, and their corresponding long fetches at sea.

3.2.2. Currents and Sediment at Reference Site R1

PDADP currents throughout the water column exhibited a semidiurnal tidal signal with similar currents in the spring deployment (Figure 4E). Tidal currents were greatest during the spring tide that occurred approximately in the middle of each month between 15 August to 17 November 2012, when the spring tidal range exceeded 2 m (Figure 4D). In addition to the tidal currents, wind-driven currents also played a role in the transport of sediment during the fall deployment. Winds during the fall deployment were more frequently from a consistent direction with a long duration to generate strong wind-driven currents than in the spring deployment. Sediment was resuspended frequently at R1, with the highest sediment concentrations over 0.04 kg m−3 (Figure 4F).

3.2.3. ADV Data at Borrow Site B1

In borrow site B1, current speed oscillated between 0 and 0.5 m s−1, following the patterns from flood–ebb and spring–neap tides (Figure 5A). The calculated Reynolds stress generally varied between 0 and 2 Pa but reached 5 Pa during Hurricane Sandy (Figure 5B). Bottom orbital velocities ranged from 0.1 and 0.3 m s−1, reaching 0.4 m s−1 during Hurricane Sandy (Figure 5D). Seabed elevation changes were mainly at cm to dm levels (Figure 5E).

3.2.4. Hurricane Sandy

During this fall deployment, hydrodynamic and sediment transport data were measured during the most notable storm of year 2012, namely “Hurricane Sandy” (inset in Figure 1A). Local wind speeds at our study site increased gradually beginning on 27 October over a 72 h period, slowly switching direction from northeasterly to westerly (Figure 6). Wave heights at R1 site increased rapidly, reaching 2 m when wind speeds reached 10 m s−1 on 27 October. During this time of increased wave energy, suspended sediment concentrations at R1 increased and current speeds within the BBL exceeded 0.4 m s−1 for the duration of the storm (Figure 6E). Wave heights and orbital velocity values decreased rapidly on 28 October as the wind direction switched to northwesterly and westerly. However, the current’s magnitude remained high during this time (Figure 6E).

4. Discussion

4.1. Hydrodynamics

The relative contribution of waves and tides varied with the changing meteorological and oceanographic conditions in both spring and fall 2012. Details are discussed below to demonstrate the variations of the constantly changing tides and waves.

4.1.1. Tides

The oscillating tidal current’s directions can be identified on the scatter plots of east(+)/west(−) and north(+)/south(−) currents (Figure 7). In borrow site B1, which is about 6 m deep, ADV data were used to determine dominant currents at 1 m above bed. At B1, tidal current directions were NW during flood tides and SE in ebb tides in fall 2012, following the orientation of the deep tidal inlet in which tidal water moved in and out of the PRS (Figure 7A,C).
In reference site R1, PCADP and ABS measured parameters along profiles using different bin sizes (10 vs. 1 cm), and the elevation at 0.7 m above bed was used for our hydrodynamics and sediment transport (in Section 4.2.2) analyses because this elevation was always above the dynamic water–sediment interface during both deployments and was within the “overlapped” detecting ranges of both PCADP and ABS. At R1, currents at 0.7 m above bed shifted from an NE to a SW orientation in spring 2012 to E–W in fall 2012; flood tidal currents toward SW or W after slack tides were sometimes stronger than ebb ones (Figure 7B,D).
Burst-averaged currents within the BBL showed a strong semidiurnal tidal signal at R1 in both spring and fall 2012. It is obvious that tidal currents played an important role in the frequent suspension of sediments (Figure 2 and Figure 4). Suspended sediment concentrations were high when the tidal range exceeded ~2.0 m. This occurred mainly during a seven-day period centering on the spring tides, particularly during the biggest tidal ranges that occurred at the beginning of each month in the spring deployment and the middle of each month in the fall deployment of 2012 (Figure 2 and Figure 4). On the other hand, during times of neap tides, tidal currents were relatively slow and suspended sediment concentrations were lower. The tides at R1 appeared to be highly correlated with the spring–neap fortnightly cycle as well as the semidiurnal cycle.

4.1.2. Waves

Wave energy was important for the re-suspension of sediments at R1, as shown in the wave heights and ABS sediment concentration profiles in the spring and fall deployments (Figure 2 and Figure 4). In fall 2012, wave heights at borrow site B1 were generally between 0.2 and 0.6 m, consistently lower than those at reference site R1 (0.4–2.0 m) over the same period. This was most likely due to wave energy dissipation due to shoaling and breaking on the sizable and extensive shallow sandy shoals on the ebb tidal delta. During multiple periods in spring and fall 2012, when wave heights increased to be over ~0.8 m tall at R1, suspended sediment concentration increased in the lower portion of the BBL, indicating that suspension of sediment was occurring close to the seabed and within the thin and possibly stratified wave boundary layer (Figure 2 and Figure 4). These high concentrations of sediments, however, were not mixed vertically in the entire 1 m thick BBL until the maximum tidal currents or strong wind-driven currents occurred.

4.2. Sediment Dynamics

4.2.1. Bed Elevation

Seabed elevation changes are highly related to sediment erosion and deposition. In this study, a total of three acoustic methods were used to study the bed elevation changes. The ADV in borrow site B1 used acoustic returns to detect the distance from the center of its three probes to the water–sediment interface, and its measuring resolution was 0.1 cm (Figure 5). The downward-looking ABS in reference site R1 used a bin size of 1 cm, and the water–sediment interface can be clearly identified using the inferred sediment concentrations (Figure 2 and Figure 4). The downward-looking PCADP in reference site R1 used a bin size of 10 cm, and the water–sediment interface was approximately identified using the elevations of the lower-most calculated velocities (Figure 2 and Figure 4).
During spring deployment, the “bottom-tracking” data from the PCADP in Figure 2D matched well with the ABS seabed elevations in Figure 2E, both indicating about 40 cm sediment deposition at R1 from 15 March to 22 April 2012. The seabed elevation continued to fluctuate during multiple wind-driven events after 22 April. A net increase in the seabed elevation occurred during energetic wind events, with an overall increase in the seabed elevation of nearly 50 cm. Observations from divers indicated that multiple large sand waves of approximately 0.5–1.0 m tall were present near the instrument frame during both the deployment and the retrieval activities. In addition to the gradual increase in seabed elevation, smaller variations in the seabed were present when bottom orbital velocities and suspended sediment concentrations increased throughout the deployment. However, during Tropical Storm Beryl, the seabed elevation decreased 25 cm and continued to fluctuate, resulting in an overall net deposition of only ~20 cm at the end of the spring deployment. The changes in seabed elevation during these events do not appear to be closely correlated to the wind direction, and most likely were due to the migration of one of the observed sand waves north or east of reference site R1 that actually migrated under the quadrapod (Figure 1B). PCADP data showed that it took about 2 months to finish this migration of sand waves.
During the fall deployment, the shape of the seabed elevation time-series data from the ADV at borrow site B1 suggested three sizeable “highs” and three “lows” between 18 August and 18 December 2012 (Figure 5). There seemed to be two types of bed elevation changes: one being at the mm to cm level and likely related to ripple activities and the other being greater than 10 s of centimeters tall and related to sand waves. Additionally, the ripples became slightly taller during the passing of Hurricane Sandy when waves were tall and currents were strong (Figure 4 and Figure 5). The interactions between strong tidal currents and increased wave heights might have facilitated the development of short-lived ripples during Hurricane Sandy. The seabed elevation at reference site R1, however, was not like these during its spring deployment and showed no evidence of large sand waves migrating under the quadrapod (Figure 4). Smaller variability in the seabed elevation of approximately 15 cm was evident throughout the fall deployment at reference site R1 (Figure 4).

4.2.2. Sediment Transport

Both PCADP and ABS data at 0.7 m above bed were used to calculate sediment transport directions and magnitudes in the spring and fall deployments. The cumulative net transport time series for both deployments indicated that the overall cumulative transport directions were toward the south and west (Figure 8 and Figure 9). The sediment flux time series contained some semidiurnal frequency due to the oscillatory tidal currents, which vertically mixed sediments (“small wiggles” on Figure 8D,E and Figure 9D,E). The overall pattern in Figure 8 and Figure 9 showed that even a small increase in the sediment concentration resulted in a dramatic increase in suspended sediment flux during the maximum tidal currents in spring and neap tides.
Bottom wave velocities were observed to be important in suspending sediments, and wind-driven currents were important in the transport of the sediment. The winds in spring alternated between northeasterly and southeasterly/southwesterly, but the winds in the fall were stronger from the north and northeast (Figure 2 and Figure 4). The northerly and northeasterly winds in fall formed asymmetrical southward currents, which can be clearly seen in Figure 9B, which then led to southward net sediment transport. During the times when the most rapid cumulative sediment flux occurred, wind-driven currents were mainly toward the SW or W direction. There was a large net transport toward the south and west during the times of strong northeasterly winds and high suspended sediment concentrations (Figure 8 and Figure 9). When tides were shown to transport the sediment in both the incoming and outgoing tides equally, there was relatively little net transport, and the cumulative sediment flux indicated a “back-and-forth” motion with small amounts of overall transport. However, the tidal currents transported the sediments when tidal currents were asymmetrical and strong enough to suspend sediments dominantly during one direction of the tidal cycle. This can be seen during 6–8 April 2012 when strong southward currents occurred during spring tide (Figure 2 and Figure 8).
Both Tropical Storm Beryl and Hurricane Sandy generated high winds, taller waves, fast currents, and high sediment concentration. However, the sediment transport fluxes at R1 during Tropical Storm Beryl and Hurricane Sandy were not the greatest during the two deployments. This could be due to the following reasons. (a) Xu et al. [20] used a numerical model to study sediment transport on the Louisiana shelf during Hurricanes Katrina and Rita and reported that the regions to the east of Hurricanes Katrina and Rita had stronger winds, taller waves, and deeper seabed erosions. Our study site R1 was about 500 km west of Hurricane Sandy and the highest wind speeds were less than about 12 m s−1 after Hurricane Sandy made the landfall. (b) Similarly, using a sediment transport model, Liu et al. [21] reported that Hurricanes Harvey and Nate contributed less than 10% of sediments infilling in Caminada and Raccoon Island dredge pits on the Louisiana shelf from July 2017 to October 2018 due to the far distance, which is comparable with the distance of 500 km from our study area to Hurricane Sandy. (c) During Hurricane Sandy, PCDCP currents were strong but sediment concentrations were not extremely high (Figure 9C). It was possible that the advection of some currents carried less turbid water to R1, but local resuspension at R1 was relatively limited. (d) Our results from Figure 8 and Figure 9 show that the combinations of tidal current asymmetry, tall waves, and high concentrations are all required to generate high sediment transport fluxes.

4.3. Implication and Future Work

Our study site on the ebb tidal delta offshore of PRS is under the combined interactions among hydrodynamics, morphodynamics, and sediment dynamics. Our bed elevation data showed that both ripples of about cm tall and sand waves from dm to m tall were impacted by winds, waves, tides, and currents. This result highlighted that any observational work and dredging activities near ebb tidal deltas should take these large bed elevation changes into consideration, including possible burying of research and dredging equipment. Xu et al. [12] reported that sediment’s median grain sizes in both B1 and R1 sites remained between 2 and 3 phi (125 to 250 µm), and mud content was always less than 6%, indicating that the high-quality sand infilling this dredge pit near B1 might be reused in future dredging activities. This result is different than the infilled mud–sand layers found by Bergquist et al. [7]. It is well known that overall long-term longshore sediment transport in South Carolina is toward the SW, which is consistent with what was observed in both spring and fall deployments at R1 in 2012. The very small amount of mud that might be transported into this dredge pit near B1 could be because (a) about 90–100% of sediment upstream and northeast of this pit was sand (see Figure 2 in Xu et al. [12]) and (b) mud from the marshes near PRS was relatively far from B1 and R1 and was mainly transported SW.
Our finding agrees with the conclusion of Bergquist et al. [7] that the type and rate of infilling sediment is dependent on the depth and orientation of the dredged pit, as well the placement of borrow areas in relation to its sediment sources and distance offshore. As we observed in our comparison between these two study sites, the R1 site was in a higher-energy environment where sediment mobility was more common and wave energy was much higher with taller waves that were likely shoaling and possibly breaking at times. R1 site was exposed to high shear stresses and more frequent sediment resuspension and mobility. As such, one would assume that there would be less deposition in a higher-energy environment. However, because there was an abundance of fine-to-medium sand around this site and sediment mobility occurred frequently, along with the evidence of bedload transport and migrating sand waves in the area, we believe that if this location would have been used as a borrow site, it may have infilled more rapidly. The data show that the wave energy was lower at the site B1, and tidal currents were the dominant process controlling sediment movement. Moreover, the dredge pit was cut into the side of the large channel where tidal currents were swift and strong enough to keep mud and clay from being deposited. The location of this site on the edge of the ebb tidal delta facing a deep channel also played a role in the infilling rates because wave energy was relatively low due to wave dissipation on the ebb tidal delta to the NE, E, and SE directions and the deeper channel and sand banks to the S and SW directions. The infilling rate was shown to be fairly slow within the borrow pit where the instrumentation was located, and sediment elevation only showed small cm-level variations; but based on the sediment mobility measured at the reference site, it is likely that sand waves would eventually migrate across the banks located to the NE–E and started to fill in the borrow pit from that direction.
In this study, a limited number of sensors were available to study two sites B1 and R1. Unfortunately, the battery of the ADV in spring malfunctioned and the ABS only worked for about 30 days in spring. These challenges somewhat limited our scope of work and the comparison between B1 and R1. In the future, more acoustic and optical sensors are needed for the comparison of two sites, such as optical backscatter sensors with a rotary brush to minimize biofouling, laser in situ scattering and transmissometry, and automatic sediment sampler to ground-truth sediment concentrations calculated using ABS. Satellite imagery analysis will help us better understand the spatial variations of sea surface turbid plumes coming out of PRS and how the plumes will interact with B1 and R1 sites. In addition, our quadrapod observational data can be used to calibrate and validate the numerical model of sediment transport.

5. Conclusions

Bottom-mounted instrumentation was deployed at two sites on a large sandy shoal of an ebb tidal delta offshore of Port Royal Sound of South Carolina to collect the data of hydrodynamics and sediment dynamics. Below are the major conclusions from this study:
  • High-temporal-resolution time-series hydrodynamics and sediment data were collected near the Port Royal Sound to study the impacts of winds, waves, tides, and currents. These data such as bed elevation and periodicity of currents and sediment concentration are valuable to ongoing and future modeling studies to fine tune parameters such as erosional rate, settling velocity, and critical shear stress in energetic sand-dominated sediment environments.
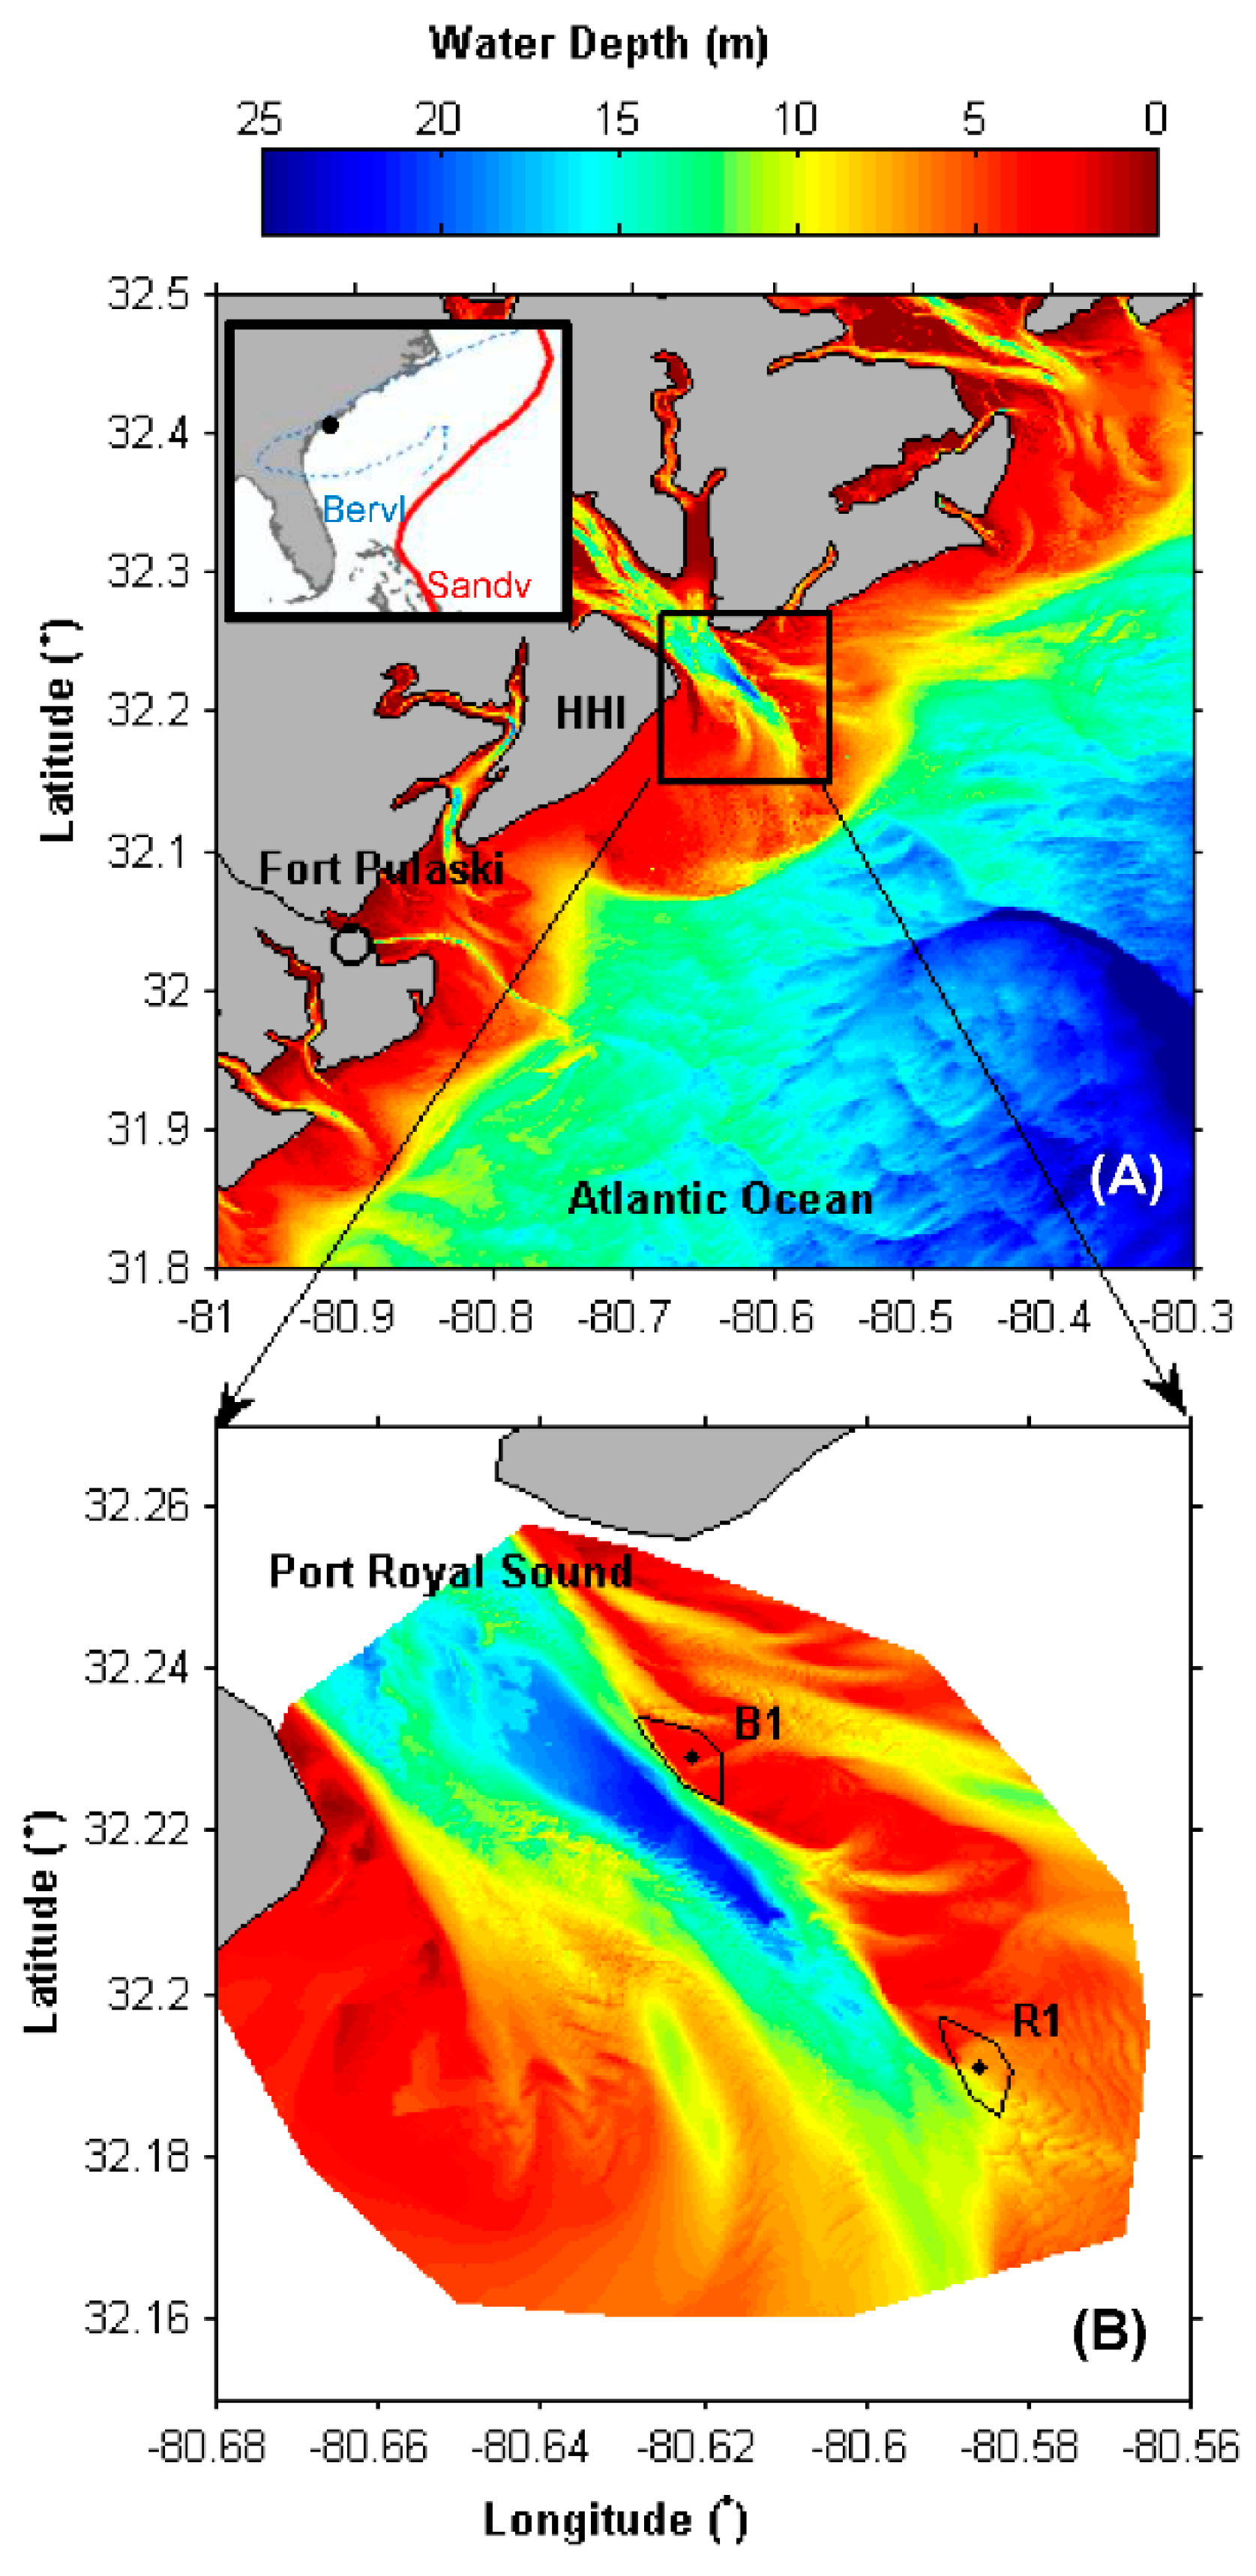
  • Bidirectional currents at borrow site B1 were highly impacted by the NW–SE orientation of the tidal inlet near Port Royal Sound. Currents at reference site R1 seemed to be impacted by the E–W orientation of southern edge of ebb tidal delta, SW longshore currents, and winds.
  • Waves at reference site R1 were generally taller than those at borrow site B1. This was most likely due to wave energy dissipation due to shoaling and wave breaking on the sizable and extensive sandy shoals on the ebb tidal delta.
  • Sediment concentrations were highly associated with the flood and ebb tides (semidiurnal) as well as the spring and neap tides (fortnightly). High sediment concentrations were generally associated with strong spring tidal currents.
  • Bed elevation data indicated active migrating bedforms from cm to dm tall and both ripples and sand waves were identified. It could take weeks to months for a sand wave to finish one cycle of migration (from high to low). Future infrequent non-time-series data collections could be biased due to the very dynamic nature of such environments.
  • Although both Tropical Storm Beryl and Hurricane Sandy formed tall waves and fast currents, they did not generate the greatest net sediment transport fluxes during the two observational periods in 2012, likely because of the far distance from the eye of Hurricane Sandy and the quadrapod location in relation to the hurricane track.

Author Contributions

Conceptualization, K.X. and P.A.W.; methodology, K.X. and P.A.W.; software, Y.M., K.X., and P.A.W.; validation, K.X. and P.A.W.; formal analysis, Y.M., K.X., and P.A.W.; investigation, K.X. and P.A.W.; resources, K.X. and P.A.W.; data curation, K.X. and P.A.W.; writing—original draft preparation, K.X., P.A.W., and Y.M.; writing—review and editing, K.X., P.A.W., and Y.M.; visualization, K.X., P.A.W., and Y.M.; supervision, K.X. and P.A.W.; project administration, K.X. and P.A.W.; funding acquisition, K.X. and P.A.W. All authors have read and agreed to the published version of the manuscript.

Funding

This study was funded by South Carolina Sea Grant Consortium (with National Oceanic and Atmospheric Administration award no. NA10OAR4170073).

Acknowledgments

Steven Luff, Robert Moorer, Rangley C. Mickey, and William Lucas of the Coastal Carolina University helped field instrumentation deployments and retrievals. Denise Sanger, George Riekerk, Stacie Crowe, Robert F. Van Dolah, Marty Levisen, Steve Burns, Mollie Reynolds, and Leona Forbes of the South Carolina Department of Natural Resources contributed to proposal writing, project management, field operation, and lab sample analysis. Christopher G. Creed of Olsen Associates, Inc. provided valuable suggestions and comments to our study. Derk Bergquist helped the development of the proposal in the early stage of this project. We are grateful to the comments and suggestions of the editors for the Special Issue of this journal.

Conflicts of Interest

The authors declare no conflict of interest.

References

  1. Miner, M.D.; Kulp, M.A.; FitzGerald, D.M.; Flocks, J.G.; Weathers, H.D. Delta lobe degradation and hurricane impacts governing large-scale coastal behavior, South-central Louisiana, USA. Geo-Mar. Lett. 2009, 29, 441–453. [Google Scholar] [CrossRef]
  2. Khalil, S.M.; Finkl, C.W.; Roberts, H.H.; Raynie, R.C. New approaches to sediment management on the inner continental shelf offshore coastal Louisiana. J. Coast. Res. 2010, 264, 591–604. [Google Scholar] [CrossRef]
  3. Xu, K.H.; Bentley, S.J.; Day, J.W.; Freeman, A.M. A review of sediment diversion in the Mississippi River Deltaic Plain. Estuar. Coast. Shelf Sci. 2019, 225, 106241. [Google Scholar] [CrossRef]
  4. Robichaux, P.; Xu, K.; Bentley, S.J.; Miner, M.; Xue, Z.G. Morphological evolution of a mud-capped dredge pit on the Louisiana shelf: Nonlinear infilling and continuing consolidation. Geomorphology 2020, 354, 107030. [Google Scholar] [CrossRef]
  5. Wang, J.; Xu, K.; Li, C.; Obelcz, J. Forces Driving the Morphological Evolution of a Mud-Capped Dredge Pit, Northern Gulf of Mexico. Water 2018, 10, 1001. [Google Scholar] [CrossRef] [Green Version]
  6. Chaichitehrani, N.; Li, C.; Xu, K.H.; Allahdadi, M.N.; Hestir, E.L.; Keim, B.D. A numerical study of sediment dynamics over Sandy Point dredge pit, west flank of the Mississippi River, during a cold front event. Cont. Shelf Res. 2019, 183, 38–50. [Google Scholar] [CrossRef]
  7. Bergquist, D.C.; Crowe, S.E.; Levisen, M.; Van Dolah, R.F. Change and Recovery of Physical and Biological Characteristics of the Borrow Area Impacted by the 2007 Folly Beach Emergency Renourishment Project; Final Report; The South Carolina Marine Resources Research Institute, South Carolina Marine Resources Division: Charleston, SC, USA, 2009; 70p.
  8. Reed, C.W.; Brown, M.E.; Sanchez, A.; Wu, W.; Buttolph, A.M. The Coastal Modeling System Flow Model (CMS-Flow): Past and Present. J. Coast. Res. 2011, 59, 1–6. [Google Scholar] [CrossRef]
  9. Wang, P.; Beck, T.M.; Roberts, T.M. Modeling Regional-Scale Sediment Transport and Medium-Term Morphology Change at a Dual-Inlet System Examined with the Coastal Modeling System (CMS): A Case Study at Johns Pass and Blind Pass, West-Central Florida. J. Coast. Res. 2011, 59, 49–60. [Google Scholar] [CrossRef]
  10. Sanchez, A.; Wu, W. A Non-Equilibrium Sediment Transport Model for Coastal Inlets and Navigation Channels. J. Coast. Res. 2011, 59, 39–48. [Google Scholar] [CrossRef]
  11. Beck, T.M.; Kraus, N.C. New Ebb-Tidal Delta at an Old Inlet, Shark River Inlet, New Jersey. J. Coast. Res. 2011, 59, 98–110. [Google Scholar] [CrossRef]
  12. Xu, K.H.; Sanger, D.; Riekerk, G.; Crowe, S.; Van Dolah, R.; Wren, P.; Ma, Y. Seabed texture and composition changes offshore of Port Royal Sound, South Carolina before and after the dredging for beach nourishment. Estuar. Coast. Shelf Sci. 2014, 149, 57–67. [Google Scholar] [CrossRef]
  13. Crotwell, A.; Moore, W. Nutrient and Radium Fluxes from Submarine Groundwater Discharge to Port Royal Sound, South Carolina. Aquat. Geochem. 2003, 9, 191–208. [Google Scholar] [CrossRef]
  14. SCWRC, South Carolina Water Resources Commission. Port Royal Sound Environmental Study; South Carolina Water Resources Commission: Columbia, SC, USA, 1972; 555p.
  15. Kana, T.W.; Traynum, S.B.; Gaudiano, D.; Kaczkowski, H.L.; Hair, T. The physical condition of South Carolina beaches 1980–2010. J. Coast. Res. 2013, 69, 61–82. [Google Scholar] [CrossRef]
  16. Madsen, O.S. Spectral Wave-Current Bottom Boundary Layer Flows. In Proceedings of the 24th International Conference on Coastal Engineering, Kobe, Japan, 23–28 October 1994. [Google Scholar]
  17. Wiberg, P.L.; Sherwood, C.R. Calculating wave-generated bottom orbital velocities from surface-wave parameters. Comput. Geosci. 2008, 34, 1243–1262. [Google Scholar] [CrossRef]
  18. Kim, S.C.; Friedrichs, C.T.; Maa, J.Y.; Wright, L.D. Estimating bottom stress in tidal boundary layer from acoustic Doppler velocimeter data. J. Hydraul. Eng. 2000, 126, 399–406. [Google Scholar] [CrossRef] [Green Version]
  19. Styles, R.; Glenn, S.M. Modeling stratified wave and current bottom boundary layers on the continental shelf. J. Geophys. Res. 2000, 105, 24119–24139. [Google Scholar] [CrossRef] [Green Version]
  20. Xu, K.H.; Mickey, R.C.; Chen, Q.J.; Harris, C.K.; Hetland, D.; Hu, K.; Wang, J. Shelf Sediment Transport during Hurricanes Katrina and Rita. Comput. Geosci. 2016, 90, 24–39. [Google Scholar] [CrossRef]
  21. Liu, H.; Xu, K.; Ou, Y.; Bales, R.; Zang, Z.; Xue, Z.G. Sediment Transport near Ship Shoal for Coastal Restoration in the Louisiana Shelf: A Model Estimate of the Year 2017–2018. Water 2020, 12, 2212. [Google Scholar] [CrossRef]
Figure 1. The study area of Port Royal Sound in South Carolina. (A) Bathymetry data of upper panel are downloaded from National Oceanic and Atmospheric Administration’s National Geophysical Data Center (NGDC). The inset in (A) shows the South Atlantic Bight, the study area (black dot), and track lines of Tropical Storm Beryl (blue) and Hurricane Sandy (red). (B) Bathymetry data of the lower panel are provided by Olsen Associate. Borrow site B1 and reference site R1 are two quadrapod locations in this study. Fort Pulaski is wind station maintained by the National Data Buoy Center.
Jmse 08 00810 g001
Figure 2. (A) Wind direction and (B) speed from Fort Pulaski, GA; panels (CF) are data from R1 site collected between March 15 and June 12, 2012. (C) Wave height and (D) pressure are based on an upward-looking acoustic wave and current profiler (AWAC). (E) Current speed is from the pulse-coherent acoustic Doppler current profiler (PCADP). (F) Suspended sediment concentration is from a downward-looking acoustic backscatter sensor (ABS). The rectangle highlights the passing of Tropical Storm Beryl in late May 2012.
Jmse 08 00810 g002
Figure 3. (A) Wind direction and (B) speed from Fort Pulaski, GA; panels (CE) are data from R1 site collected between 25 May and 5 June 2012 during Tropical Storm Beryl. (C) Wave height and (D) pressure are based on an upward-looking acoustic wave and current profiler (AWAC). (E) Current speed is from the pulse-coherent acoustic Doppler current profiler (PCADP). No ABS data were collected during this period due to a malfunction.
Jmse 08 00810 g003
Figure 4. (A) Wind direction and (B) speed from Fort Pulaski, GA; panels (CF) are data from reference site R1 collected between August 15 to November 17, 2012. (C) Wave height and (D) pressure are based on upward-looking AWAC. (E) Current speed is from downward-looking PCADP. (F) Suspended sediment concentration is from downward-looking ABS. The rectangle highlights the far-distance impact of Hurricane Sandy in late October 2012.
Jmse 08 00810 g004
Figure 5. Data collected using an acoustic Doppler velocimeter (ADV) from B1 site between August 18 and December 18, 2012. (A) Horizontal current speed, (B) Reynolds Stress, (C) wave height, (D) near-bed wave orbital velocity, and (E) seabed elevation change. The rectangle highlights the passing of Hurricane Sandy in late October 2012.
Jmse 08 00810 g005
Figure 6. (A) Wind direction and (B) speed from Fort Pulaski, GA; panels (CF) are data from reference site R1 collected between 22 October and 2 November 2012 during Hurricane Sandy. (C) Wave height and (D) pressure are based on upward-looking AWAC. (E) Current speed is from downward-looking PCADP. (F) Suspended sediment concentration is from downward-looking ABS.
Jmse 08 00810 g006
Figure 7. Scatter plots of east(+)/west(−) and north(+)/south(−) currents in m s−1 from (A) ADV data collected at B1 in fall 2012 and PCADP data at 0.7 m above bed collected at R1 in spring (B) and fall (D) of 2012. (C) the base map for the study area.
Jmse 08 00810 g007
Figure 8. (A) East(+)/west(−) and (B) north(+)/south(−) currents in m s−1 from PCADP data at 0.7 m above bed collected at R1 in spring 2012. (C) Sediment concentration in kg m−3 from ABS data at 0.7 m above bed collected at R1 in spring 2012. (D) East(+)/west(−) and (E) north(+)/south(−) cumulative sediment fluxes in kg m−2 s−1 at R1 in spring 2012.
Jmse 08 00810 g008
Figure 9. (A) East(+)/west(−) and (B) north(+)/south(−) currents in m s−1 from PCADP data at 0.7 m above bed collected at R1 in fall 2012 between 18 August to 17 November 2012. (C) Sediment concentration in kg m−3 from ABS data at 0.7 m above bed collected at R1 in fall 2012. (D) East(+)/west(−) and (E) north(+)/south(−) cumulative sediment fluxes in kg m−2 s−1 at R1 in fall 2012.. The rectangle highlights the passing of Hurricane Sandy in late October 2012.
Jmse 08 00810 g009
Publisher’s Note: MDPI stays neutral with regard to jurisdictional claims in published maps and institutional affiliations.

