Article

Human Factor in Navigation: Overview of Cognitive Load Measurement during Simulated Navigational Tasks

1
Faculty of Maritime Studies and Transport, University of Ljubljana, 6320 Portorož, Slovenia
2
Faculty of Arts, University of Ljubljana, 1000 Ljubljana, Slovenia
3
Faculty of Electrical Engineering, University of Ljubljana, 1000 Ljubljana, Slovenia
*
Author to whom correspondence should be addressed.
J. Mar. Sci. Eng. 2020, 8(10), 775; https://doi.org/10.3390/jmse8100775
Submission received: 7 September 2020 / Revised: 30 September 2020 / Accepted: 30 September 2020 / Published: 3 October 2020
(This article belongs to the Special Issue Advances in Navigability and Mooring)

Abstract

:
This paper is intended to give an overview of the experiments to evaluate the cognitive load of the officer on watch (OOW) during a collision avoidance maneuver in a full-mission simulator. The main goal is to investigate the possibilities of recording the biometric parameters of an OOW during a simulated collision avoidance maneuver. Potentially dangerous navigation errors known as human erroneous action (HEA) are induced by excessive cognitive load. Despite modern navigational aids on the ship’s bridge, investigators of maritime incidents typically link the reason for incidents at sea with human factors, including high cognitive load. During the experimental tasks on the bridge, the biometric parameters of the OOW are recorded. Statistical tools are used to visualize the data and evaluate the cognitive load of the OOW. Biometric peaks of the OOW typically occur either during the collision avoidance maneuver or when the OOW has been exposed to disturbing factors that increase reaction time and cause potentially dangerous navigation. Assessing the cognitive load of OOWs in the simulator is challenging for several reasons: e.g., the environmental conditions of the simulator, the type of task to be simulated, and even the type of sensor used. After careful study of the available literature, an original experimental design using non-invasive biometric sensors is proposed.

1. Introduction

In recent years, the trend of the officer on watch’s (OOW’s) cognitive research has risen. As a result of a literature study in the maritime field, the experiments conducted during actual ships’ operation are challenging due to uncontrolled environment parameters, like strong sunlight [1] or unexpected traffic situation [2], which is likely to affect the results. During the research, it has become apparent that the training and cognitive load research are rarely conducted experimentally by exposing participants to marine simulators’ safe environment ([3], Tables 1–3). Despite the aim to contribute maritime safety, the simulator and technical equipment have limitations. Thus the generalization of the OOW’s cognitive load recorded in the simulator, with the cognitive load during actual ships’ maneuvering, is not always an easy task.
Nevertheless, the simulation is the safest way to expose the stakeholders to simulated danger without risking the collision, losing property, and marine pollution. The observed high cognitive load during experiments’ is induced by simulated traffic or weather conditions or additional tasks of the OOW (e.g., n-back test) [4]. According to the analysis of maritime accidents in the merchant navy [5], 75% of the incidents are caused by HEA (human erroneous action), mainly due to the high cognitive load of the OOW. Despite the most modern electronic navigation equipment integrated with a modern ship’s bridge, the OOW remains responsible for positioning and decision making during navigation and berthing [6,7]. In the available studies dealing with the cognitive load research on the ship’s bridge, the OOWs’ cognitive load is typically correlated with working (practical) experience. Studies, where the comparison between experienced officers vs. trainees [8] or students vs. experienced officers [9] reports, experienced participants perform specified tasks better. The findings are consistent with the theory of information processing in working memory [10]. As work has an impact on both human safety and health [11], the recommendation regarding workload is included in the International Maritime Organization (IMO) conventions [12,13], which proposed recommendations for the working environment and working hours to avoid high cognitive load generally, and thus HEA [14].
The goal of this paper is to investigate the impact of the distraction on the observed biometrical parameters. The cognitive load increases when certain situations occur; distractions such as fire alarms, dangerous overtaking of a ship, or modern distractions like checking social media websites, occupy the working memory, which cannot process all available navigational information at once, resulting in a longer response time. In a collision avoidance maneuver, even under normal circumstances, the OOW has but a limited amount of time available, so any increase in reaction time due to high cognitive load will result in a potentially dangerous HEA, resulting in minor failures, misunderstandings, major errors and even direct rule violations [14]. Cognitive load studies using the nautical simulator as a test environment are summarized in Section 2—Materials and Methods. The direct assessment reflects available maritime studies that have observed stress hormone levels or analyzed brain wave intensities to assess workload directly. Indirect approaches typically use eye tracker data, heart rate, or response time values to analyze an OOW’s workload. For method comparison, studies from a road traffic area are also considered [7,15]. A preliminary testing proposal based on the literature study is described in Section 3, where OOW’s biometric parameter measurement was conducted. By measuring pupil diameter, heart rate, blood pulse, electrodermal activity, wrist acceleration, the biometric equipment’s connectivity is tested, together with the visualization of the complex biometric results to assess the influence of the disturbance factor. In Section 4, the conclusion is delineated, highlighting future research directions of the full experimental design for quantifying the cognitive load of OOWs during their navigation tasks.

2. Materials and Methods

2.1. Related Work

In this section, a decision on the most suitable methods of cognitive load measurement will be described as well as the typical experimental design. According to the available literature, two approaches for collecting an OOW’s biometry are typically conducted: direct, and indirect (Table 1).
The advantage of a direct approach is that it yields a more in-depth view of the cognitive process. Brain wave intensity measurements with an electroencephalograph (EEG) observe brain activity and extract cognitive load data in real-time. The challenge with using this method is the difficulty of interpretation of the recorded EEG brain wave signals due to the noise in the raw data. Nevertheless, this method provides insight into the mind process, from which the cognitive load [4] and psycho-physical state (emotions) [16] of the participants can be understood. Noise in the raw data is induced by invasive multi-wire sensors; and procedures in which sampling of the participant’s stress hormone cortisol [8] was found disturbing and stressful, affecting the clarity of the final results. Comparison of the direct approach cognitive load studies involving a nautical simulator is challenging due to different research aims and different sensors used in the experiments (Table 2). Considering this fact and with a careful study of the available literature, a less invasive approach was proposed in our experiment. On the other hand, processing raw data with the machine learning (ML) support vector method [15] and the spectral decompositions method [2,4], was found useful in the post-processing phase, including data mining.
Sensors in the indirect approach are less invasive. Thus, noise in raw data due to wearable sensors is typically lower compared with expected with EEG or with the stress hormone level method. According to the available studies (Table 3), many different body markers support the indirect approach—e.g., reaction time [9], heart rate (HR), electro-dermal activity (EDA), electro-cardio graph (ECG), [17,18,19], pupil diameter, [1,20,21], and acceleration of the body’s extremities. Even when measured indirectly, they can achieve a high degree of accuracy of up to 90%, indicating a level of cognitive load validated in several experiments tailored for key operators of different modes of transport [15]. As shown in Table 3, cognitive research in the maritime field in recent years has different aims, although a common denominator is based on cognitive research. In these studies, typically, eye-tracking glasses are used to reduce the disturbance factor caused by classical-type wired biometrical sensors. Eye-tracking manufacturers also provide high-tech software based on ML classifiers, which helps us gain additional information on cognitive load by data post-processing.
After the presented papers were carefully studied, it was decided to collect biometrical data with pupil diameter, heart rate, EDA, and wrist acceleration.

2.2. The Current Experiment

For the current experiment (Figure 1), five captains volunteered to participate. They were, on average, 48 years old and had 20.5 years of navigation experience. The primary source for data collecting are observables from biometrical sensors. The simulated ship’s bridge log-files and data from interviews (questionnaire) are secondary sources of data. By comparing participants’ experimental and control phases, the preliminary analyses and visualization of the biometrical data are performed (Figure 2). Like a computer processor, more tasks in the OOWs’ working memory (during navigation) cause higher cognitive load and consequently prolong reaction times, which may eventually lead to a potentially dangerous situation [10].
The experiment is carried out in the full mission marine simulator, Wärtsilä’s TechSim5000, where the navigation bridge’s design is comparable to that of the latest merchant ships. Four video projectors provide a 170° forward viewing angle during the voyage simulation, ensuring a high degree of realism. Side and aft views are afforded by LCD monitors on port and starboard bridge wings with a visual angle and zoom option. Environment conditions within the bridge simulator are recorded by a temperature sensor, humidity sensor, noise sensor, an illuminance sensor to measure light conditions and provide the same testing conditions for all the participants. There is only one OOW on the bridge during the simulation, to control the cognitive load-sharing effect, which typically appears in multi-participant’s experiments [16]. Navigational tasks, devised by experienced captains, are designed for the northern Adriatic traffic separation zone [22,23]. The task is divided into two groups, easy and hard; each consists of 15 min of navigation. The easy task aims to collect reference biometrical observables (control phase). Hard navigation (experimental phase) consists of collision avoidance in the traffic separation zone, where several ships’ routes cross when they head to the ports of Koper, Trieste, and Monfalcone. During the hard task, the OOW has experienced the disturbance factor—the fire alarm’s sound—simulating a fire in the engine room. The aim is to determine if and how the alarm’s sound affects the volunteering OOW’s biometrical markers (and cognitive process) during the navigational task. More details on the participants are further explained in Section 3.

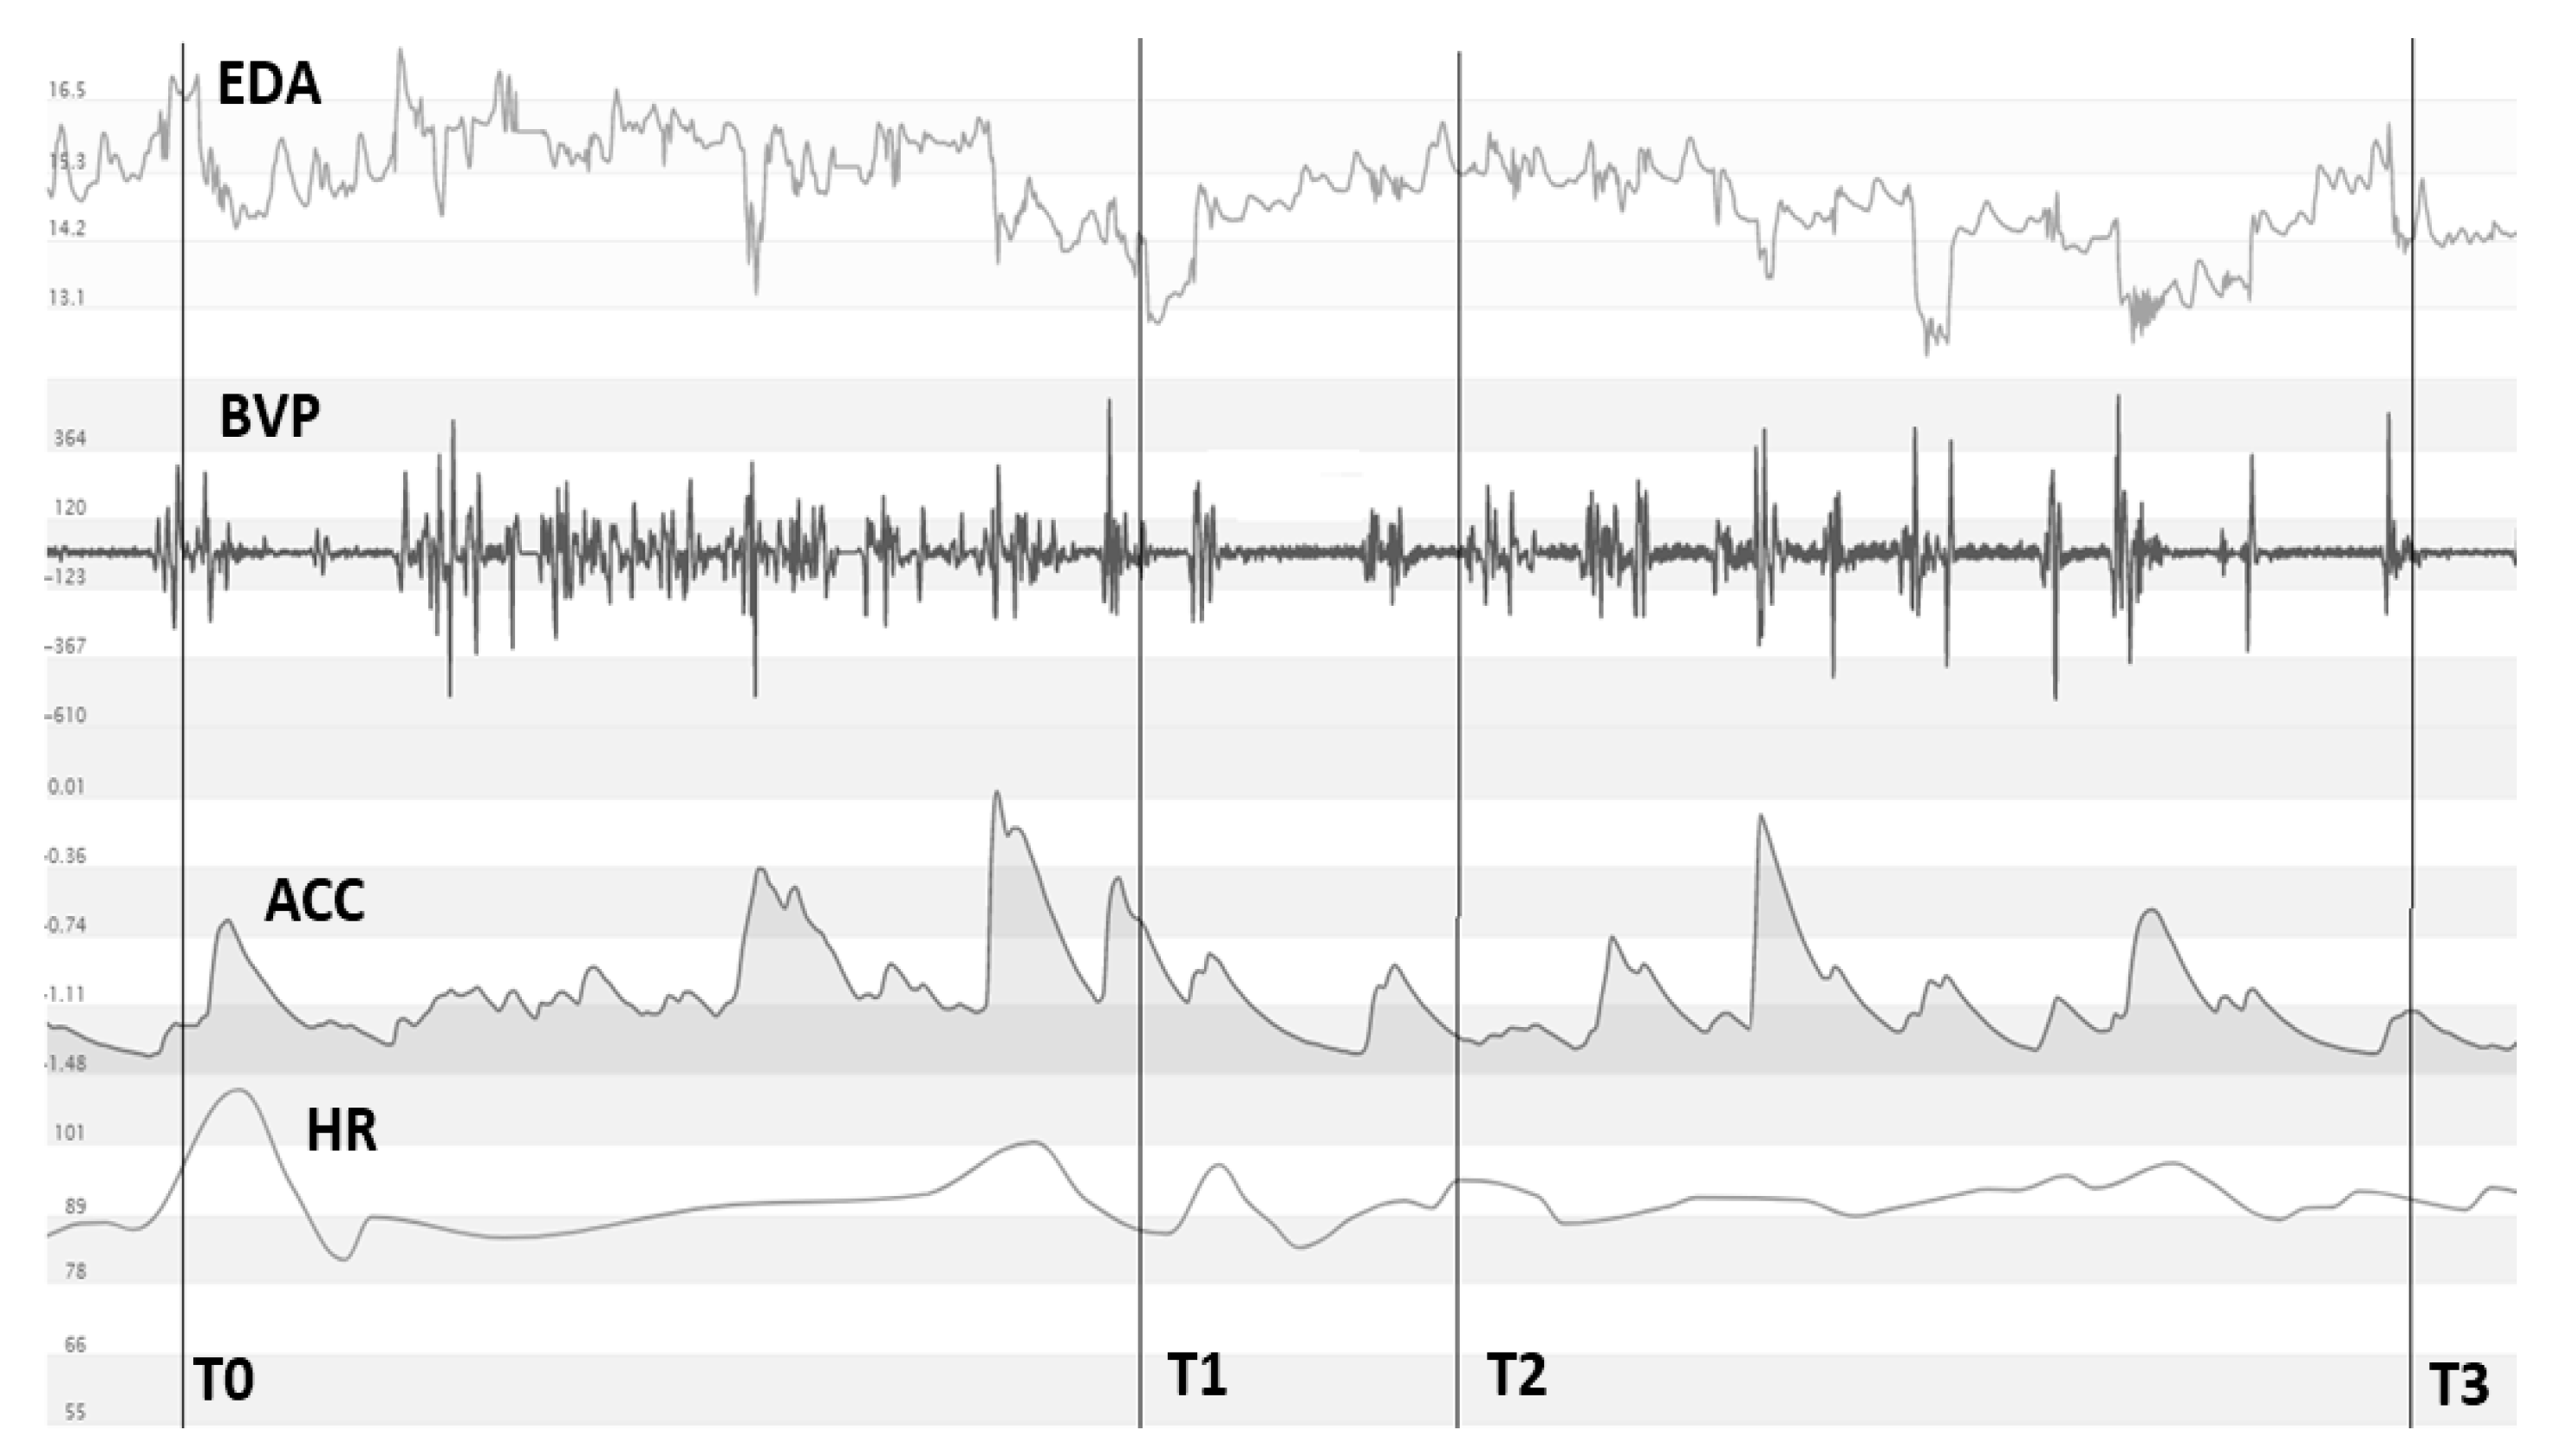
2.3. Raw Data Sampling

For biometrical data recordings, participants wear two sets of sensors: on the head and the wrist. Head-mounted “Pupil-Core” eye-tracking glasses measure average pupil-diameter, and the Empatica E4 wristband measures multiple parameters as presented on Table 4. Ship’s parameters, e.g., ship’s speed, the telegraph position, rudder position, ship’s heading, and engine RPM, are recorded in the simulator’s log file and at the end of the simulation extracted as a CSV-file. As per Table 4, the sampling rate of each sensor is different due to the Nyquist rate, wherein the sampling frequency is twice the maximum frequency of the signal being sampled, which prevents loss of the information.

3. Results

3.1. Experimental Procedure
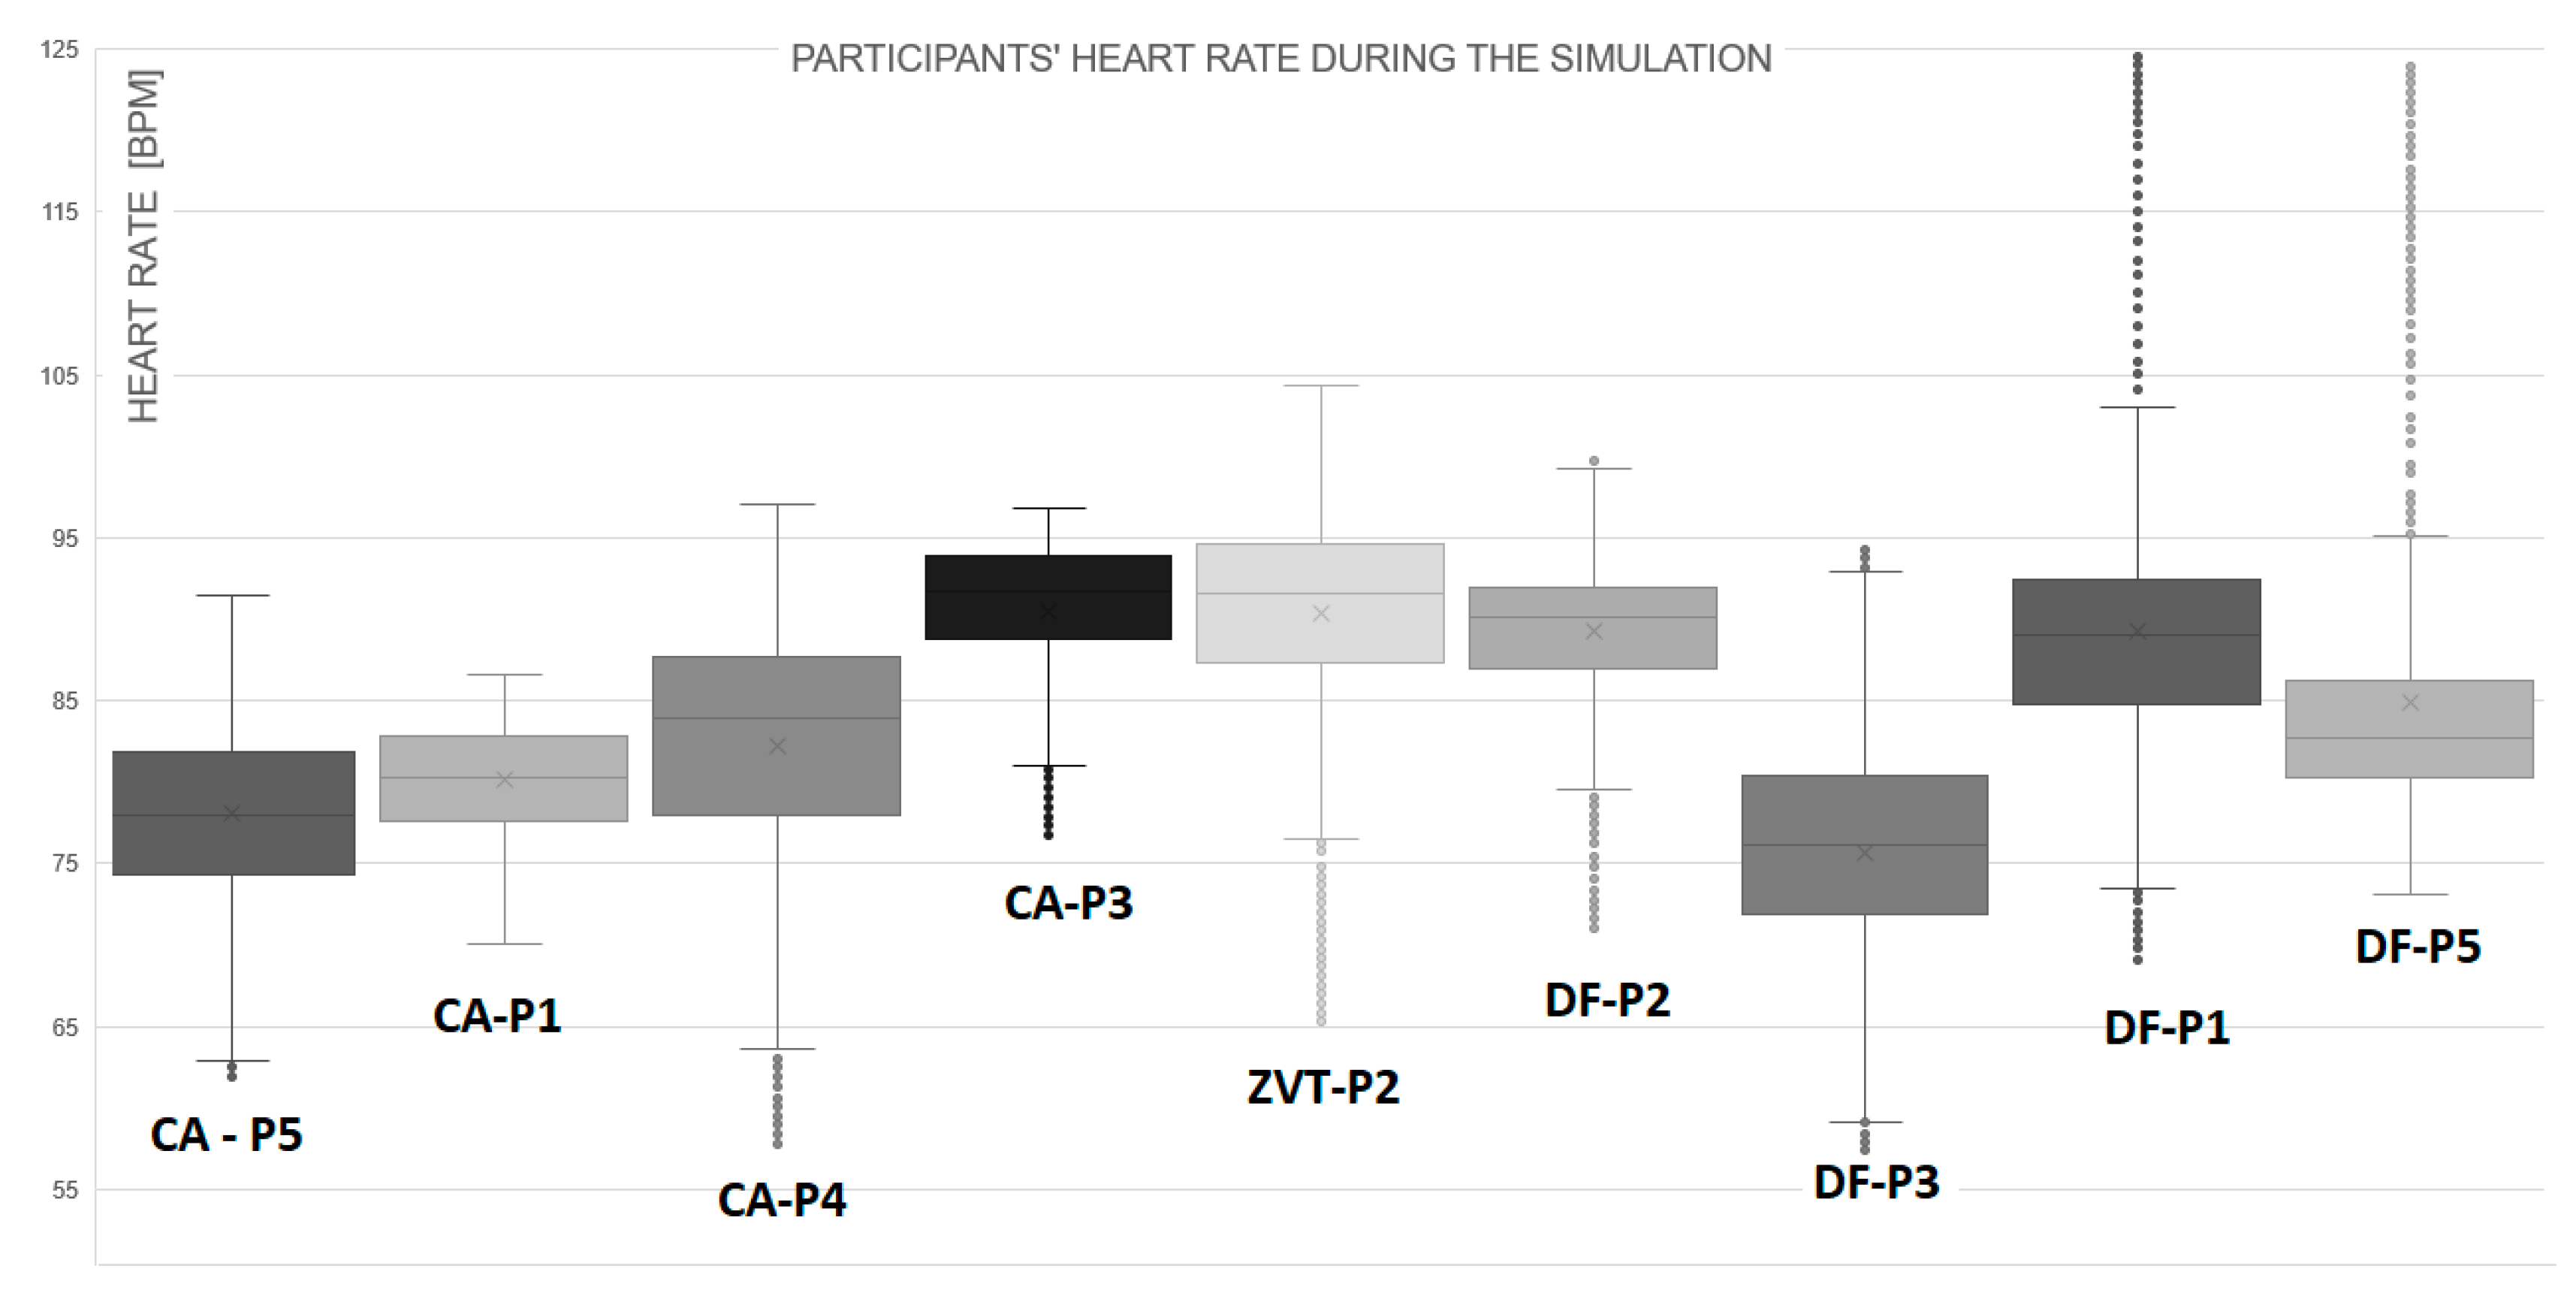
The quantification of the human factor has been the subject of research in all transport sectors for many years (Table 2 and Table 3). This particular study was launched last year when EMSA issued a report which found that 75% of marine accidents are caused by human factors [5]. Human factor deficiencies include lack of competence, inadequate supervision, inattention, and certain states of working memory of the OOW. The working memory in our brain consists of two parts from an engineer’s point of view. The first part performs logical and cognitive operations. The second part is a limited temporary memory in which data from our body sensors is stored before the cognitive part processes it. Thus, cognitive load is a term that describes the mental effort involved in processing information. Mental effort causes typical biometric changes that can be measured [10].
The following study is an attempt to measure the rate of biometrical changes caused by mental effort during a simulated navigational task, the connectivity of the biometrical equipment, the impact of the chosen disturbance factor, and the visualization of the complex biometrical results. The aim is to isolate the weak points of the proposed experimental design before engaging in a full-scale experiment.
Each of the participants was given the same instruction before the experiment. The first simulation is collision avoidance under normal (typical) conditions, and the second simulation is affected by the disturbance factor (sound of fire alarm). In the particular experiment, the large amount of data was not obtained by a large number of participants, but by a wide scale of biometrical markers acquired on the small (N = 5) homogeneous sample of experienced OOW. For the determination of the change in the cognitive process in the working memory, we assume that a statistically significant change in biometric markers (e.g., heart rate and EDA) indicates the state of cognitive load of the OOW [10]. As seen in Figure 2, during the collision avoidance simulation, multiple data are processed in the brain (e.g., target distance, CPA, TCPA, speed, and course, etc.). After the disturbance factor is added, the cognitive process in working memory becomes high. Thus, the OOWs’ reaction becomes significantly different than under the standard (control) conditions. The described negative effect reduces the time for collision avoidance, which is limited even in normal conditions. When the OOW is facing a lack of collision avoidance time, and with the appearance of the disturbance factor, typical measurable biometrical changes occur (Figure 3). Increased average values of the observables in the time when the disturbance factor is involved increase the pressures of the cognitive load. According to the literature study, invasive methods typically cause noise in the results. Consequently, we pay special attention to the selection of the least invasive wireless sensor devices. The environmental conditions (e.g., temperature, humidity, noise level, and light conditions) have a great influence on the biometric readings; therefore, they are controlled during the task. This means that the environmental parameters of the simulator are the same for all participants. The room temperature is set to 23 °C, the humidity to 38%, the noise level is 45 dB with a peak value of 75 dB during the alarm.

3.2. Results

The typical data from the biometrical sensors (Figure 3) shows the moment where disturbance factor occur between T1 and T2. Again, the disturbance factor is the sound of the fire alarm with its red rotating light. Biometrical values in the demanding phase become higher compared with the control phase. We experienced issues if the right-handed participants wear the accelerometer on the left wrist. More accurate readings from the sensor are recorded when the accelerometer was on the working wrist. The average HR rate of participants in the test phase is significantly higher compared to navigation in the control phase. Blood volume pulse (BVP) shows higher values during the disturbance factor interval. The more the blood-vessels expand (vasodilation), the higher is the amplitude of the signal, which implies the brain’s high cognitive process. The heart rate (HR) is denoted by the distance between the peaks (the Inter-Beat Interval (IBI)). However, the analysis of the individual biometric reaction shows that the participants vary in the degrees of reaction recorded by the biometric data. The differences seem to correspond to the level of experience of the individual participants in their profession. From the literature study, we assume that the biometric response is related to the personality of the participant (openness, conscientiousness, extraversion, comfort, and neuroticism), including a potentially post-traumatic stress response that occurred when the participant confronted with a situation remembers the dangerous experience from reality [10].
In the current experiment, we faced an unexpected challenge with pupil diameter measurement. Participants with correction glasses could not wear an eye-tracking sensor at the same time. Thus this part of the experiment was excluded from this research.

3.3. Post Processing and Data Visualization

In the post-processing phase, the log files from sensors are resampled, synchronized, and processed with Excel, E4-Connect firmware, and Python. This phase aims to visualize the complex biometrical results that determine the influence of the disturbance factors on the cognitive load. After the simulation starts, the navigational task begins, and the participant takes control over the ship’s bridge (Figure 4). The moment of processing the available navigation information in the memory of the OOW from simulated bridge instruments causes the jump of biometric signals EDA, HR, and BVP, which indicate a high cognitive load. The acceleration of the wrist is high, which is indicated by the detection of the moving hand on the radar screen and on the electronic chart ECDIS. The biometrics during the disturbance factor (Figure 5) shows higher values during all disturbance factor sequences. An interesting observation is the gap of the BVP pulse shortly after the initiation of the disturbance factor. The gap indicates an expectation due to real-life experience that the alarm is not essential [24] and will be silenced shortly, or that the participant’s working memory dismissing this sound as likely a false alarm [25]. That is not the same as ignoring an alarm but is yet another variable that likely, at times, affects the behavior of people in perilous situations. Responding to impending unexpected disasters, there is also a tendency toward disbelief that affects certain human personality types.
The EDA observation confirms the assumptions from the literature that participants have a measurable response to stress. In our case, collision avoidance and noise of the disturbance factor are reasons for stress and cause changes in skin conductance, so that the EDA varies (Figure 5). The data on the acceleration diagram shows the movement of the participant’s wrist. The higher intensity and amplitude are observed at the moment of actual collision avoidance when the participant’s wrist jumps quickly from one navigational instrument to another to avoid the dangerous obstacle safely.

4. Discussion

In typical cognitive load studies, including those conducted in a nautical simulator (Table 2 and Table 3), the experimental design is based on the OOW’s biometrical markers’ readings. The authors face challenges regarding the experimental design and type of sensors used. The major shortcoming of the studies where the N is relatively small, in our case N = 5, the generalization of the results is not applicable. However, the particular experiment was not intended to include large numbers of participants. Instead, we assessed a small homogeneous sample of OOW with a wide scale of biometrical markers to indicate a broad spectrum of biological and behavioral responses to the task estimate tendencies that are likely to occur during the workload; studies with a larger number of selected markers are awaiting further research. The advantage of this proposed experimental method is applying modern wirelessly monitored sensors to achieve a relatively non-invasive approach, where pupil diameter BVP, EDA, and HR ratio as biometrical indicators for assessing the cognitive load are recorded. Non-invasive methods have the advantage of eliminating the biometric reaction caused by wearing a sensor, influencing the results. Unfortunately, at the beginning of the experiment, we found that most volunteers wore glasses. Participants with correction glasses could not, at the same time, wear an eye-tracking sensor. After we equipped the OOW with an eye-tracking sensor only and without the participant’s correction glasses, the participants could not clearly see the navigation monitors. The conclusion was that even before starting the experiment, the OOW’s biometry showed stress and indicate a high cognitive load. Consequently, the pupil-diameter measurement was excluded from the current experiment.
The current test shows a conspicuous difference in the average values of the biometrical markers between timelines in Figure 4, where disturbance factors occur. Readings of the parameters EDA and HR show higher average values when disturbance factors occur, which is promising for further research. The participants’ self-evaluation reveals that the fire alarm’s sound as a disturbance factor evoked a stress response, which affected the cognitive load during the collision avoidance maneuver and, consequently, the HEA (Figure 2). The assumption is that the mentioned fact is more evident in participants which in his career facing dangerous situations onboard which indicate to post-traumatic response, as explained to the participants during the self-evaluation interview.
Statistically, the distance between the upper and lower quartiles represents the interquartile range (IQR). The box plot visualization (Figure 6) shows a five-digit summary from bottom to top: the minimum line, the 1st (25%) quartile, the sample median, the 3rd (75%) quartile, and the maximum line. The dots below the minimum and above the maximum represent the samples that exceed the 1.5 of the IQR range either below the 1st quartile or above the 3rd quartile.
Observation of the HR rate (Figure 5) reveals a comparable participant’s HR pattern during the collision avoidance (CA) task, with a median 79.05 BPM, which we assume is a typical condition. With disturbance factor simulation (DF), the HR median rises to 84.65 BPM compare to the CA task. What is interesting is the appearance of the outliers. There are two explanations for them. First, we consider whether there is a sensor issue or some similar hardware problem. If the pattern repeats, we consider the second explanation, which is the participants’ characteristics. In the interview, participants confirmed that dangerous situations experienced on board in the past explained HR extremes (outliers) seen on the DF-P1 and DF-P5 (Figure 6). At zero visibility task (ZVT), the safety of navigation depends only on navigation instruments. We assume that the brain’s cognitive process will increase due to the saturation of the working memory. The median, in this case, rises to 92 BPM, which indicates a higher cognitive load due to the lack of visibility.
The aim of the experiment was to determine the appearance of stress and high cognitive load with the biometrical markers. The composite of the biometrical data is a promising approach to the OOWs’ cognitive load quantification, although to develop a mathematical-based model of the machine learning algorithm, which recognizes an OOWs’ high workload, enough biometrical sample data (training data) must be provided. Thus, a full-scale experiment will be conducted.

5. Conclusions

This study attempts to represent a cross-section of the cognitive load measurement during a simulated navigational task with an experimental proposal. The simulated navigational task is approaching the pilot station trough the northern Adriatic traffic separation zone with moderate traffic density. The experiment assumes that the OOW’s biometrical parameters change when the OOW faces a disturbance factor—the sound of a fire alarm—during collision avoidance. The disturbance factor in on real ships takes many forms; e.g., all sorts of navigational alarms and environmental conditions to the latest disturbance factor in the form of distraction from surfing on social media sites. For the present experiment, we chose an alarm indicating a fire in the engine room, which, we assumed, would induce stress and raise the cognitive load of experienced participants. The BVP, HR, and EDA are primary biometrical observables collected from a multi-sensor wristband on the OOW’s wrist. The experiment reveals measurable biometrical responses, and even with a limited number of biometrical sensors indicates the state of stress and high cognitive load. The median of HR during collision avoidance at normal conditions is 79.05 BPM. At disturbance factor simulation, the HR rises for 5.6% to the 84.65 BPM. The highest rate, as expected, is at zero visibility task, where HR raised for 13.67% to 92 BPM. The results are encouraging for future research into cognitive load quantification.
We are aware that the present sample is small and generalization at this phase of the experiment is challenging. Additionally, the results (and temptation for generalization) can be attributed to the homogenous sample, where participants share a similar response due to navigational challenge. The methods were chosen on purpose. We aimed to test a wide range of biometric markers so that studies in the future can further elaborate on those that have previously proved useful. Thus, for a full-scale experiment, we prepare a combined quantitative/qualitative approach supported with a machine learning algorithm that will be developed to recognize the state of cognitive load of the participant during the simulation. The next step would be to transfer measurement into reality.

Author Contributions

Conceptualization, D.Ž., F.D., and M.S.; methodology, D.Ž.; software, D.Ž.; formal analysis, D.Ž. and M.S.; equipment resources, A.K.; writing—original draft preparation, D.Ž.; validation, M.S., A.K., and F.D. All authors have read and agreed to the published version of the manuscript.

Funding

The authors acknowledge the financial support of the Slovenian Research Agency (research core funding No. P2-0394, Modeling and Simulations in Traffic and Maritime Engineering).

Acknowledgments

The authors acknowledge vascular surgeon Črtomir Seušek MD, and researcher Blaž Luin PhD.

Conflicts of Interest

The authors declare no conflict of interest. The funders had no role in the design of the study; in the collection, analyses, or interpretation of data.

References

  1. Hareide, O.S.; Ostnes, R. Maritime Usability Study by Analysing Eye Tracking Data. J. Navig. 2016, 70, 927–943. [Google Scholar] [CrossRef] [Green Version]
  2. Miklody, D.; Moessmer, P.; Dettmann, T.; Klinkenberg, K.; Blankertz, B. Multi-timescale spectra as features for continuous workload estimation in realistic settings. In Proceedings of the 7th Graz Brain-Computer Interface Conference, Graz, Steiermark, Austria, 18–22 September 2017. [Google Scholar] [CrossRef]
  3. Bertram, V.; Plowman, T. A Hitchhiker’s Guide to the Galaxy of Maritime e-Learning. In Proceedings of the 2019 18th COMPIT Conference Proceedings, Rostov-on-Don, Russia, 20–21 September 2019; pp. 7–23, ISBN 978-3-89220-709-2. [Google Scholar]
  4. Miklody, D.; Uitterhoeve, W.; Van Heel, D.; Klinkenberg, K.; Blankertz, B. Maritime Cognitive Workload Assessment; Symbiotic Interaction; Springer International Publishing: Berlin/Heidelberg, Germany, 2017; pp. 102–114. [Google Scholar]
  5. EMSA Annual Overview of Marine Casualties and Incidents 2019. Available online: http://www.emsa.europa.eu/news-a-press-centre/external-news/item/3734-annual-overview-of-marine-casualties-and-incidents-2019.html (accessed on 22 December 2019).
  6. Perkovič, M.; Gucma, L.; Bilewski, M.; Muczynski, B.; Luin, B.; Vidmar, P.; Lorenčič, V.; Batista, M. Laser-Based Aid Systems for Berthing and Docking. J. Mar. Sci. Eng. 2020, 8, 346. [Google Scholar] [CrossRef]
  7. Sumpor, D. Relevant Factors of Driver Reaction Time for Cognitive Motoric Tasks; Fakultet Prometnih Znanosti: Zagreb, Croatia, 2019. [Google Scholar]
  8. Main, L.C.; Wolkow, A.; Chambers, T.P. Quantifying the Physiological Stress Response to Simulated Maritime Pilotage Tasks: The Influence of Task Complexity and Pilot Experience. J. Occup. Environ. Med. 2017, 59, 1078. [Google Scholar] [CrossRef] [PubMed] [Green Version]
  9. Kim, H.; Kim, H.J. Collision Scenario-based Cognitive Performance Assessment for Marine Officers, 2010. Trans. Navig. Int. J. 2010, 4, 73–77. [Google Scholar]
  10. Haberlandt, K. Cognitive Psychology; Allyn & Bacon: Boston, MA, USA, 1997; ISBN -13 9780205139392. [Google Scholar]
  11. Merchant Shipping. Safe Manning, Hours of Work and Watchkeeping. In SOLAS Regulations; SOLAS: Haven, CT, USA, 1997. [Google Scholar]
  12. Maritime Labour Convention. Consolidated Text Established by the International Labour Office, Including the Amendments of 2014 and 2016 to the Code of the Convention; Maritime Labour Convention: Geneva, Switzerland, 2006. [Google Scholar]
  13. Work Hours and Rest Hours on Ships (Including STCW 2010 and Merchant Shipping (Safe Manning, Hours of Work and Watchkeeping); Regulations: 1997); SOLAS: Haven, CT, USA, 1997.
  14. Barnett, M.L. Searching for the Root Causes of the Maritime Casualties (2005). WMU J. Marit. Aff. 2005, 4, 131–145. [Google Scholar] [CrossRef]
  15. Fridman, L.; Reimer, B.; Mehler, B.; Freeman, W.T. Cognitive Load Estimation in the Wild (2018). In Proceedings of the 2018 CHI Conference on Human Factors in Computing Systems, Montreal, CQ, Canada, 21–26 April 2018; p. 652. [Google Scholar]
  16. Liu, Y.; Lim, W.L.; Subramaniam, S.C.H.; Liew, S.H.P.; Krishnan GSourina, O.; Konovessis, D.; Ang, H.E.; Wang, L. EEG-based Mental Workload and Stress Recognition of Crew Members in Maritime Virtual Simulator: A Case Study. In Proceedings of the International Conference on Cyberworlds (CW), Chester, UK, 20–22 September 2017. [Google Scholar]
  17. Saus, E.R.; Johnsen, B.H.; Eid, J.; Thayer, J.F. Who benefits from simulator training in relation to situation awareness during navigation training: Personality and heart rate variability. Comput. Hum. Behav. 2012, 28, 1262–1268. [Google Scholar] [CrossRef]
  18. Orlandi, L.; Brooks, B. Measuring mental workload and physiological reactions in marine pilots: Building bridges towards redlines of performance. Appl. Ergon. 2018, 69, 74–92. [Google Scholar] [CrossRef] [PubMed]
  19. Kim, H.; Yang, C.S.; Lee, B.W.; Young, Y.H.; Hong, S.K. Alcohol effects on navigational ability using ship handling simulator. Int. J. Ind. Ergon. 2007, 37, 733–743. [Google Scholar] [CrossRef]
  20. Di Nocera, F.; Mastrangelo, S.; Baldauf, M.; Steinhage, A.; Kataria, A.; Proietta, S. Mental workload assessment using eye-tracking glasses in a simulated maritime scenario. In Proceedings of the HFESE, Groningen, The Netherlands, 14–16 October 2015; pp. 235–248. [Google Scholar]
  21. Arenius, M.; Athanassiou, G.; Sträter, O. Systemic assessment of the effect of mental stress and strain on performance in a maritime ship-handling simulator. IFAC 2010, 43, 43–46. [Google Scholar] [CrossRef]
  22. Vidmar, P.; Perkovič, M. Safety assessment of crude oil tankers. Saf. Sci. 2018, 105, 78–191. [Google Scholar] [CrossRef]
  23. Vidmar, P.; Perkovič, M. Methodological approach for safety assessment of cruise ship in port. Saf. Sci. 2015, 80, 189–200. [Google Scholar] [CrossRef]
  24. Maglić, L.; Zec, D. The Impact of Bridge Alerts on Navigating Officers. J. Navig. 2020, 73, 421–432. [Google Scholar] [CrossRef]
  25. Maglić, L.; Valcic, S.; Gundić, A.; Maglic, L. Voice Communication Systems Impact on Navigating officers. MDPI, Journal of Marine Science and Engineering. J. Mar. Sci. Eng. 2020, 8, 197. [Google Scholar] [CrossRef] [Green Version]
Figure 1. Full mission simulator: Experienced participant during collision avoidance in the traffic separation zone wearing pupil-diameter sensor and wrist multi-sensor.
Jmse 08 00775 g001
Figure 2. Information saturation with disturbance factor cause typical change of biomarkers.
Jmse 08 00775 g002
Figure 3. Biometric parameters during the typical simulation: EDA—Electro-Dermal activity, BVP—Blood-Volume pulse, HR—Heart-Rate. T0—Beginning of the collision avoidance scenario, T1—The moment when the disturbance factor occurs, T2—Disturbance factor stops, T3—Secondar0079 collision avoidance (easy task), T4—Simulation ends.
Jmse 08 00775 g003
Figure 4. Biometric parameters when simulation starts. EDA—Electro-Dermal activity, BVP—Blood-Volume pulse, ACCELER—wrist acceleration, HR—Heart-Rate, TEMP—body temperature. In approximately 500 ms after the stimulants (start of the simulation), the biometrical parameters show significant response.
Jmse 08 00775 g004
Figure 5. Biometric parameters during disturbance factor. EDA—Electro-Dermal activity, BVP—Blood-Volume pulse, ACC—wrist acceleration, HR—Heart-Rate. T0—beginning of the primary disturbance factor, T1—end of the primary disturbance factor, T2 beginning of the secondary disturbance factor, T3—end of the secondary disturbance factor.
Jmse 08 00775 g005
Figure 6. HR parameters during 20 min simulated navigational task. CA—collision avoidance task, ZVT—zero visibility task, DF—Disturbing factor task, P—participant.
Jmse 08 00775 g006
Table 1. Biometrical data collecting.
Direct ApproachIndirect Approach
Brain waves intensity (EEG)Heart rate
Stress hormone rate (Cortisol)Electro-Dermal Activity
-Pupil diameter
Electrocardiogram (ECG)
-Body acceleration
Table 2. Direct workload assessment.
PAPERMain 2018Liu 2017Miklody 2017
EnvironmentSimulatorSimulatorSimulator
TaskManeuveringOvertakingManeuvering
AimStressEmotionsWorkload
SensorCortisolEEGEEG
QuestionnaireNasa TLXProfileProfile
Statistical toolANOVA--
Processing raw data-Support vector MLSpectral decompositions ML
Reason for cognitive load WeatherTrafficWeather, n-back test
Table 3. Indirect approach of cognitive load assessment.
PAPERKim 2005DiNocera 2015Hareide 2019Fredman 2018
EnvironmentSimulatorSimulatorNavy ShipOn-Road
TaskAwarenessNavigationHigh speedCar driving
AimDecision-timeWorkloadVisual attentionWorkload
SensorTimerEye-trackerEye-trackerCamera
QuestionnaireProfileNasa-TLXProfileProfile
Statistical toolt-testANOVAAverageClassifier
Processing raw dataCustom SWToby-StudioTobyPro2ConvNet
Reason for cognitive loadTrafficTrafficHigh speedn-back test
PAPERSaus 2012Orlandi 2018Kim 2007Arenius 2010
EnvironmentSimulatorSimulatorSimulatorSimulator
TaskNavigationBerthingNavigationNavigation
AimAwarenessWorkloadPerformanceHuman error
SensorECGEEG, ECGECGEye-tracker
QuestionnairePersonality testNASA TLXNASA-TLXInterview
Statistical toolRegressionANOVA--
Processing raw datarMSSD *, Interplt. *MatLabt-test-
Reason for Cog. loadTrafficFamiliarityAlcohol Emotions
* root mean of the squared successive differences, interpolation.
Table 4. Sensor’s sampling rate.
Type of ParameterManufacturerSampling Rate
PUPIL DIAMETER (mm)PUPIL CORE200 Hz
EDA (μS)EMPATICA4 Hz
BVPEMPATICA64 Hz
SHIPS’ PARAMETERSWäRTSILä10 Hz
HEART RATE (BPM)EMPATICA1 Hz
ACCELERATION (m/s2)EMPATICA32 Hz
TEMPERATURE (°C)EMPATICA4 Hz

