Article

Nearshore Topographical Changes and Coastal Stability in Nam Dinh Province, Vietnam

1
Key Laboratory of River and Coastal Engineering, Vietnam Academy for Water Resources, Hanoi 100000, Vietnam
2
Department of Geotechnics and Infrastructural Development, University of Science, Vietnam National University, Hanoi 100000, Vietnam
3
Institute of Geotechnology and Environment, Hanoi 100000, Vietnam
*
Author to whom correspondence should be addressed.
J. Mar. Sci. Eng. 2020, 8(10), 755; https://doi.org/10.3390/jmse8100755
Submission received: 12 July 2020 / Revised: 21 September 2020 / Accepted: 22 September 2020 / Published: 27 September 2020
(This article belongs to the Special Issue Coastal Flood Risk Reduction)

Abstract

:
Recently, the coastal zone in Vietnam has experienced more intensive sea attacks due to severe typhoons, climate change, and humsection an activities. Sea level rise has been recorded all along the coast. Moreover, sand exploitation and engineering measures have significantly changed local reliefs and led to apparent sea water level change on the coast of Nam Dinh province. Coastal erosion and sea dike failures have become a serious problem in the region. The site investigation of nearshore topography shows the recent changes to the coast. Hydrodynamic models show that changes of relief and increased wave attacks on dikes. The main reason for sea dike instability is soil erosion due to wave topping; meanwhile, the dikes are stable in terms of sliding. The coast should be reinforced with properly constructed revetments, wave topping preventive measures, and nearshore sand exploitation should be halted.

1. Introduction

The Intergovernmental Panel on Climate Change (IPCC 2007) reported that during the 21st century, the sea level will rise another 18 to 59 cm due to global warming. The most recent report of IPCC [1] has shown that global mean sea level will rise between 0.43 m (0.29–0.59 m, likely range; RCP2.6) and 0.84 m (0.61–1.10 m, likely range; RCP8.5) by 2100 (medium confidence) relative to 1986–2005. Sea level rise (SLR) poses one of the greatest threats to the stability of coastal structure and human settlements along coastlines [2,3,4,5,6,7,8,9].
Climate change and its impact on the coastal zone of Vietnam are very serious issues. Results of recent investigations suggest that climate change tends to accelerate geohazards. Therefore, adaptation to climate change has rapidly become an urgent issue. The sea level in the north coast is rising about 2 mm/year [10,11]. The number and intensity of tropical cyclones have complicated this change with a tendency of having been much more severe in recent years (2004–2014). Climate change-related geohazards on the coast include erosion, inundation and flooding, saline intrusion, and sea dike instability. Sea level rise, land subsidence, and tropical cyclones are strengthening the coastal erosion [12]. Each year the exceeding rate of erosion due to sea level rise is 0.1–0.3 m/y. A typhoon landing at high spring tide can cause a disaster of inundation, flooding, and saline intrusion on the coast. The inundation and coastal flooding can lead to the immigration of hundreds of thousands of people. Sea level rise causes larger wave pressure on the sea dikes, making them more unstable in typhoons and storm surges. As a result, a possible compound geohazard can be also caused by climate change. In the near future, coastal dike failures may be expected to occur almost annually due to budget constraints, a lack of information on sea boundary conditions, such as water levels and wave heights, and a lack of suitable design methods [2,13]. Therefore, countermeasures must be developed to mitigate the influences of extreme weather events and persistent SLR for coastal protection. Among the alternatives available for countering these threats, applying soil stabilization and soil improvement with geosynthetics are promising strategies for coastal structures that must sustain severe wave action and storm surges [14,15,16,17].
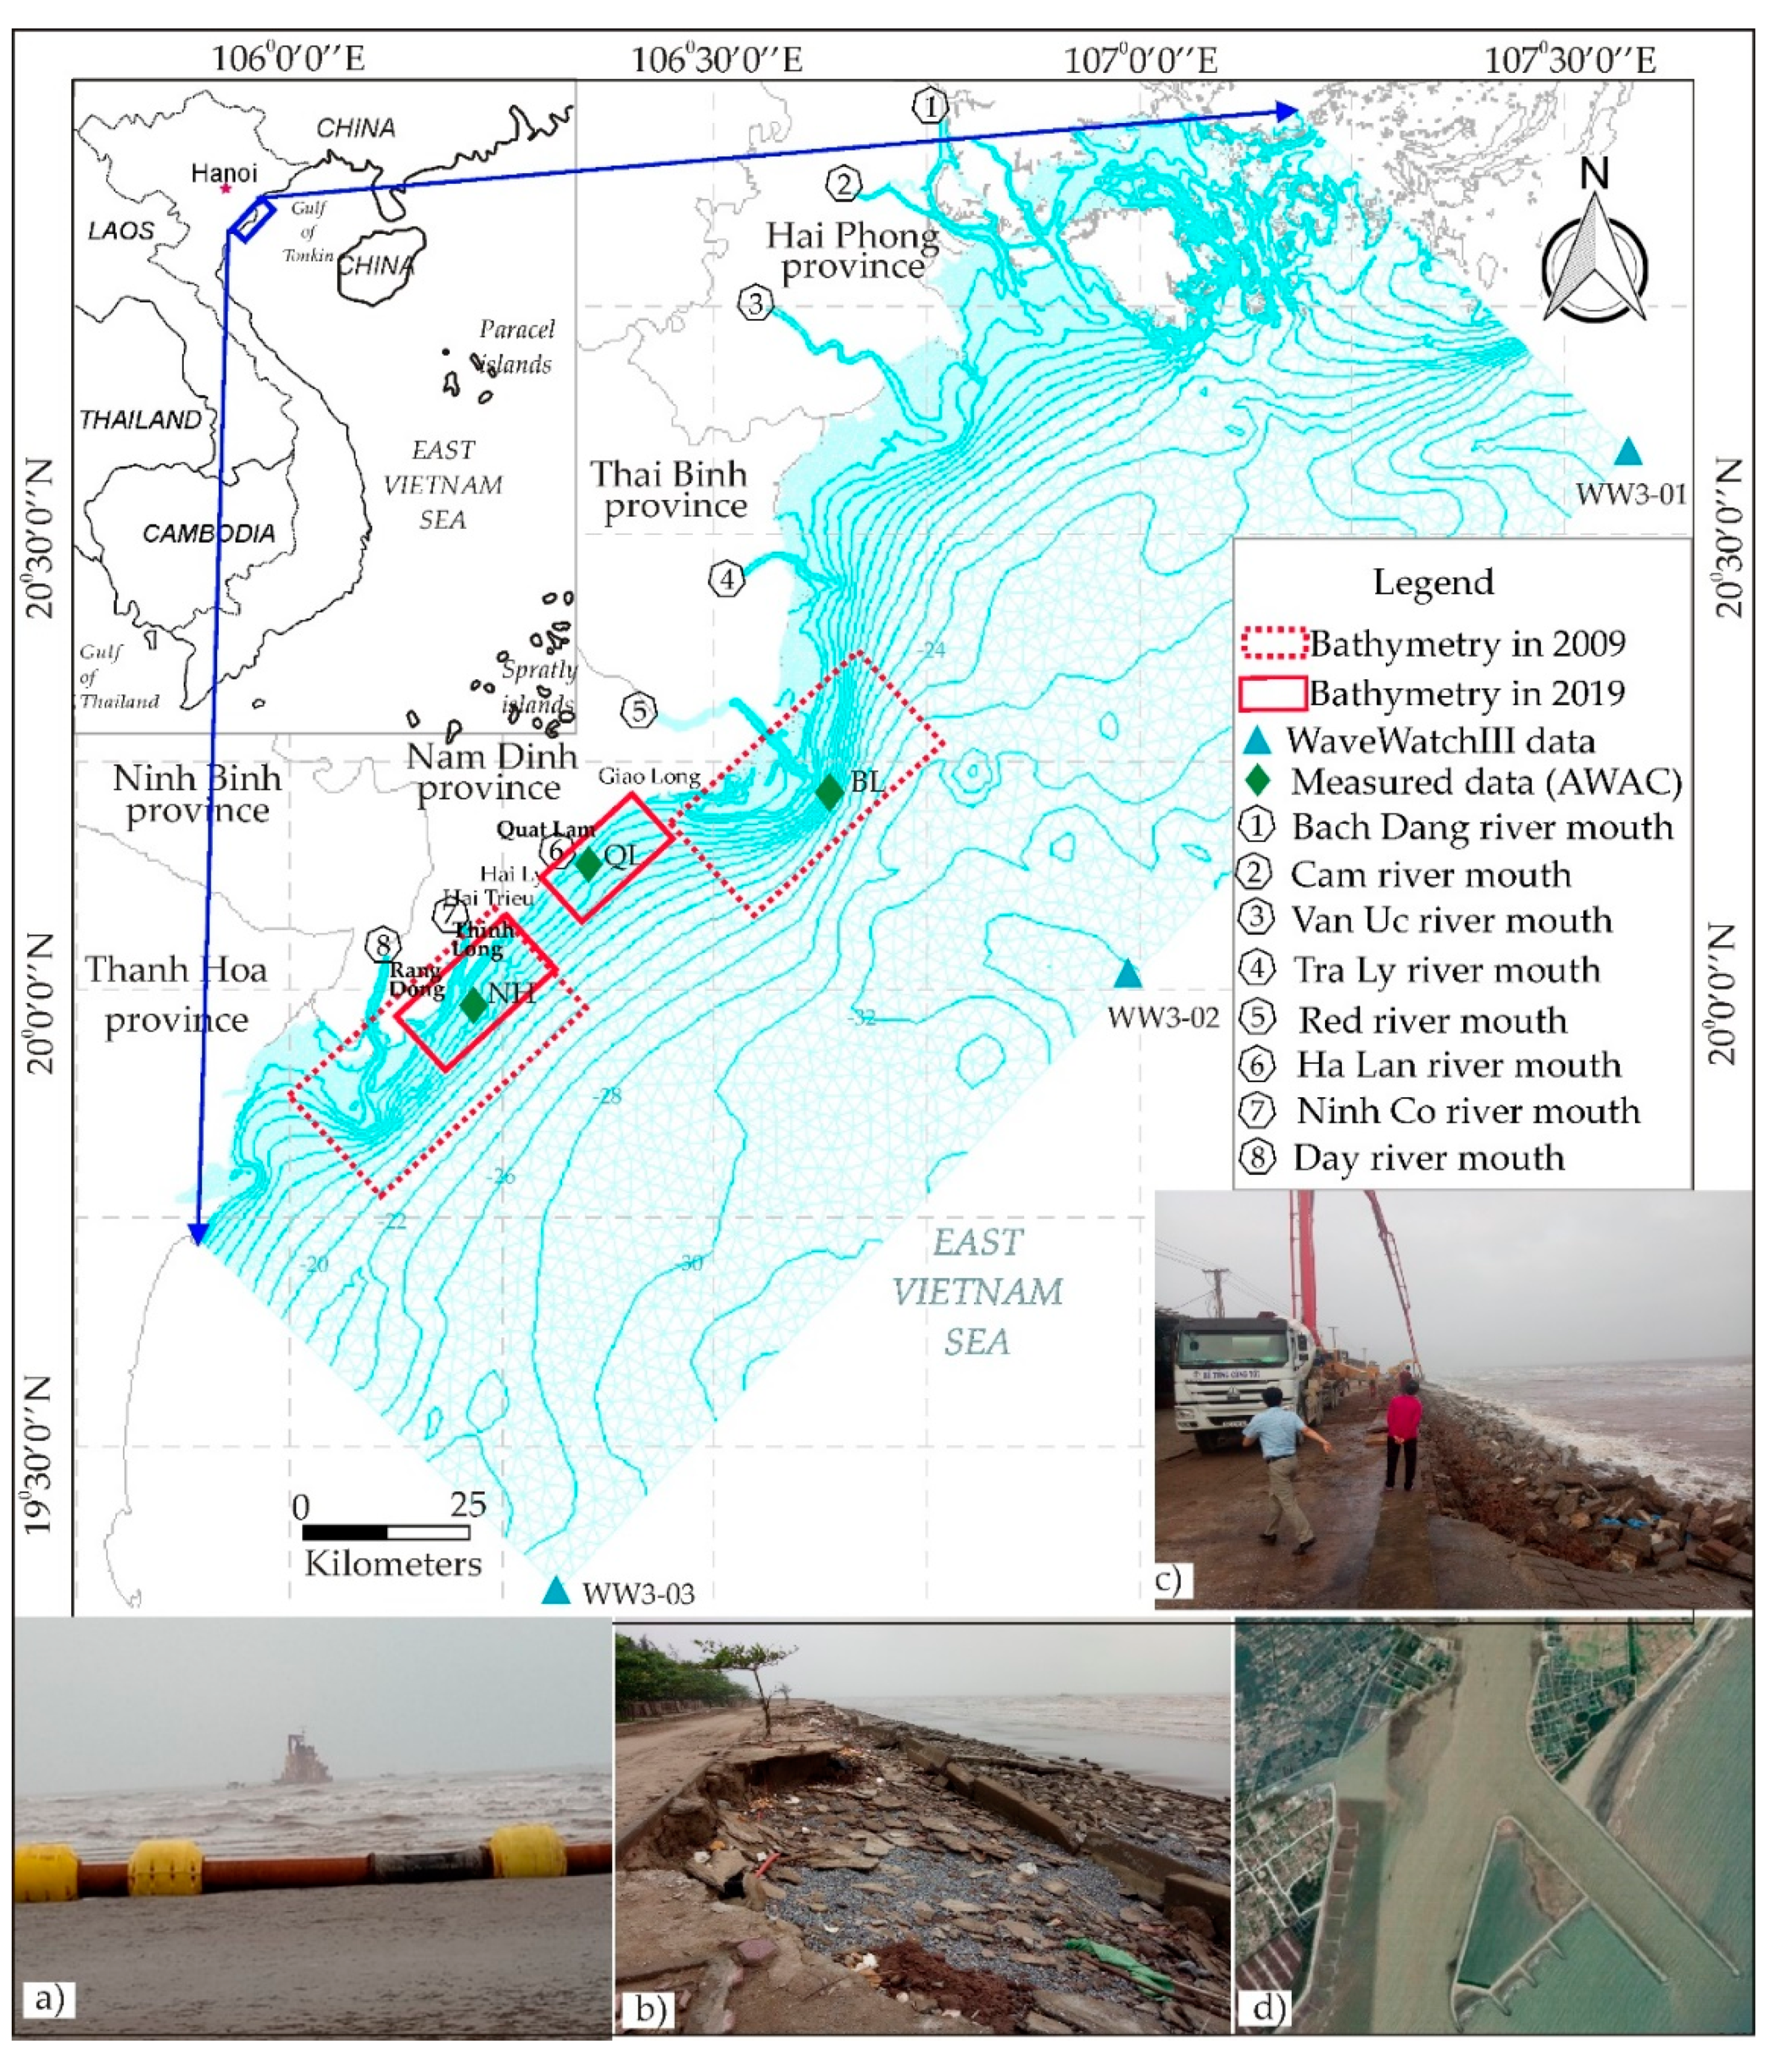
The Nam Dinh coast is a part of the Red River Delta, northern Vietnam (Figure 1). The coast has experienced significant nearshore topographical changes, including both severe sediment erosion and accretion [11]. Erosion of this coast has been well documented, for example, by Pruszak et al. (2002), Le et al. (2007), and Duc et al. (2012, 2017) [11,17,18,19,20]. The coastal erosion in Hai Hau was considered to have started from the beginning of the 20th century (1905) [18,21]. During the period 1930–1965, the maximum lateral retreat rate was 22 m/y in the Hai Ly and Hai Chinh communes. The Hai Ly coast was significantly eroded from 1965 to 1985. The average rate during that period was 21 m/y. In the same period, the rates were 5 m/y on the Hai Dong coast and 11 m/y on the Hai Chinh–Hai Thinh coast. The south part of Thinh Long town was accreted. Currently, the shoreline in Hai Dong has been accreted. However, the erosion continues to increase in other segments. The most severe erosion segment is now shifting to the southwest. The erosion is very significant on the coast of Thinh Long town. The shoreline was retreating up to 40–50 m/y from 2003 to 2005 [11]. Beach relief in the south part of Thinh Long town was lowered by approximately 1.7 m in the period from July 2010 to September 2011.
The erosion in Hai Hau has a close relation to the degradation of the Ha Lan river mouth (the former main river mouth of the Red River system at that time) [17,18,21]. The evidence of Ha Lan mouth degradation can be found at Giao Long and Giao Phong shorelines, which were continuously accreted with rapid rates (reaching up to 100 m/year in some segments during the period 1905–1930). The main river mouth was then shifted to the Red river mouth and the shoreline in Hai Hau was eroded. Alongshore sediment transport resulted in southward transport in winter and northward transport summer [22,23]. In total, sediment at the coast is dominantly transported south-westward by the northeast and east waves with the volume of about 0.6–0.8 mil. m3/year [11]. The longshore sediments are deposited in the southward river mouth (Ninh Co river mouth or Lach mouth), causing serious changes of navigation channel. Annually, a large amount of dredging was deployed to maintain the channel. Moreover, lowering of the seabed in front of the dikes in Hai Hau coast resulted in a reduction of sediment transport capacities for all locations, causing serious problem to the sea dike stability [17,18,22].
Recently, the coastal zone in Nam Dinh province has experienced more intensive sea attacks due to severe typhoons, climate change, and human activities (sand exploitation and engineering measures). This paper defines characteristics and reasons of nearshore topographical changes in Nam Dinh province and its impacts on coastal stability.

2. Materials and Methods

2.1. Topographical Cross Section

Measurement of cross-sections perpendicular to the shoreline were carried out by Vietnam Academy for Water Resources (VAWR) for the research area. In December 2019, 44 cross-sections were measured, where Quat Lam area has 11, Thinh Long has 18, and Rang Dong has 7 cross-sections. The sections were measured. The distances between each section are from 200 m to 500 m and length of each section is from 250 m to 750 m, approximately perpendicular to the coast. Locations of the cross-sections are shown in Figure 1. In addition, in the areas of Thinh Long and Rang Dong, a number of measured cross-sections in December 2019 coincided with the measured locations in May 2016. Comparing the cross-sections in these two areas were used to assess the level of topographic change in the section. All of the topographical cross section data were consistent on the same National Chart Datum (NCD). In the survey, Real-Time Kinematic (RTK) and Odom echo sounder equipment were used, in which RTK for measuring elevation points in land and Odom for measuring elevation points in water.

2.2. Bathymetry

Bathymetry data is obtained from 1:5,000 map of Ba Lat (Red river mouth), Day, and Ninh Co estuaries surveyed in 2009 by (VAWR), and from 1:5,000 map of Ninh Co estuaries surveyed in 2011 by Port and Waterway Engineering Consultant Joint Stock Company (TEDIPORT) (Figure 1). To examine the beach at Ninh Co river mouth, lowered by sand mining and other activities such as the construction of waterway channel access and waterway dredging, the additional bathymetry measurement was done in November 2019 by VAWR for Ninh Co estuary with a purpose to produce data for modeling. To study the coast of Nam Dinh, the bathymetry data from map 1:50,000 for seabed and topography map of 1:10,000 for land, which were published by Ministry of Natural Resources and Environment (MONRE) in 2013, were collected. The nearshore bathymetry used for investigating the changes of hydrodynamic characters at coastal area of Nam Dinh was obtained from combining all the above map data.

2.3. Marine and Sediment Data

Multiple field observations were made in November 2018 and November 2019 to get the hydrodynamic data such as current, wave, and water levels. All locations of the stations with observation times are illustrated in the Figure 1 and Table 1. The first observation, in November 2018, an AWAC—60 Hz (Acoustic Wave and Current Profiler) instrument manufactured by Nortek was used to measure water level, current, and wave at the station in front of the Red river mouth (BL station, showing in the Figure 2). The second observation, in November 2019, AWAC instruments were used at the NH station, and both the FlowQuest and WaveDroid instruments were used at the QL station. All stations were located in nearshore in the depths of 6 and 7 m with time interval of 30 min. Wave parameters including significant wave height, peak wave period, and direction were recorded.

2.4. Hydrodynamics and Sediment Transport Modeling

2.4.1. Setting up Models

Numerical modeling has been successfully used to solve coastal problems [22,24,25,26]. In this study, Mike 21 was used [27,28,29]. Mike21 FM model developed by DHI Water and Environment was used, including hydrodynamic (HD), spectral wave (SW) module and sediment transport (ST) module. Mike21 SW is a third-generation spectral wave model that simulates the growth, decay, and transformation of wind-generated waves and swells in coastal and offshore regions.
Two datasets of bathymetry data were collected in July 2009 and December 2019 by Vietnam Academy for Water Resources, maps of Vietnam east sea scale 1:50,000 and topography map of 1:10,000 for land published by MONRE in 2013. The data were analyzed and recorded with based-referred to the national standard datum and UTM (Universal Transverse Mecator) coordinate system.
The model domain was set up to cover around 200 km in length coast of the Red river delta which included 07 main river mouths of the Red river system (Bach Dang, Cam, Van Uc, Tra Ly, Hong, Ninh Co, and Day river mouths), extended from 5 km upstream and through the river mouths and about 60 km into the Gulf of Tonkin. The model gird is unstructured mesh with 35, 160 elements, size of elements varying from higher resolution in the river mouth and coastal line of 15 m to 30 m and to lower resolution of 500 m to 1,000 m offshore in order to increase the model accuracy and reduce computation time consuming (see Figure 1 for mesh definition and bathymetry with the locations of the boundary conditions).

2.4.2. River Boundary

The upstream boundaries extended toward the river estuaries at hydrological stations. Discharge from the Red river branches plays an important role on the hydrodynamics in the estuaries [18], where its effects combine with contributions from other forces, and affect the sediment transport. As mentioned above, there are seven rivers that flow into the Gulf of Tonkin over the physical domain. Although the study focuses only on the hydrodynamic and sediment transport for the area from the Red river mouth to the Day river mouth (in the direction from North to South), all estuaries have discharge flow. Only water level data is measured at the hydrological stations, so calculated discharge data were extracted from Mike11—a 1D hydrodynamic model setup for Red river system to provide river discharge boundaries.

2.4.3. Open Boundary

The offshore limit is defined by the position of the WAVEWATCH III (WW3) data used as offshore forcing boundary conditions for the model including both of water level and wave boundaries [30]. The open boundary water level used the tides available by TOPEX global model (http://volkov.oce.orst.edu/tides/TPXO7.2). TPXO7.2 is one of the most recent versions of global tide with high resolution of 0.25 degree which provide tidal water level for eight constituents (M2, S2, N2, K2, K1, O1, P1, and Q1) [31]. The hourly water levels interpolated to several points along the offshore open boundary. The hourly wave variables were retrieved from the WW3 global model (https://polar.ncep.noaa.gov/waves) including significant wave height, wave direction, and peak wave period. An interpolation of the wave conditions was done between the three WW3 data points defining the boundary conditions shown in Figure 1.
Reanalysis wind data including, U-velocity, V-velocity components, and pressure parameters obtained from NOAA (https://polar.ncep.noaa.gov), were used in this study. Varying in time and domain wind data were used to drive the hydrodynamic model.

2.4.4. Calibration and Verification of the Models

The model was calibrated with the data set observed in November 2018 and another data set observed in November 2019 was used for verification. Model performance was evaluated using error statistics such as root mean squared error (RMSE), it is a frequently used to measure of the size of the discrepancies between the values predicted by a model and the observed data. The formula to calculated model performance is presented as follows:
RMSE = i = 1 i = N ( O i M i ) 2 N
in which Oi and Mi are observed and modeled values, respectively. N is the number of values. All RMSE values for calibration and verification of the model are presented in Table 2.
Comparisons between observed and simulated water levels, wave parameters, and currents at the stations for the two period of simulation time are shown in Figure 2. The comparisons show good agreement between observed and simulated at the stations. As can be seen water levels and wave information is quite good. The values of RMSE for water levels, wave heights, and currents are in the range of 0.08 to 0.21 m. The RMSE values for direction of wave and current are not good as the others with the values of RMSE are high at 13.63 to 19.39 and 62.35 to 127.64, respectively. However, it is acceptable because these parameters are usually more difficult to calibrate. Overall, it is concluded that the numerical model was able to describe the currents, wave, and water levels reasonably well.

3. Results

3.1. Nearshore Topographical Change

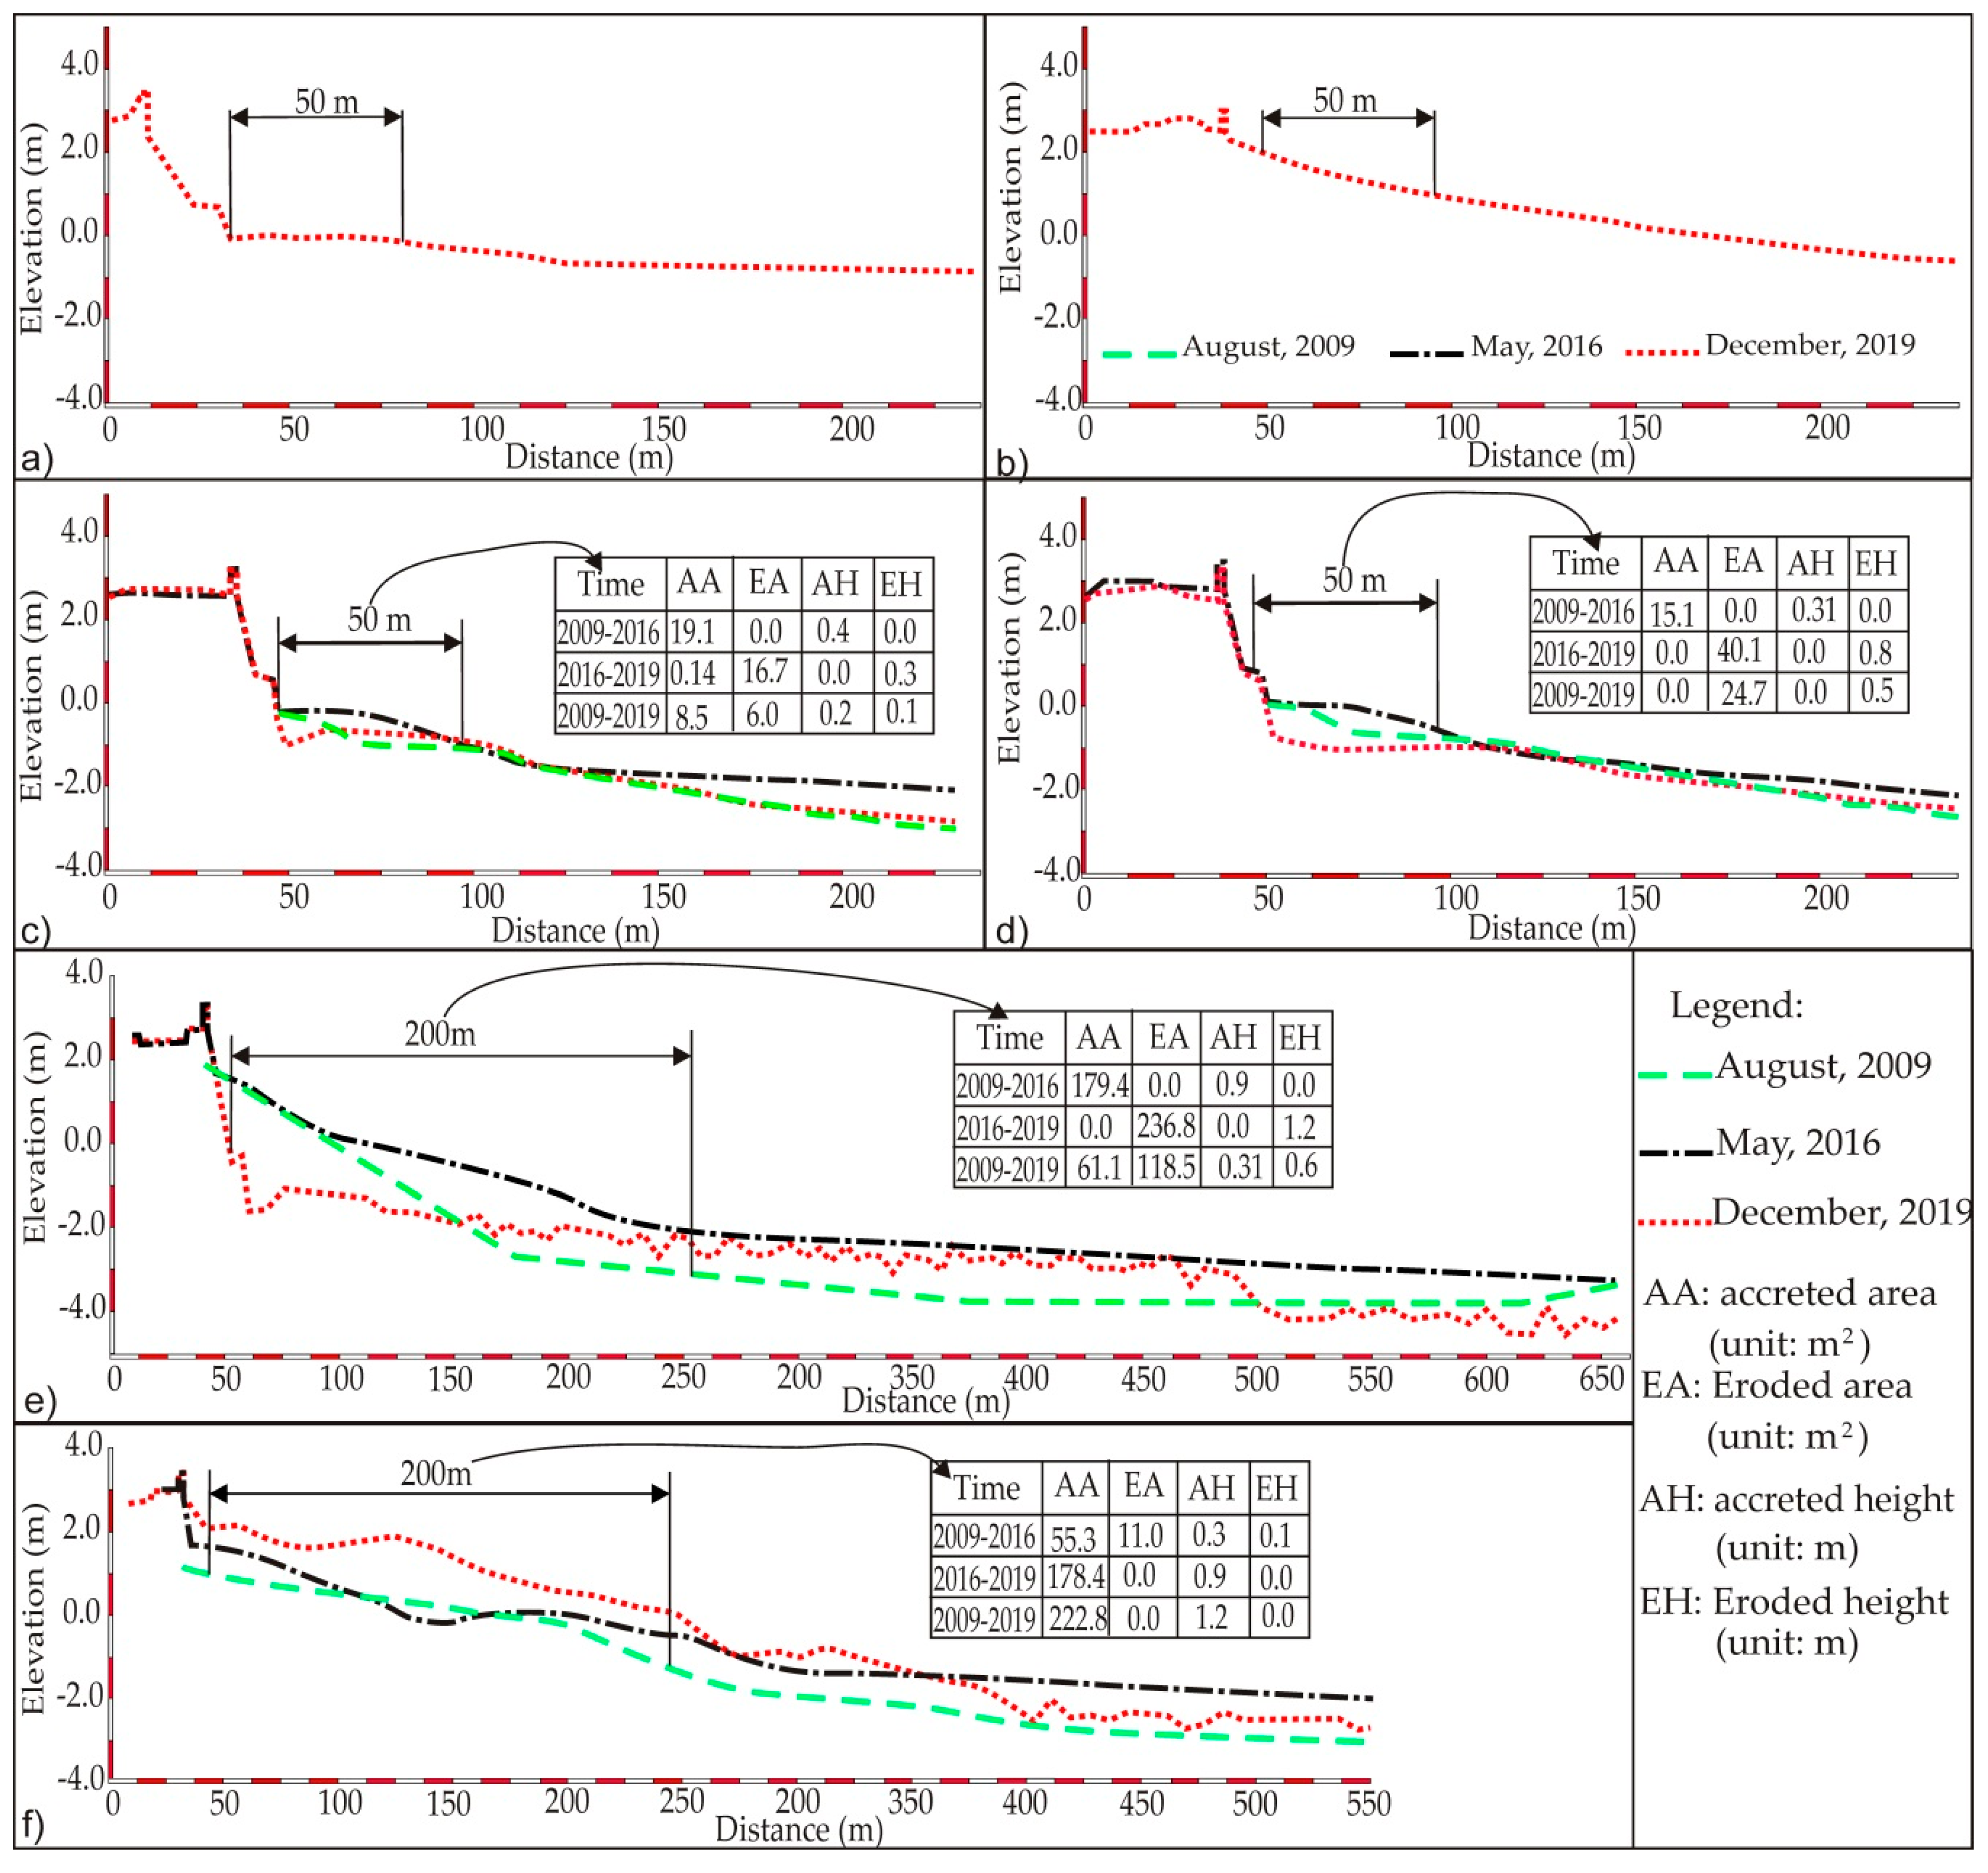
Based on the data of cross-shore profiles (cross sections) were measured over the periods as stated in the above section, six typical cross sections representing the coast of Quat Lam, Thinh Long, and Rang Dong areas are used for analysis of nearshore topographical changes. Each area has two representative sections. The topographical changes of the cross sections are shown in Figure 3 and the positions of the six typical cross sections are shown in Figure 6. The results of overlapping analysis of cross-sections that had the same positions from topographic measurements in August 2009, May 2016, and December 2019 as shown in Figure 3 indicate the following.
-
In Quat Lam area: The beach has a gentle slope and relatively stable. In the northern part of the revetment (CS1 cross section), the beach is locally eroded right the revetment foot to the elevation of −0.7 m and −1.03 m (NCD). In the southern part of the revetment (CS2 cross section), the beach has gentle slope, right next to the revetment without erosion.
-
In Thinh Long area: The beach was strongly eroded, especially the beach area adjacent to the revetment in the period of 2009–2019, with the average erosion level between 0.3 m and 2.0 m (CS3 and CS4 cross sections). In the period of 2009 to 2016, the whole section had a strong accretion trend with an average accretion level from 0.35 m to 1.0 m. However, in the period from 2016 to 2019 the beach was eroded on a large scale (almost overwhelmed all of the previous accretion) and especially strongly in the beach area from the edge, with average erosion level ranged from 0.4 m to 1.2 m.
-
In Rang Dong area: This area had greater and more complicated level of erosion and accretion than in Thinh Long area. The general trend shows the cross sections all eroded, in which the beach 150 m away from the revetment was strongly eroded with average level of 0.7 m to 1.2 m. Specifically next to the revetment foot were eroded the strongest with the level of erosion from 2.5 m to 3.5 m. The width of the more than one-meter-deep eroded beach was about 100 m from the revetment foot to the outside (CS5 and CS6 cross sections).
As recognized from Figure 3, the coast at some cross sections (CS5, CS6) were silted up to 1.5 m at the distance from the shoreline seawards of about 250 m during the period 2009–2016. One of the main reasons is the shift southwards of Ninh Co river flow direction. The change of sediment flow caused intensive siltation in Rang Dong area during 2009–2011 (Figure 4b). However, this issue needs more detailed study, which unfortunately cannot be covered by this research. Some data variation may also derive from the topographical interpolation. The cross sections of CS5 and CS6 for this year 2009 were interpolated from the state published topographical map of the scale 1:5000.
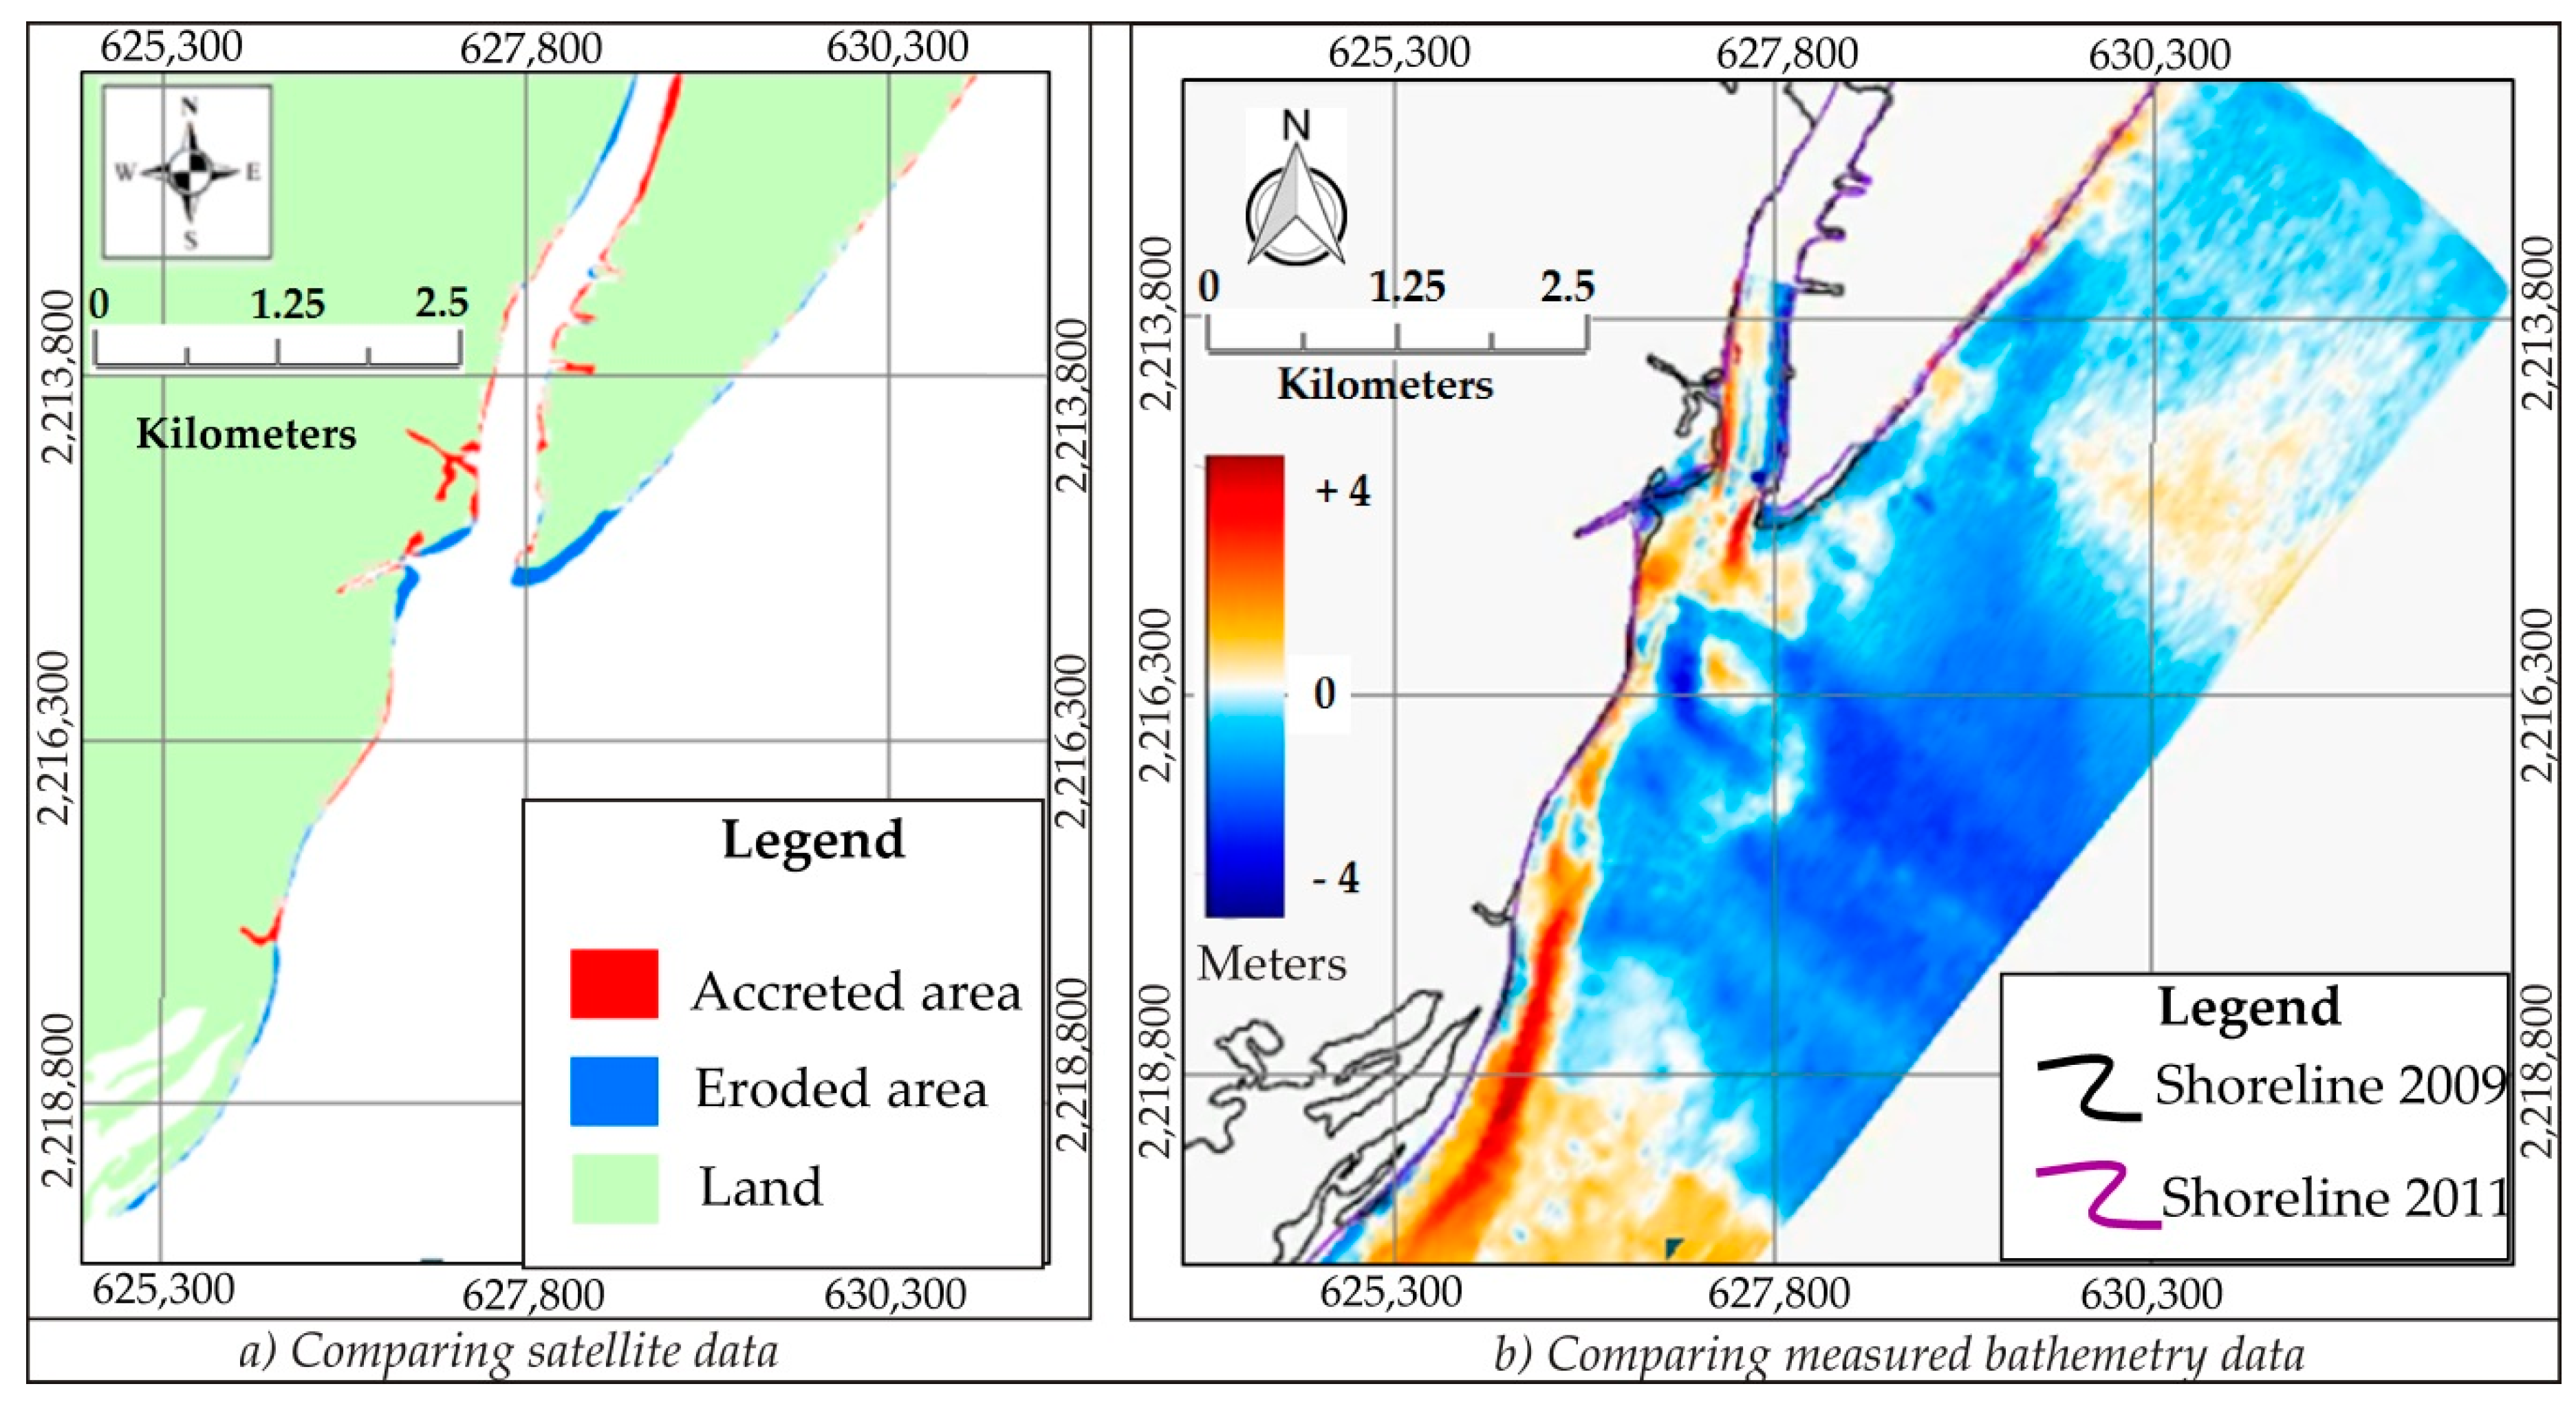
Morphological change of seabed around Ninh Co estuary was accessed by comparing seabed topography data between 2009, 2011, and 2019, which is demonstrated in Figure 4 and Figure 5. There is a slight erosion at Hai Thinh side in period from 2009 to 2011, which was seen by comparing satellite data of 2009 and 2011 (Figure 4a) and also was found when comparing measured bathymetry data of 2009 and 2011 (Figure 4b). The change to the submerged morphological seabed was different at the inside estuary area, in front of estuary area, and in front of Rang Dong area, with little deposition, erosion, and huge deposition at these areas, respectively (
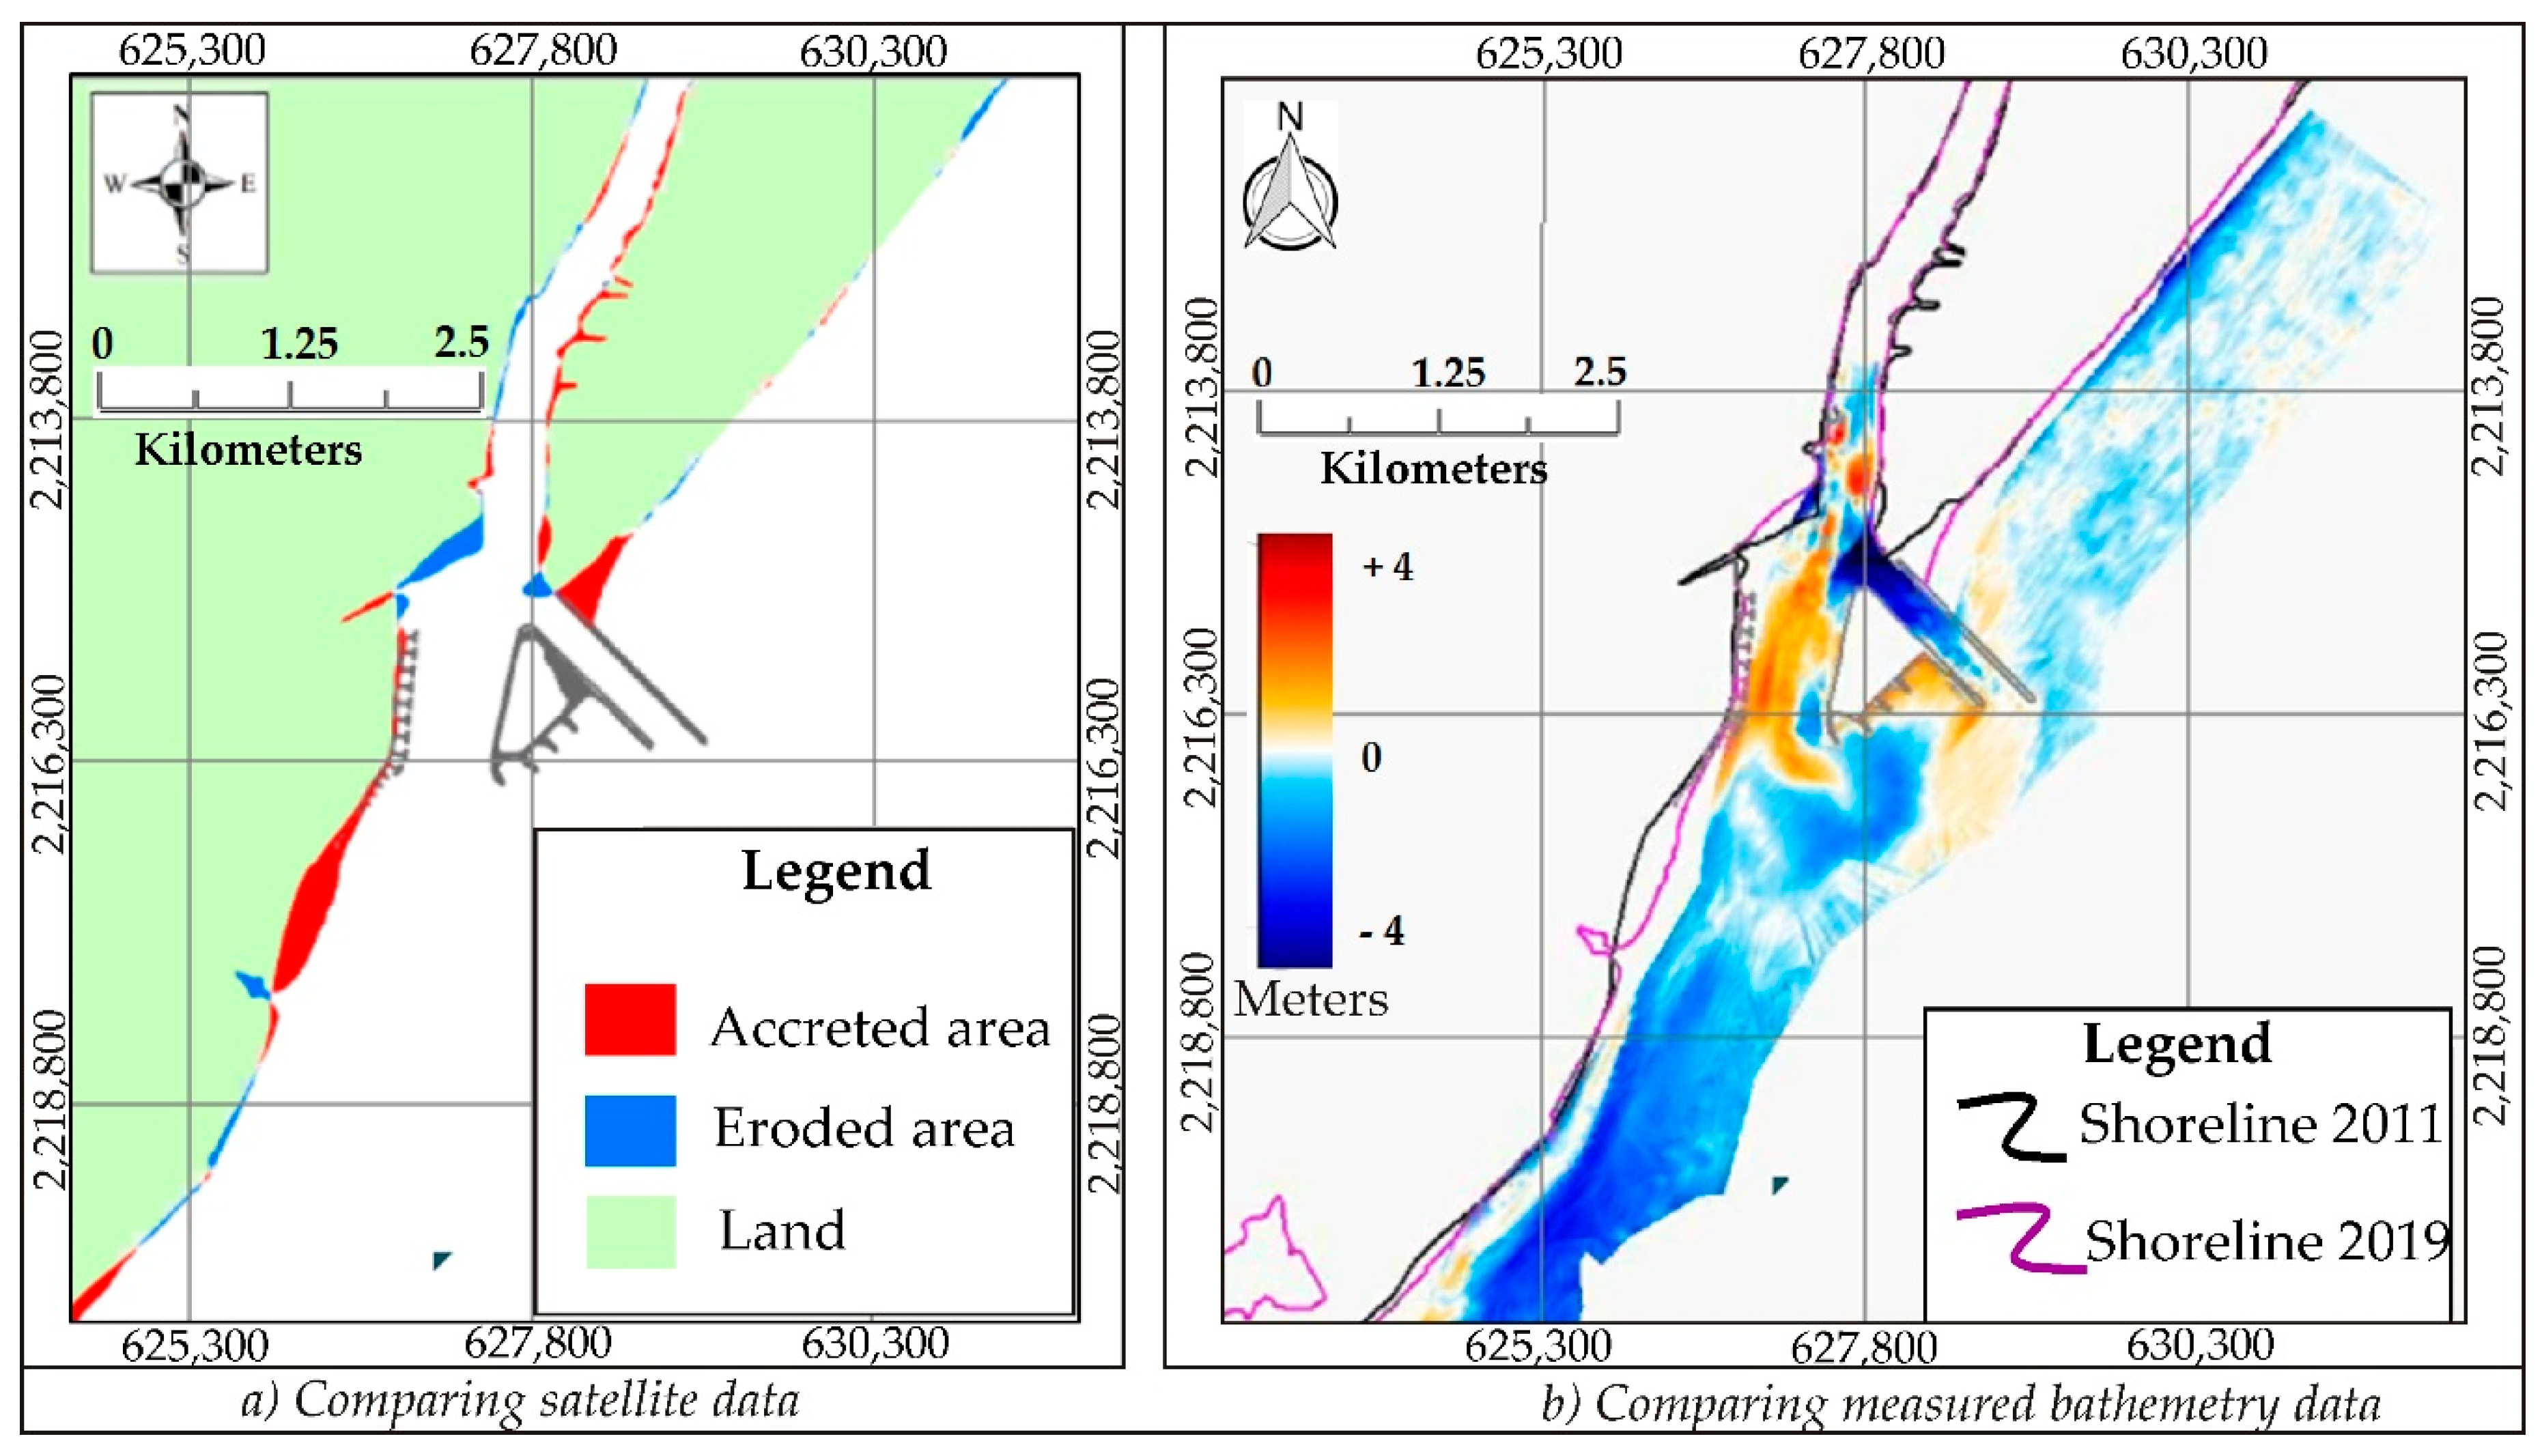
Figure 4b). The waterway access channel was constructed with jetties in the year of 2015 and other activities such as sand mining from 2018 to 2019; sand dredging at the access channel have made changes to the morphology of the seabed at area in front of Ninh Co estuary and Rang Dong site. Sand accumulation occurred at the corner made by the jetty with the bank at Hai Thinh site and little accumulation at emerged beach at Rang Dong (Figure 5a); however, huge erosion happened at the submerged beach of Rang Dong and inside the access channel (Figure 5b). The bathymetry change would cause change to the hydrodynamics (wave and current) in the area, thus affecting the stability of bank protection work there.

3.2. Hydrodynamic Changes

Four simulation scenarios were set up in which bathymetry of the study area for two time periods of 2009 and 2019 and waterway construction have been used to investigate how waves and currents change when approaching the shore. Boundaries and bathymetry data of scenarios are presented in Table 3. The purpose of each scenario is given as following: scenario SC1 is used to assess the seasonal change of wave characteristics along Nam Dinh coast in the Northeast monsoon and Southwest monsoon seasons. The two scenarios SC2 and SC3 have been used for comparison of hydrodynamic conditions to assess the impact of the waterway structure and the beach lowering. Scenarios SC3 and SC4 will be compared with each other to assess the impact of sea level rise (SLR) on the hydrodynamic characteristics along the coast.
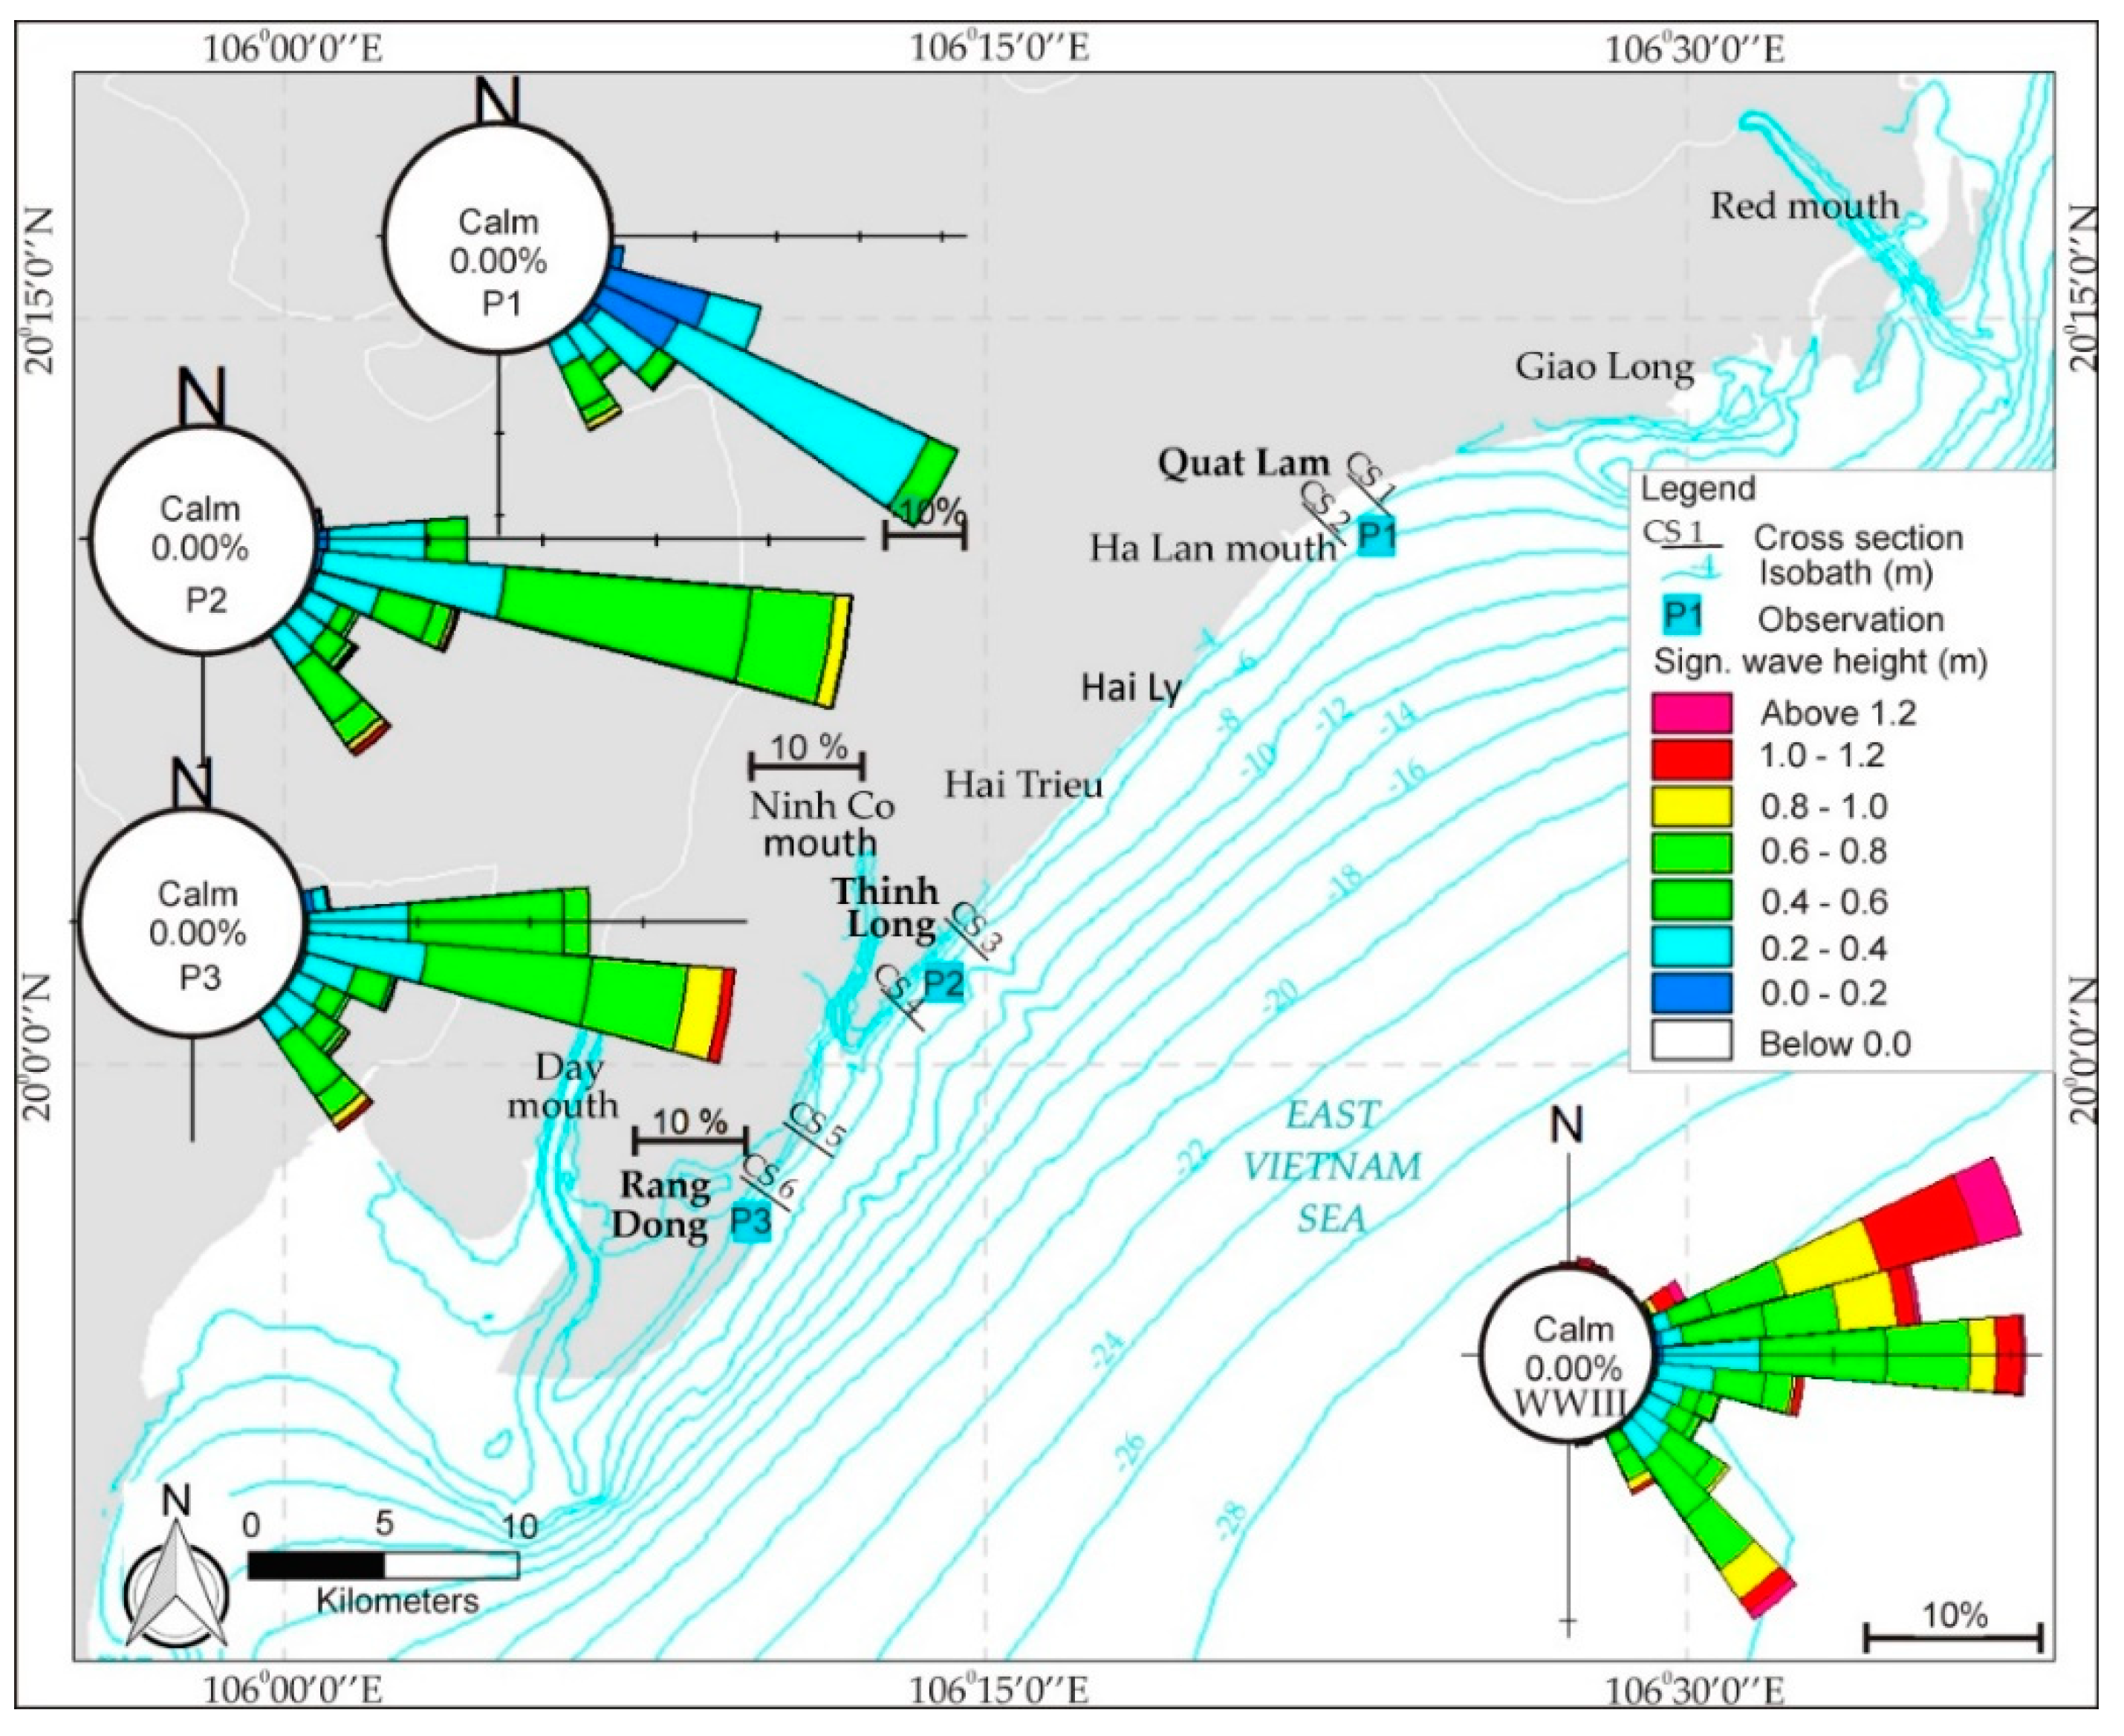
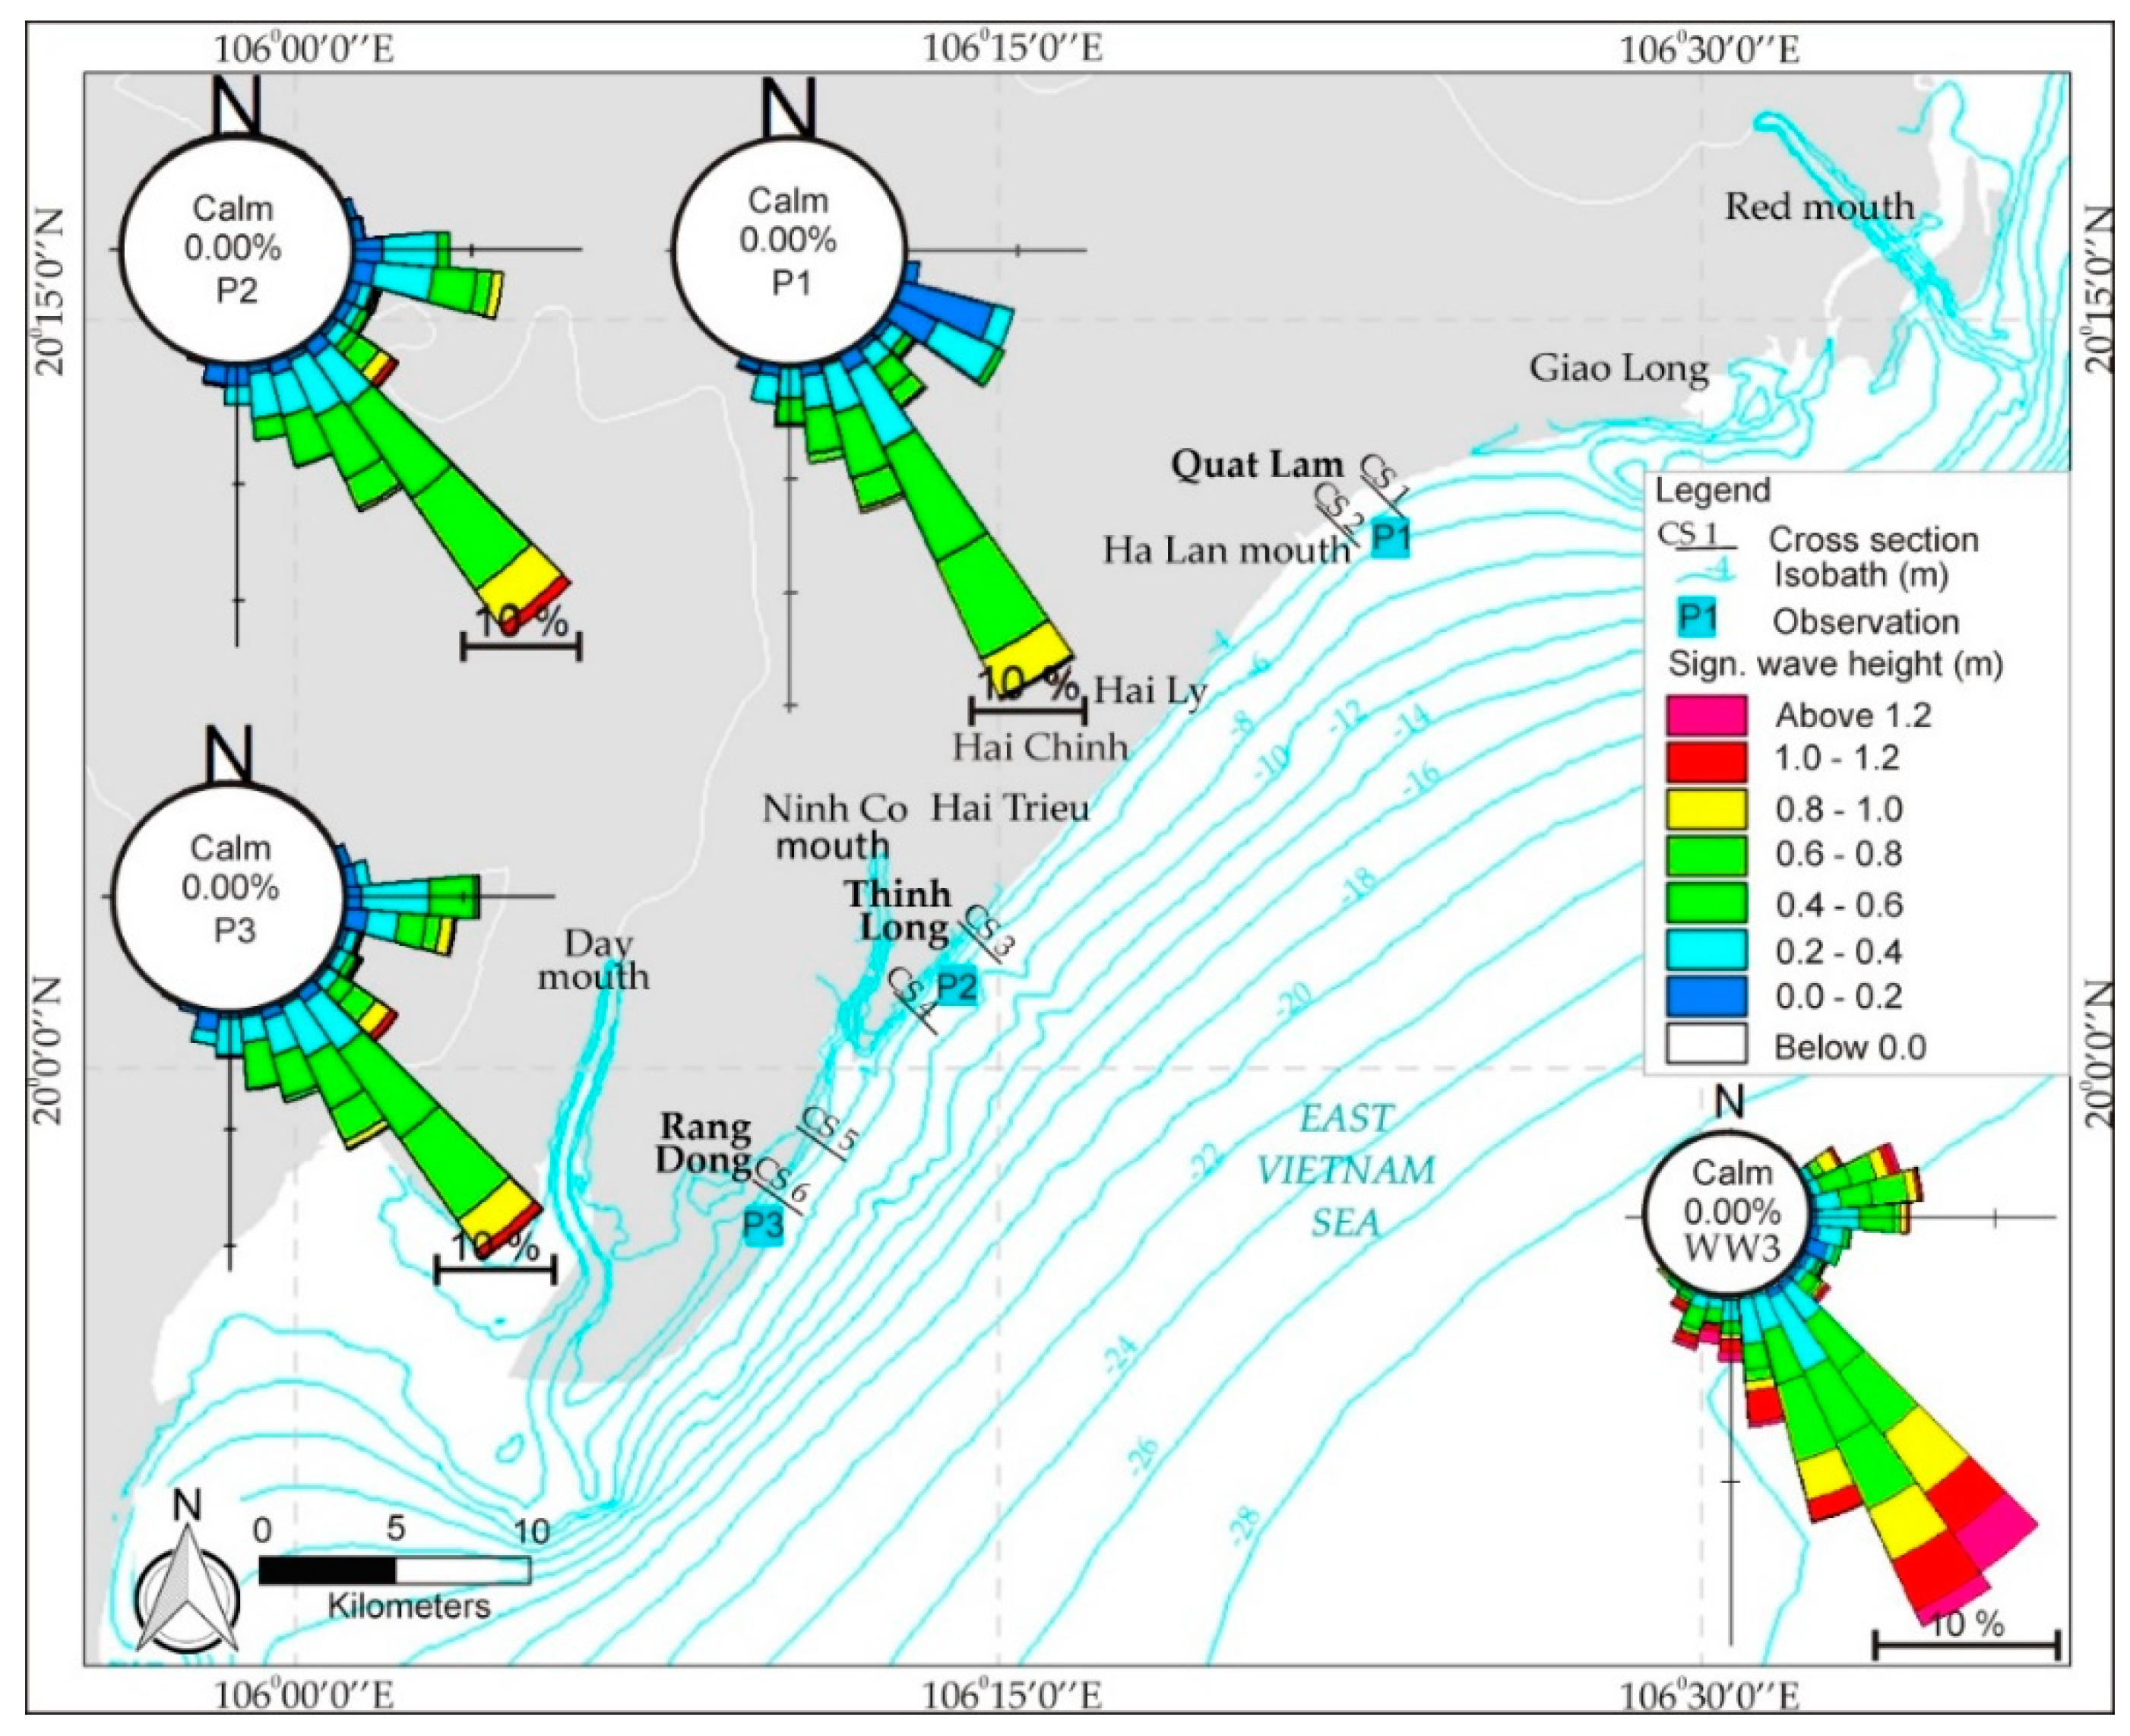
Once the model was calibrated and verified with the water level, wave, and current measurements at Ba Lat, Quat Lam, and Thinh Long, the wave and current information at the nearshore −5.0 m isobaths was extracted at selected points (P1–P3 in Figure 6 and Figure 7), which are the observation points for analysis. Statistics of wave characteristics for three observation points during the two seasons of 2018–2019 (in which slope of revetment was broken at Rang Dong, Thinh Long, and Quat Lam) are shown in Table 4. Wave rose of these points are presented in Figure 6 and Figure 7.
A large variation of coastal wave characteristics in the study area can be found both in space and time. According to the space along the coast, the waves in Rang Dong and Thinh Long areas are much higher than in Quat Lam area. Over time of the year, the Northeast monsoon season has larger waves than the Southwest monsoon. During the Northeast monsoon season, in Rang Dong and Thinh Long areas, the mean of significant wave height was 0.45–0.46 m, and the maximum significant wave height was 1.51–1.65 m. In Quat Lam area, the mean was 0.43 m, the maximum was 1.21 m. During the Southwest monsoon season, in Rang Dong and Thinh Long areas, the mean was 0.32–0.35 m, the maximum was 1.17–1.21 m; in Quat Lam area, the mean was 0.27 m, the maximum was 1.08 m.
During the Northeast monsoon season, wave height was large, the percentage of waves was greater than 0.5 m in the Rang Dong and Thinh Long areas was 40.1–42.7%, and Quat Lam area was 19.6%; the angle between the mean wave direction and the mean coastline was about 60 degrees causing large longshore sediment transport leading to erosion. Whereas with the Southwest monsoon, wave height was small, and the percentage of waves greater than 0.5 m in the Rang Dong and Thinh Long areas was 41.5–39.2%, and in the Quat Lam area it was 17.7%; the angle between the mean wave direction and the mean coastline was about 90 degrees (almost perpendicular to the coast) so it did not cause longshore sediment transport, and the coast this season was less changed.
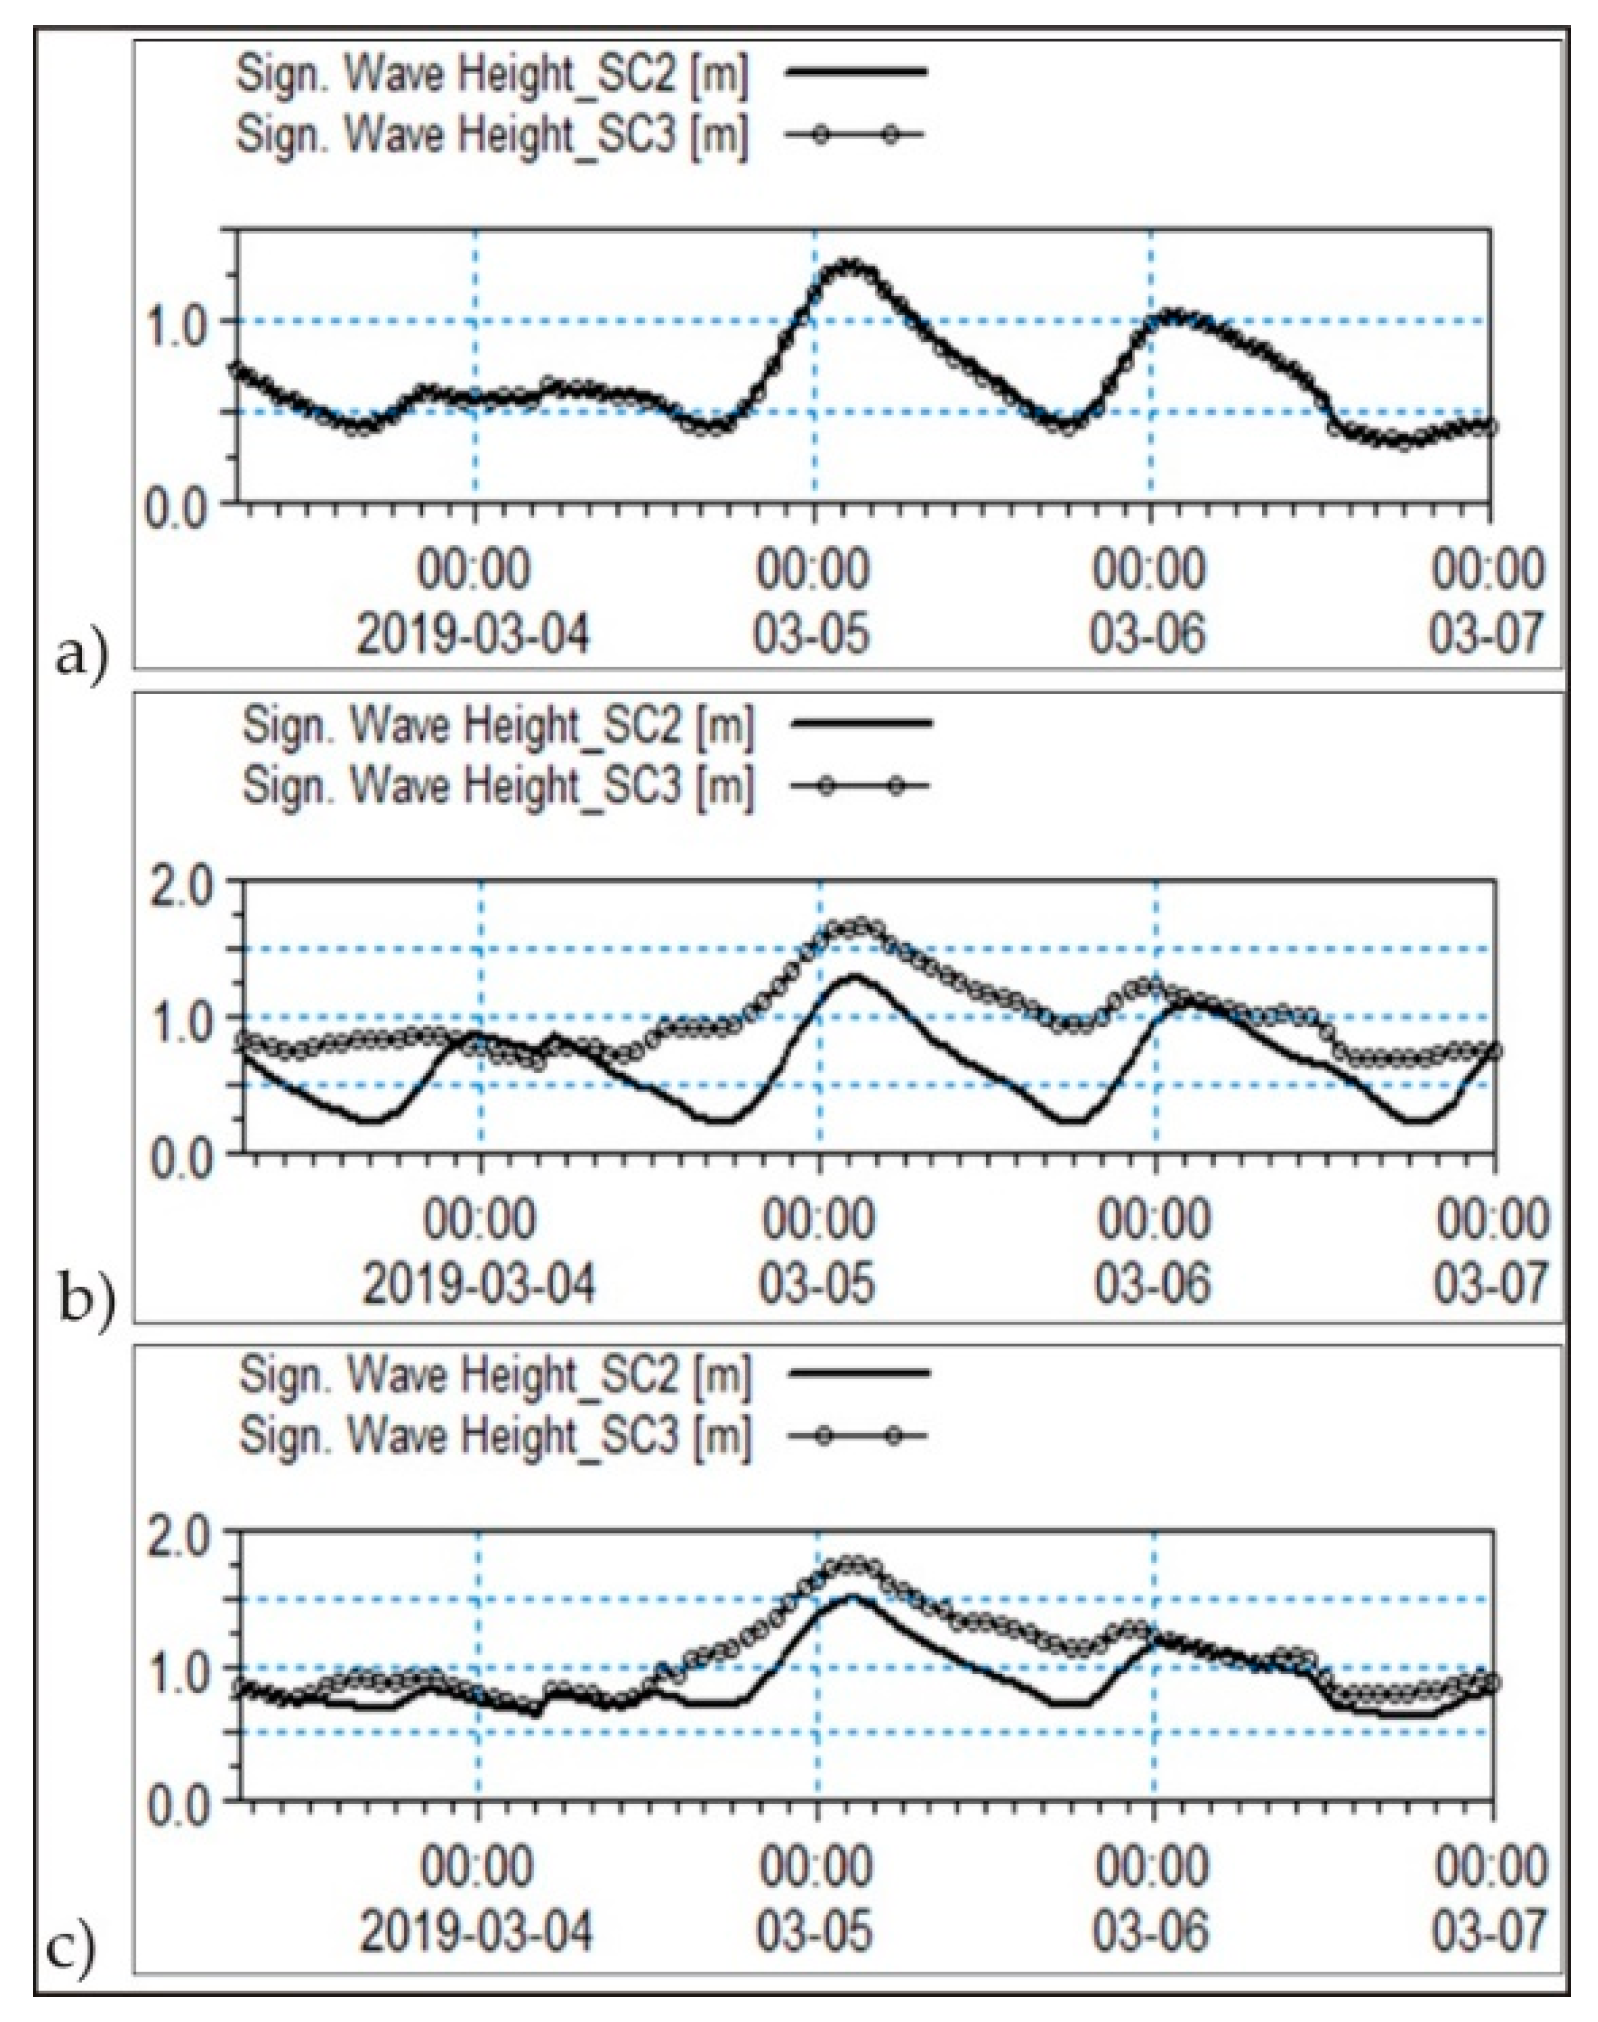
Effects of waterway construction and beach lowering on changing hydrodynamic characteristics were investigated by comparing modeling results between scenarios SC2 and SC3. Wave height at Quat Lam (at point P1) did not change much, where the maximum wave height was 1.36 m in SC3, and 1.35 m in SC2 (0.7%). Wave height at Thinh Long, located in the north site of Ninh Co river mouth (point P2), increased significantly with 1.66 m in SC3 and 1.28 m in SC2. The rise was 38 cm, which was equal to 29.7%. The situation of Rang Dong at south of Ninh Co river mouth (point P3) was quite similar to Thinh Long where the wave height in SC3 increased more when compared to SC2, with 1.74 m and 1.49 m, the difference was 0.25 m equal to a 25% increase (Figure 8 and Table 5).
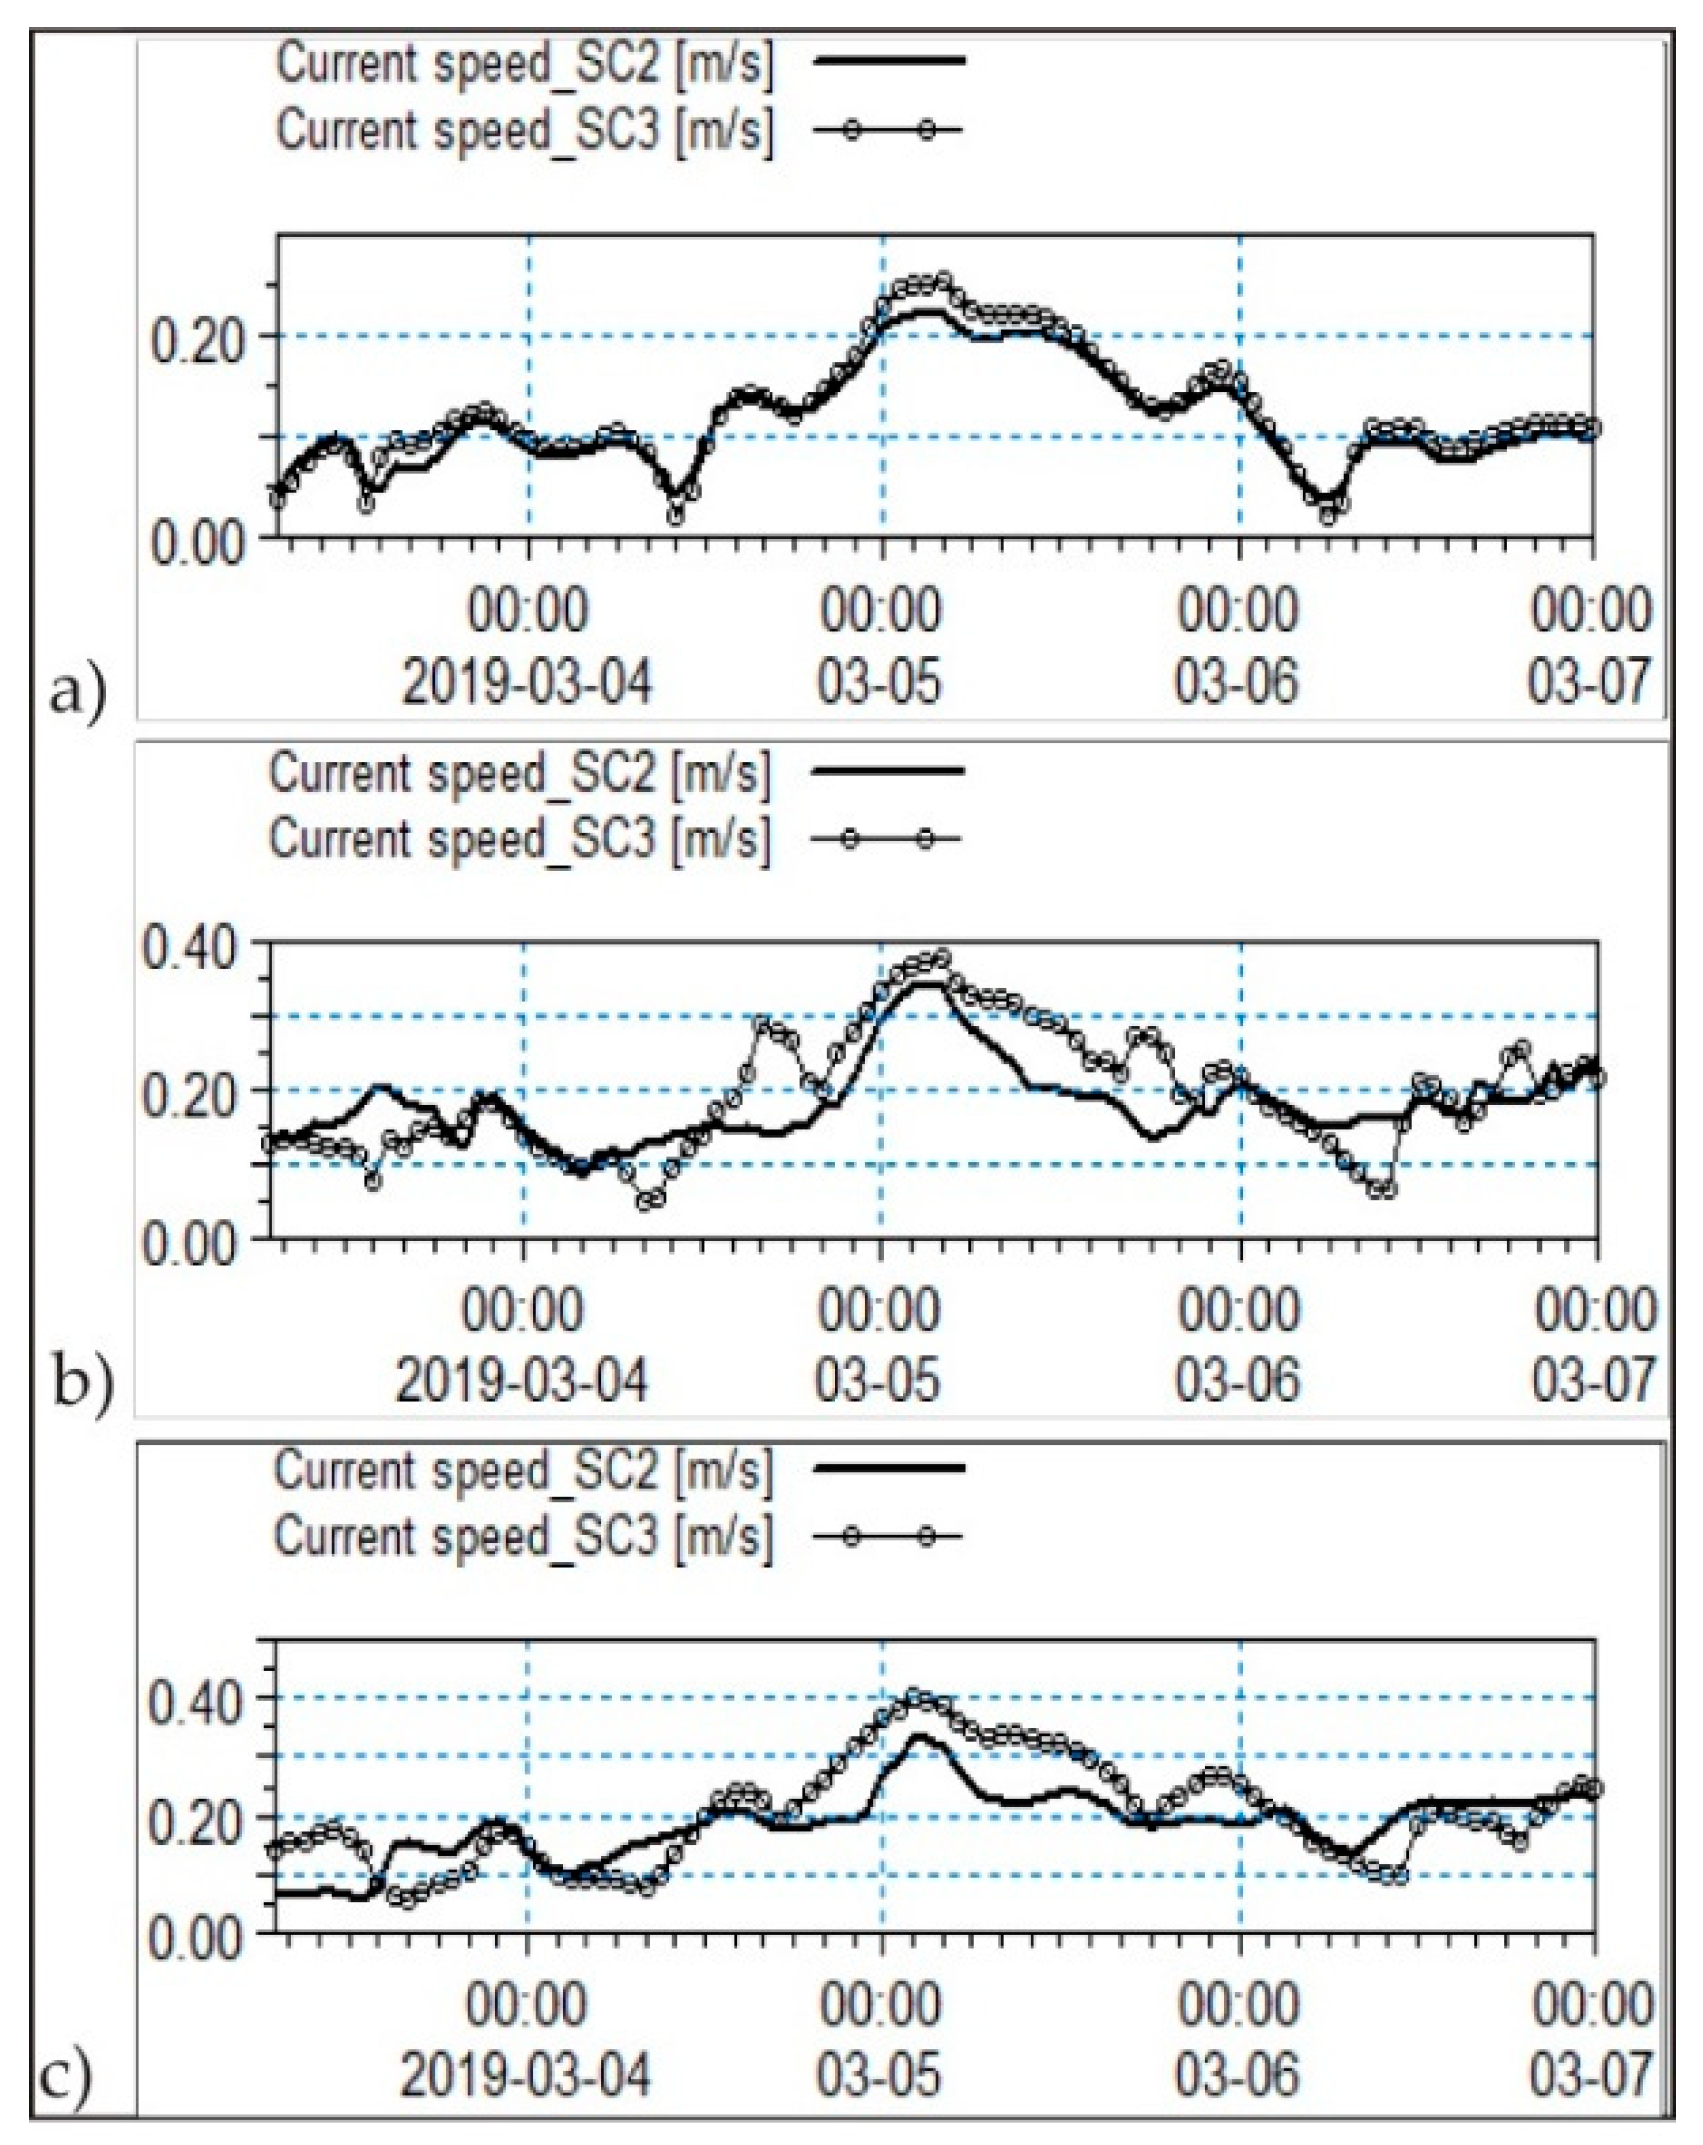
The maximum flow velocity Quat Lam calculated with SC3 scenario was 0.26 m/s compared to SC2 scenario of 0.23 m/s, an increase of 3 cm/s, equivalent to 13%. In Thinh Long area, the maximum flow velocity for SC3 scenario was 0.38 m/s compared to SC2 for 0.32 m/s, an increase of 6 cm/s, equivalent to 18.8%. The maximum flow velocity in Rang Dong for SC3 scenario is 0.40 m/s compared to SC2 for 0.33 m/s, an increase of 7 cm/s, equivalent to 21.2% (Figure 9 and Table 6).

4. Discussion

4.1. Effects of Sea Level Rise

Effect of sea level rise (SLR) will make wave higher and current velocity stronger and increase beach erosion, which has been discussed in many publications [7,32,33,34,35,36]. In this study, effect of SLR was investigated in SC4 with a 25 cm higher water level at the boundary, following published data of the Ministry of Natural Resources and Environment (MONRE) [16] of SLR in 2050 for Vietnam.
Simulation results with an assumption of no change in current seabed elevation showed that maximum wave height in SLR scenarios SC4 in Quat Lam was 1.43 m, which was 7 cm higher than wave height in SC3, equal to 5.1%. Wave height in Thinh Long and Rang Dong in SC4 also increased 4 cm and 3 cm, respectively, in 2050 SLR scenarios equal to 2.4% and 1.7%, respectively (Table 3).
SLR caused the hydrodynamic variables to increase the disadvantage effect in promoting sediment transport and beach lowering. Maximum current velocities in three areas along Nam Dinh coast were both increased in SLR scenarios SC4. Velocity in Quat Lam increased from 0.260 m/s (SC3) to 0.265 m/s (SC4), an increase of 0.05 m/s corresponding to 1.9%. The values at Thinh Long from 0.387 m/s (SC3) to 0.380 m/s (SC4), an increase of 0.07 m/s corresponding to 1.8%; and Rang Dong from 4.00 m/s (SC3) to 4.08 m/s (SC4), an increase of 0.08 m/s corresponding to 2.0% (Table 5).

4.2. Wave Pressure on Seadike Slope

The sea embankment at Rang Dong was built with parameters: crest level +3.0 m, toe level −0.5 m, slope one-third, and with a protective layer by internal concrete blocks. Higher wave resulting from lowering beach have pressed additional pressure on slope of sea embankment. Calculation by MIKE 21SW was done to propagate design wave from offshore to near shore and to the sea embankment for bathymetry of past year 2009, and bathymetry of the recent year 2019. The design wave parameter: significant wave height Hs = 9.05 m and period Tp = 11.3 s in offshore and the design water level WL = +2.84 m, gives Hs = 2.06 m and Tp = 8.3 s in front of the embankment under bathymetry of 2019, and Hs = 0.71 m and Tp = 6.8 s under bathymetry of 2009.
Maximum pressure caused by wave height on the slope of Rang Dong revetment was calculated following Fuhrboter and Sparboom (1988) [37]:
P max ,   i = const i   ρ w   g   Hs   tan α  
where Hs: the significant wave height (m); α: the slope angle (0); g: accerleration due to gravity (m/s2); ρw: density of the water (kg/m3); consti: coefficient depending on the characteristics maximum values (const50 = 12, const90 = 16, const99 = 20, const99.9 = 30).
The result for two cases and was presented in column 4 on Table 7. It can be seen from Table 7 that lower bathymetry of 2019 has produced a higher wave to the Rang Dong revetment, which was approximately three times compared with wave height produced under bathymetry of 2009. Maximum pressure caused by higher wave under bathymetry year 2019 was also approximately three times with that of under bathymetry of the year 2009.
Thickness of the revetment protection layer is a function of significant wave height and the breaker index. It can be calculated by several formulas such as Pilarczyk (1990) [38], the PIANC guideline MarCom 57 (also known as WG114) [39]. In this paper, thickness of revetment protection layer at Rang Dong was calculated following Pilarczyk (1990) as follows:
H s Δ D = Φ 0 c o s ξ
where Hs: the significant wave height (m); Φ0: coefficient, which is 3.0 to 3.5 for (regular) pitched blocks; D: the block thickness (m); ∆: the relative density of the block; α: the slope angle (0); and ξ: breaker index.
The thickness of the protection layer has to be increased almost three times corresponding to the wave height increase due to bathymetry of 2009 and 2019. This explains why the broken of slope of the Rang Dong revetment has thickness of 20 cm. Meanwhile, the thickness of protection layer in Rang Dong as calculated by Equation (3) is 0.32 m. Calculations for Rang Dong revetment under bathymetry of year 2009 and bathymetry of year 2019 showed that a wave height increase of three times, results in the thickness of the protection layer increase by 2.5 times (Table 7).

4.3. General Proposal of Adaptive Measures

The calculation and analysis results have proved that waves are the main factor affecting coastal erosion and bank protection embankment. Therefore, it is necessary to have structural measures to reduce waves and accumulate sediment to restructure the beach. The measures of building works need to inherit practical experiences and lessons in the construction and management of coastal and beach protection works built on the Nam Dinh coastal strip. Construction solutions aimed at stabilizing the coast should follow the current situation, building appearance, and structure, to ensure sustainability and appropriateness for each coastal area as well as being harmoniously connected with existing coastal infrastructure. The system of remote wave reduction works (breakwaters/or associated with coastal protection embankments) would be effective structural solutions to reduce high waves, and are stable and convenient for constructing, maintenance, and management.

5. Conclusions

Although the protective measures have been intensively carried out in the coast, nearshore topographical changes and coastal erosion are still a seriously occurred in Nam Dinh province. The site investigation of nearshore topography shows the recent changes on the coast. In the north area the nearshore topography is quite stable. Meanwhile, the shoreline in the south part has experienced intensive changes with severe coastal erosion. In Thinh Long area, during the period from 2016 to 2019, the beach was seriously eroded, the cross-section was lowered from 0.4 m to 1.2 m.
The construction of jetties in 2015, and other activities such as sand mining in 2018–2019, and sand dredging at the access channel have made changes to the morphology of the seabed at the area in front of Ninh Co estuary and Rang Dong site. Accretion areas formed nearby the jetty at the Hai Thinh site and at the emerged beach at Rang Dong; however, serious erosion has occurred at submerged beach of Rang Dong and inside the access channel.
Hydrodynamic models show the changes of the nearshore bathymetry increase wave heights, wave pressures on sea revetments, and sea dikes. Therefore, the coast should be reinforced with properly constructed revetment, and nearshore sand exploitation should be halted.

Author Contributions

Conceptualization: D.M.D., N.T.H., D.T.Q., V.D.C.; field investigation and modeling: N.T.H., V.D.C.; writing original draft preparation: D.M.D., N.T.H., D.T.Q., V.D.C.; writing—review and editing: D.M.D., N.T.H., D.T.Q., V.D.C. All authors have read and agreed to the published version of the manuscript.

Funding

This research was funded by the project “Observe, survey, evaluate, and determine the causes of the broken of sea dyke and revetment Nam Dinh province at 3 sites Quat Lam, Hai Thinh and Rang Dong" under the contract number “15/HĐTV” between VAWR with Department of Agriculuture and Rural Development of Nam Dinh province.

Conflicts of Interest

The authors declare no conflict of interest.

References

  1. IPCC, 2019: Special Report on the Ocean and Cryosphere in a Changing Climate; Pörtner, H.-O.; Roberts, D.C.; Masson-Delmotte, V.; Zhai, P.; Tignor, M.; Poloczanska, E.; Mintenbeck, K.; Alegría, A.; Nicolai, M.; Okem, A.; et al. (Eds.) IPCC: Geneva, Switzerland, 2019. [Google Scholar]
  2. Cong, V.M.; Stive, M.J.F.; Van Gelder, P.H.A.J.M. Coastal protection strategies for the Red River Delta. J. Coast. Res. 2009, 25, 105–116. [Google Scholar]
  3. Schleupner, C. Spatial assessment of sea level rise on Martinique’s coastal zone and analysis of planning frameworks for adaptation. J. Coast. Conserv. 2007, 11, 91–103. [Google Scholar] [CrossRef]
  4. Yasuhara, K.; Tamura, M.; Ling, F.H.; Prabhakar, S.V.R.K. Overcoming barriers to climate change adaptation: Role and comparison of international networks. J. JSCE G (Environment) 2011, 67, 203–212. [Google Scholar]
  5. Anthony, E.J.; Brunier, G.; Besset, M.; Goichot, M.; Dussouillez, P.; Nguyen, V.L. Linking rapid erosion of the Mekong River delta to human activities. Sci. Rep. 2015, 5, 14745. [Google Scholar] [CrossRef] [PubMed] [Green Version]
  6. Kuriyama, Y.; Banno, M. Shoreline change caused by the increase in wave transmission over a submerged breakwater due to sea level rise and land subsidence. Coast. Eng. 2016, 112, 9–16. [Google Scholar] [CrossRef]
  7. Dean, R.G.; Houston, J.R. Determining shoreline response to sea level rise. Coast. Eng. 2016, 114, 1–8. [Google Scholar] [CrossRef]
  8. Sharaan, M.; Somphong, C.; Udo, K. Impact of SLR on Beach-Tourism Resort Revenue at Sahl Hasheesh and Makadi Bay, Red Sea, Egypt; A Hedonic Pricing Approach. J. Mar. Sci. Eng. 2020, 8, 432. [Google Scholar] [CrossRef]
  9. Ware, D.; Buckwell, A.; Tomlinson, R.; Foxwell-Norton, K.; Lazarow, N. Using Historical Responses to Shoreline Change on Australia’s Gold Coast to Estimate Costs of Coastal Adaptation to Sea Level Rise. J. Mar. Sci. Eng. 2020, 8, 380. [Google Scholar] [CrossRef]
  10. Hanh, P.T.T.; Furukawa, M. Impact of Sea Level Rise on Coastal Zone of Vietnam; Bulletin of Faculty of Science; University of the Ryukyus: Nishihara, Japan, 2007; pp. 45–59. [Google Scholar]
  11. Duc, D.M.; Nhuan, M.T.; Ngoi, C.V. An analysis of coastal erosion in the tropical rapid accretion delta of the Red River, Vietnam. J. Asian Earth Sci. 2012, 43, 98–109. [Google Scholar] [CrossRef]
  12. Nguyen, H.Q.; Takewaka, S. Detection of Land Subsidence in Nam Dinh Coast by Dinsar Analyses. In Proceedings of the 10th International Conference on Asian and Pacific Coasts (APAC 2019), Hanoi, Vietnam, 25–28 September 2019; Springer Nature: Singapore, 2019. [Google Scholar]
  13. Thuy, M.T.T.; Nagatsuka, S.; Nishihata, T.; Takewaka, S.; Mimura, N.; Yasuhara, K.; Duc, D.M. Analysis of a large-scale erosion in Hai Hau coast, Northern Vietnam. J. JSCE B 2012, 2, 68. [Google Scholar]
  14. Yasuhara, K.; Juan, R. Geosynthetic-wrap around revetments for shore protection. Geotext. Geomembr. 2007, 10, 1–12. [Google Scholar] [CrossRef]
  15. Masria, A.; Iskander, M.; Negm, A. Coastal protection measures, case study (Mediterranean zone, Egypt). J. Coast. Conserv. 2015, 19. [Google Scholar] [CrossRef]
  16. Ministry of Natural Resources and Environment (MONRE). Climate Change, Sea Level Rise Scenarios for Vietnam. 2016. Available online: http://www.imh.ac.vn/files/doc/2017/CCS%20final.compressed.pdf (accessed on 29 June 2020).
  17. Duc, D.M.; Yasuhara, K.; Hieu, N.M.; Lan, N.C. Climate change impacts on a large-scale erosion coast of Hai Hau district, Vietnam and the adaptation. J. Coast. Conserv. 2017, 21, 47–62. [Google Scholar] [CrossRef]
  18. Pruszak, Z.; Szmytkiewicz, M.; Hung, N.M.; Ninh, P.V. Coastal processes in the Red River delta area, Vietnam. Coast. Eng. J. 2002, 44, 97–126. [Google Scholar] [CrossRef]
  19. Le, T.P.Q.; Garnier, J.; Gilles, B.; Sylvain, T.; Van, M.C. The changing flow regime and sediment load of the Red River, VietNam. J. Hydrol. 2007, 334, 199–214. [Google Scholar] [CrossRef]
  20. Häglund, M.; Svenssen, P. Coastal Erosion at Hai Hau Beach in the Red River Delta, Vietnam. Master’s Thesis, Coastal Engineering, Lund University, Lund, Switzerland, 2002. [Google Scholar]
  21. Duc, D.M.; Nhuan, M.T.; Ngoi, C.V.; Nghi, T.; Tien, D.M.; van Weering, T.C.E.; van den Bergh, G.D. Sediment distribution and transport at the nearshore zone of the Red River delta, Northern Vietnam. J. Asian Earth Sci. 2007, 29, 558–565. [Google Scholar] [CrossRef]
  22. Te Slaa, S. Coastal Erosion Processes near Sea Dike in Hai Hau District, Vietnam. Master’s Thesis, Hydraulic Engineering, Delft University of Technology, Delft, The Netherlands, 2009; 191p. [Google Scholar]
  23. Huong, T.T.T. Swan Predictions of Nearshore Wave Climate at Nam Dinh Coast of Vietnam. Master’s Thesis, Delft University of Technology, Delft, The Netherlands, 2003; p. 71. [Google Scholar]
  24. Dabees, M.; Kamphuis, J.W. Oneline, a numerical model for shoreline change. In Proceedings of the 26th International Conference on Coastal Engineering, Copenhagen, Denmark, 22–26 June 1998. [Google Scholar]
  25. Anna, Z. Mathematical Modelling of Shoreline Evolution under Climate Change. Ph.D. Thesis, Faculty of Technology, University of Plymouth, Plumouth, UK, 2008. [Google Scholar]
  26. Vu, L.G. Coastal Morphology: A Case Study in Province of Nam Dinh, Red River Delta, Vietnam. Master’s Thesis, International Institute for Infrastructure, Hydraulic and Environmental Engineering, Delft, The Netherlands, 2003. [Google Scholar]
  27. MIKE 2017. Hydrodynamic Module User Guide. p. 144. Available online: https://manuals.mikepoweredbydhi.help/2017/Coast_and_Sea/M21HD.pdf (accessed on 29 June 2020).
  28. MIKE 2017. Spectral Wave Module User Guide. p. 120. Available online: https://manuals.mikepoweredbydhi.help/2017/Coast_and_Sea/MIKE21SW.pdf (accessed on 29 June 2020).
  29. MIKE 2017. Non-Cohesive Sediment Transport Module User Guide. p. 58. Available online: https://manuals.mikepoweredbydhi.help/2017/Coast_and_Sea/m21st.pdf (accessed on 29 June 2020).
  30. National Weather Service. NOAA Wave Watch III Model Data Access. Available online: https://polar.ncep.noaa.gov/waves/ensemble/download.shtml? (accessed on 29 June 2020).
  31. Egbert & Erofeeva, CEOAS, Oregon State University, USA. OSU TPXO Tide Models. Available online: https://www.tpxo.net/ (accessed on 29 June 2020).
  32. Chini, N.; Stansby, P.; Leake, J.; Wolf, J.; Roberts-Jones, J.; Lowe, J. The impact of sea level rise and climate change on inshore wave climate: A case study for East Anglia (UK). Coast. Eng. 2010, 57, 973–984. [Google Scholar] [CrossRef]
  33. Vitousek, S.; Barnard, P.L.; Limber, P.; Erikson, L.; Cole, B. A model integrating longshore and cross-shore processes for predicting long-term shoreline response to climate change. J. Geophys. Res. Earth Surf. 2017, 122, 782–806. [Google Scholar] [CrossRef]
  34. Ding, Y.K.; Frey, A.E.; Styles, R. Probabilistic modeling of long-term shoreline changes in response to sea level rise and waves. Scour and Erosion IX. In Proceedings of the 9th International Conference on Scour and Erosion (ICSE 2018), Taipei, Taiwan, 5–8 November 2018; pp. 203–211. [Google Scholar]
  35. Ding, Y.; Kim, S.C.; Frey, A.E. Probabilistic Shoreline Evolution Modeling in Response to Sea Level Changes. In World Environmental and Water Resources Congress 2018: Hydraulics and Waterways, Water Distribution Systems Analysis, and Smart Water, Minneapolis, MN, USA, 3–7 June 2018; American Society of Civil Engineers: Reston, VA, USA, 2018; pp. 197–209. [Google Scholar]
  36. Wang, L.; Perrie, W.; Long, Z.; Blokhina, M.; Zhang, G.; Toulany, B.; Zhang, M. The impact of climate change on the wave climate in the Gulf of St. Lawrence. Ocean. Model. 2018, 128, 87–101. [Google Scholar] [CrossRef]
  37. Fuhrboter, A.; Sparboom, U. Shock pressure interactions on prototype sea dykes caused by breaking waves. In Proceedings of the SOWAS 88: International Symposium on Modelling Soil-Water-Structure Interactions, Delft, The Netherlands, 29 August–2 September 1988; Kolkman, P.A., Lindenberg, J., Pilarczyk, K.W., Eds.; Balkema: Rotterdam, The Netherlands, 1988; pp. 243–252. ISBN 9061918154. [Google Scholar]
  38. Pilarczyk, K.W. (Ed.) Coastal Protection; Balkema: Rotterdam, The Netherlands, 1990. [Google Scholar]
  39. Dorst, K.; Provoost, Y.; Verhagen, H.J. Stability of Pattern Places Revetment Elements. In Proceedings of the 8th International Conference on Coastal and Port Engineering in Developing Countries (COPEDEC 2012), IIT Madras, Chennal, India, 20–24 February 2012. [Google Scholar]
Figure 1. Survey area in 2009 and 2019 and erosion locations along the Nam Dinh coast. (a) Sand mining in front of Rang Dong. (b) Erosion at Rang Dong in 2019. (c) Erosion at Quat Lam 2019. (d) Waterway construction at Ninh Co river mouth.
Jmse 08 00755 g001
Figure 2. Comparisons between observed (line-circle) and simulated (line) of water levels, wave, and currents at BL, QL, and NH stations.
Jmse 08 00755 g002aJmse 08 00755 g002b
Figure 3. Comparisons between cross sections observed in the period of 2009–2019. Figure (a) CS1 cross Section 1 (CS1), (b) CS2 cross Section 2 (CS2), (c) CS3 cross Section 3 (CS3), (d) CS4 cross Section 4 (CS4), (e) CS5 cross Section 5 (CS5), (f) CS6 cross Section 6 (CS6).
Jmse 08 00755 g003
Figure 4. Comparing seabed topography data between 2009 and 2011.
Jmse 08 00755 g004
Figure 5. Comparing seabed topography data between 2011 and 2019.
Jmse 08 00755 g005
Figure 6. Wave rose in Northeast monsoon season at 3 sites in Nam Dinh Coast.
Jmse 08 00755 g006
Figure 7. Wave rose in the Southwest monsoon season at 3 sites in Nam Dinh Coast.
Jmse 08 00755 g007
Figure 8. Maximum wave height at 3 locations: (a) at P1; (b) at P2 and (c) at P3.
Jmse 08 00755 g008
Figure 9. Maximum current velocity at 3 locations: (a) at P1; (b) at P2 and (c) at P3.
Jmse 08 00755 g009
Table 1. Information of observation stations.
StationEast (m)North (m)ParametersObservation Time
BL669,3482,236,344Current, Wave, Water level10 November 2018 to 21 November 2018
QL645,8822,230,198Current, Wave, Water level15 November 2019 to 19 November 2019
NH629,3372,211,855Current, Wave, Water level15 November 2019 to 19 November 2019
A total of 24 sediment samples on beach at 3 locations along Nam Dinh coast were collected during field works in November 2019 and were analysed for grain sizes. The predominant sediment material in the area consists of well-sorted fine sand with d50 of 151 μm.
Table 2. Verification root mean squared error (RMSE) values at the stations.
ParametersUnitsCalibrationVerification
BL StationQL StationNH Station
Water levelM0.180.180.16
Current speedm/s0.130.080.09
Current directiondeg.127.6462.35102.67
Significant wave heightM0.170.210.18
Peak wave periodS0.571.021.78
Mean wave directiondeg.19.3943.3713.63
Table 3. Summary of model simulations.
Scenarios NameHydrodynamicsPurposes
SC1Hydrodynamics boundary cond. in 2018–2019; Bathymetry data 2019 with waterway construction at Ninh Co river mouth.Access seasonal change of wave characteristics along Nam Dinh coast.
SC2Hydrodynamics boundary cond. in March 2019; Bathymetry data 2009.Reproduce hydrodynamic at 2009 bathymetry conditions without waterway construction.
SC3Hydrodynamics boundary cond. in March 2019; Bathymetry data 2019 which representing waterway construction at Ninh Co river mouth and bathymetry after sand mining activity in front of Rang Dong beach.Access the effect of beach lowering and existing waterway construction on hydrodynamics
SC4Hydrodynamics boundary cond. in March 2019; Bathymetry data 2019 with waterway construction and sea level rise 25 cmAccess the effect of sea level rise (SLR) to wave and current approaching shore
Numerical simulations of hydrodynamics (SC1) for Nam Dinh coast have been carried out for whole climate year start from the Northeast (NE) monsoon season (from October of previous year to March of next year) to the end of Southwest (SW) monsoon season (from April to September).
Table 4. Statistics of wave characteristics at 3 observation points along the Nam Dinh coast in Northeast monsoon season and Southwest monsoon season.
Observation PointsMean direction of Coast (deg.)Northeast Monsoon SeasonSouthwest Monsoon Season
Mean of Sign. Wave Height (m)Mean wave Direction (deg.)Maximum of Sign. Wave height (m)Percentage of Sign. Wave Height > 0.5 m (%)Mean of Sign. Wave Height (m)Mean wave direction (deg.)Maximum of Sign. Wave Height (m)Percentage of Sign. Wave Height > 0.5 m (%)
P1600.43124.11.2119.60.27147.01.0817.7
P2450.46106.21.6542.70.35135.11.2139.2
P3450.45108.41.5140.10.32135.31.1731.5
Table 5. Maximum wave height at 3 points in the nearshore.
Name of Wave PointCoordinate (UTM Zone 48)Maximum Wave Height with Scenarios (m)Location
East (m)North (m)SC1SC2SC3SC4
P1644,8672,232,0161.211.351.361.43Quat Lam
P2628,6732,214,9191.651.281.661.70Thinh Long
P3624,2082,207,3231.511.491.741.77Rang Dong
Table 6. Maximum current velocity at 3 points in the nearshore.
Name of Wave PointCoordinate (UTM Zone 48)Maximum Current Velocity with Scenarios (m/s)Location
East (m)North (m)SC1SC2SC3SC4
P1644,8672,23,20160.210.230.260.27Quat Lam
P2628,6732,214,9190.360.320.380.39Thinh Long
P3624,2082,207,3230.350.330.400.41Rang Dong
Table 7. Maximum pressure on Rang Dong revetment.
BathymetryHs (m)Tp (s) P max   ( Kpa ) D (m)
20090.716.829.70.32
20192.068.2586.10.79
Hs—significant wave height, Tp—significant wave period, P max —maximum wave pressure, D—the block thickness.

