An Integrated Coastal Sediment Management Plan: The Example of the Tuscany Region (Italy)


Abstract
:1. Introduction
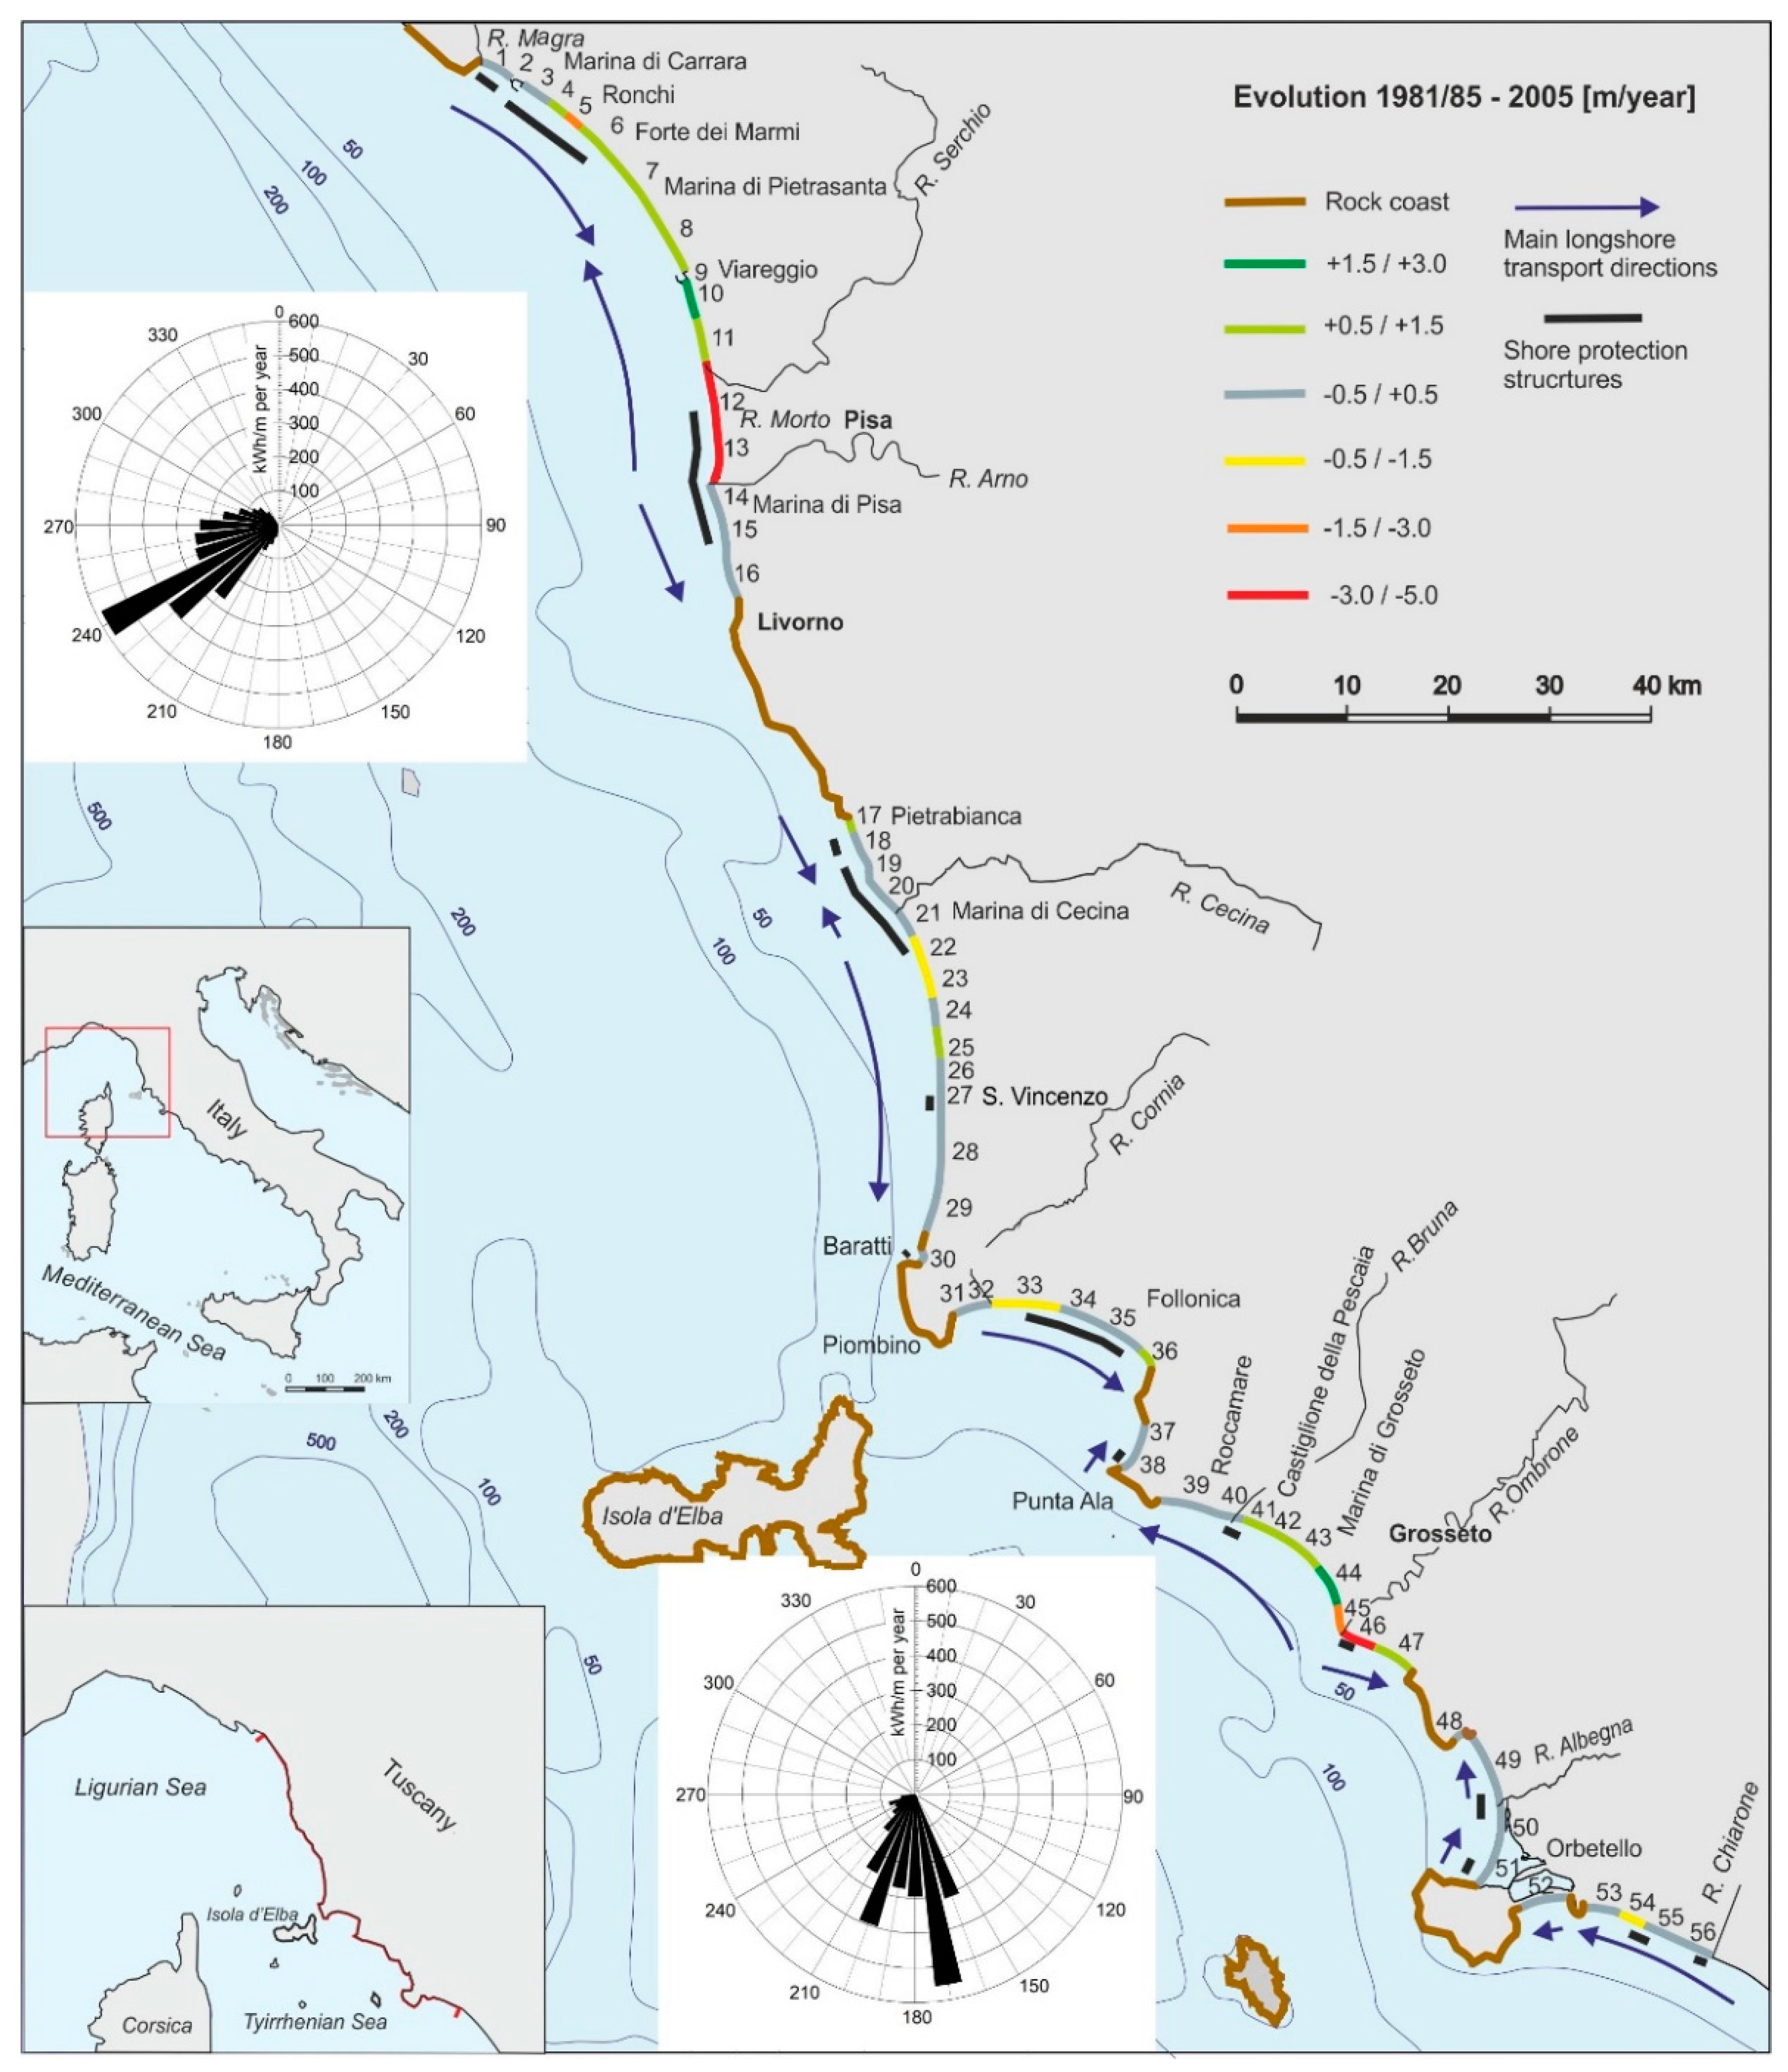
2. Study Area
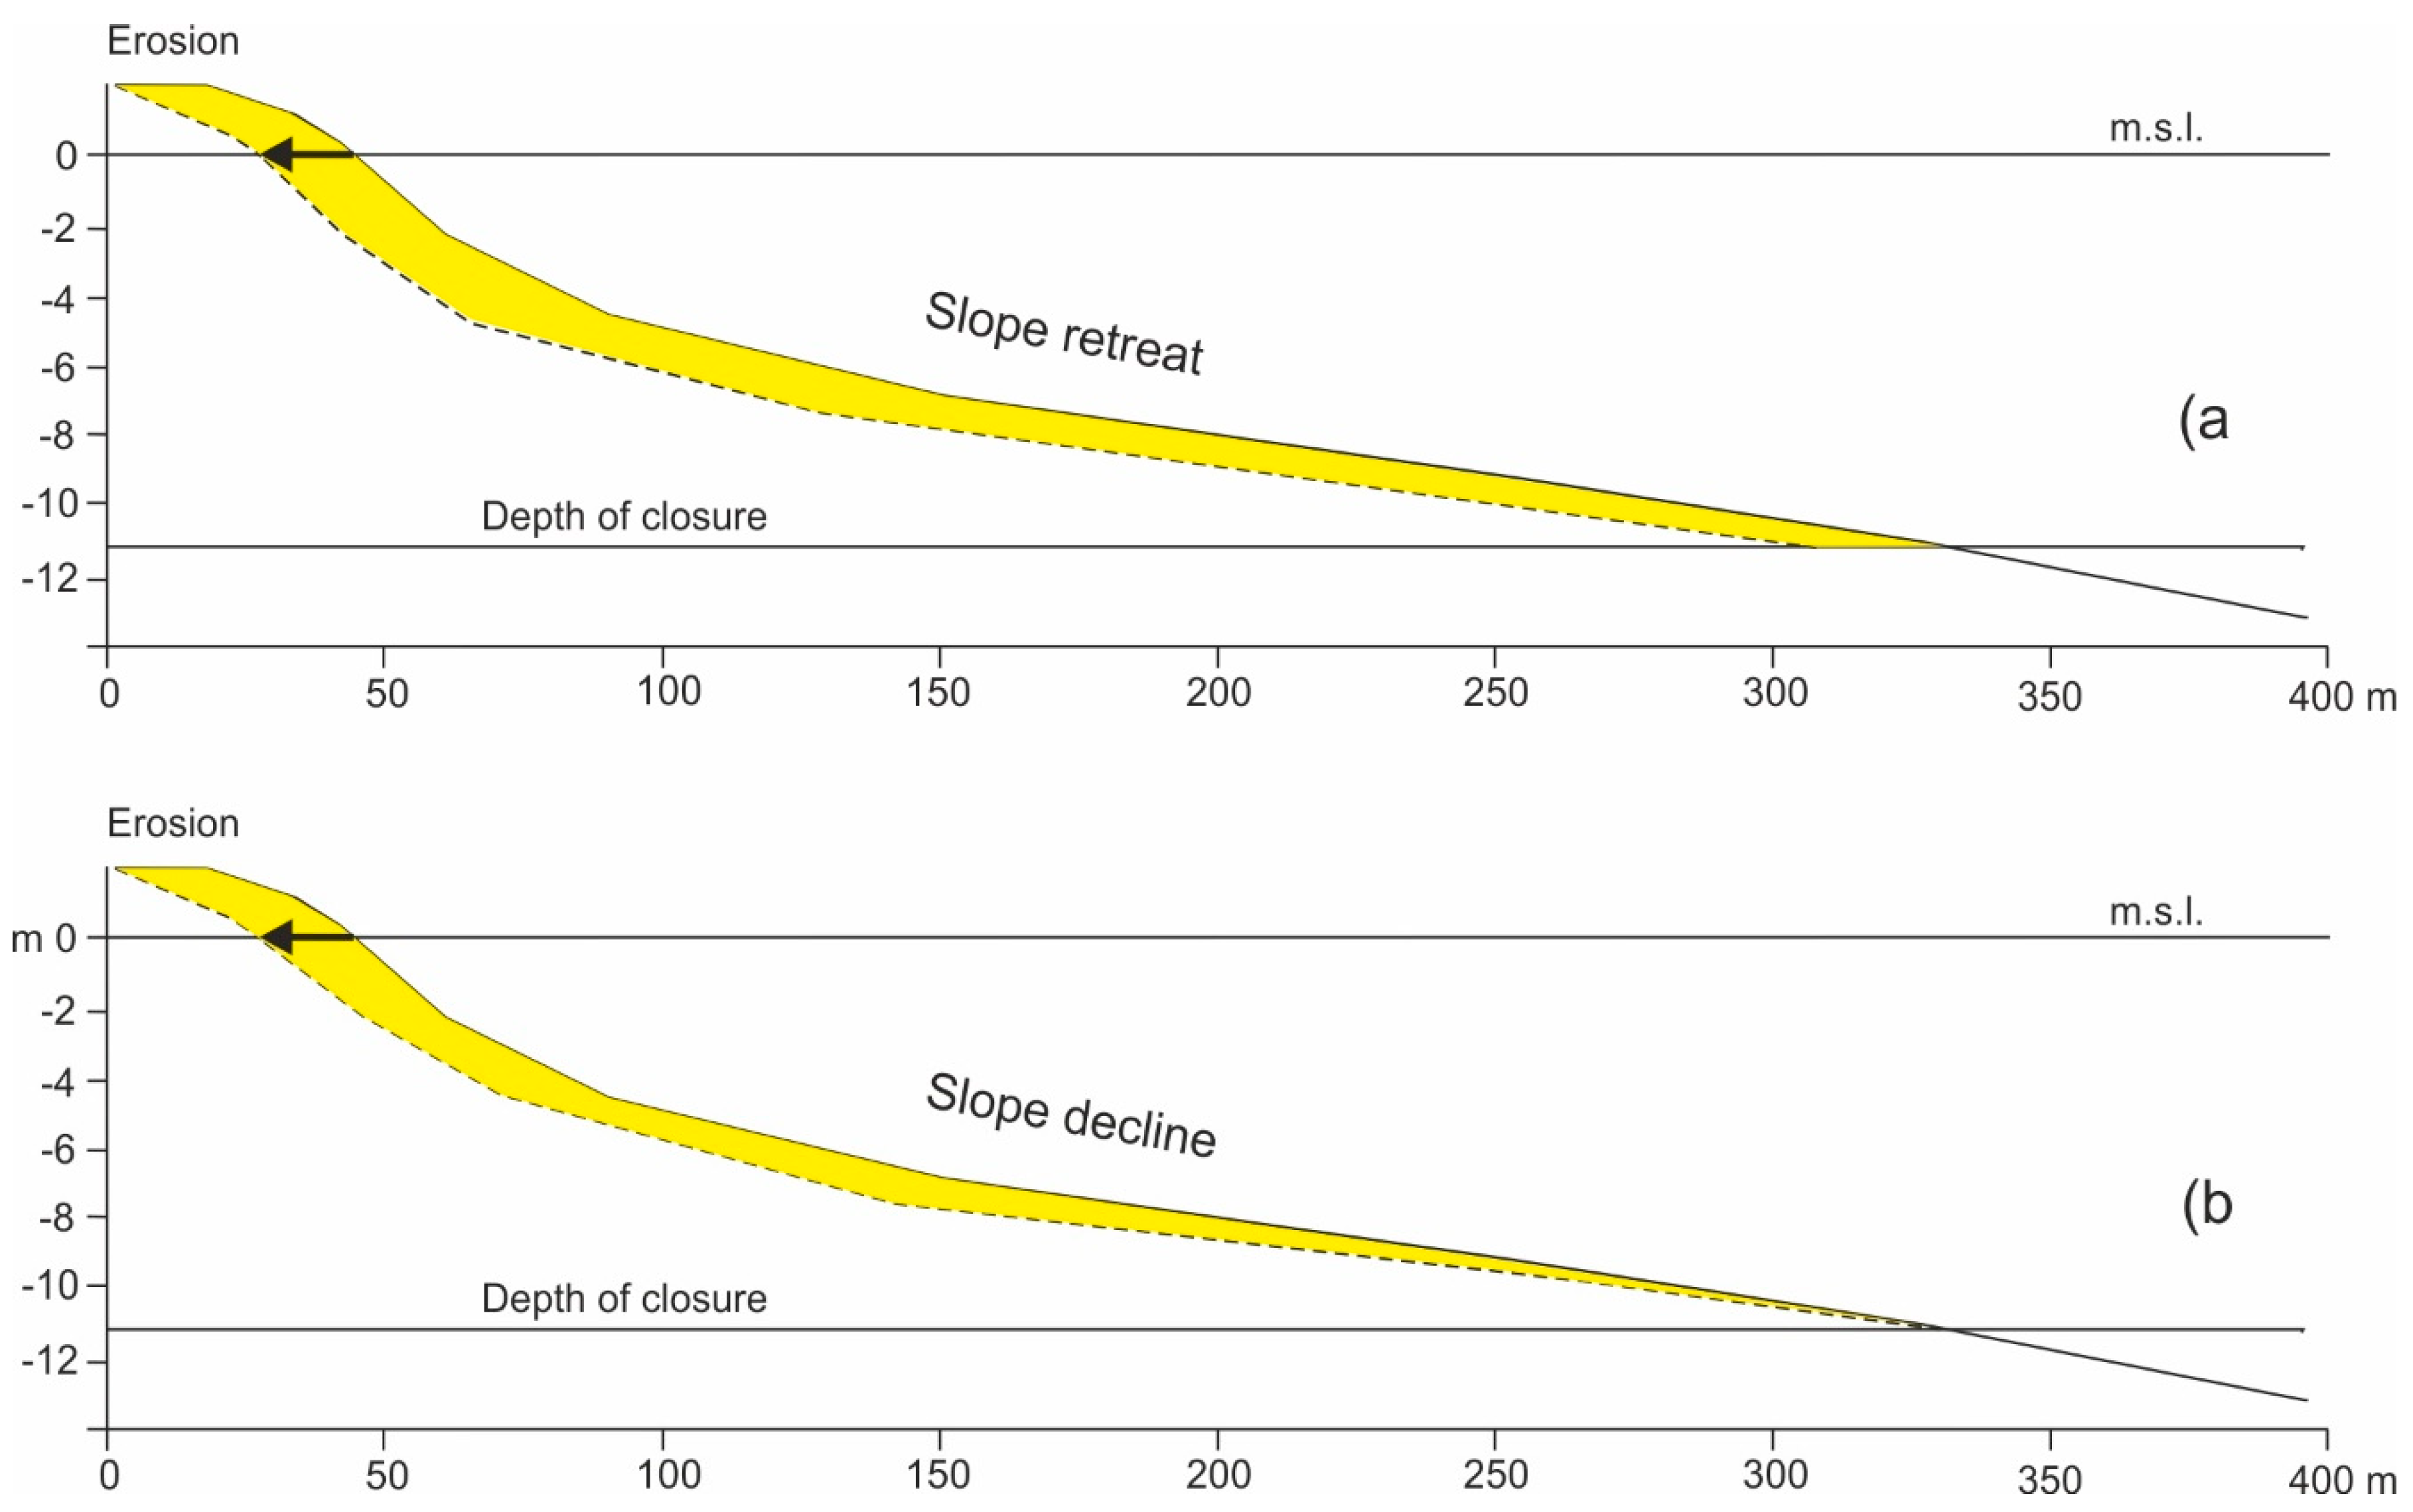
3. Materials and Methods
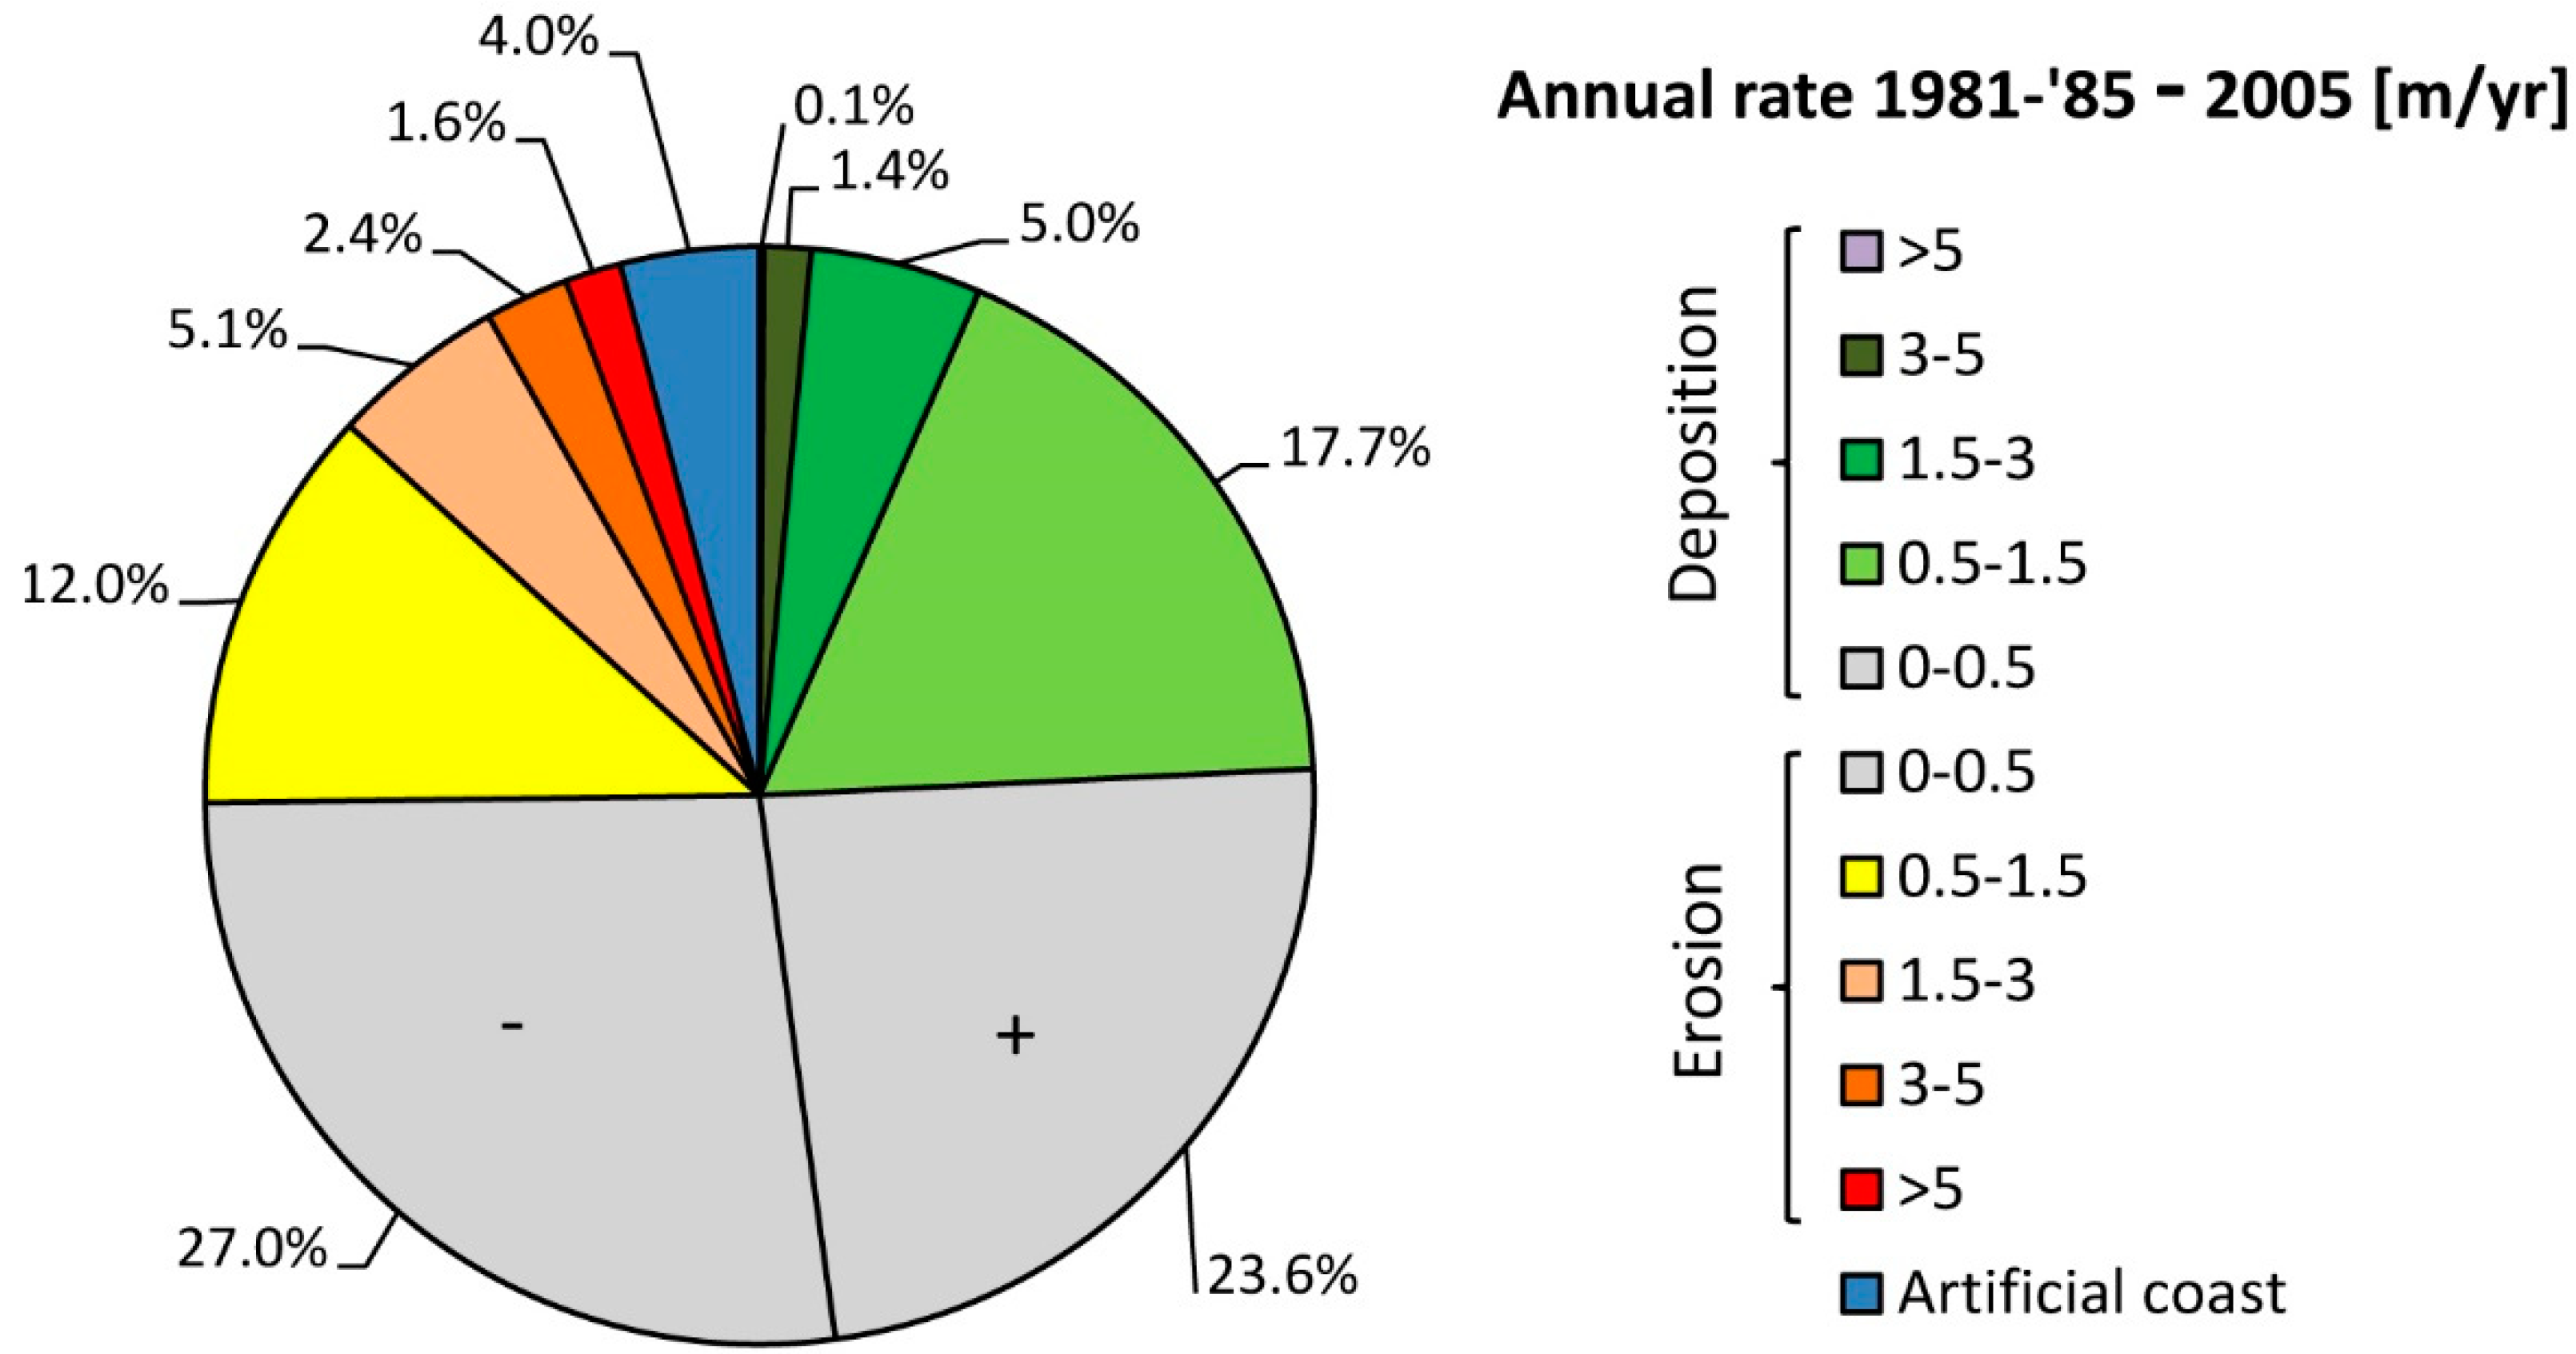
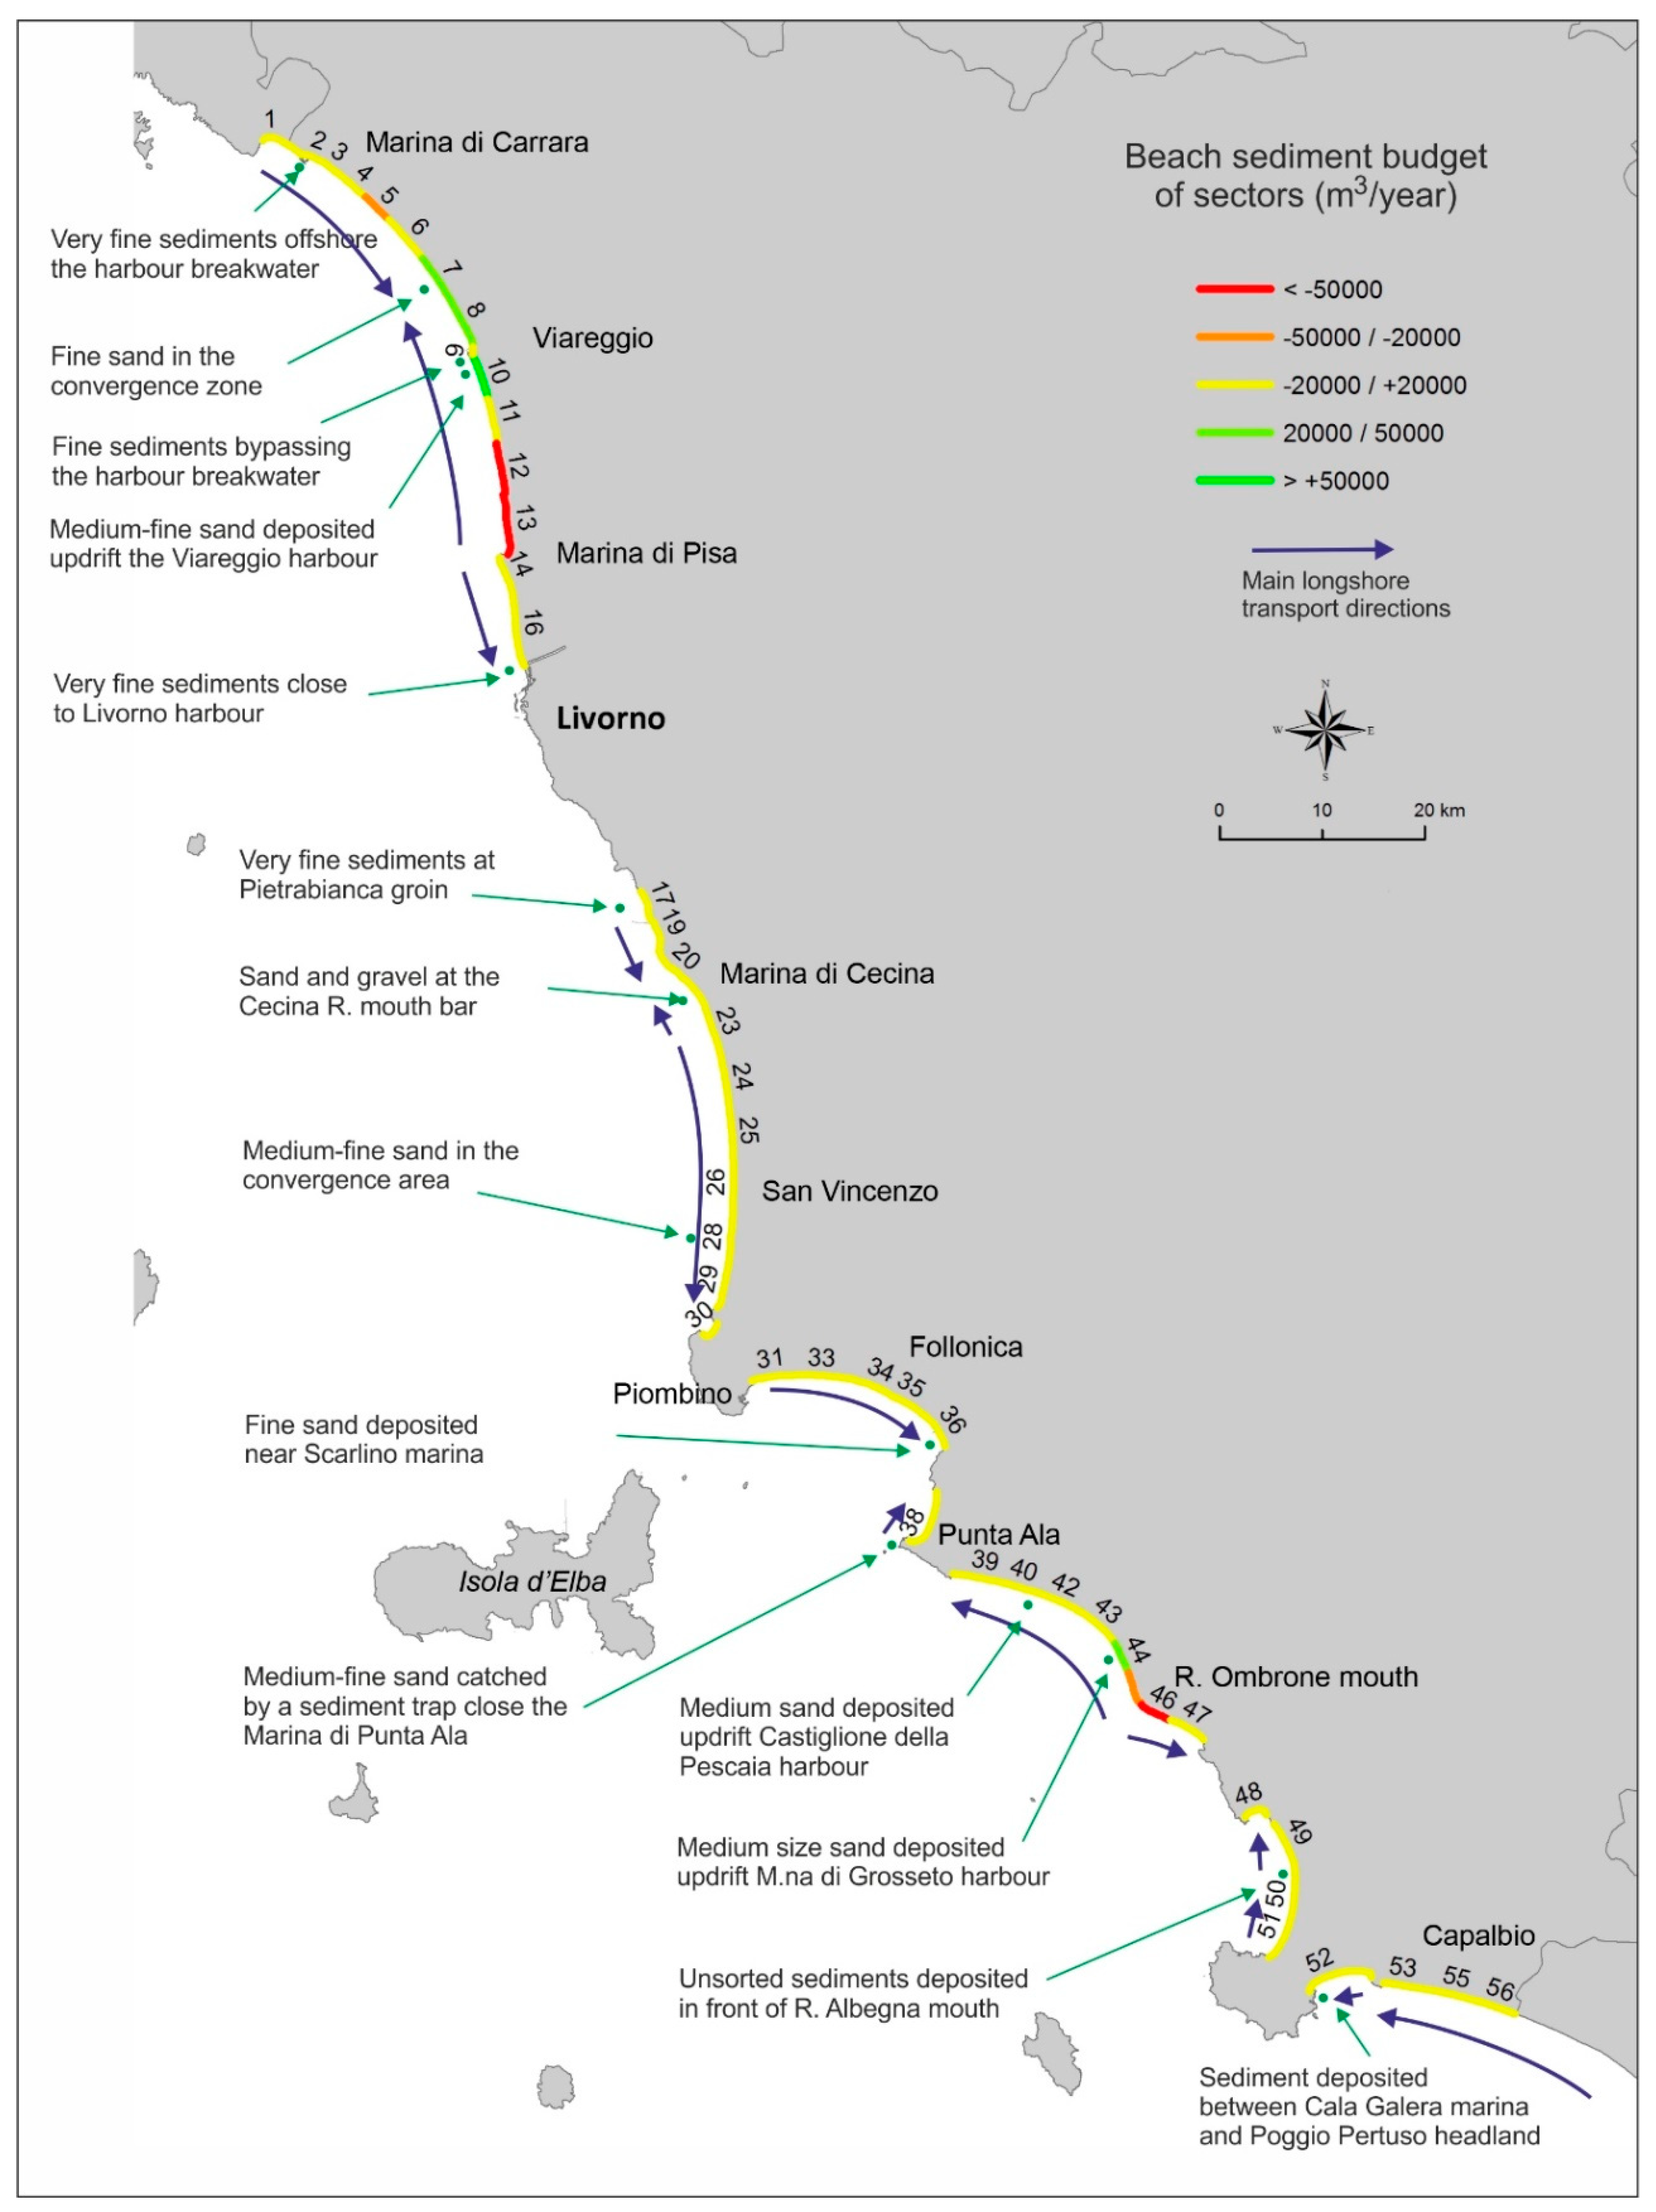
4. Results and Discussion
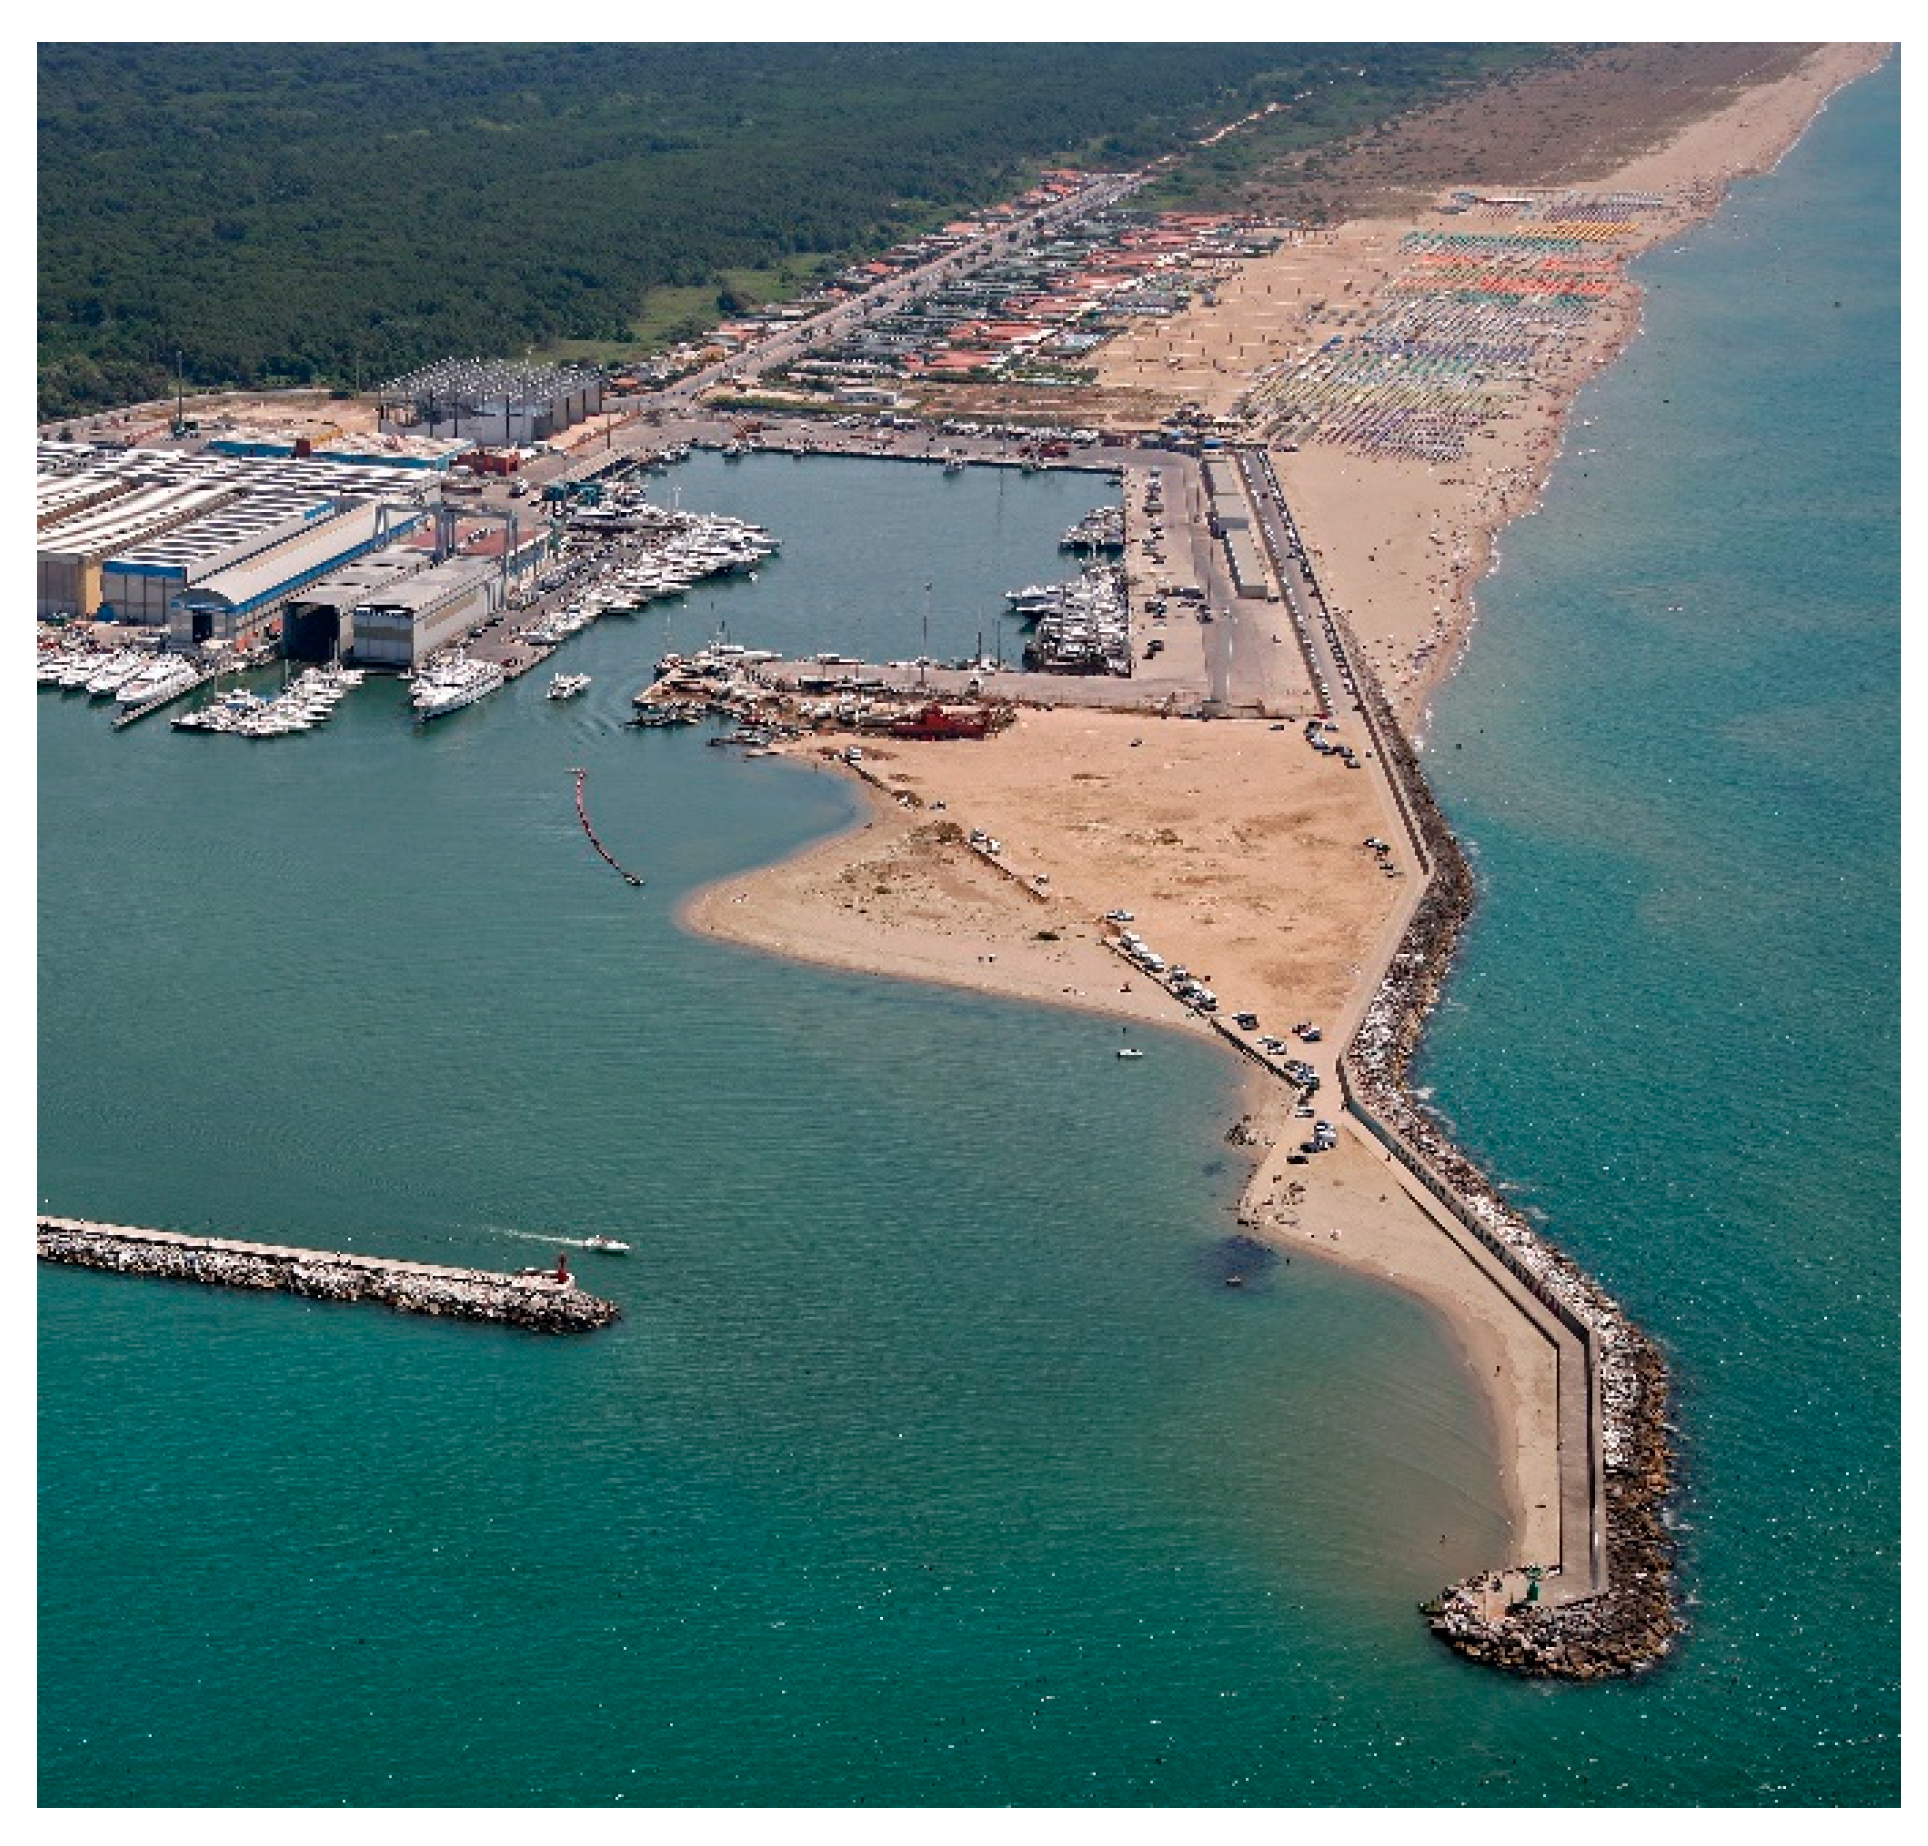
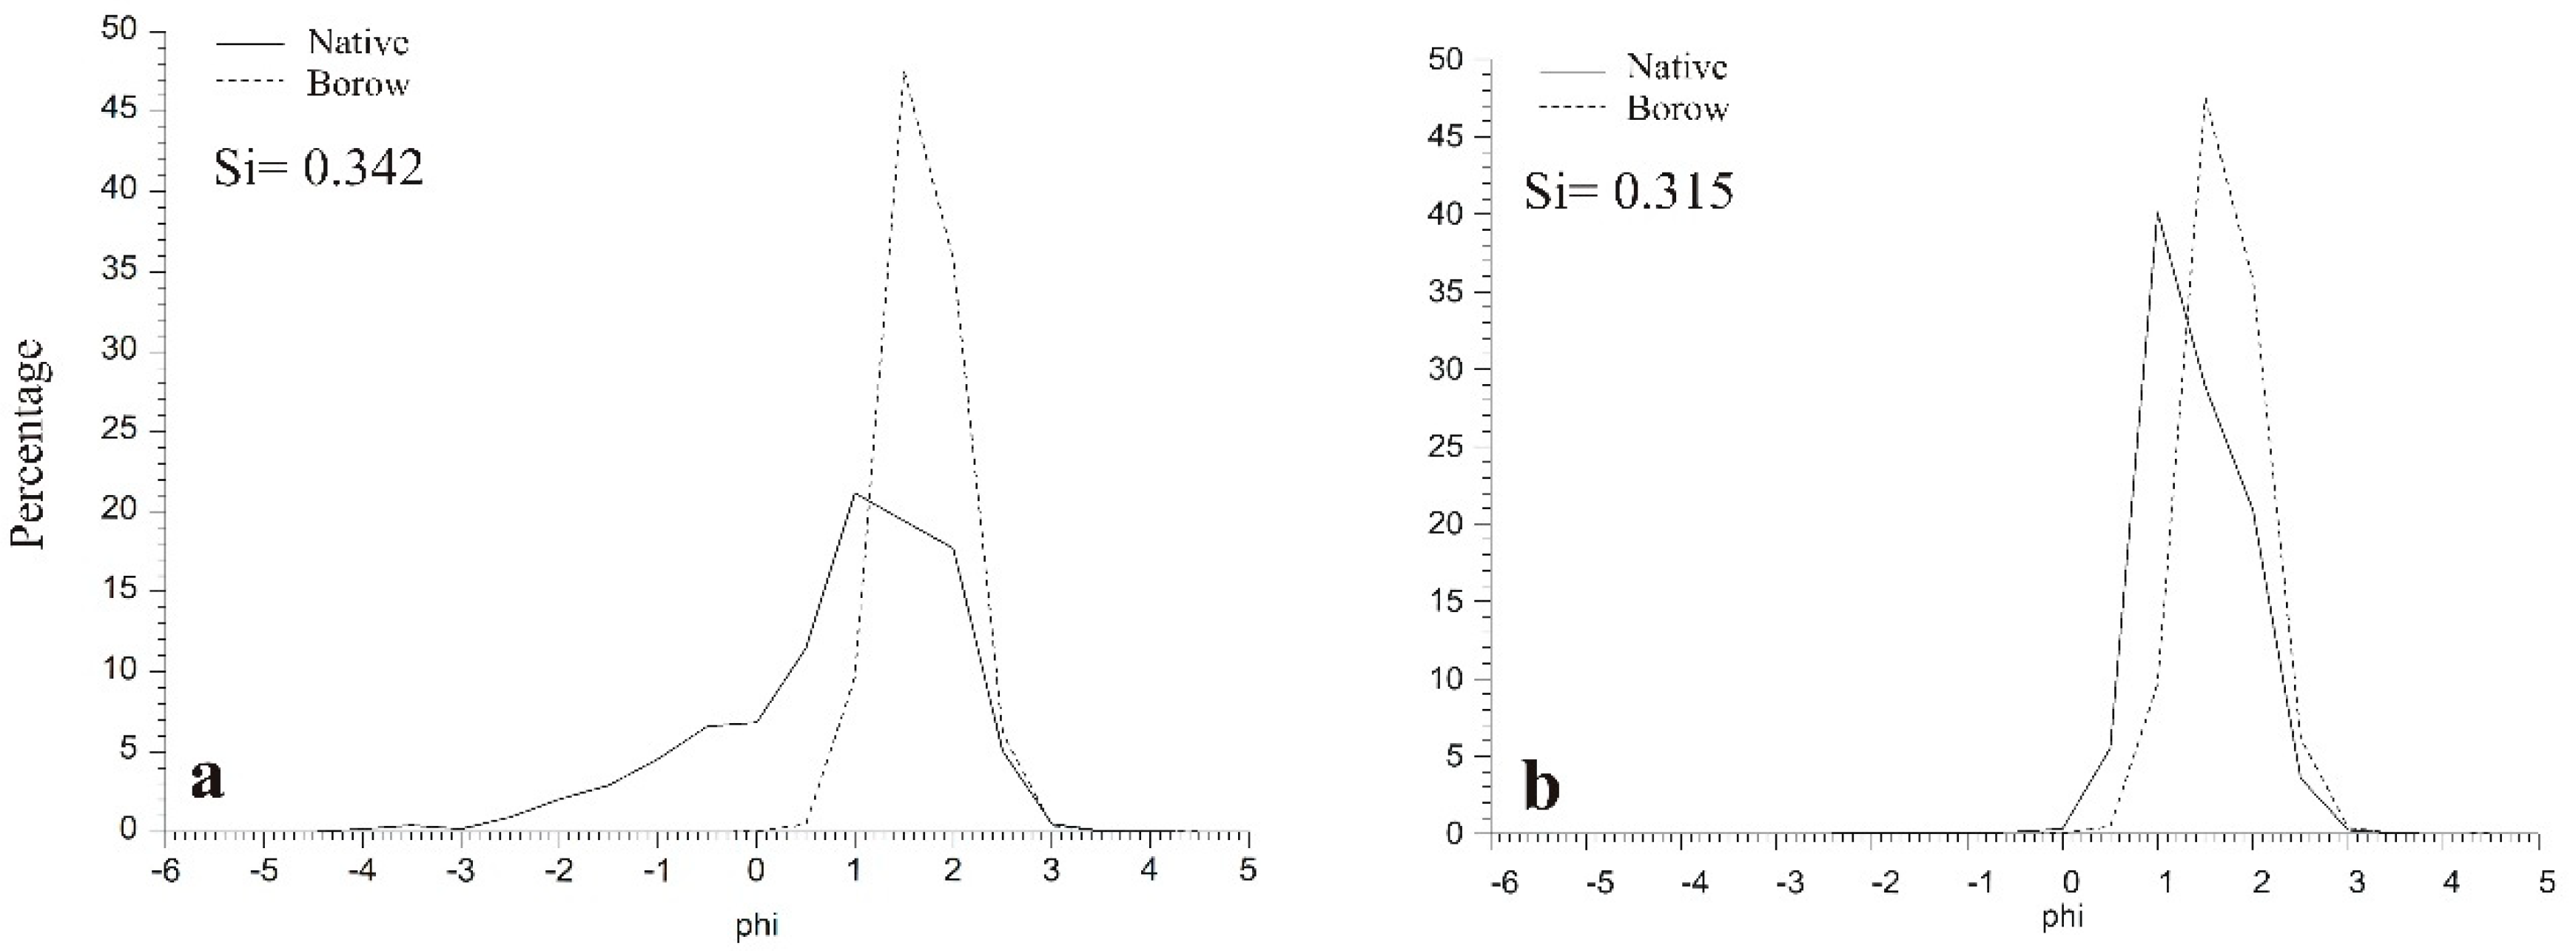
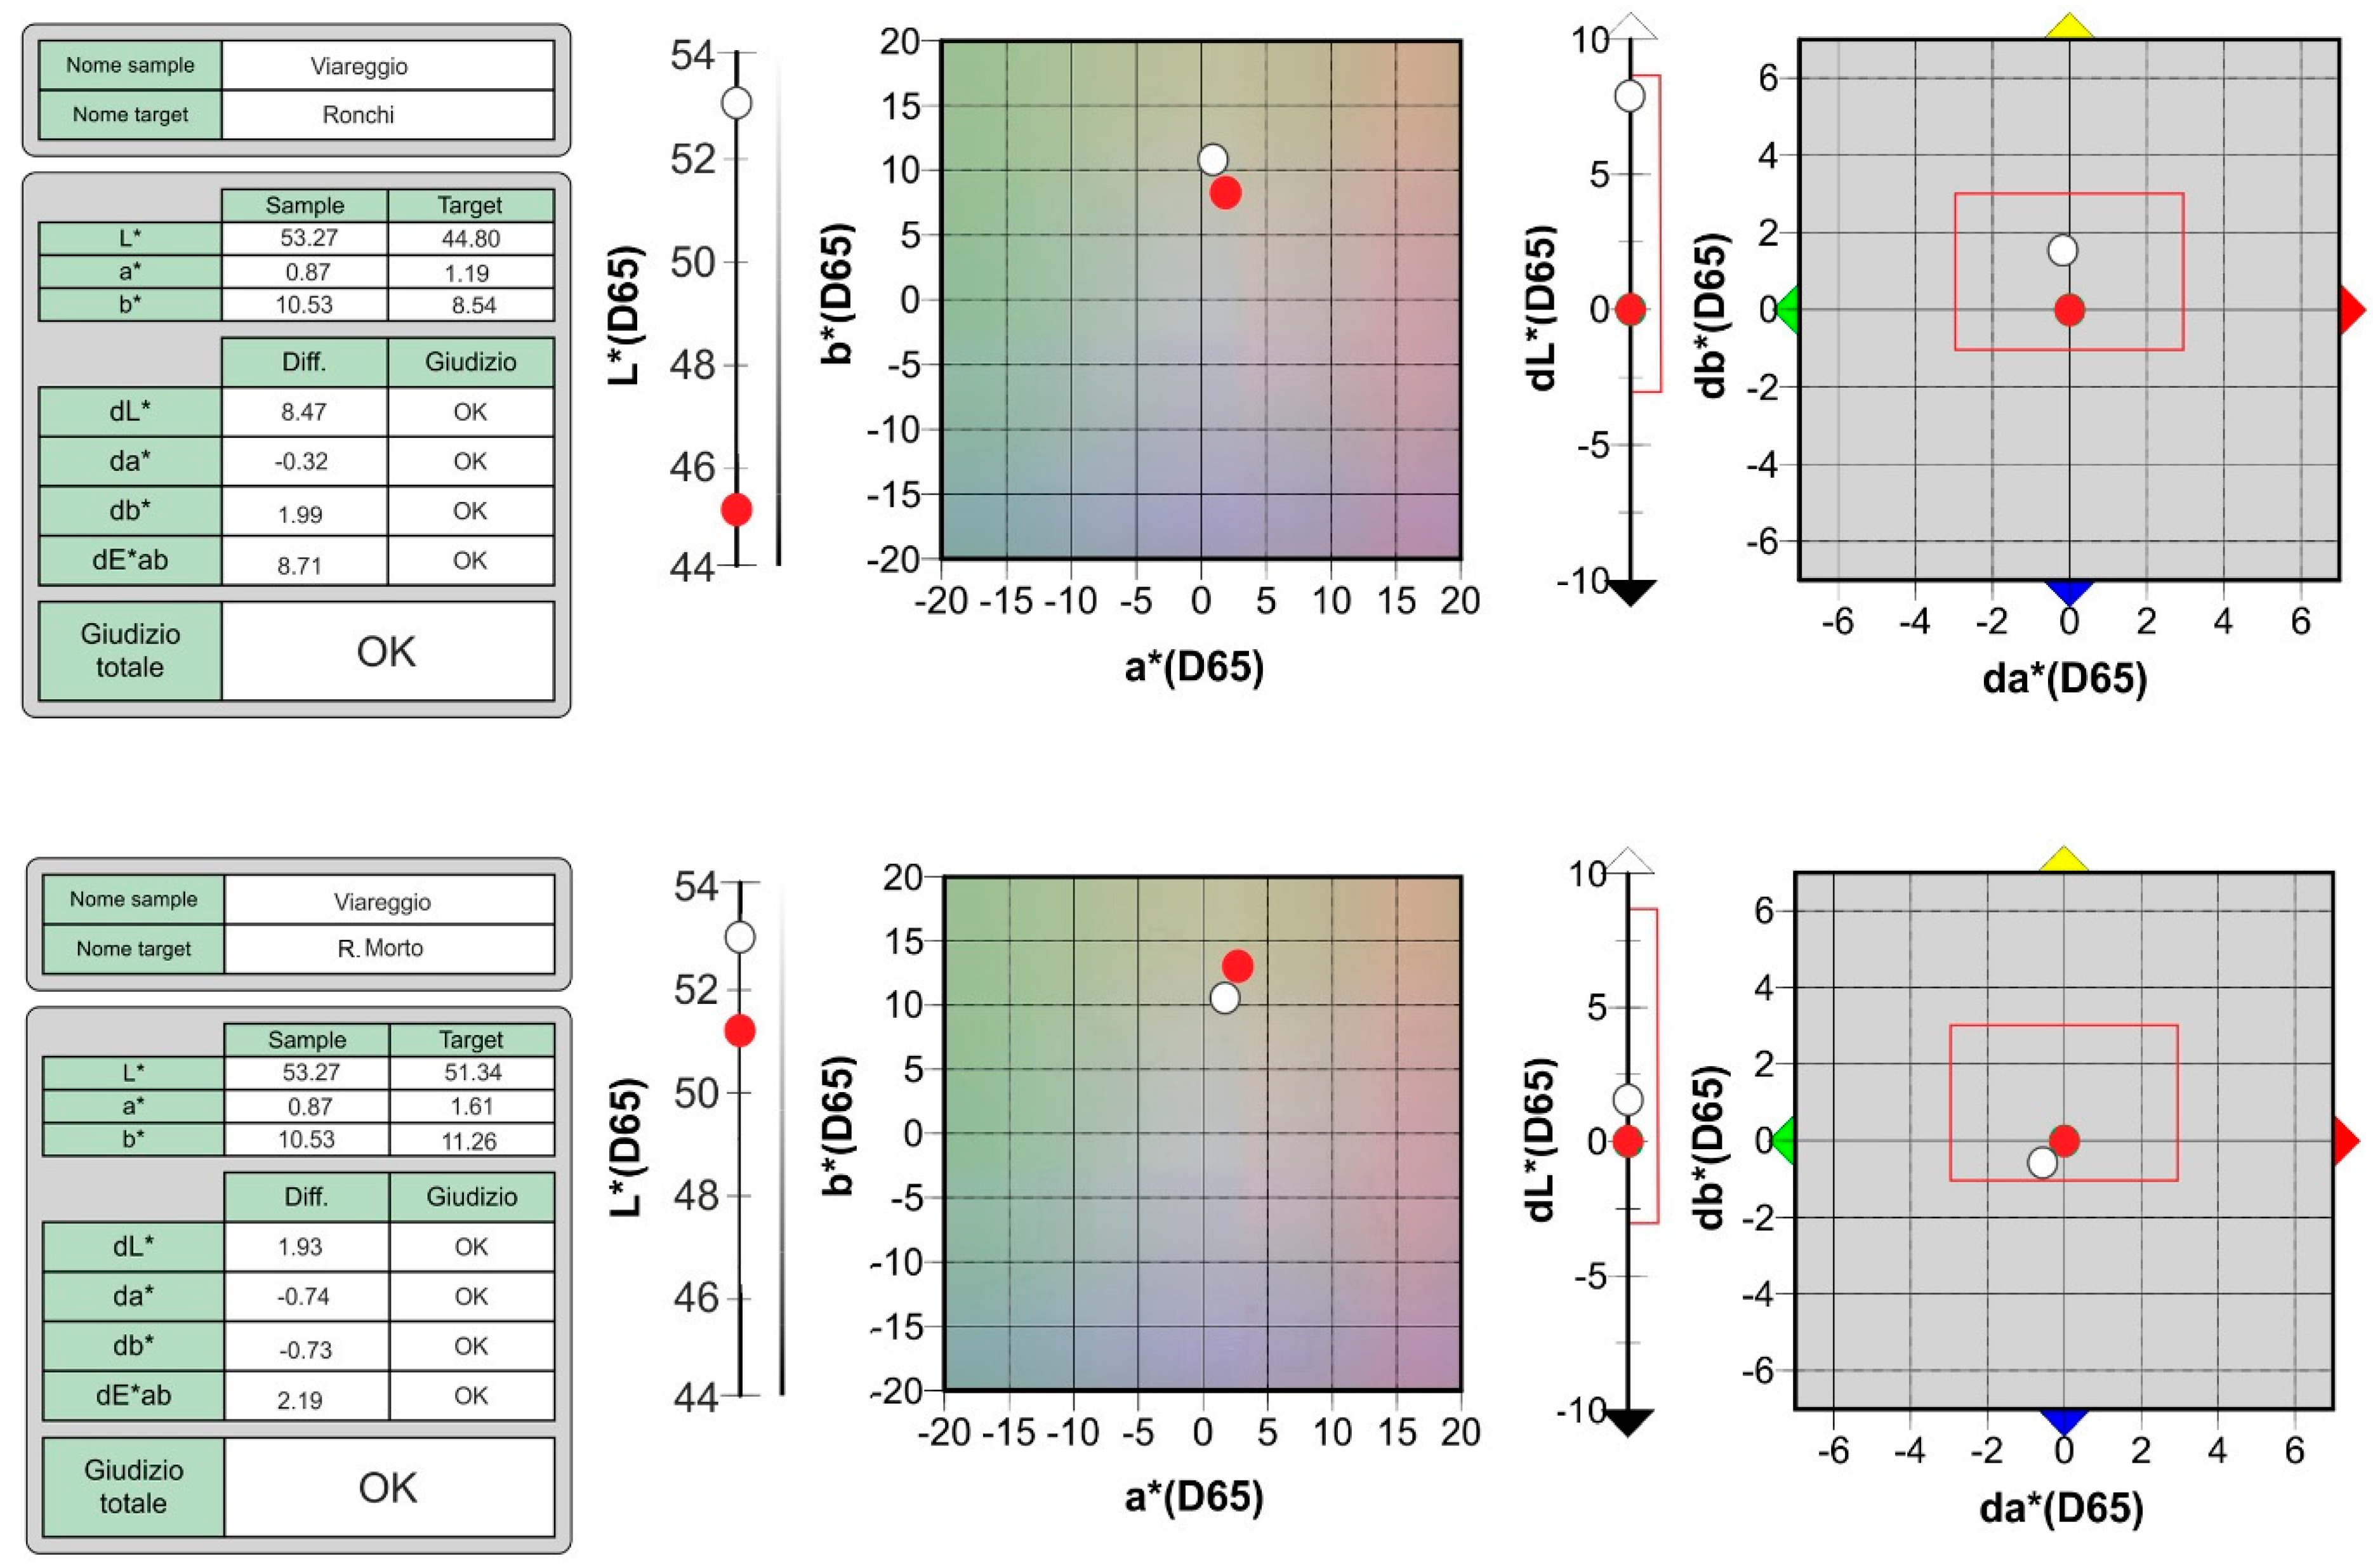
4.1. The Beach Updrift of Viareggio Harbour (Sector 10)
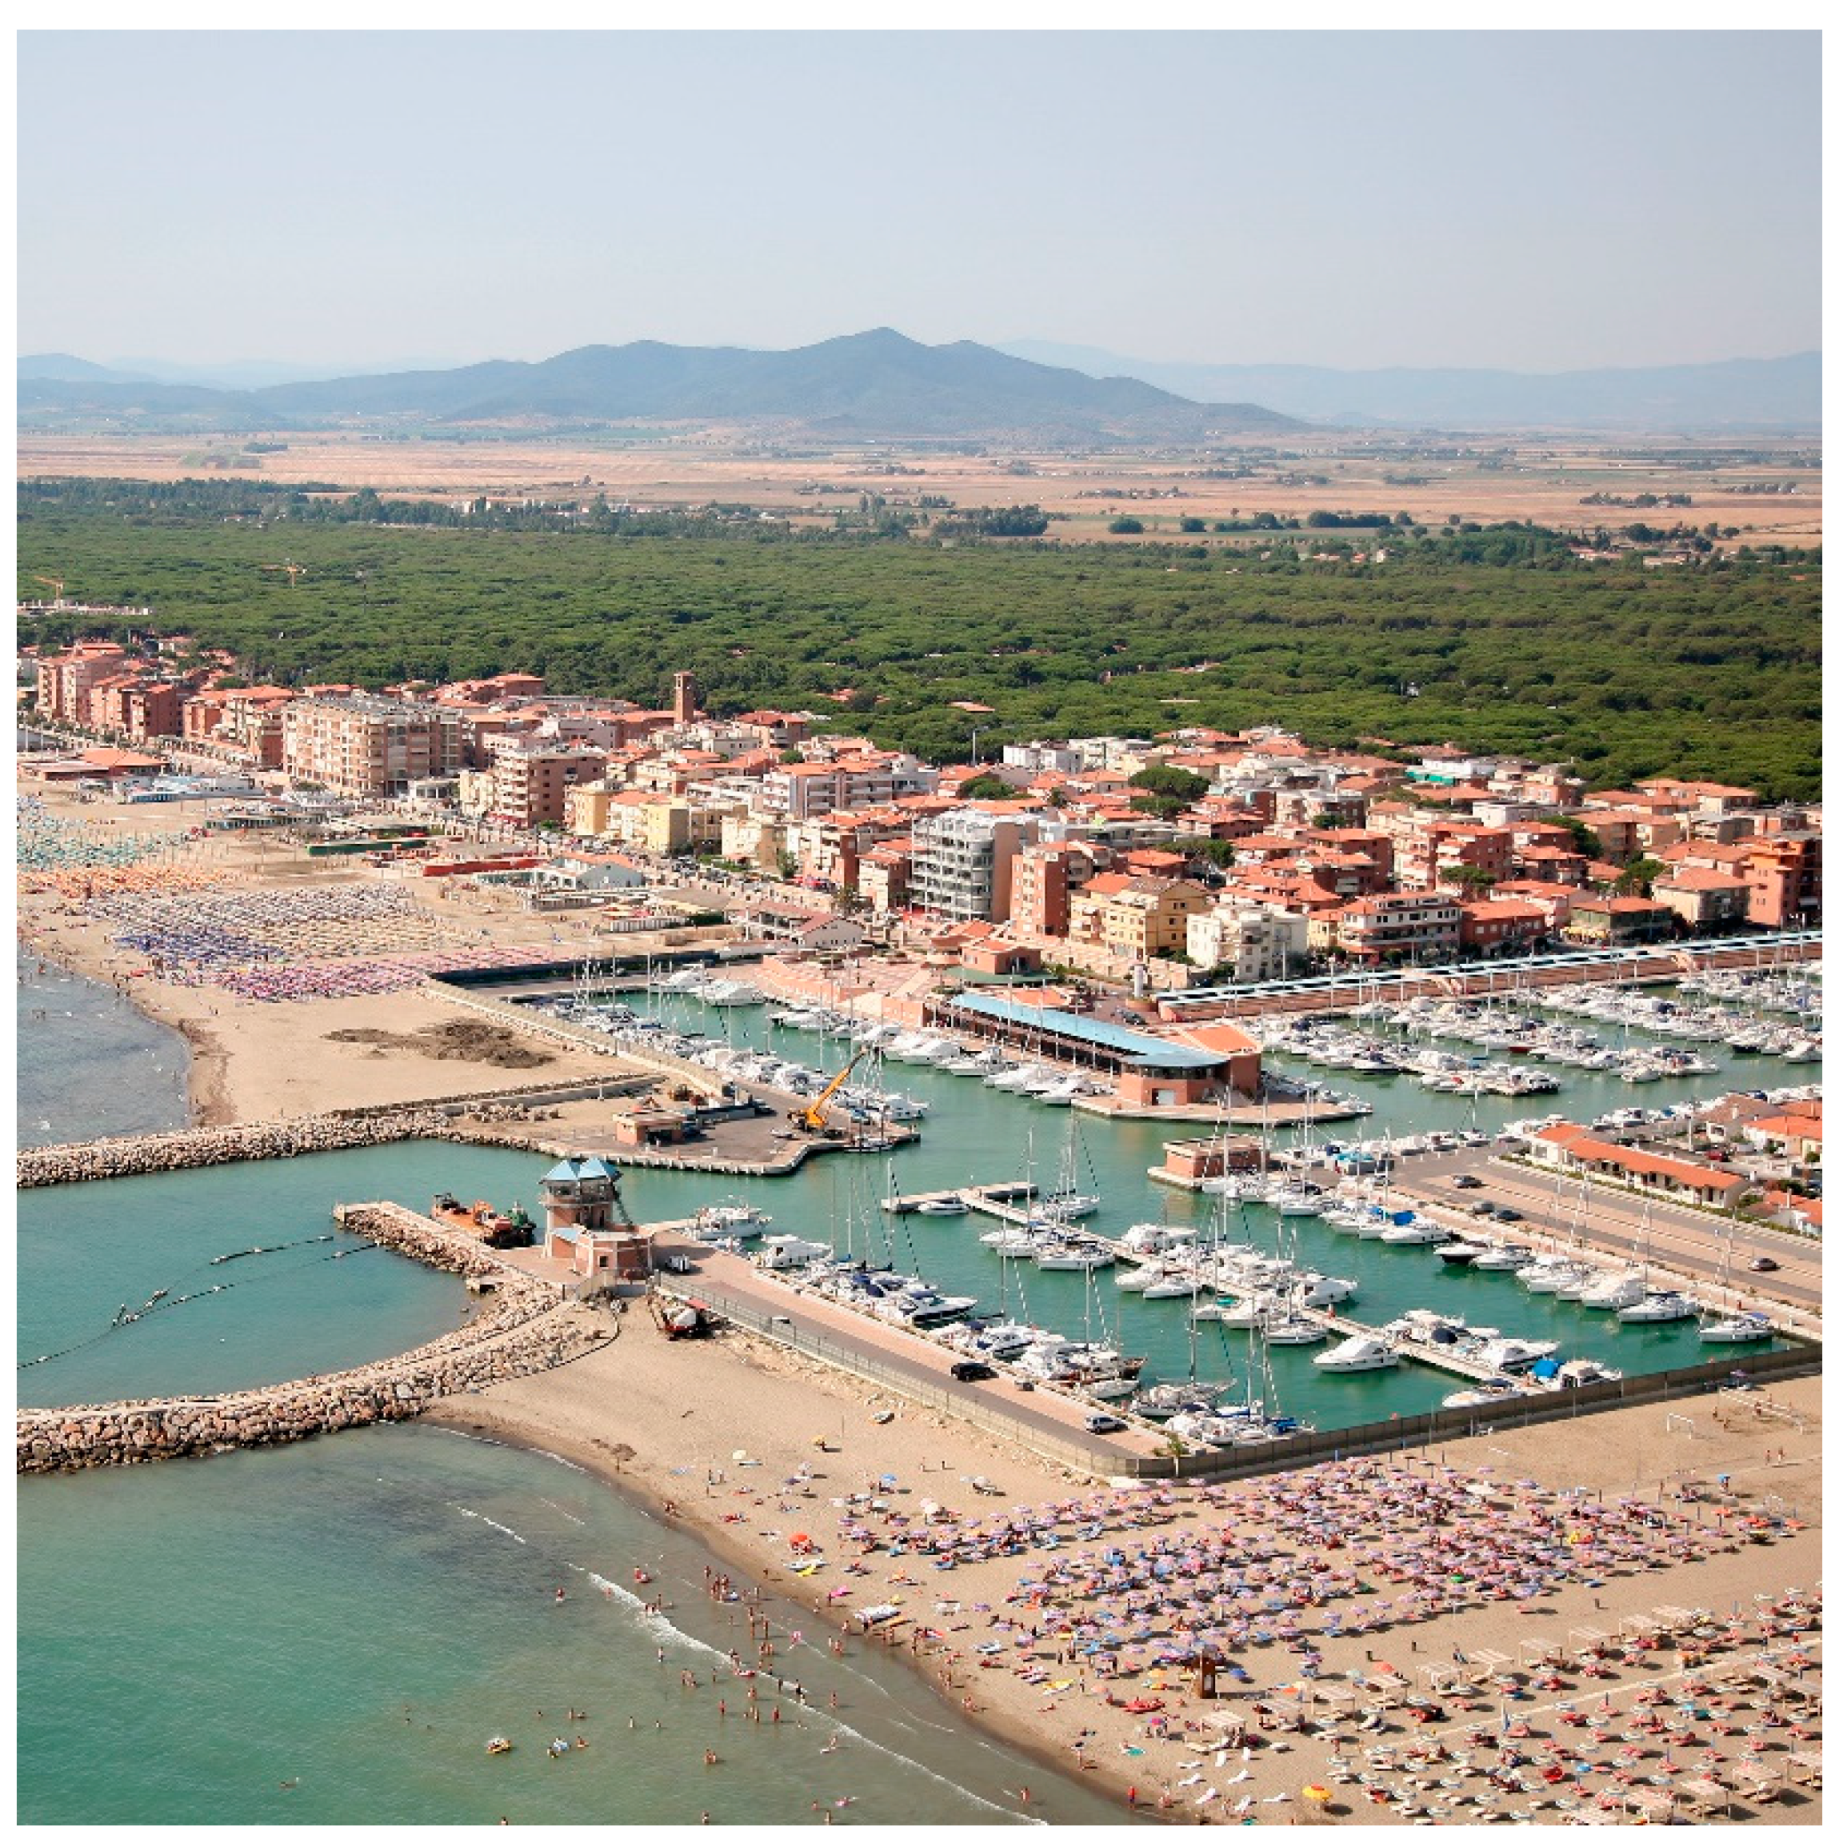
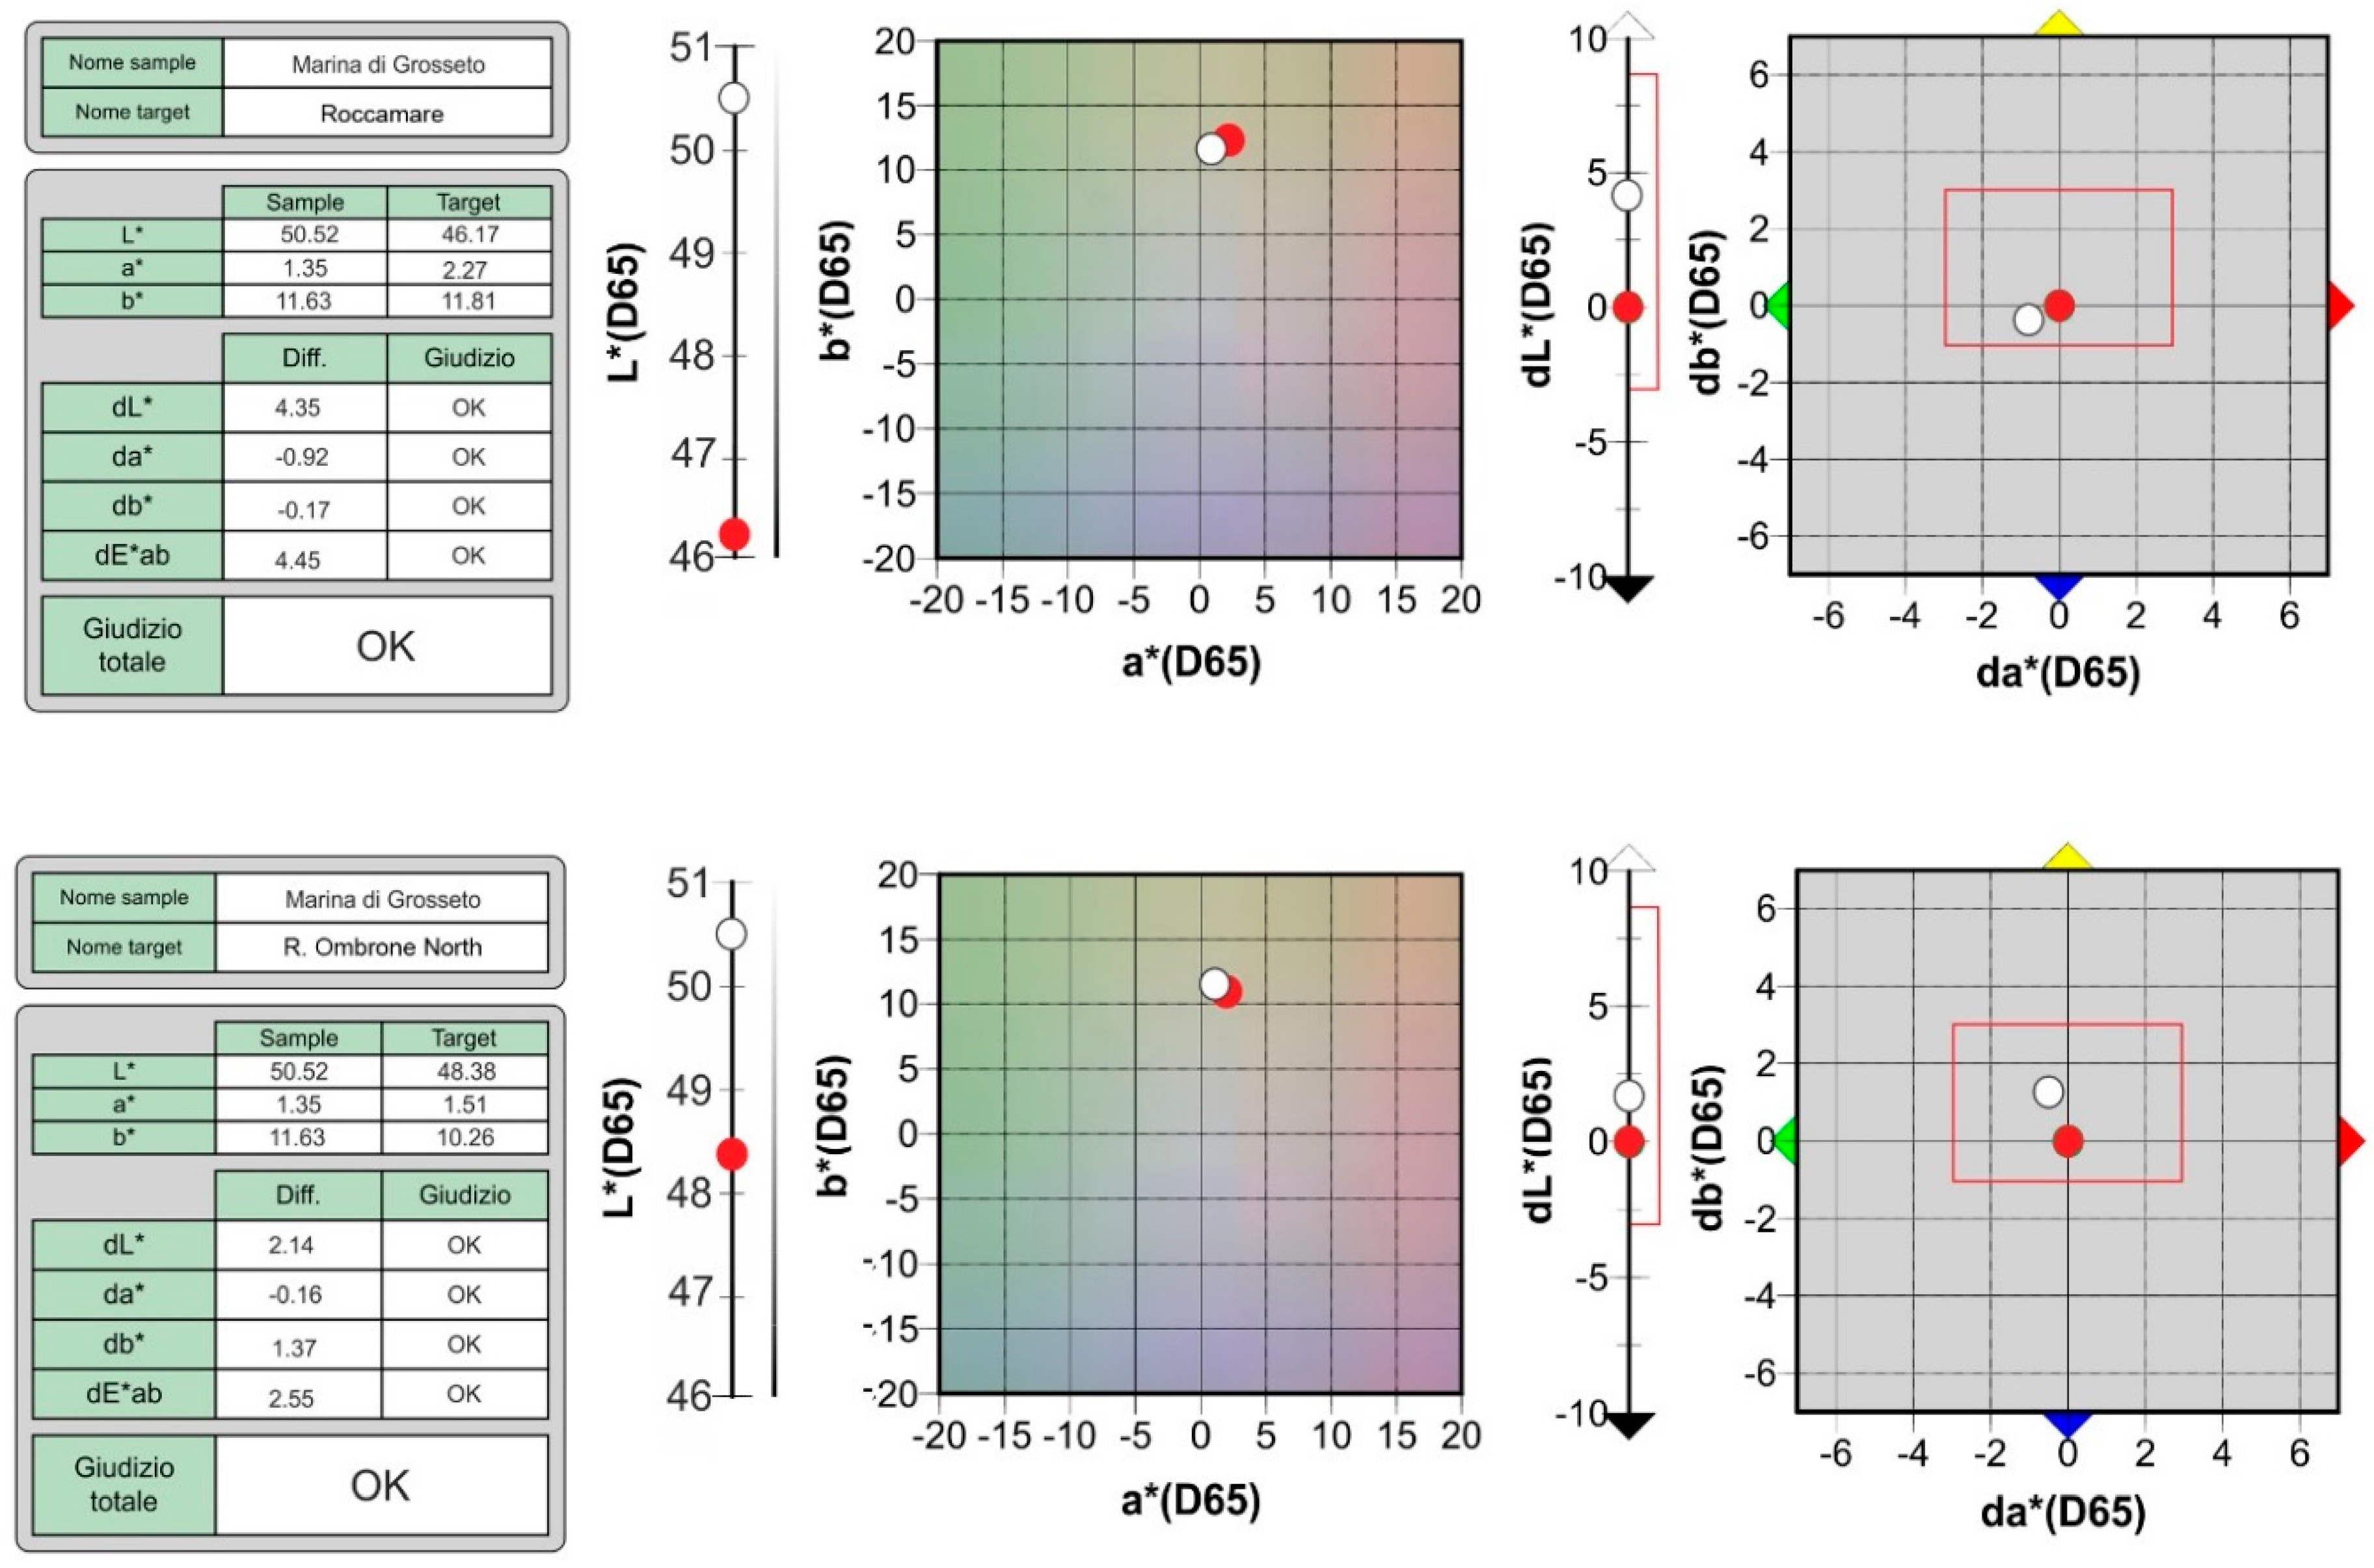
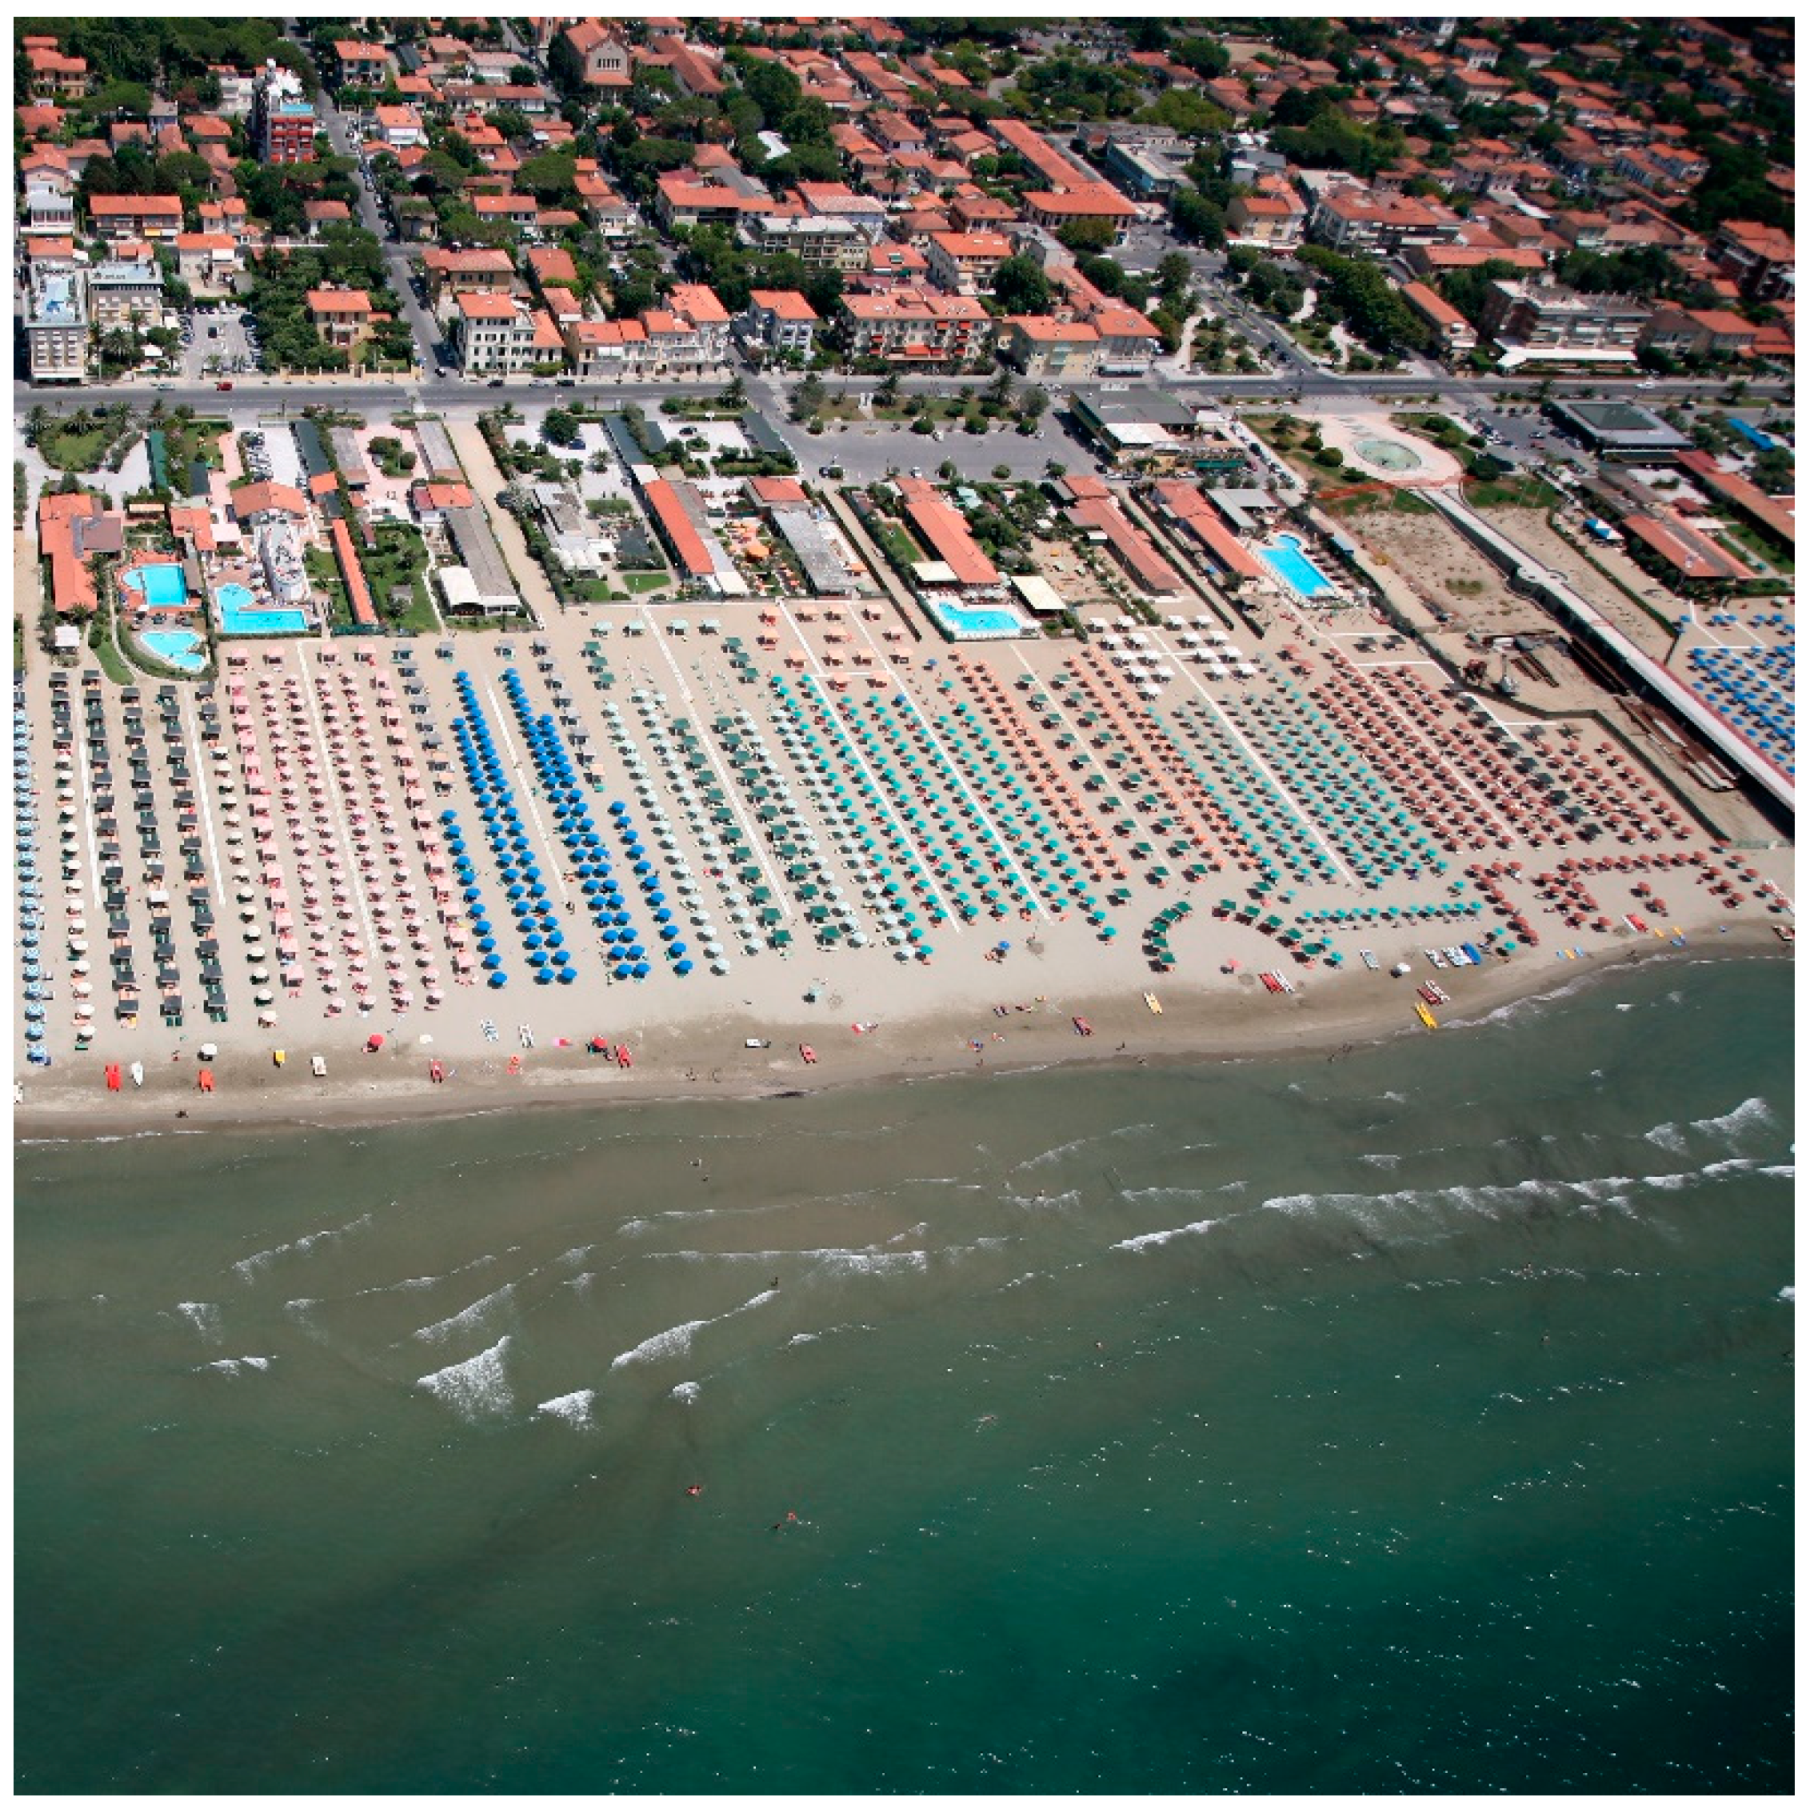
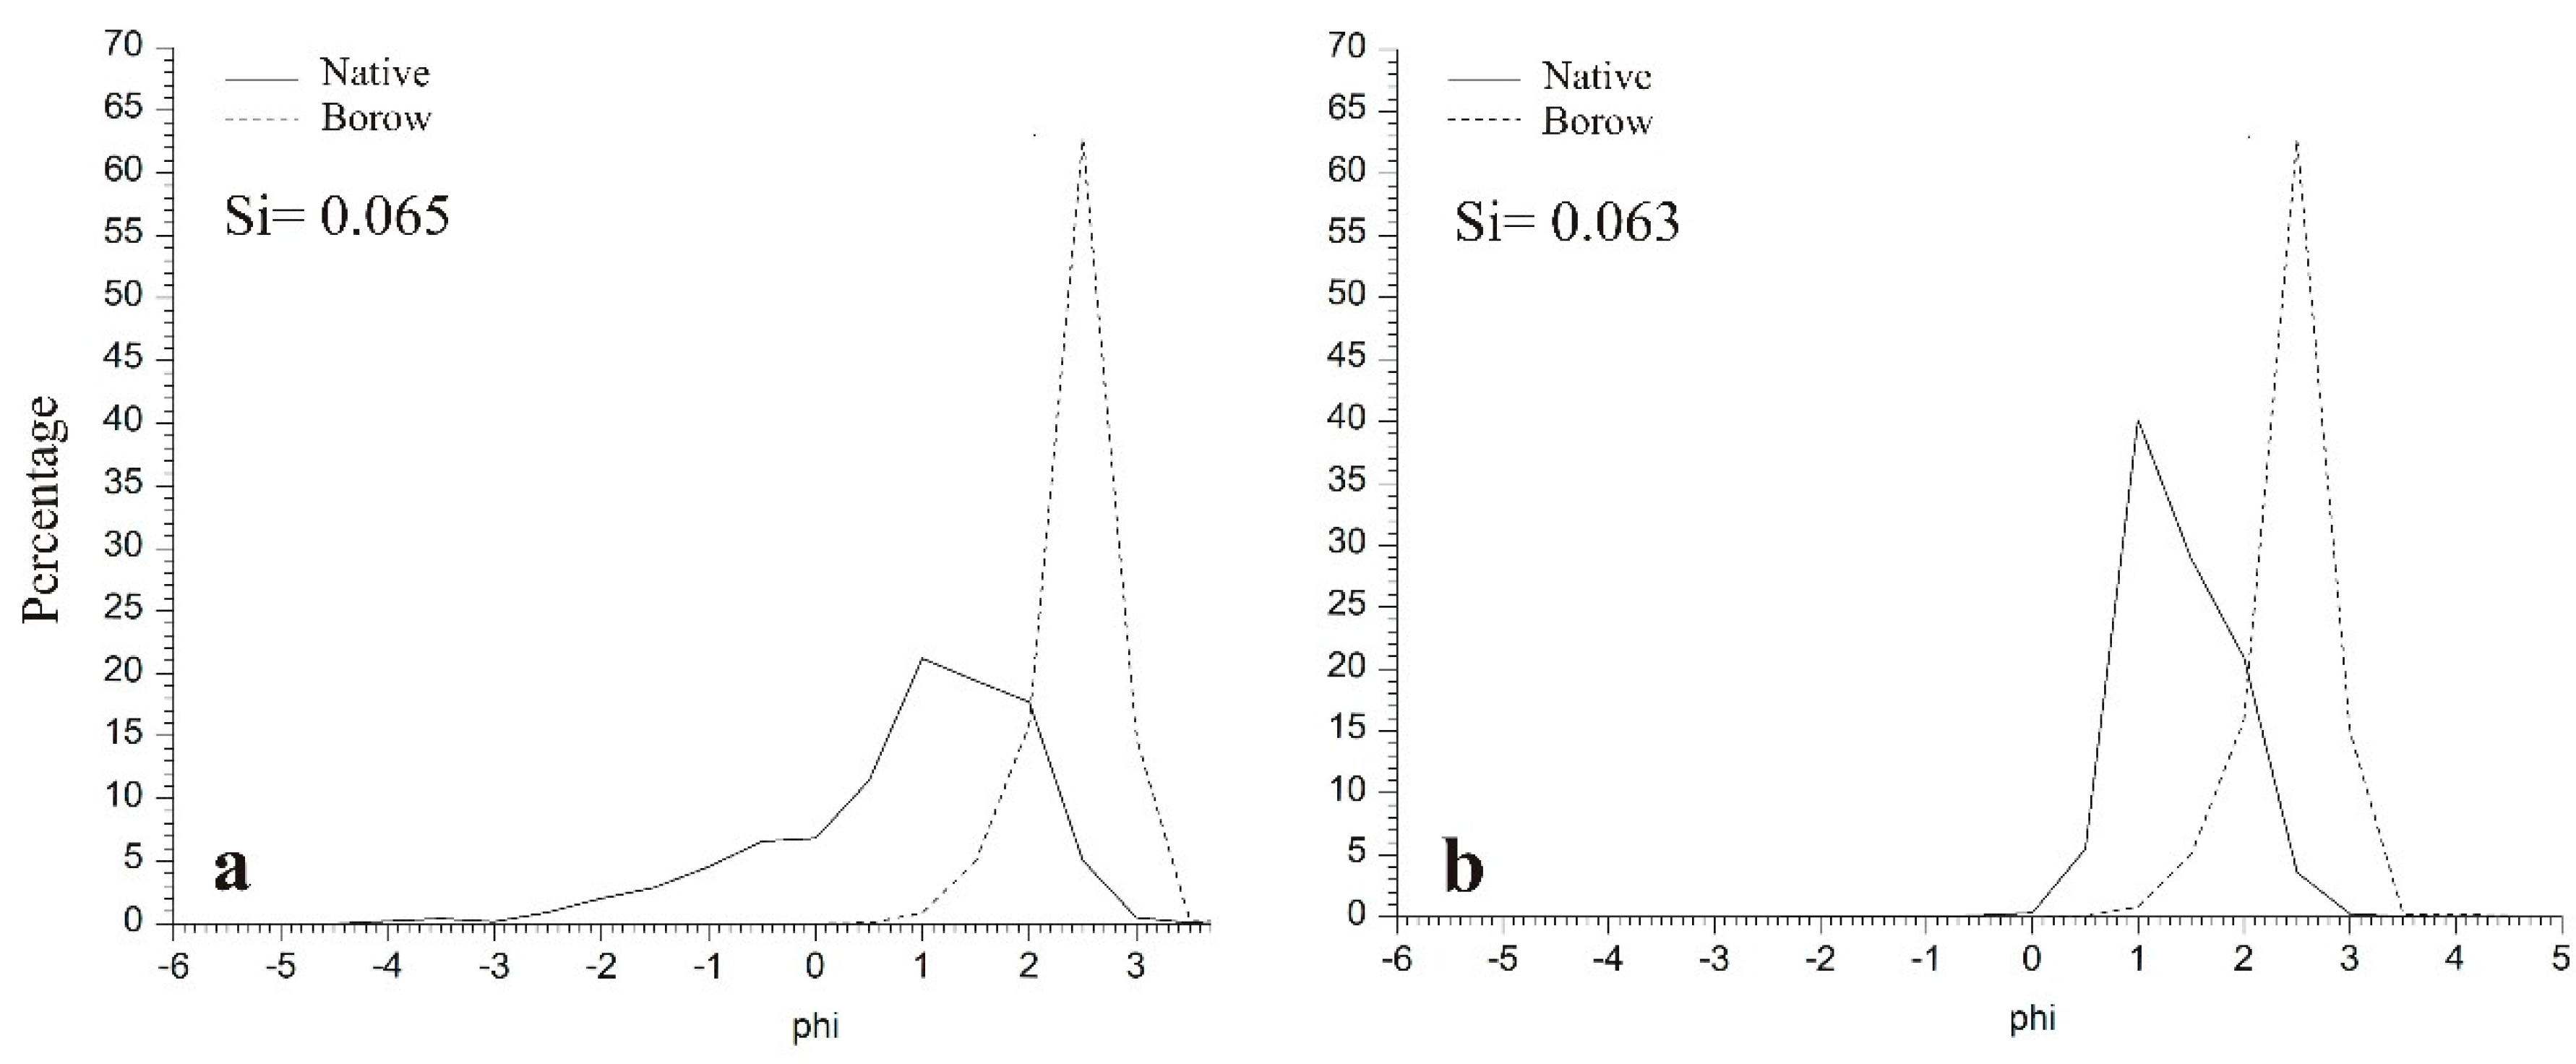
4.2. Marina di Grosseto (Sector 44)
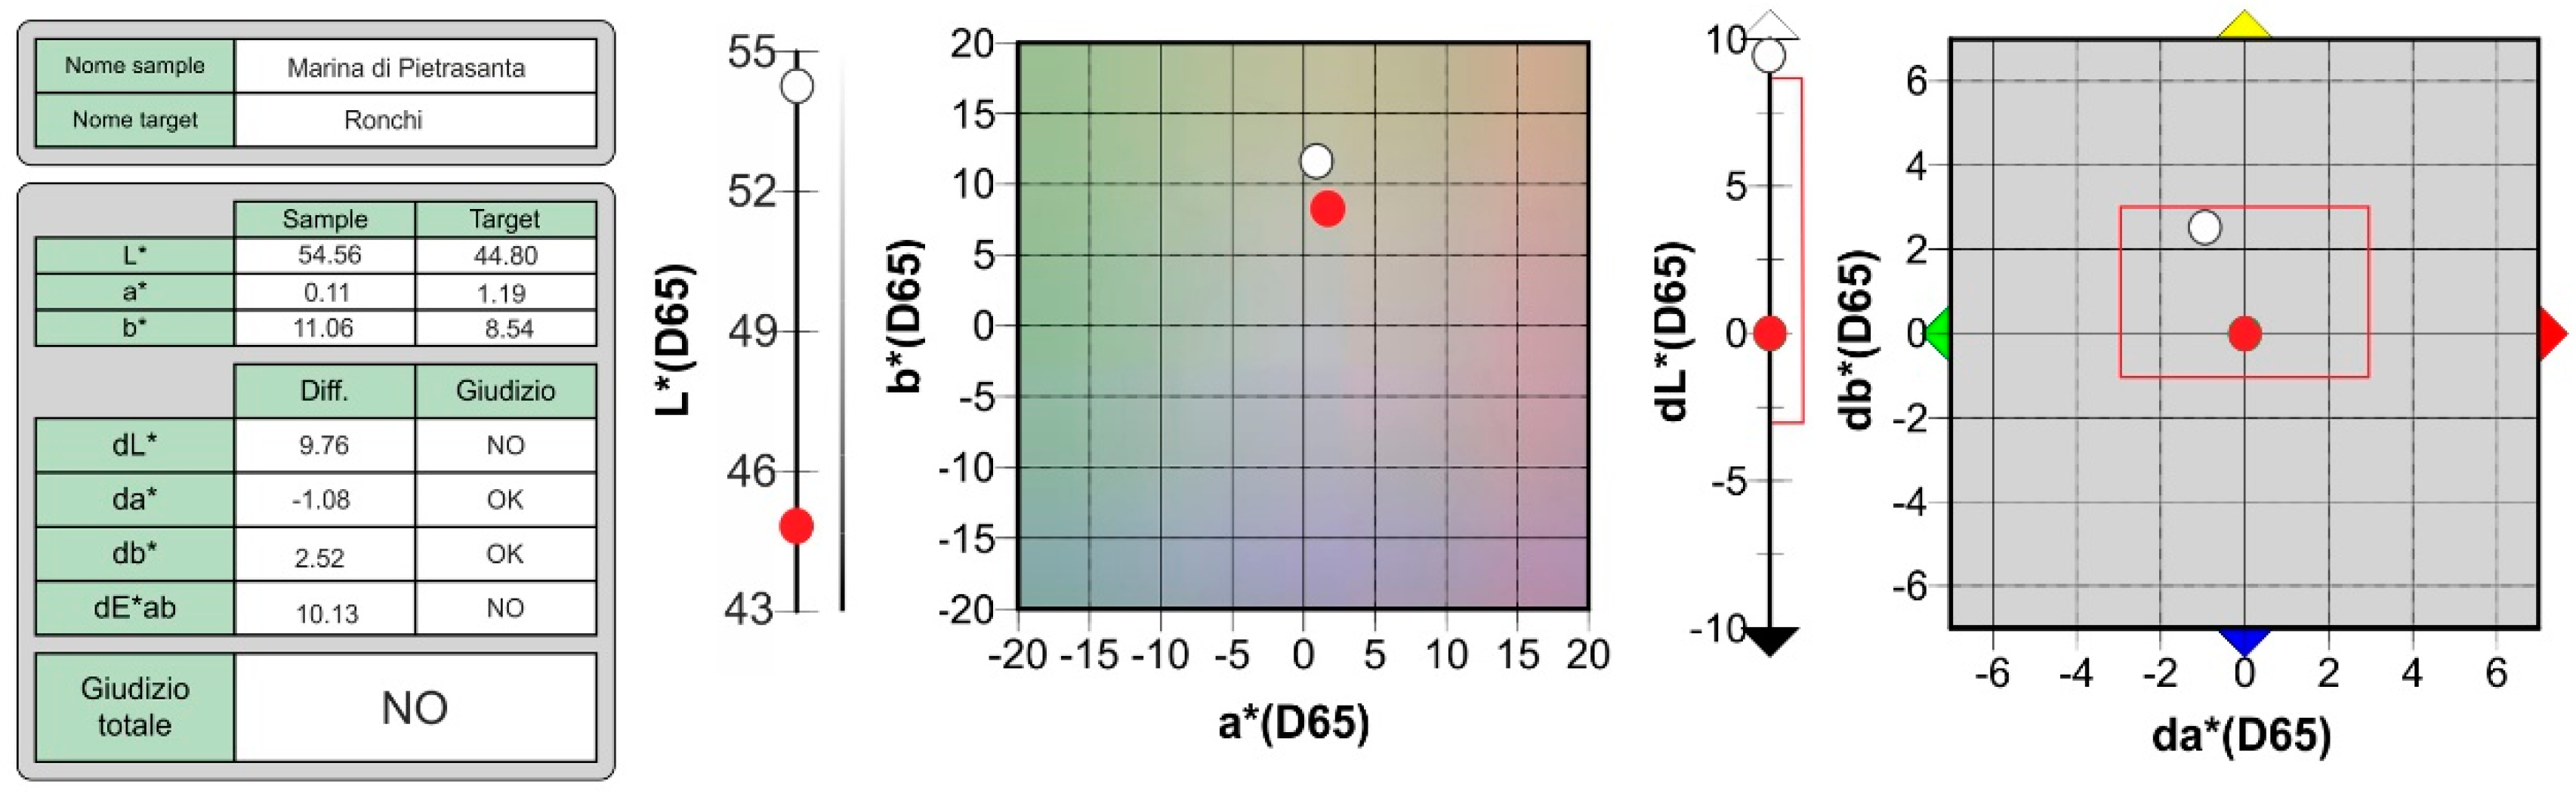
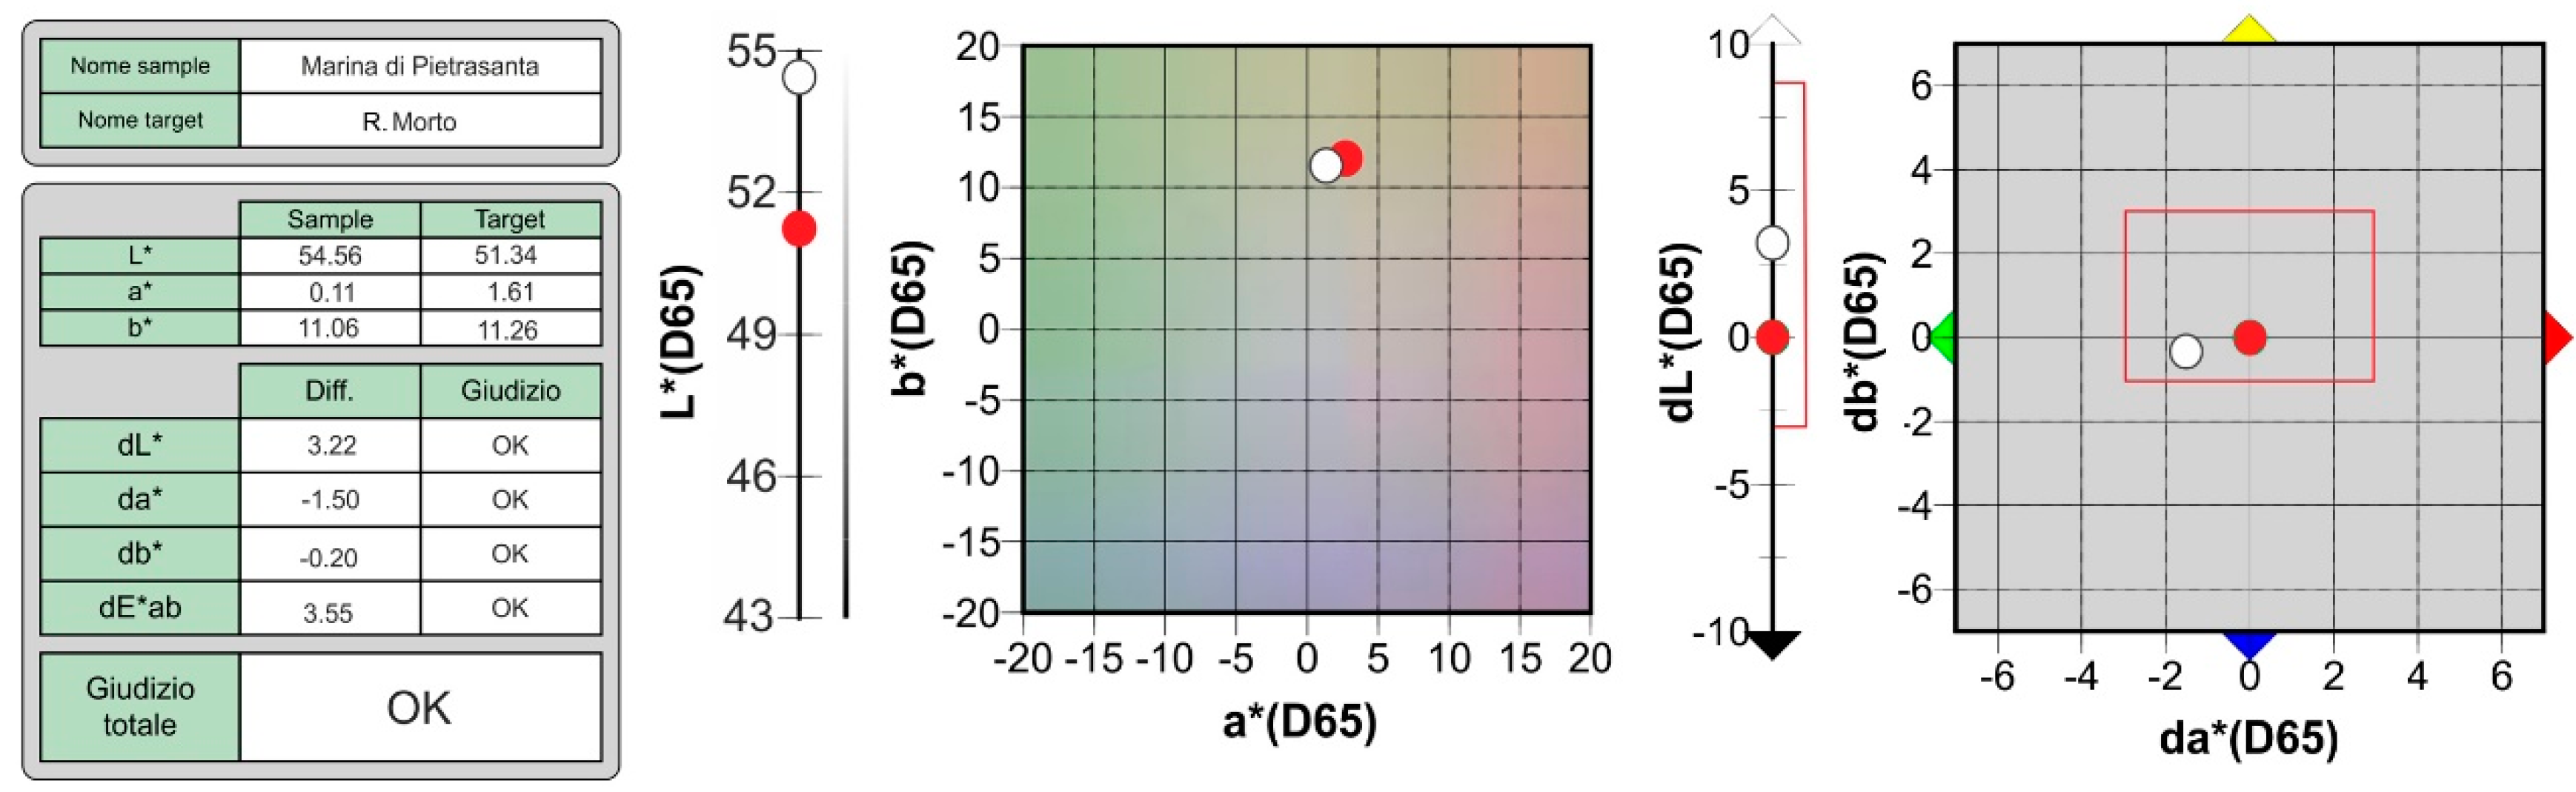
4.3. Marina di Pietrasanta (Sector 7)
5. Conclusions
Author Contributions
Funding
Acknowledgments
Conflicts of Interest
Appendix A

| Number | Sector Limits | Length (m) | Surface Variation 1981/5–2005 (m3) | Shoreline Displacement 1981/5–2005 (m) | Time (yrs) | Displacement Rate (m/yr) | Depth of Closure (m) | Annual Sediment Budget (m3/yr) | Unitary Annual Sediment Budget (m3/m/yr) |
|---|---|---|---|---|---|---|---|---|---|
| 1 | Magra–Porto di Carrara | 4286 | 8053.0 | 1.9 | 20 | 0.09 | 9.1 | 1832 | 0.4 |
| 2 | Porto di Carrara | ||||||||
| 3 | Porto di Carrara–Marina di Massa | 2,250 | −13,522.5 | −6.0 | 20 | −0.30 | 9.1 | −3076 | −1.4 |
| 4 | Marina di Massa–Foce Frigido | 3000 | 30,471.3 | 10.2 | 20 | 0.51 | 9.1 | 6932 | 2.3 |
| 5 | Foce Figido–Foce Versilia | 3120 | −112,816.1 | −36.2 | 20 | −1.81 | 9.1 | −25,666 | −8.2 |
| 6 | Foce Versilia–Pineta della Versiliana | 5000 | 47,627.1 | 9.5 | 20 | 0.56 | 9.1 | 10,835 | 2.2 |
| 7 | Pineta della Versiliana–Lido di Camaiore | 5000 | 126,213.5 | 25.2 | 20 | 1.28 | 9.1 | 28,714 | 5.7 |
| 8 | Lido di Camaiore–Porto di Viareggio | 5000 | 136,999.3 | 27.4 | 20 | 1.37 | 9.1 | 31,167 | 6.2 |
| 9 | Porto di Viareggio | ||||||||
| 10 | Porto di Viareggio–Marina di Torre del Lago | 4500 | 250,576.8 | 55.7 | 20 | 2.78 | 9.1 | 57,006 | 12.7 |
| 11 | Marina di Torre del Lago–Foce Serchio | 4501 | 59,545.6 | 13.2 | 20 | 0.66 | 9.1 | 13,547 | 3.0 |
| 12 | Foce Serchio–Foce Fiume Morto Nuovo | 5000 | −335,888.8 | −67.2 | 20 | −3.36 | 9.1 | −76,415 | −15.3 |
| 13 | Foce Fiume Morto Nuovo–Foce Arno | 6000 | −390,983.7 | −65.2 | 20 | −3.26 | 9.1 | −88,949 | −14.8 |
| 14 | Marina di Pisa | ||||||||
| 15 | Marina di Pisa–Scogliera Milano | 1715 | −4686.8 | −2.7 | 20 | −0.14 | 9.1 | −1066 | −0.6 |
| 16 | Scogliera Milano–Scolmatore | 6560 | 29,781.1 | 4.5 | 20 | 0.23 | 9.1 | 6775 | 1.0 |
| 17 | Punta Lillatro–Pietrabianca | 2115 | 52,273.4 | 24.7 | 24 | 1.03 | 9.1 | 9910 | 4.7 |
| 18 | Pietrabianca–Pontile Vittorio Veneto | 1080 | −7.036.7 | −6.5 | 24 | −0.27 | 9.1 | −1334 | −1.2 |
| 19 | Pontile Vittorio Veneto–Pontile Bonaposta | 1470 | −16,288.4 | −11.1 | 24 | −0.33 | 9.1 | −3088 | −2.1 |
| 20 | Pontile Bonaposta–Bocca di Cecina | 5419 | −4386.7 | −0.8 | 24 | 0.03 | 9.1 | −832 | −0.2 |
| 21 | Bocca di Cecina–Foce Cecinella | 1500 | 3373.2 | 2.2 | 24 | 0.09 | 9.1 | 640 | 0.4 |
| 22 | Foce Cecinella–Riserva Tombolo di Cecina | 875 | −26,651.9 | −30.5 | 24 | −1.27 | 9.1 | −5053 | −5.8 |
| 23 | Riserva Tombolo di Cecina–Marina di Bibbona | 5544 | −101,043.4 | −18.2 | 24 | −0.76 | 9.1 | −19,156 | −3.5 |
| 24 | Marina di Bibbona–Foce Fosso ai Molini | 5250 | −24,682.5 | −4.7 | 24 | −0.20 | 9.1 | −4679 | −0.9 |
| 25 | Foce Fosso ai Molini –La Riconiata | 5000 | 73,514.5 | 14.7 | 24 | 0.61 | 9.1 | 13,937 | 2.8 |
| 26 | La Riconiata–Porto di S.Vincenzo | 4750 | 7642.7 | 1.6 | 24 | 0.07 | 9.1 | 1449 | 0.3 |
| 27 | Porto di S.Vincenzo | ||||||||
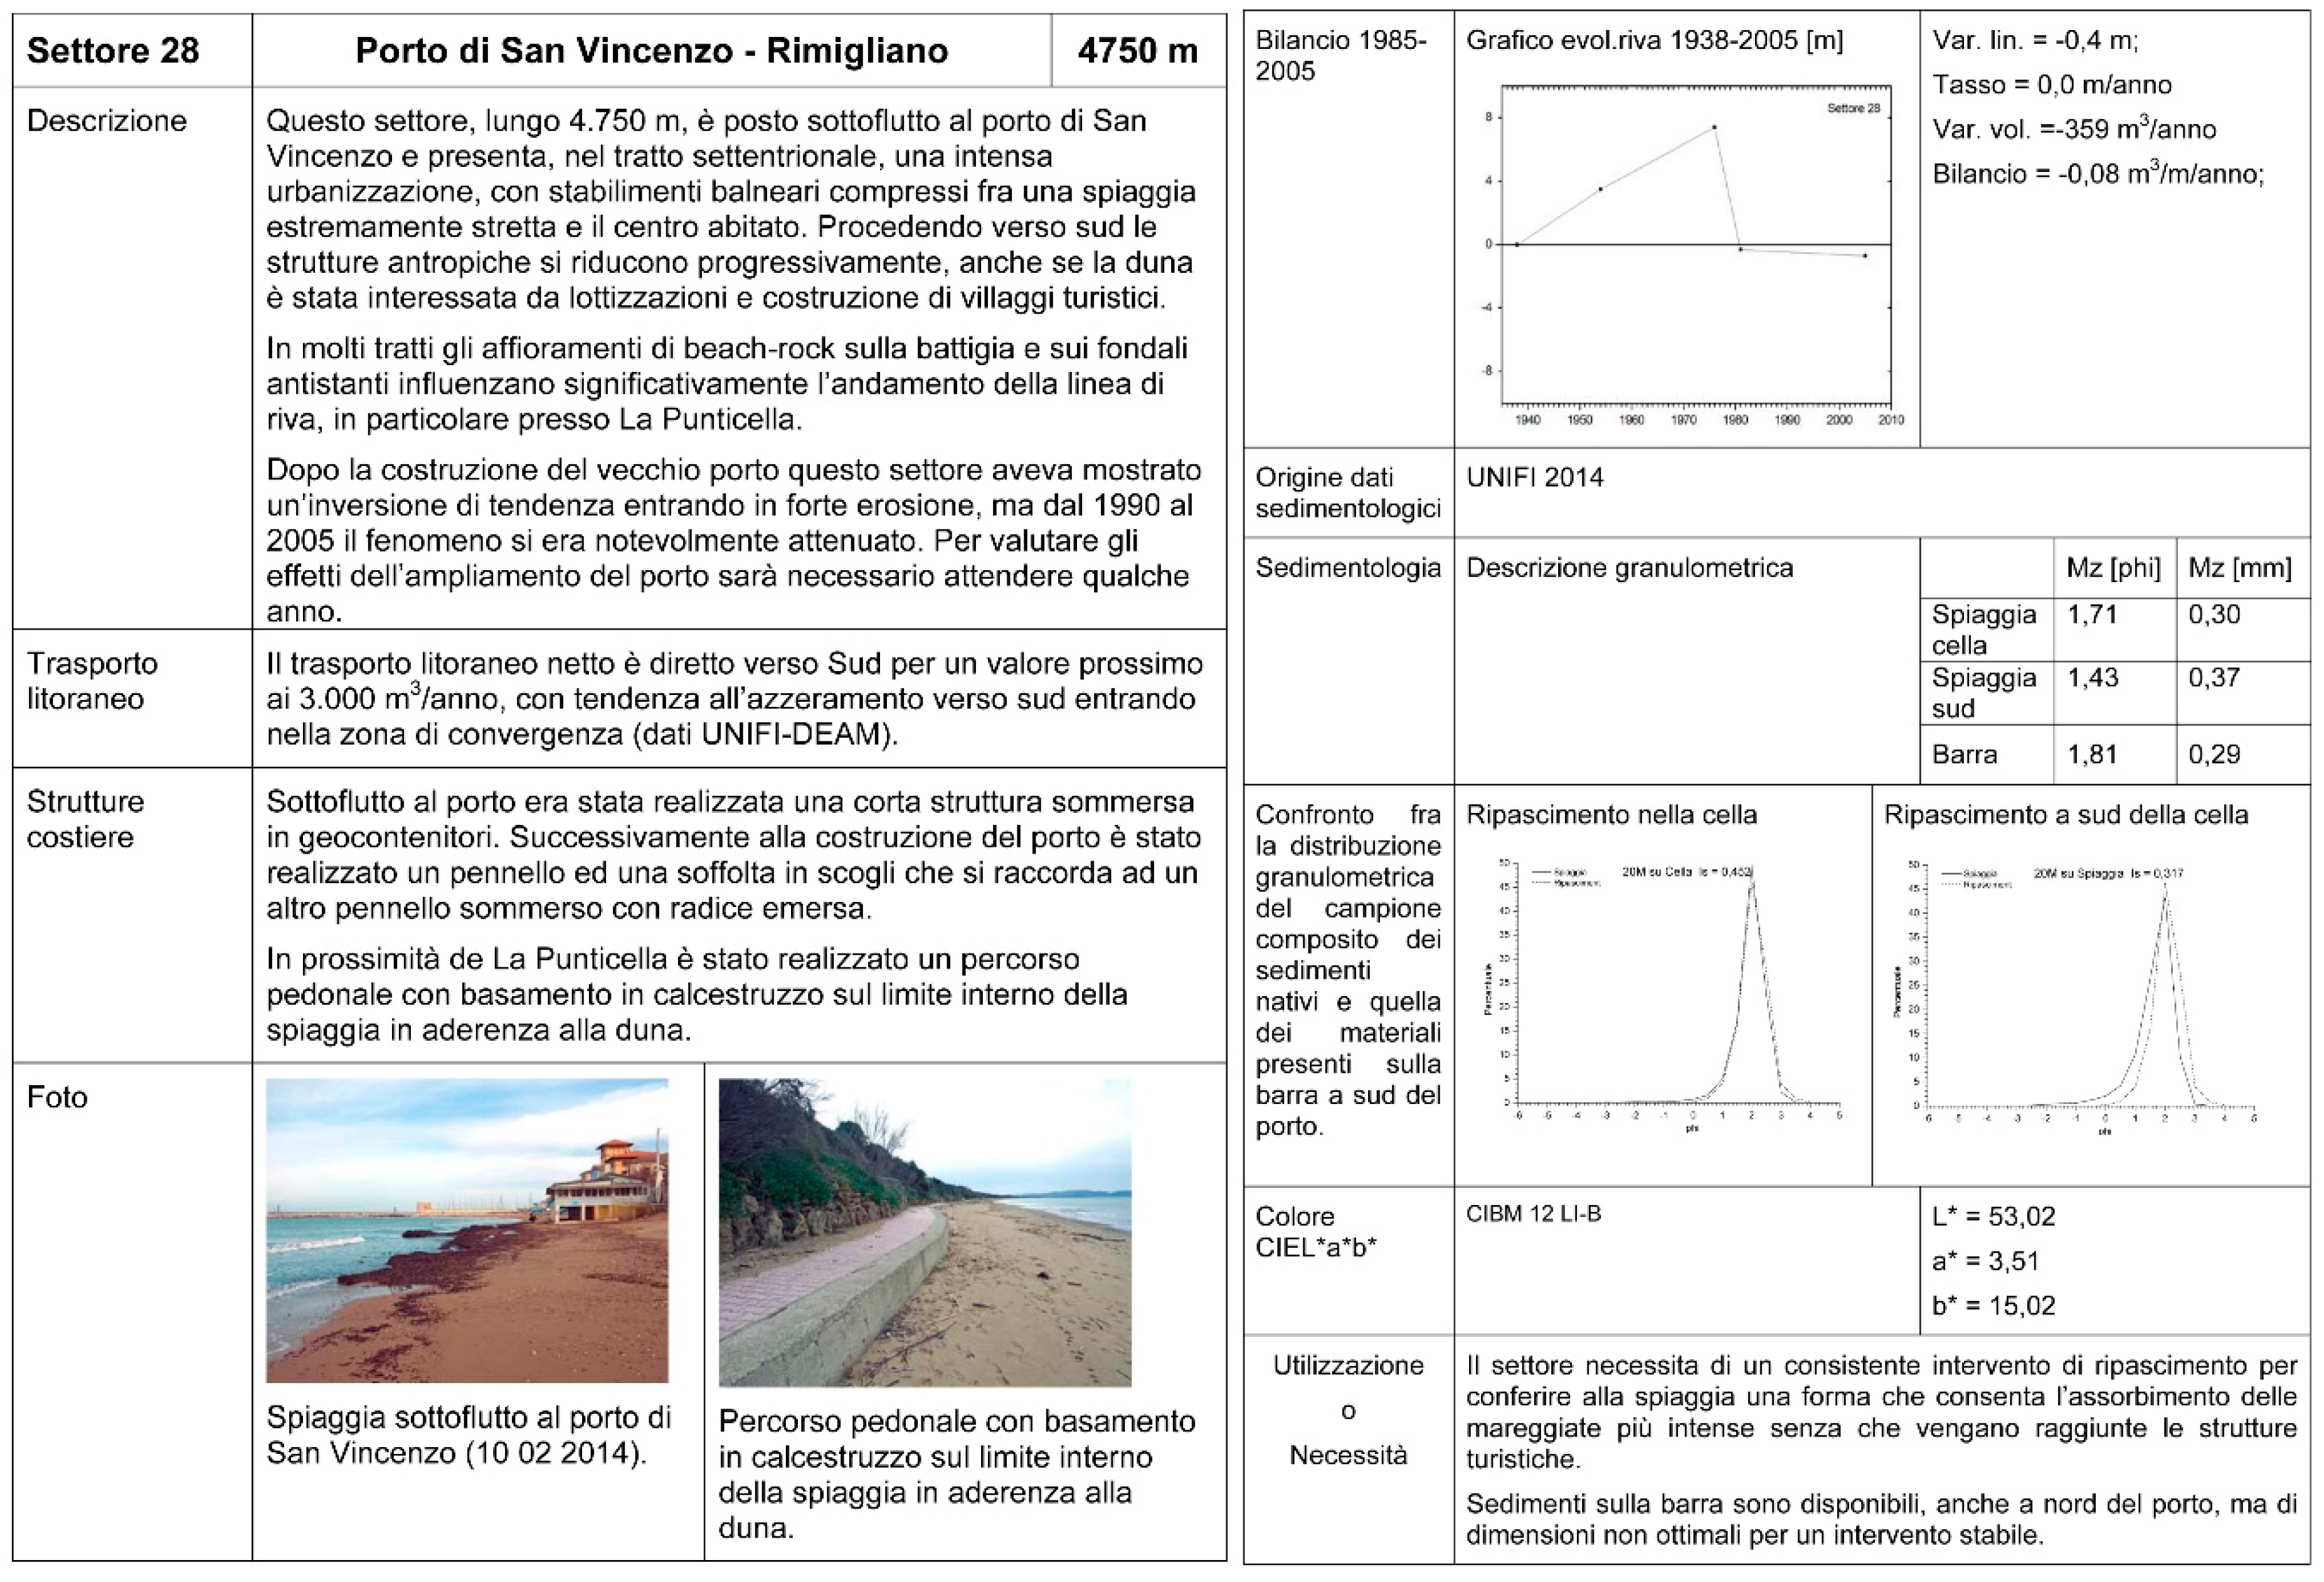
| 28 | Porto di S.Vincenzo–Rimigliano | 4750 | −1893.5 | −0.4 | 24 | −0.02 | 9.1 | −359 | −0.1 |
| 29 | Rimigliano–Torre Nuova | 4620 | 753.3 | 0.2 | 24 | 0.01 | 9.1 | 143 | 0.0 |
| 30 | Golfo di Baratti | 2070 | −10,700.5 | −5.2 | 21 | −0.25 | 7.8 | −1987 | −0.96 |
| 31 | Foce Cornia Vecchia–Torre del Sale | 3214 | −17,065.0 | −5.3 | 21 | −0.25 | 9.1 | −3697 | −1.2 |
| 32 | Torre del Sale | ||||||||
| 33 | Torre del Sale–Foce Fosso Corniaccia | 4500 | −47,588.8 | −10.6 | 21 | −0.50 | 9.1 | −10,311 | −2.3 |
| 34 | Foce Fosso Corniaccia–Canale Allacciante Corvia | 4340 | −1250.4 | −0.3 | 21 | −0.01 | 9.1 | −271 | −0.1 |
| 35 | Canale Allacciante Corvia–Pineta di Levante | 5618 | 15,304.7 | 2.7 | 21 | 0.13 | 9.1 | 3316 | 0.6 |
| 36 | Pineta di Levante–Porto di Scarlino | 2800 | 31,801.6 | 11.4 | 21 | 0.54 | 6.7 | 5073 | 1.8 |
| 37 | Cala Le Donne–Piastrone | 2860 | 4523.8 | 1.6 | 22 | 0.07 | 7.9 | 812 | 0.3 |
| 38 | Piastrone–Punta Hidalgo | 3120 | −31,281.3 | −10.0 | 22 | −0.46 | 6.1 | −4337 | −1.4 |
| 39 | Punta delle Rocchette–Punta Capezzolo | 5750 | −56,002.1 | −9.7 | 21 | −0.46 | 9.1 | −12,134 | −2.1 |
| 40 | Punta Capezzolo–Foce Bruna | 1380 | −4578.4 | −3.3 | 21 | −0.16 | 9.1 | −992 | −0.7 |
| 41 | Foce Bruna–Limite sud abitato Castiglione | 1031 | 13,336.6 | 12.9 | 21 | 0.62 | 9.1 | 2890 | 2.8 |
| 42 | Limite sud abitato Castiglione–Pineta del Tombolo | 4250 | 45,594.4 | 10.7 | 21 | 0.51 | 9.1 | 9879 | 2.3 |
| 43 | Pineta del Tombolo–Porto Marina di Grosseto | 4533 | 75,736.2 | 16.7 | 21 | 0.80 | 9.1 | 16,410 | 3.6 |
| 44 | Porto Marina di Grosseto–Chiaro del Porciatti | 3166 | 103,897.8 | 32.8 | 21 | 1.56 | 9.1 | 22,511 | 7.1 |
| 45 | Chiaro del Porciatti–Bocca d’Ombrone | 3250 | −165.039.7 | −50.8 | 22 | −2.31 | 9.1 | −34,133 | −10.5 |
| 46 | Bocca d’Ombrone–Spiaggia di Alberese | 3250 | −253,503.3 | −78.0 | 22 | −3.55 | 9.1 | −52,429 | −16.1 |
| 47 | Spiaggia di Alberese–Cala Rossa | 3750 | 88,011.7 | 23.5 | 22 | 1.07 | 9.1 | 18,202 | 4.9 |
| 48 | Golfo di Talamone | 2465 | −12,796.0 | −5.2 | 21 | −0.25 | 3.8 | −1158 | −0.5 |
| 49 | Foce Osa–Bocca d’Albegna | 5750 | −2767.1 | −0.5 | 21 | −0.02 | 8.3 | −547 | −0.1 |
| 50 | Bocca d’Albegna–Tombolo della Giannella | 4000 | 11,972.2 | 3.0 | 21 | 0.14 | 8.3 | 2366 | 0.6 |
| 51 | Tombolo della Giannella–Santa Liberata | 4250 | 33,376.1 | 7.9 | 21 | 0.37 | 8.3 | 6596 | 1.6 |
| 52 | Tombolo di Feniglia | 6946 | 56,831.4 | 8.2 | 21 | 0.39 | 8.7 | 11,772 | 1.7 |
| 53 | Torre Tagliata–Palude di Tagliata | 3250 | −29,592.3 | −9.1 | 21 | −0.43 | 8.7 | −6130 | −1.9 |
| 54 | Palude di Tagliata–Macchiatonda | 1500 | −33,376.3 | −22.3 | 21 | −1.06 | 8.7 | −6914 | −4.6 |
| 55 | Macchiatonda–Palude di Burano | 4250 | −40,714.4 | −9.6 | 21 | −0.46 | 8.7 | −8434 | −2.0 |
| 56 | Palude di Burano–Foce Chiarone | 4250 | 9558.7 | 2.2 | 21 | 0.11 | 8.7 | 1980 | 0.5 |
Appendix B

References
- UNWTO. Tourism Highlights, 2017th ed.; UNWTO: Madrid, Spain, 2017. [Google Scholar]
- UNWTO. Tourism Highlights, 2018th ed.; UNWTO: Madrid, Spain, 2018. [Google Scholar]
- Klein, Y.L.; Osleeb, J.P.; Viola, M.R. Tourism-generated earnings in the coastal zone: A regional analysis. J. Coast. Res. 2004, 20, 1080–1088. [Google Scholar]
- Houston, J.R. The economic value of beaches e a 2013 update. Shore Beach 2013, 81, 3–11. [Google Scholar]
- Dodds, R.; Kelman, I. How climate change is considered in sustainable tourism policies: A case of the Mediterranean islands of Malta and Mallorca. Tour. Rev. Int. 2008, 12, 57–70. [Google Scholar] [CrossRef]
- Muñoz-Pérez, J.J.; López, B.; Gutiérrez, J.M.; Moreno, L.; Cuena, G. Cost of beach maintenance in the Gulf of Cadiz (SW Spain). Coast. Eng. 2001, 42, 143–153. [Google Scholar] [CrossRef]
- Bruun, P. The Development of Downdrift Erosion. J. Coast. Res. 1995, 11, 1242–1257. [Google Scholar]
- Antony, E.; Sabatier, F. Coastal stabilization practice in France. In Coastal Erosion and Protection in Europe; Pranzini, E., Williams, A.T., Eds.; Routledge: London, UK, 2013; p. 457. [Google Scholar]
- Hanson, H.; Brampton, A.; Capobianco, C.; Dette, H.H.; Hamm, L.; Laustmp, C.; Lechuga, A.; Spanhoff, R. Beach nourishment projects, practices, and objectives—A European overview. Coast. Eng. 2002, 47, 81–111. [Google Scholar] [CrossRef]
- Bray, M.; Carter, D.; Hooke, J. Littoral cell definition and budgets for central southern England. J. Coast. Res. 1995, 11, 381–400. [Google Scholar]
- Manno, G.; Anfuso, G.; Messina, E.; Williams, A.T.; Suffo, M.; Liguori, V. Decadal evolution of coastline armouring along the Mediterranean Andalusia littoral (South of Spain). Ocean Coast. Manag. 2016, 124, 84–99. [Google Scholar] [CrossRef]
- Molina, R.; Anfuso, G.; Manno, G.; Gracia Prieto, F.J. The Mediterranean Coast of Andalusia (Spain): Medium-Term Evolution and Impacts of Coastal Structures. Sustainability 2019, 11, 3539. [Google Scholar] [CrossRef] [Green Version]
- Bray, M.; Carter, D.; Hooke, J. Coastal Sediment Transport Study. Report to SCOPAC; Department of Geography, Portsmouth Polytechnic: Portsmouth, UK, 1991; p. 498. [Google Scholar]
- Hooke, J.M.; Bray, M.J.; Carter, D.J. Sediment transport analysis as a component of coastal management—A UK example. Environ. Geol. 1996, 27, 347–357. [Google Scholar] [CrossRef]
- Cooper, N.; Pethick, J. Sediment budget approach to addressing coastal erosion problems in St. Ouen’s Bay, Jersey, Channel Island. J. Coast. Res. 2005, 21, 112–122. [Google Scholar] [CrossRef]
- Campbell, T.; Benedet, L.; Fink, C.W. Regional strategies for coastal restoration along the Louisiana Chenier Plain. J. Coast. Res. 2005, 44, 268–283. [Google Scholar]
- Komar, P.D. The budget of littoral sediments, concept and applications. In Handbook of Coastal and Ocean. Engineering; Gulf Publishing Co.: Huston, TX, USA, 1990; pp. 681–714. [Google Scholar]
- Lowry, P.; Carter, R.W.G. Computer simulation and delimitation of littoral drift cells on the south coast of Co. Wexford, Ireland. J. Heart Sci. R. Dublin Soc. 1982, 4, 121–132. [Google Scholar]
- May, J.P.; Tanner, W.F. The littoral power gradient and shoreline changes. In Coastal Geomorphology; Coates, D.R., Ed.; New York State University Press: New York, NY, USA, 1973; pp. 43–61. [Google Scholar]
- Hapke, C.H.; Lentz, E.E.; Gayes, P.T.; MCCoy, C.A.; Hehre, R.; Schwab, W.C.; Williams, S.J. A Review of Sediment Budget Imbalances along Fire Island, New York: Can Nearshore Geologic Framework and Patterns of Shoreline Change Explain the Deficit? J. Coast. Res. 2010, 26, 510–522. [Google Scholar] [CrossRef]
- Anfuso, G.; Pranzini, E.; Vitale, G. An integrated approach to coastal erosion problems in northern Tuscany (Italy): Littoral morphological evolution and cells distribution. Geomorphology 2011, 129, 204–214. [Google Scholar] [CrossRef]
- Larson, M. Numerical modelling. In Encyclopedia of Coastal Science; Schwarts, M.L., Ed.; Springer: Dordrecht, The Netherland, 2005; pp. 730–733. [Google Scholar]
- Pranzini, E.; Anfuso, G.; Muñoz-Pérez, J.J. A probabilistic approach to borrow sediment selection in beach nourishment projects. Coast. Eng. 2018, 139, 32–35. [Google Scholar] [CrossRef]
- Noble, R.M.; Moore, J.T. Coastal Regional Sediment Management Plan. In Proceedings of the Coastal Engineering Proceedings (ICCE), Shanghai, China, 30 June–5 July 2010; McKee Smith, J., Lynett, P., Eds.; Curran Associates, Inc.: New York, NY, USA, 2013. [Google Scholar]
- European Communities. Living with Coastal Erosion in Europe—Sediment and Space for Sustainability—Results from the EUROSION Study; Doody, P., Ferreira, M., Lombardo, S., Lucius, I., Misdorp, R., NIesing, H., Salman, A., Smallegange, M., Eds.; Office for Official Publications of the European Communities: Brussel, Belgium, 2004; p. 40. [Google Scholar]
- MATTM-Regioni. Linee Guida per la Difesa Della Costa Dai Fenomeni di Erosione e Dagli Effetti Dei Cambiamenti Climatici. Versione Settembre 2018—Documento Elaborato Dal Tavolo Nazionale Sull’Erosione Costiera MATTM-Regioni con il Coordinamento Tecnico di ISPRA. Available online: http://www.erosionecostiera.isprambiente.it/linee-guida-nazionali (accessed on 26 December 2019).
- UNEP/MAP/PAP. Protocol on Integrated Coastal Zone Management in the Mediterranean. Split, Priority Actions Programme. Available online: http://wedocs.unep.org/handle/20.500.11822/1747?show=full (accessed on 26 December 2019).
- Lillycrop, L.S.; McCornick, J.W.; Parson, L.E.; Chasten, M.A. Adaptive management through regional sediment management. In Proceedings of the WEDA XXXI Technical Conference & TAMU 42 Dredging Seminar, Nashviulle, TN, USA, 5–8 June 2011; pp. 178–187. [Google Scholar]
- Finkel, C.W. What might happen to America’s shorelines if artificial beach replenishment is curtailed: A prognosis for Southeastern Florida and other sandy regions along regressive coasts. J. Coast. Res. 1996, 12, 3–9. [Google Scholar]
- Kelley, S.W.; Ramsey, J.S.; Byrnes, M.R. Evaluating shoreline response to offshore sand mining for beach nourishment. J. Coast. Res. 2004, 20, 89–100. [Google Scholar] [CrossRef]
- Kana, T.W.; Mohan, R.K. Analysis of nourished profile stability following the fifth Hunting Island (SC) beach nourishment project. Coast. Eng. 1998, 33, 117–136. [Google Scholar] [CrossRef]
- Bodge, K.R. Representing equilibrium beach profiles with an exponential expression. J. Coast. Res. 1992, 8, 47–55. [Google Scholar]
- Capobianco, M.; Hanson, H.; Larson, M.; Steetzel, H.; Stive, M.J.F.; Chatelus, Y.; Aarninkhof, S.; Karambas, T. Nourishment design and evaluation: Applicability of model concepts. Coast. Eng. 2002, 47, 113–135. [Google Scholar] [CrossRef]
- Stive, M.J.F.; de Schipper, M.A.; Luijendijk, A.P.; Aarninkhof, S.; van Gelder-Maas, C.; van Thiel de Vries, J.S.M.; de Vries, S.; Henriquez, M.; Marx, S.; Ranasinghe, R. A New Alternative to Saving Our Beaches from Sea-Level Rise: The Sand Engine. J. Coast. Res. 2013, 29, 1001–1008. [Google Scholar] [CrossRef]
- Bird, E.; Lewis, N. Beach Renourishment; Springer: Dordrecht, The Netherlands, 2015; p. 137. [Google Scholar]
- Eitner, V. The Effect of Sedimentary Texture on Beach Fill Longevity. J. Coast. Res. 1996, 12, 447–461. [Google Scholar]
- Pranzini, E.; Simonetti, D.; Vitale, G. Sand colour rating and chromatic compatibility of borrow sediments. J. Coast. Res. 2011, 26, 798–808. [Google Scholar] [CrossRef]
- Pranzini, E. Protection studies at two recreational beaches: Poetto and Cala Gonone beaches, Sardinia, Italy. In Beach Management; Williams, A., Micallef, A., Eds.; Earthscan Publishers: London, UK, 2009; pp. 287–306. [Google Scholar]
- Pranzini, E.; Anfuso, G.; Botero, C.M.; Cabrera, A.; Apin Campos, Y.; Casas Martinez, G.; Williams, A.T. Sand colour at Cuba and its influence on beach nourishment and management. Ocean Coast. Manag. 2016, 126, 51–60. [Google Scholar] [CrossRef]
- Pranzini, E. Beach erosion and protection in Tuscany. In Monitoring Results: A Capitalization Tool from COASTGAP Project; Cipriani, L.E., Pranzini, E., Eds.; Nuova Grafica Fiorentina: Firenze, Italy, 2014; p. 138. [Google Scholar]
- Pranzini, E.; Anfuso, G.; Cinelli, I.; Piccardi, M.; Vitale, G. Shore Protection Structures Increase and Evolution on the Northern Tuscany Coast (Italy): Influence of Tourism Industry. Water 2018, 10, 1647. [Google Scholar] [CrossRef] [Green Version]
- Bartolini, C.; Cipriani, L.E.; Pranzini, E.; Sargentini, M. Caratteristiche geomorfologiche ed evoluzione della linea di riva del litorale toscano e criteri di lettura. Coste Toscan. Reg. Toscan. 1989, 2, 33–56. [Google Scholar]
- Anfuso, G.; Bowman, D.; Danese, C.; Pranzini, E. Transect based analysis versus area based analysis to quantify shoreline displacement: Spatial resolution issues. Environ. Monit. Assess. 2016, 188, 568. [Google Scholar] [CrossRef]
- Pranzini, E. Bilancio sedimentario ed evoluzione storica delle spiagge. Il Quaternario 1994, 7, 197–202. [Google Scholar]
- Cavazza, S. Regionalizzazione geomorfologica del trasporto solido in sospensione dei corsi d’acqua tra il Magra e L’Ombrone. Alli Soc. Tosc. Sci. Nat. Mem. 1984, 91, 119–132. [Google Scholar]
- Becchi, I.; Paris, E. Il corso dell’Arno e la sua evoluzione storica. Acqua Aria 1989, 6, 645–652. [Google Scholar]
- Bartolini, C.; Pranzini, E. Fan delta erosion in southern Tuscany as evaluated from hydrographic surveys of 1883 and the late’70. Mar. Geol. 1984, 62, 181–187. [Google Scholar] [CrossRef]
- Innocenti, L.; Pranzini, E. Geomorphological evolution and sedimentology of the Ombrone River delta (Italy). J. Coast. Res. 1993, 9, 481–493. [Google Scholar]
- Cappucci, S.; Scarcella, D.; Rossi, L.; Taramelli, A. Integrated coastal zone management at Marina di Carrara Harbor: Sediment management and policy making. Ocean Coast. Manag. 2011, 54, 277–289. [Google Scholar] [CrossRef]
- Bowman, D.; Pranzini, E. Reversed response within a segmented detached breakwater—The Gombo case, Tuscany coast, Italy. Coast. Eng. 2003, 49, 263–274. [Google Scholar] [CrossRef]
- Cipriani, L.E.; Pranzini, E. Differenziazione granulometrica dei sedimenti di spiaggia emersa e sommersa quale conseguenza della costruzione di opere a mare alla foce del fiume Cecina (Toscana centrale). Boll. Soc. Geol. Ital. 1990, 109, 471–480. [Google Scholar]
- Anfuso, G.; Martínez, J.A.; Rangel Buitrago, N. Bad practice in erosion management: The southern Sicily case study. In Pitfalls of Shoreline Stabilization; Pilkey, O., Cooper, J.A.G., Eds.; Springer: Berlin/Heidelberg, Germany, 2012; p. 333. [Google Scholar]
- Gandolfi, G.; Paganelli, L. Le province petrografiche del litorale toscano. Boll. Soc. Geol. Ital. 1977, 96, 653–663. [Google Scholar]
- BEACHMED-e. Il Sottoprogetto OpTIMA, Ottimizzazione delle Tecniche Integrate di Monitoraggio Applicate ai Litorali. In La Gestione Strategica Della Difesa Dei Litorali Per Uno Sviluppo Sostenibile Delle Zone Costiere Del Mediterraneo; BEACHMED-e, I Quaderno Tecnico: Florence, Italy, 2007; pp. 33–47.
- De Filippi, G.L.; Duchini, E.; Pranzini, E. Closure Depth estimation along the Tuscan coast aimed at short- and long-term coastal monitoring. In Beach Erosion Monitoring-Results from BeachMed-e/OpTIMAL Project; Pranzini, E., Wetzel, L., Eds.; Nuova Grafica Fiorentina: Firenze, Italy, 2008; pp. 33–50. [Google Scholar]
- Hallermaier, R.J. Use for a calculated limit depth to beach erosion. In Proceedings of the XVI Coastal Engineering Conference, Hamburg, Germany, 27 August–3 September 1978; Volume 88, pp. 1493–1512. [Google Scholar]
- Stive, M.J.F.; de Vriend, H.J. Modelling shoreface profile evolution. Mar. Geol. 1995, 126, 235–248. [Google Scholar] [CrossRef] [Green Version]
- Bigongiari, N.; Cipriani, L.E.; Pranzini, E.; Renzi, M.; Vitale, G. Assessing shelf aggregate environmental compatibility and suitability for beach nourishment: A case study for Tuscany (Italy). Mar. Pollut. Bull. 2015, 93, 183–193. [Google Scholar] [CrossRef]
- Bruun, P. Navigation and Sand Bypassing at Inlets: Technical Management and Cost Aspects. J. Coast. Res. 1996, 23, 113–119. [Google Scholar]
- Nordstrom, K.F. Beaches and Developed Coasts; Cambridge University Press: Cambridge, UK, 2000; p. 338. [Google Scholar]
- Khalil, S.M.; Finkl, C.W.; Roberts, H.H.; Raynie, R.C. New Approaches to Sediment Management on the Inner Continental Shelf Offshore Coastal Louisiana. J. Coast. Res. 2010, 4, 591–604. [Google Scholar] [CrossRef]
- Boswood, P.K.; Voisey, C.J.; Victory, S.J.; Robinson, D.A.; Dyson, A.R.; Lawson, S.R. Beach Response to Tweed River Entrance Sand Bypassing Operations. In Proceedings of the 17th Australasian Conf. on Coastal and Ocean Eng. (incorporating 10th Australian Conf. on Port Eng.), Engineers Australia, Adelaide, Australia, 20–23 September 2005; pp. 119–124. [Google Scholar]
- Pinto, C.A.; Silveira, T.M.; Teixeira, S.B. Beach Nourishment Practice in Mainland Portugal (1950–2017): Overview and Retrospective; Technical Report; Portuguese Environment Agency: Amadora, Portugal, 2018; p. 57. [Google Scholar]
- Mason, M.A. Abrasion of Beach Sand; U.S. Beach Erosion Board, War Department: Washington, DC, USA, 1942; p. 26. [Google Scholar]
- Chen, B. What Is the Contribution of Abrasion to the Sediment Budget of a Mixed Sand and Gravel Beach? Ph.D. Thesis, University of Otago, Dunedin, New Zealand, 2015. [Google Scholar]
- De Falco, G.; Simeone, S.; Baroli, M. Management of beach-cast Posidonia oceanicaseagrass on the island of Sardinia (Italy, Western Mediterranean). J. Coast. Res. 2008, 24, 69–75. [Google Scholar] [CrossRef]
- Cooper, J.A.G.; Anfuso, G.; Del Rio, L. Bad beach management: European perspectives. Geol. Soc. Am. 2009, 460, 167–179. [Google Scholar]
- Anfuso, G.; Martinez, J.A.; Rangel, N. Morphological cells in the Ragusa littoral (Sicily, Italy). J. Coast. Conserv. 2013, 17, 369–377. [Google Scholar] [CrossRef] [Green Version]
- Williams, A.T.; Micallef, A. Beach Management: Principles and Practice; Earthscan: London, UK, 2009. [Google Scholar]
- Pranzini, E. Caratteristiche morfologiche e sedimentologiche di una zona di convergenza del trasporto litoraneo (Versilia, Toscana). Studi Costieri 2004, 8, 135–149. [Google Scholar]


© 2020 by the authors. Licensee MDPI, Basel, Switzerland. This article is an open access article distributed under the terms and conditions of the Creative Commons Attribution (CC BY) license (http://creativecommons.org/licenses/by/4.0/).
Share and Cite
Pranzini, E.; Cinelli, I.; Cipriani, L.E.; Anfuso, G. An Integrated Coastal Sediment Management Plan: The Example of the Tuscany Region (Italy). J. Mar. Sci. Eng. 2020, 8, 33. https://doi.org/10.3390/jmse8010033
Pranzini E, Cinelli I, Cipriani LE, Anfuso G. An Integrated Coastal Sediment Management Plan: The Example of the Tuscany Region (Italy). Journal of Marine Science and Engineering. 2020; 8(1):33. https://doi.org/10.3390/jmse8010033
Chicago/Turabian StylePranzini, Enzo, Irene Cinelli, Luigi E. Cipriani, and Giorgio Anfuso. 2020. "An Integrated Coastal Sediment Management Plan: The Example of the Tuscany Region (Italy)" Journal of Marine Science and Engineering 8, no. 1: 33. https://doi.org/10.3390/jmse8010033