Article

Mechanical Tests and Numerical Simulations for Mining Seafloor Massive Sulfides

1
College of Mechanical and Electrical Engineering, Central South University, Changsha 410083, China
2
State Key Laboratory of High Performance Complex Manufacturing, Central South University, Changsha 410083, China
3
Hunan Institute of Engineering, Xiangtan 411104, China
*
Author to whom correspondence should be addressed.
J. Mar. Sci. Eng. 2019, 7(8), 252; https://doi.org/10.3390/jmse7080252
Submission received: 26 June 2019 / Revised: 18 July 2019 / Accepted: 29 July 2019 / Published: 1 August 2019
(This article belongs to the Special Issue Marine Mineral Resource Mining)

Abstract

:
With the decrease of primary resources in recent years, deep seabed mineral resources, especially the massive sulfides, are of extensive research significance. In this paper, firstly, the uniaxial compressive strength (UCS) test and triaxial compressive strength (TCS) test on the seafloor massive sulfides (SMS) samples from three different segments are conducted to obtain the key mechanical properties, including the cohesive force, internal friction angle, compressive strength, elastic modulus and Poisson’s ratio. Then, by leveraging the PFC3D code, the uniaxial and triaxial numerical simulations of SMS are performed. During this process, the micro properties in the simulation are altered through a calibration process until they match the macro properties of the SMS samples measured in the laboratory tests. Finally, the micro properties are applied to simulate the cutting process of single cutting pick and two adjacent cutting picks; meanwhile, the cutting force in the fragmentation process of SMS is monitored and collected. This research can provide some guidance for the mining simulation of SMS and effectively predicting the maximum force on the cutting pick.

1. Introduction

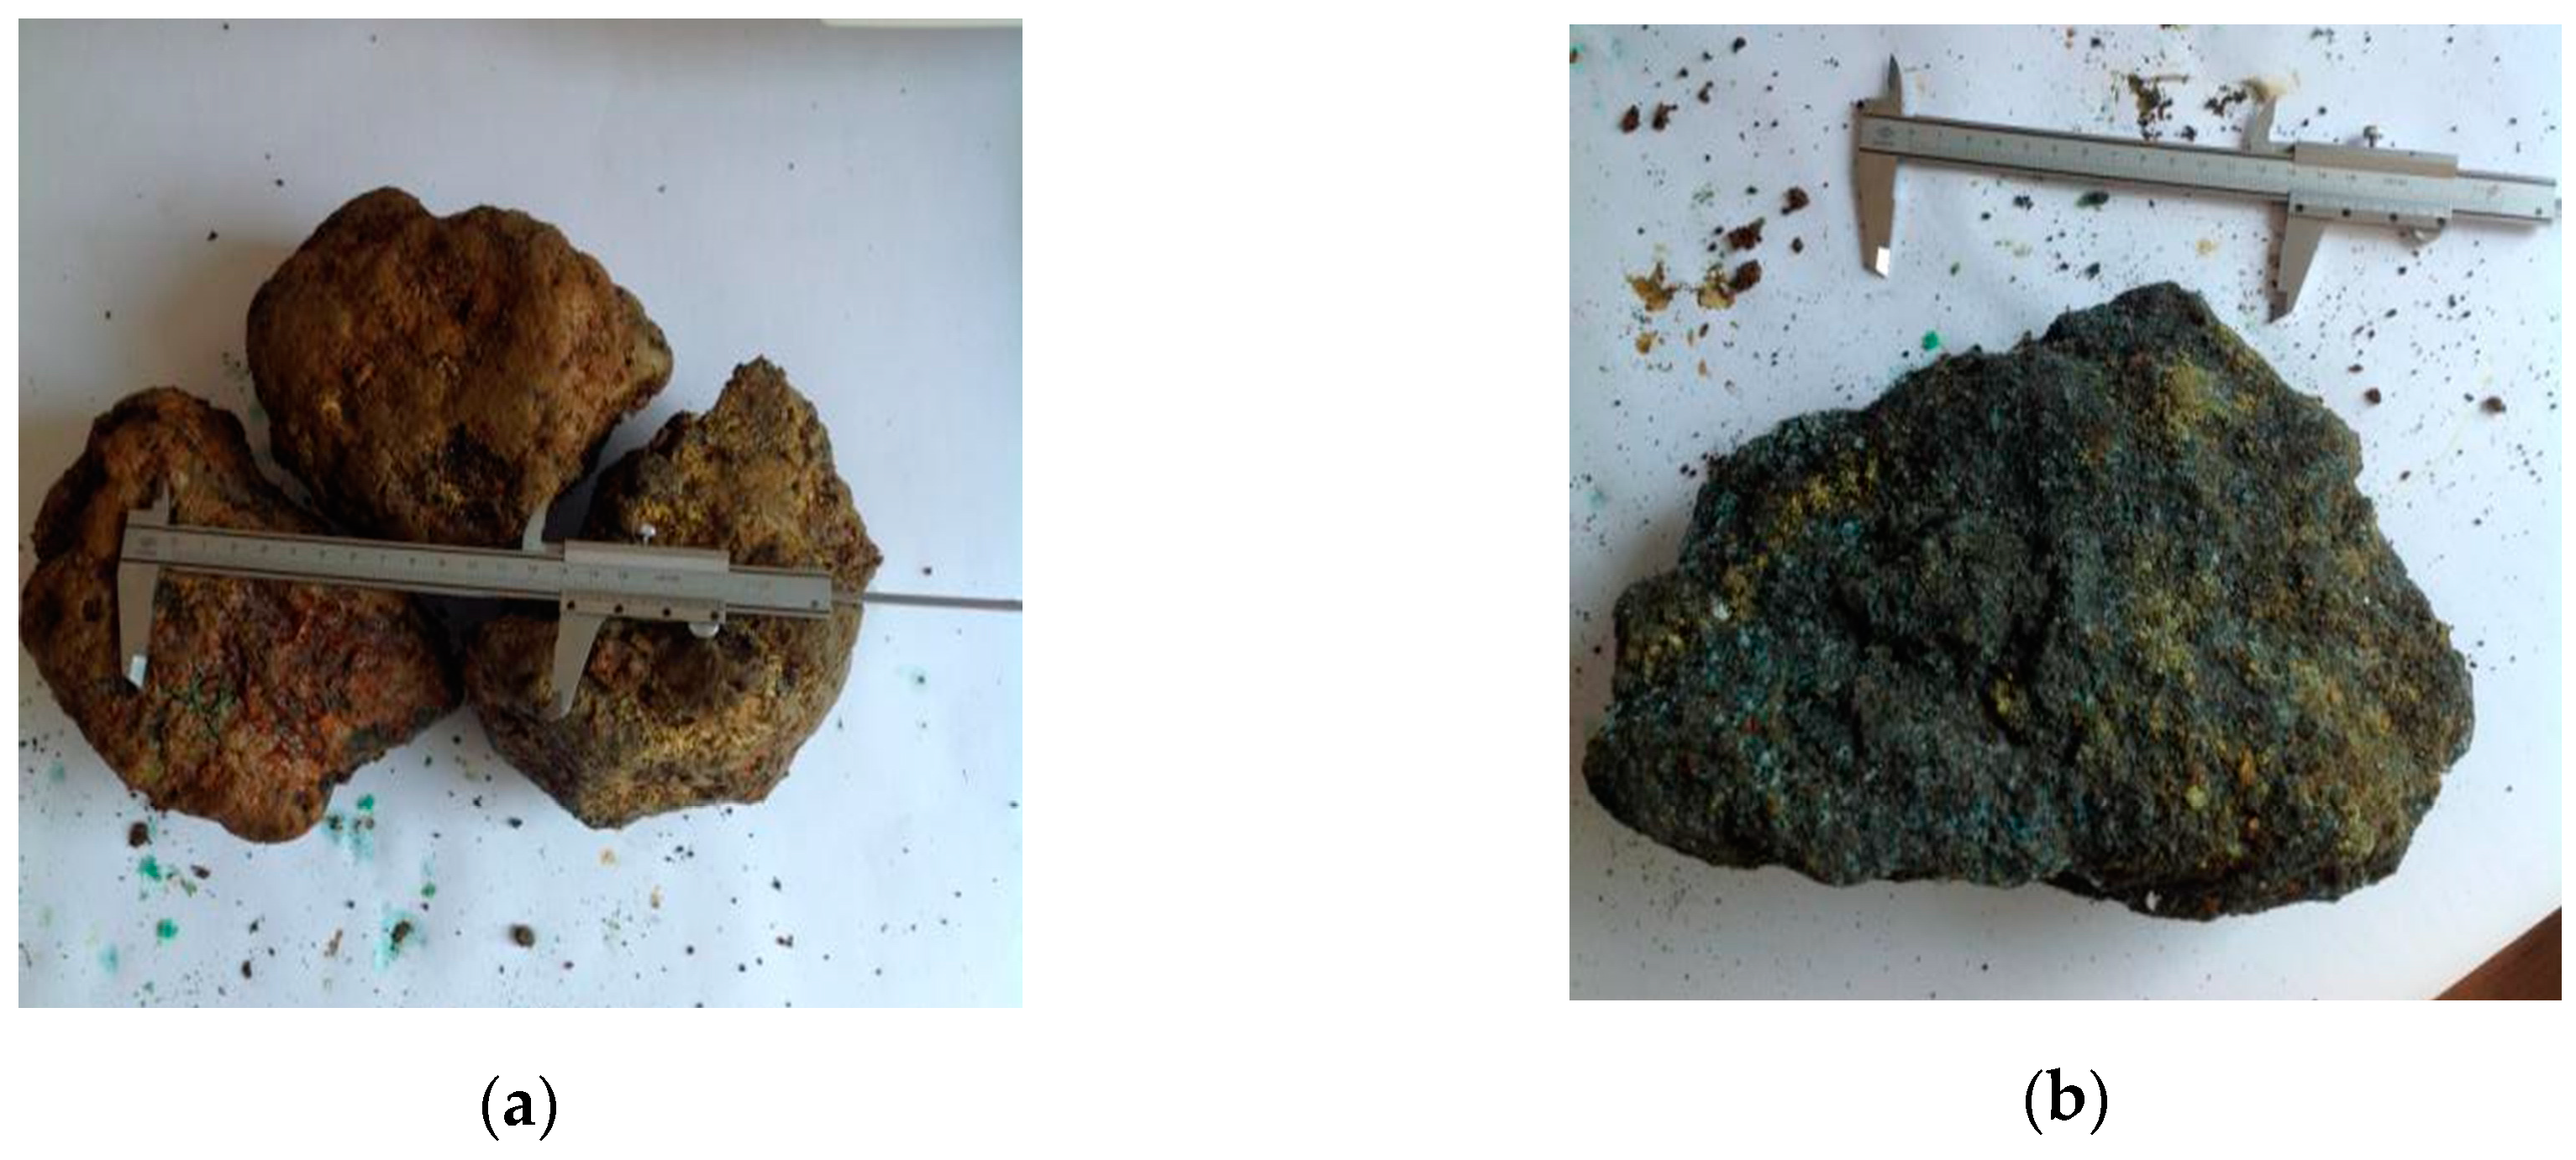
The persistent demand for mineral resources is fueling a future industry of deep-sea mining, in which the vigorous exploitation and utilization of marine resources has become a national strategy of many countries in the world. Seafloor Massive Sulfides (SMS), formed by the hydrothermal or chemical processes on the seafloor, are rich in precious and base metals such as gold, silver, manganese, iron, cobalt, etc. [1,2,3,4,5]. Currently, SMS deposits are primarily exploited by a spiral drum with cutting picks. During the cutting and crushing process, the cutting picks are bound to suffer from wear and tear, thus, it is necessary to study and predict the force on the cutting picks. However, due to the difficulty in obtaining the SMS samples in current experimental studies and the limitations of seabed exploration techniques, it is difficult to obtain the accurate mechanical properties of SMS and conduct the physical researches. Therefore, the numerical simulation for mining SMS using the discrete element method has become particularly significant.
Currently, little data is available on the mechanical properties of SMS samples. Kuiper et al. [6] carried out experiments of crushing material samples to the breaking point, aiming to determine the compressive strength and tensile strength of the rocks under different high-pressure conditions. The unconfined compressive strength test and Brazilian test strength (BTS) test were performed to analyze the physical and mineralogical properties of insufficient SMS samples in [7], in which the result revealed that the geotechnical properties of SMS samples were related to the mineralogical characteristics. However, the real SMS samples in [6] were not taken into account, and the SMS samples in [7] are relatively few. Therefore, the further investigation on the mechanical properties of sufficient SMS samples is necessary.
In order to investigate the cutting mechanism and the variation regularities of the cutting force in the crushing process, large amounts of researches on the rock cutting experiments have been carried out. Grima et al. [8] conducted the cutting mechanism experiments in high-pressure vessels to simulate the cutting process and proposed an analytical model to predict the cutting force under high pressure. In addition, the proposed model was in good agreement with the experimental results. Kaitkay et al. [9] carried out experiments to study the variation of the cutting force in terms of the cutting depth, rake angle and hydrostatic pressure under different hydrostatic pressures. It was concluded that the cutting force increased with the increase of the negative rake angle and hydrostatic pressure. Combining the rock mechanics with the fluid mechanics, Helmons et al. [10] proposed a new method based on the discrete element method (DEM) to study the high deformation behavior in the seabed mining process, so as to estimate the local deformation rate. Moreover, Alvarez et al. [11] developed a test unit to fully understand the high hydraulic cutting process and evaluated the force and power during the cutting process.
Due to the high cost of the high-pressure rock cutting experiments and the difficulty in directly observing the removal process, the numerical simulation of the cutting process has aroused great interest in the last decade [12,13]. As postulated by Estay and Chiang [14], a new rock fracture modeling method based on the basic principle of the discrete crack model (DCM) and the fracture criterion was proposed to determine whether or when the rock was crushed. Considering the two-dimensional (2D) and three-dimensional (3D) models, the discrete element method (DEM) was applied to simulate the cutting process of the rock. Combining the unconfined compressive strength test with the indirect tensile strength test, the theoretical derivation and calibration method of the discrete element model were briefly summarized [15]. The discrete element codes PFC2D and PFC3D were adopted to investigate the rock cutting process under various hydrostatic pressures [16] and the force on the cutting picks was monitored [17,18]. Based on the continuum mechanics and discrete modeling method, Stavropoulou [19] used the numerical code FLAC2D to simulate the cutting progresses of four marbles, and the results showed that the cohesive force and the internal friction were the key parameters affecting the drilling resistance. The UDEC program was successfully utilized to simulate the rock cutting process and obtain failure conditions [20]. Onate et al. [21] combined the discrete element method (DEM) with the finite element method (FEM) to study the dynamic problems of the geomechanics. Furthermore, the explicit finite element program, LS-DYNA, was successfully employed to explore the changes of the forces on the cutting heads [22] and the lateral pressure on the tool forces [23]. Rahman et al. [24] applied EDEM and MSC.ADAMS to simulate the steady-state cutting process and investigate the dynamic interaction, respectively. EDEM has been proved to be able to fairly simulate the macro behavior of sand particles in [25]. However, the above researches are mainly focused on ordinary rocks that are quite different from SMS.
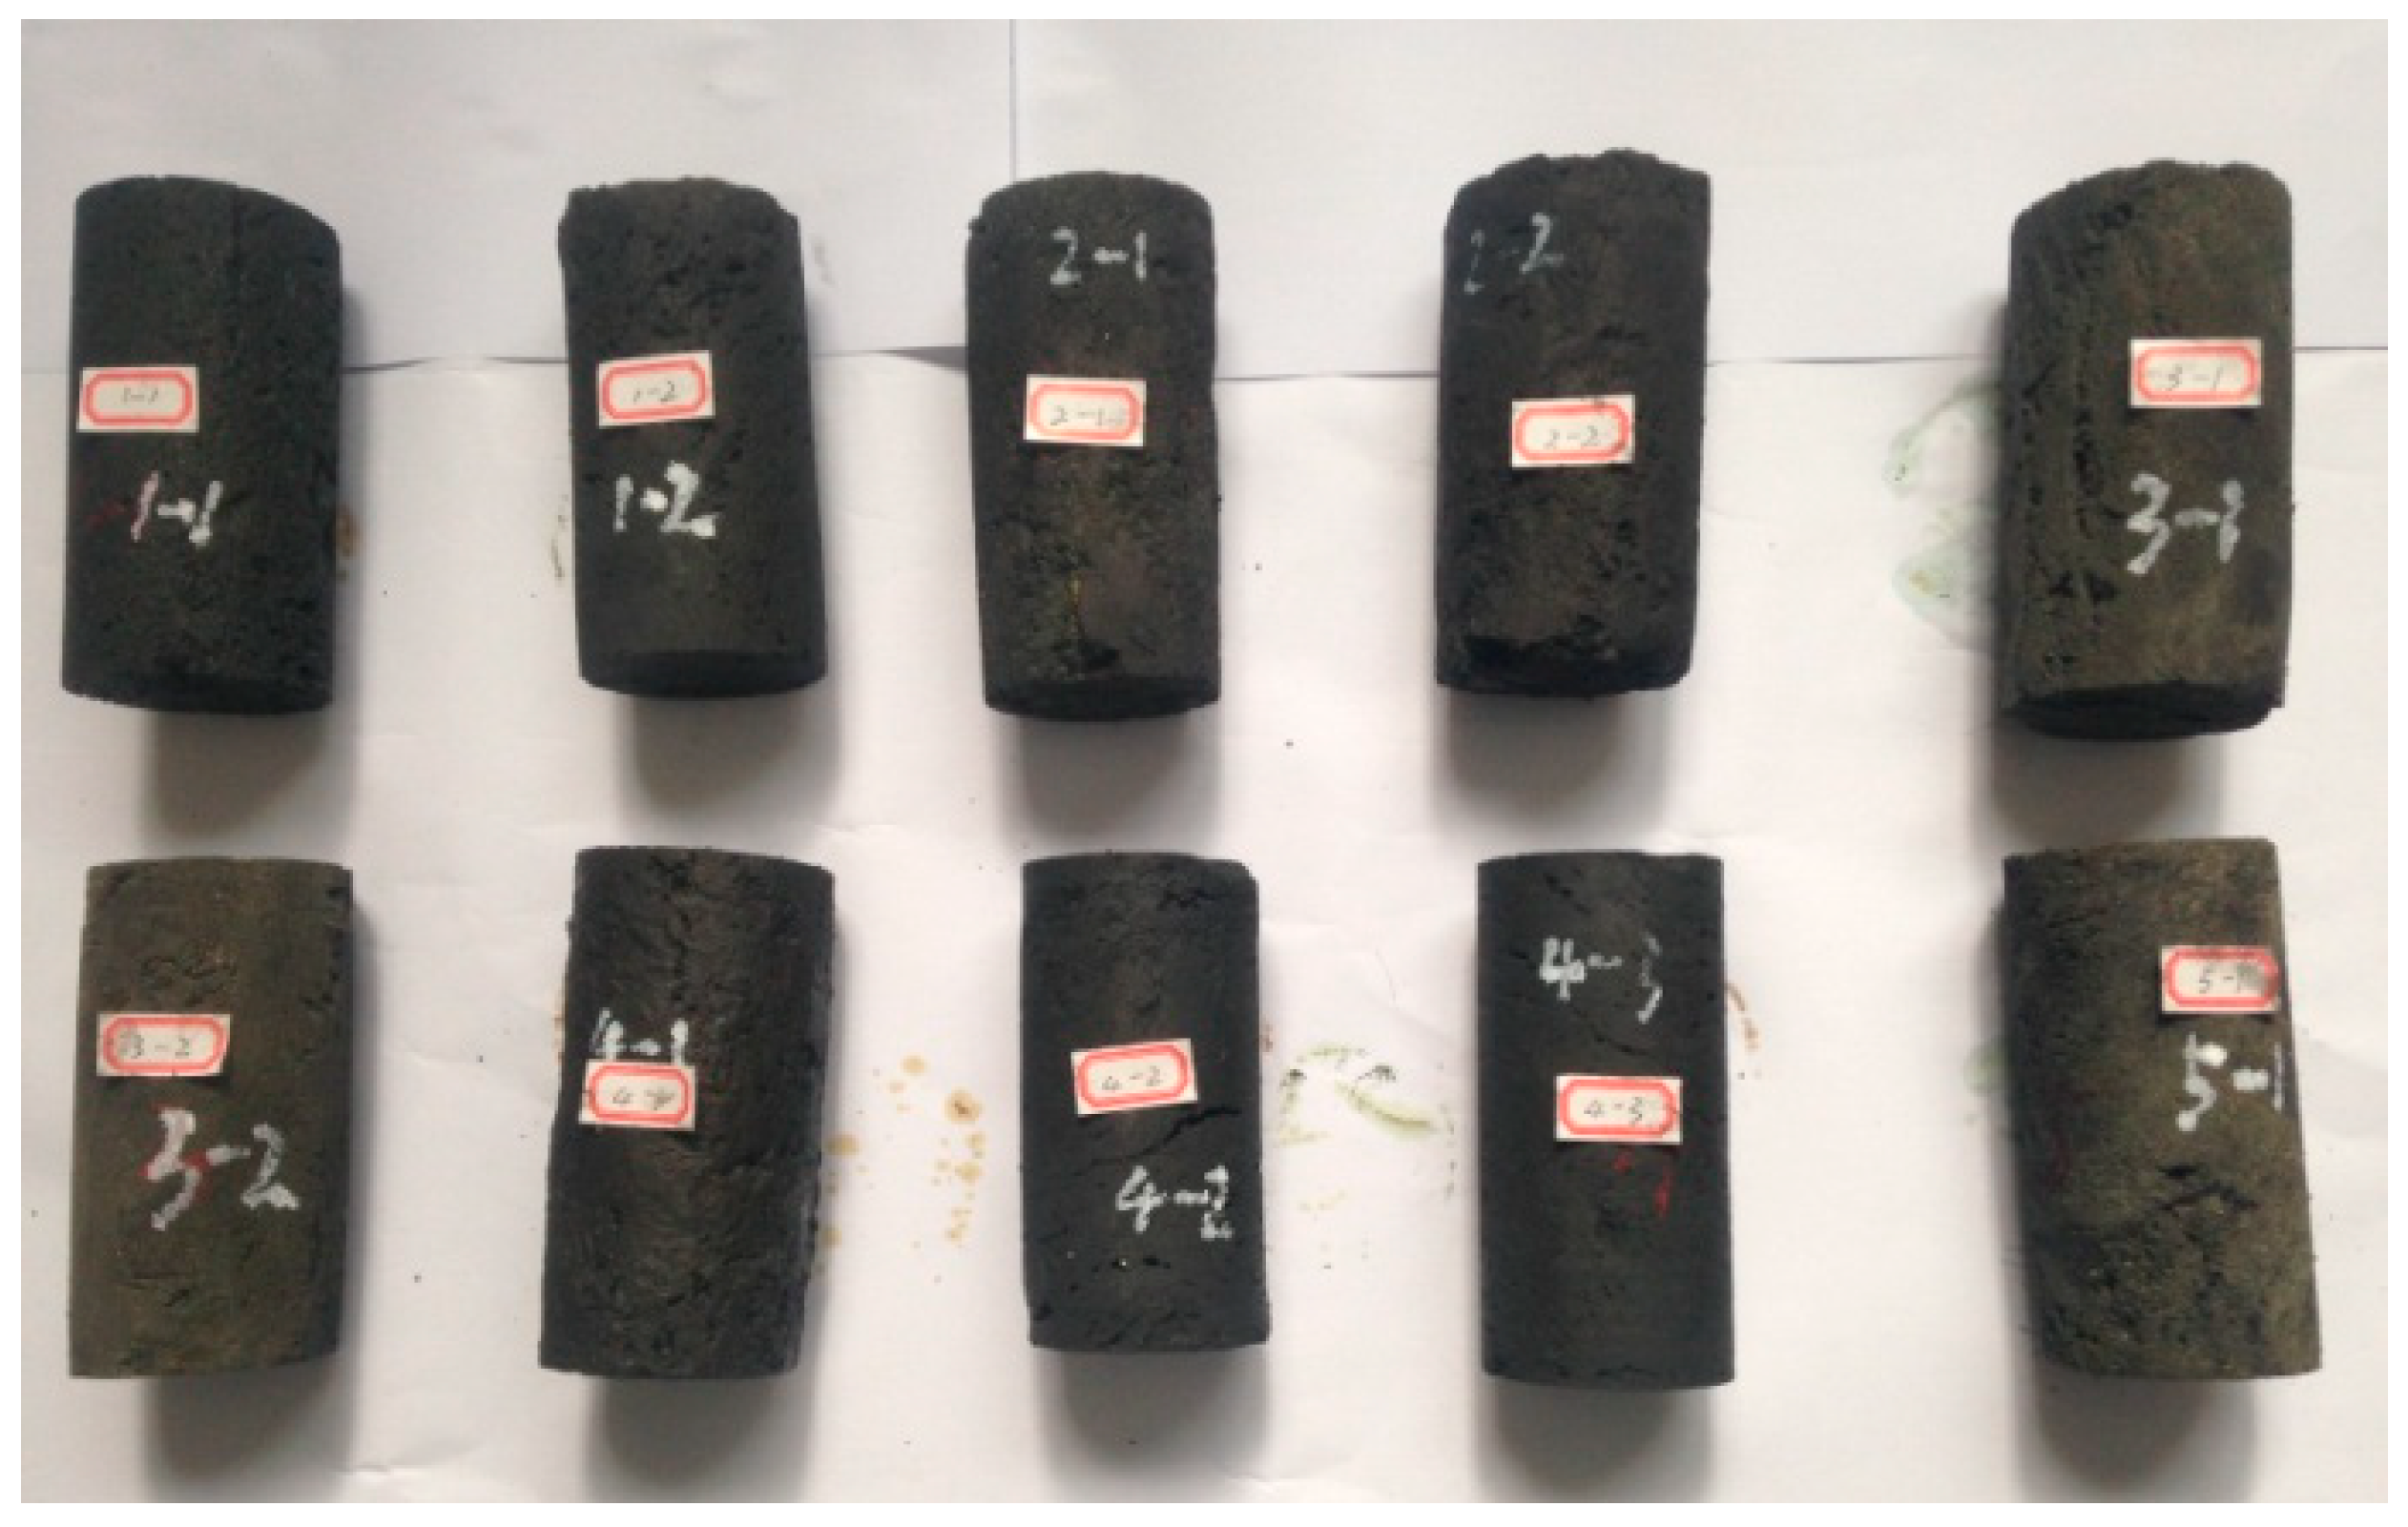
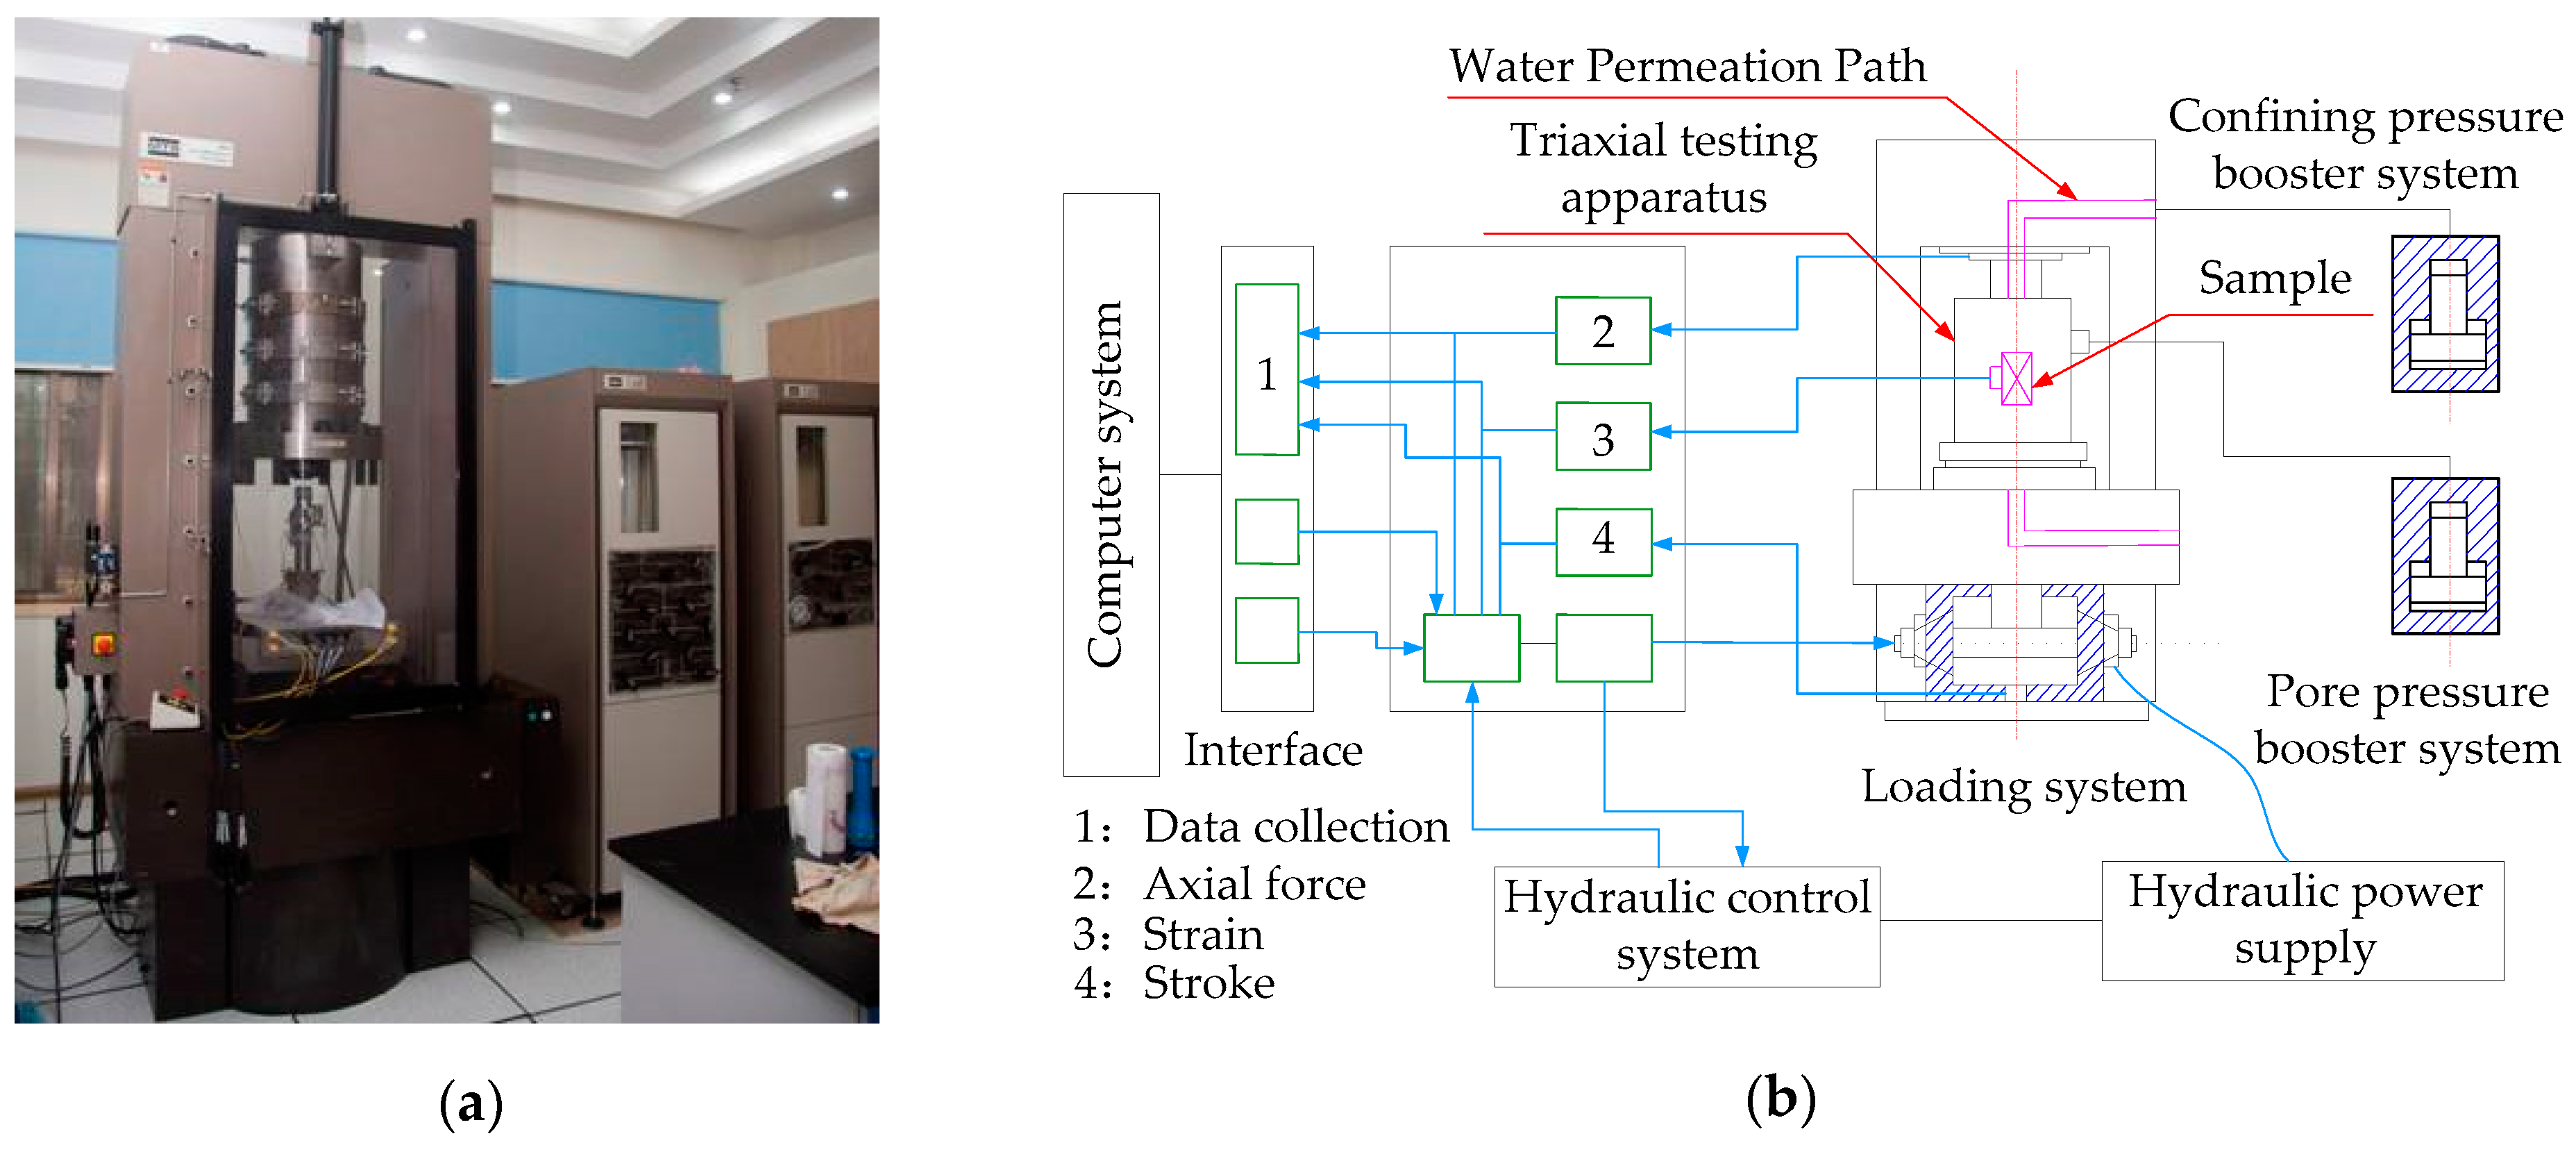
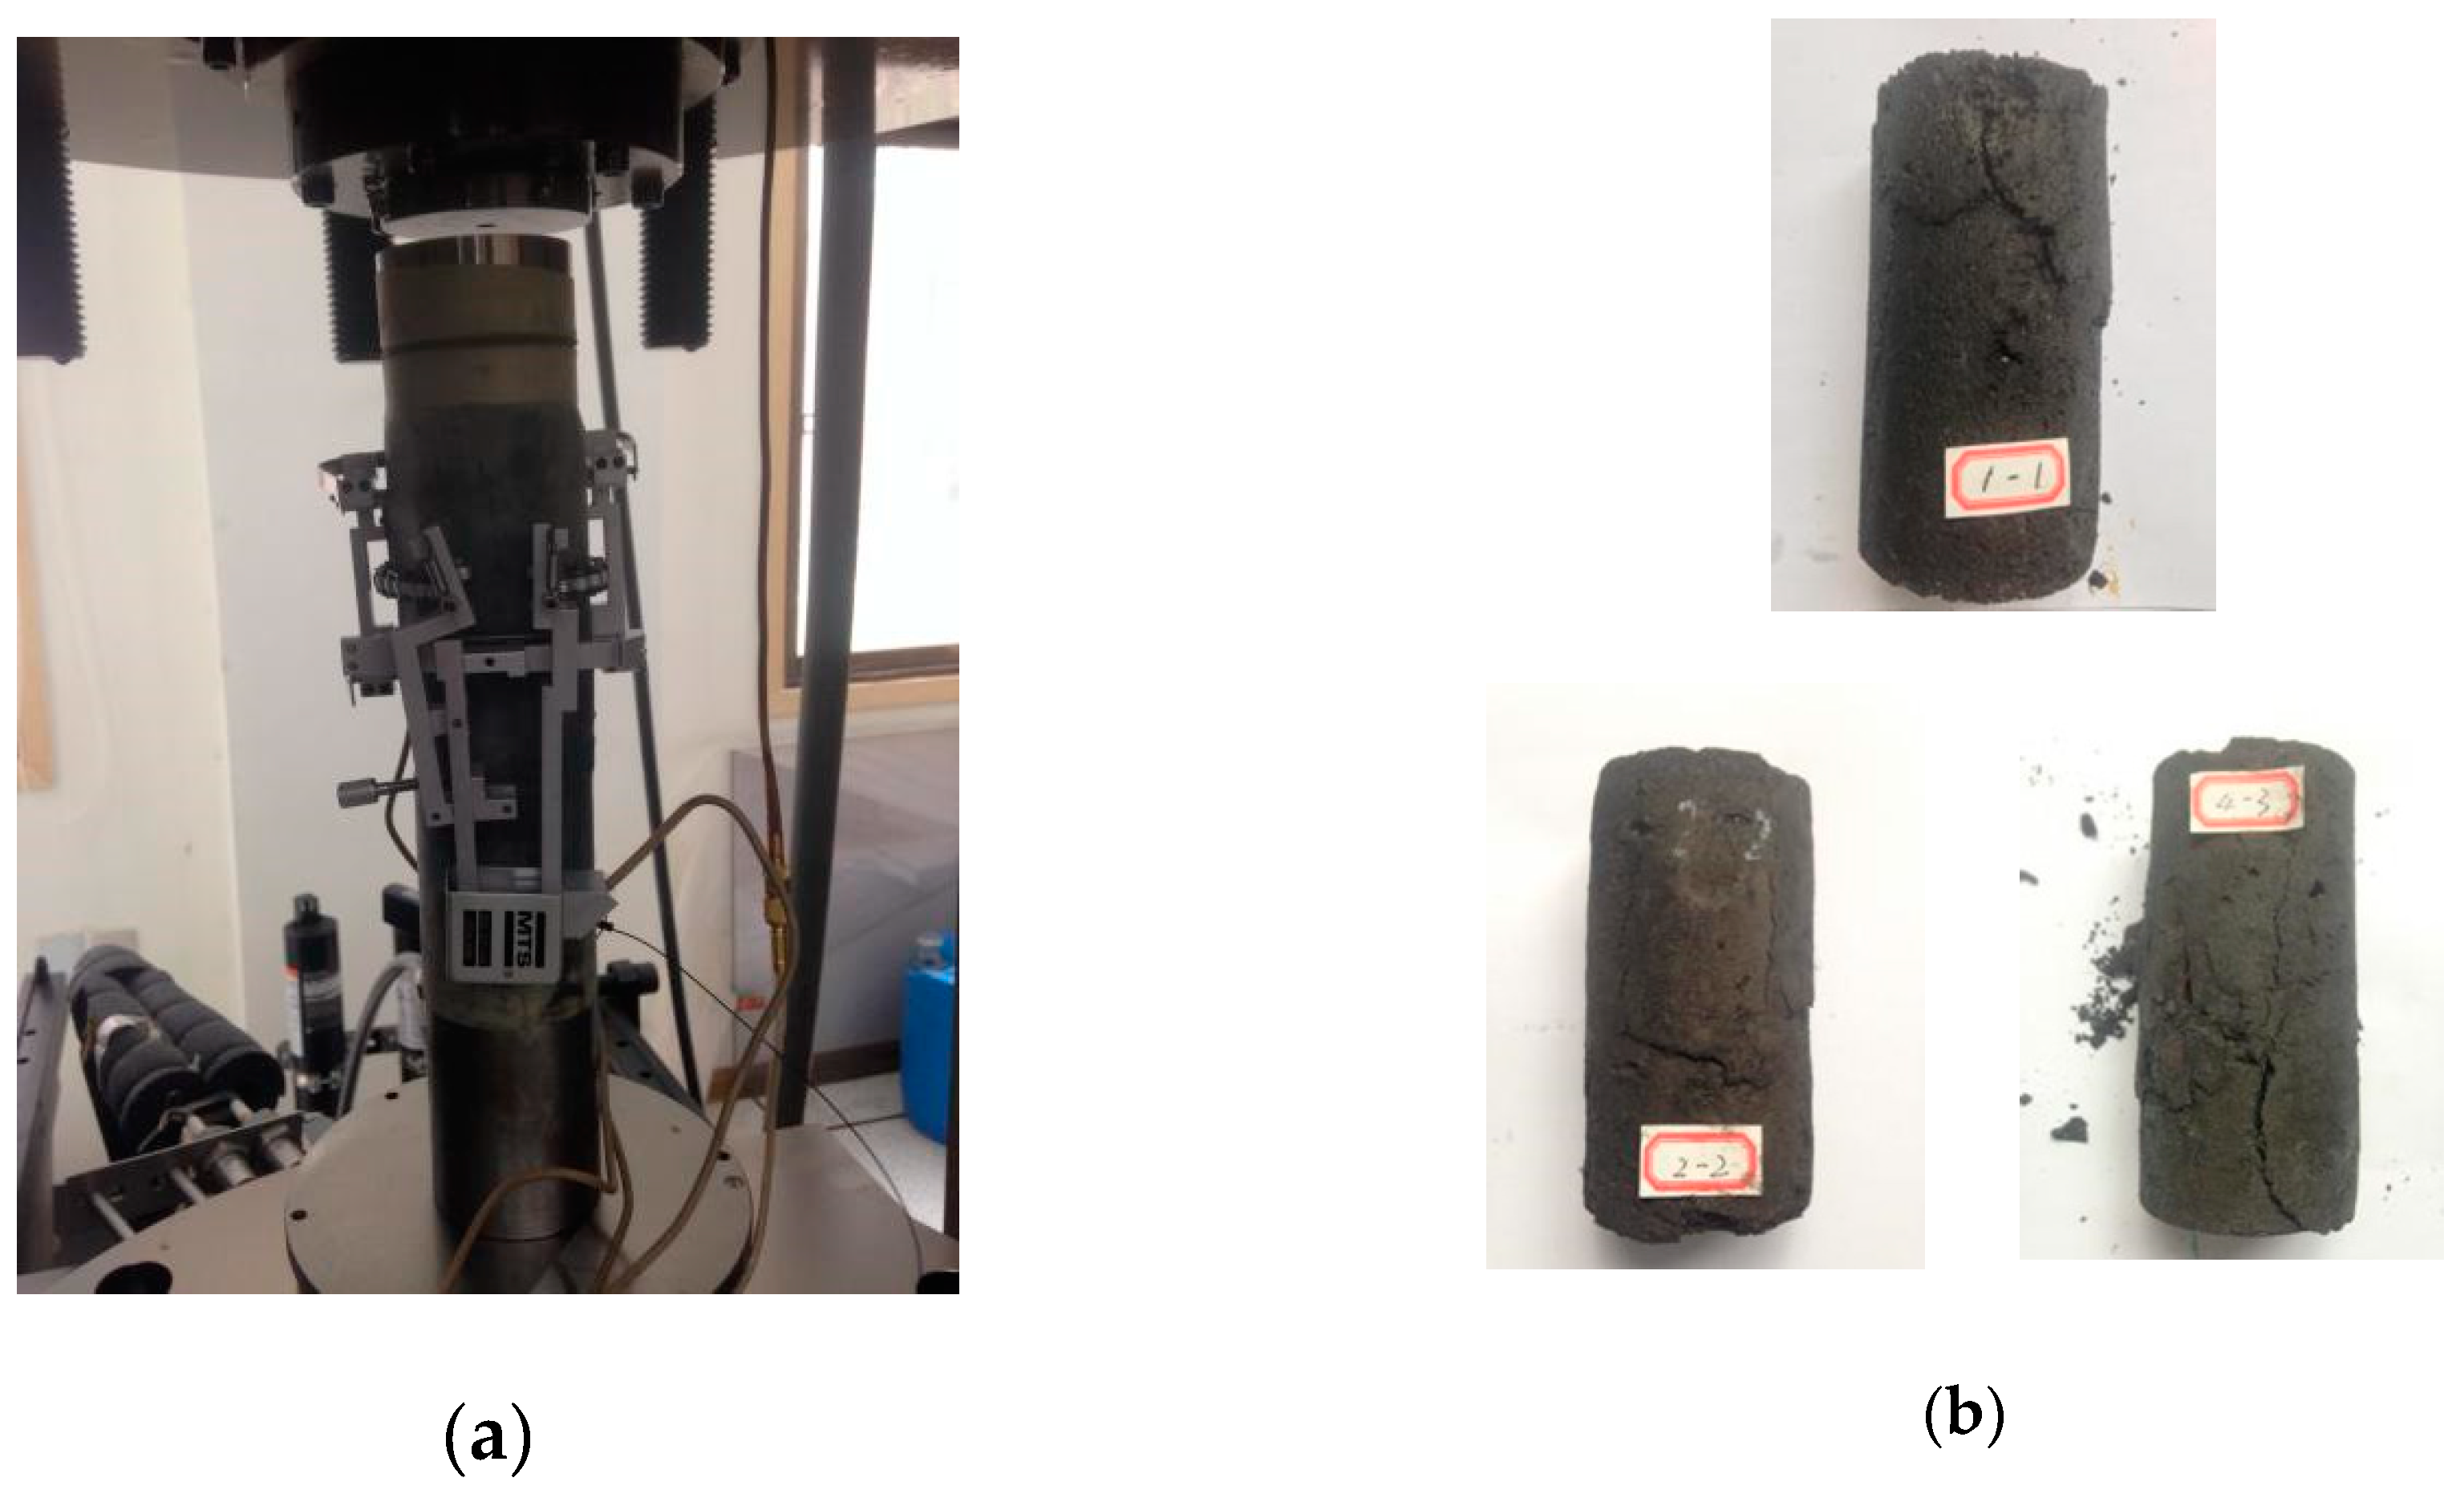
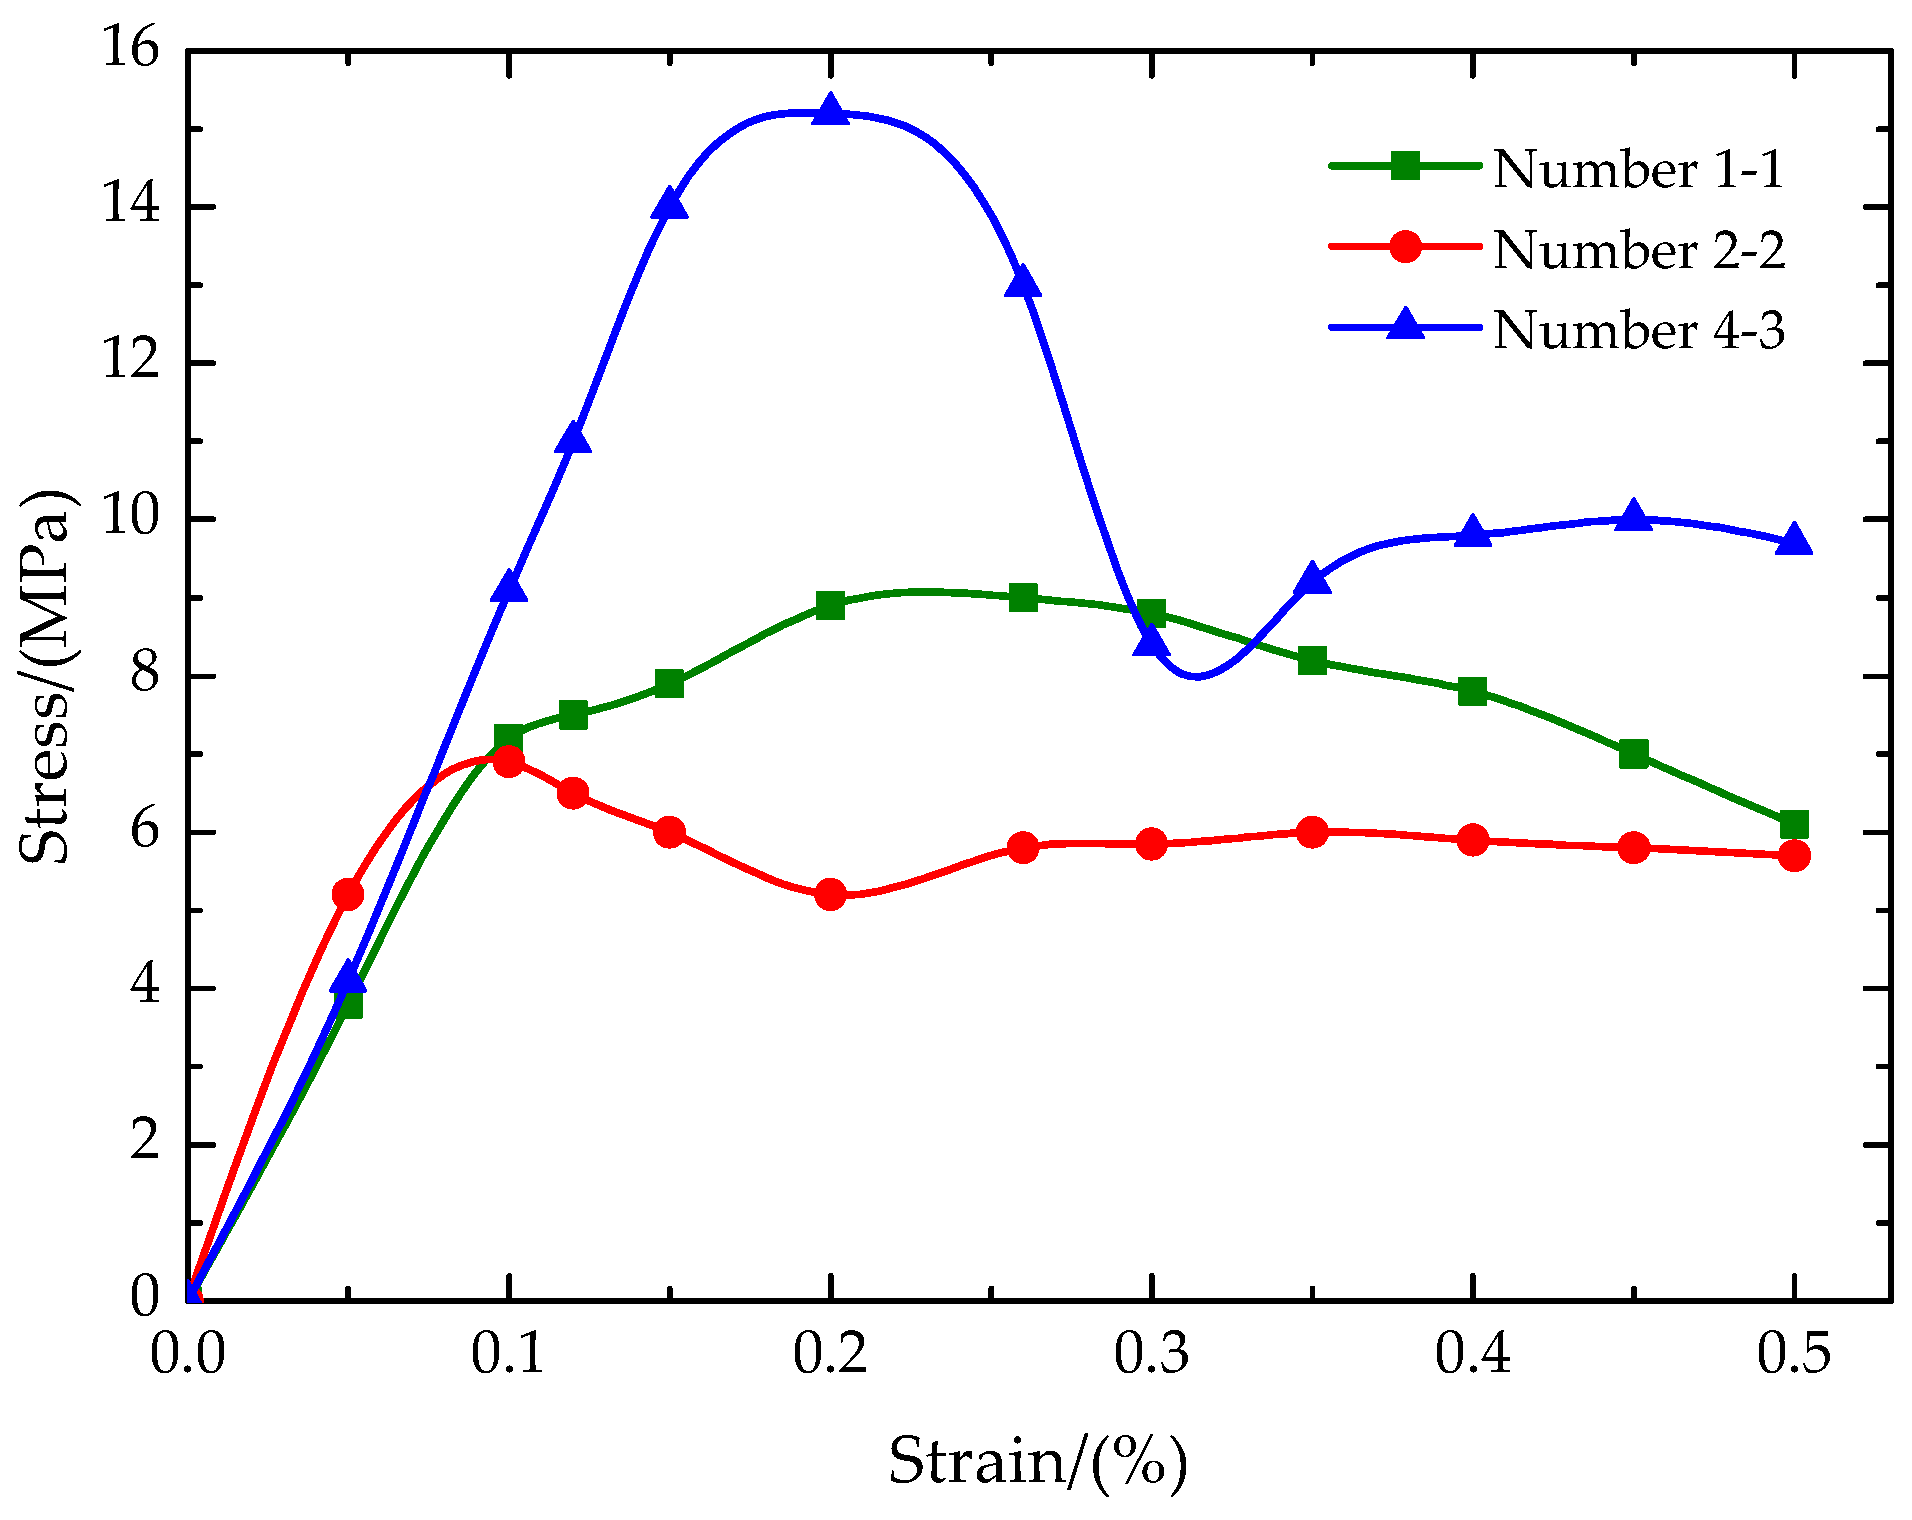
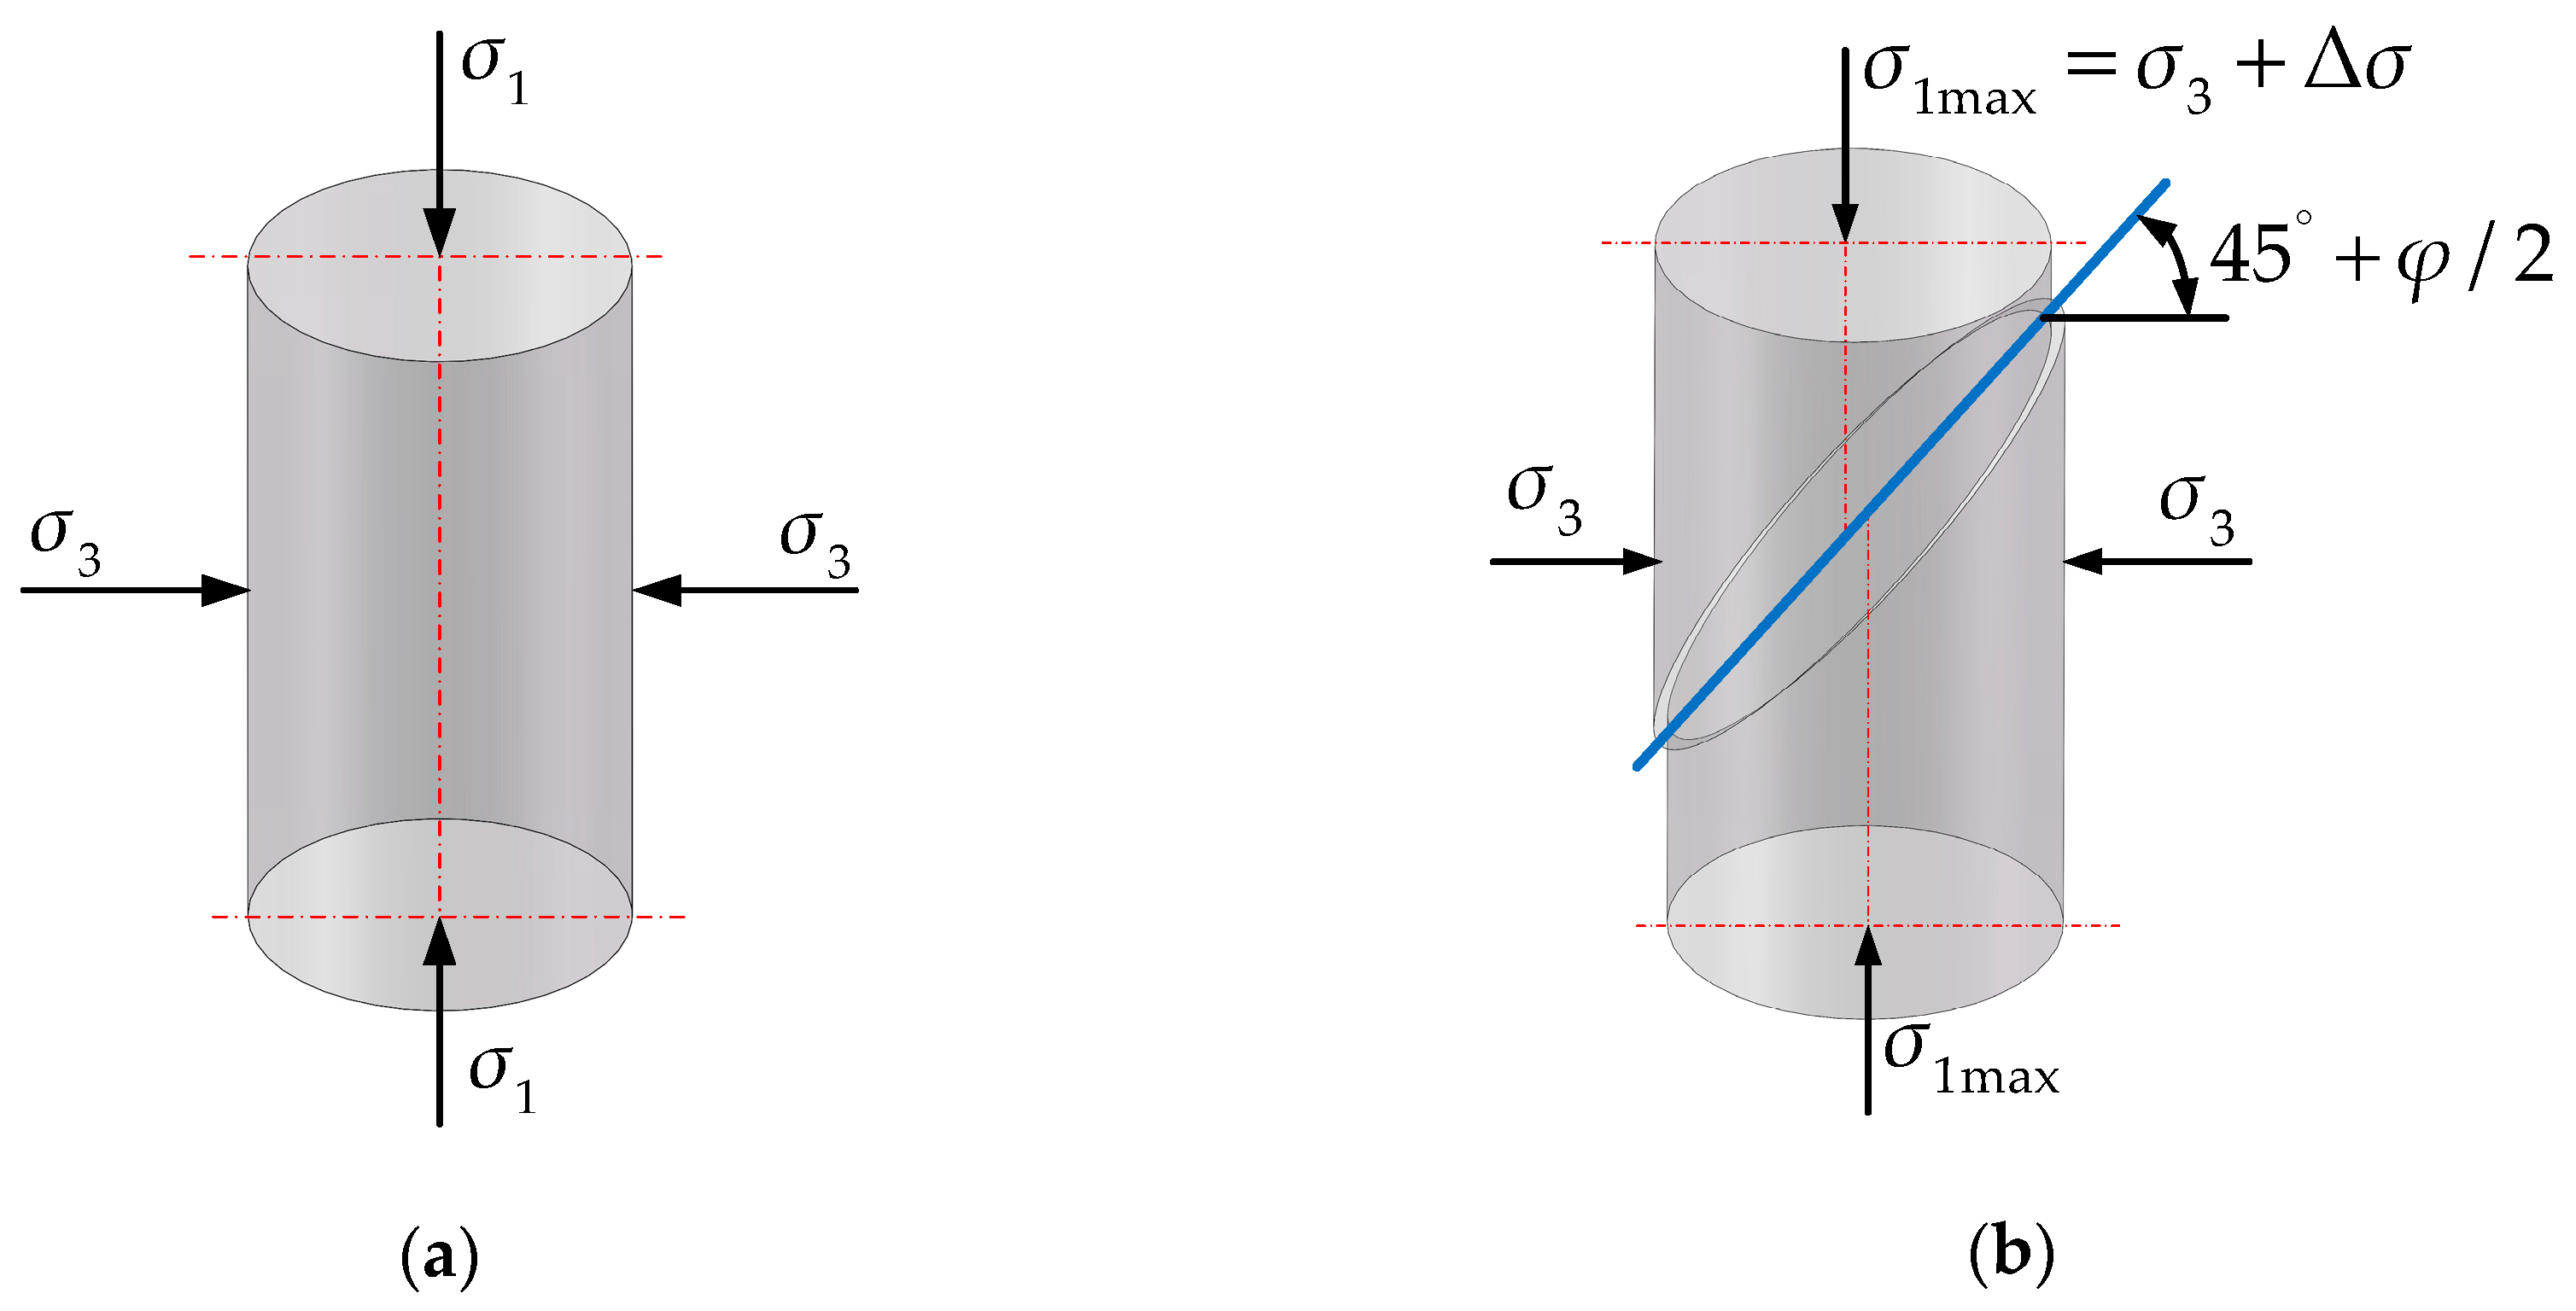
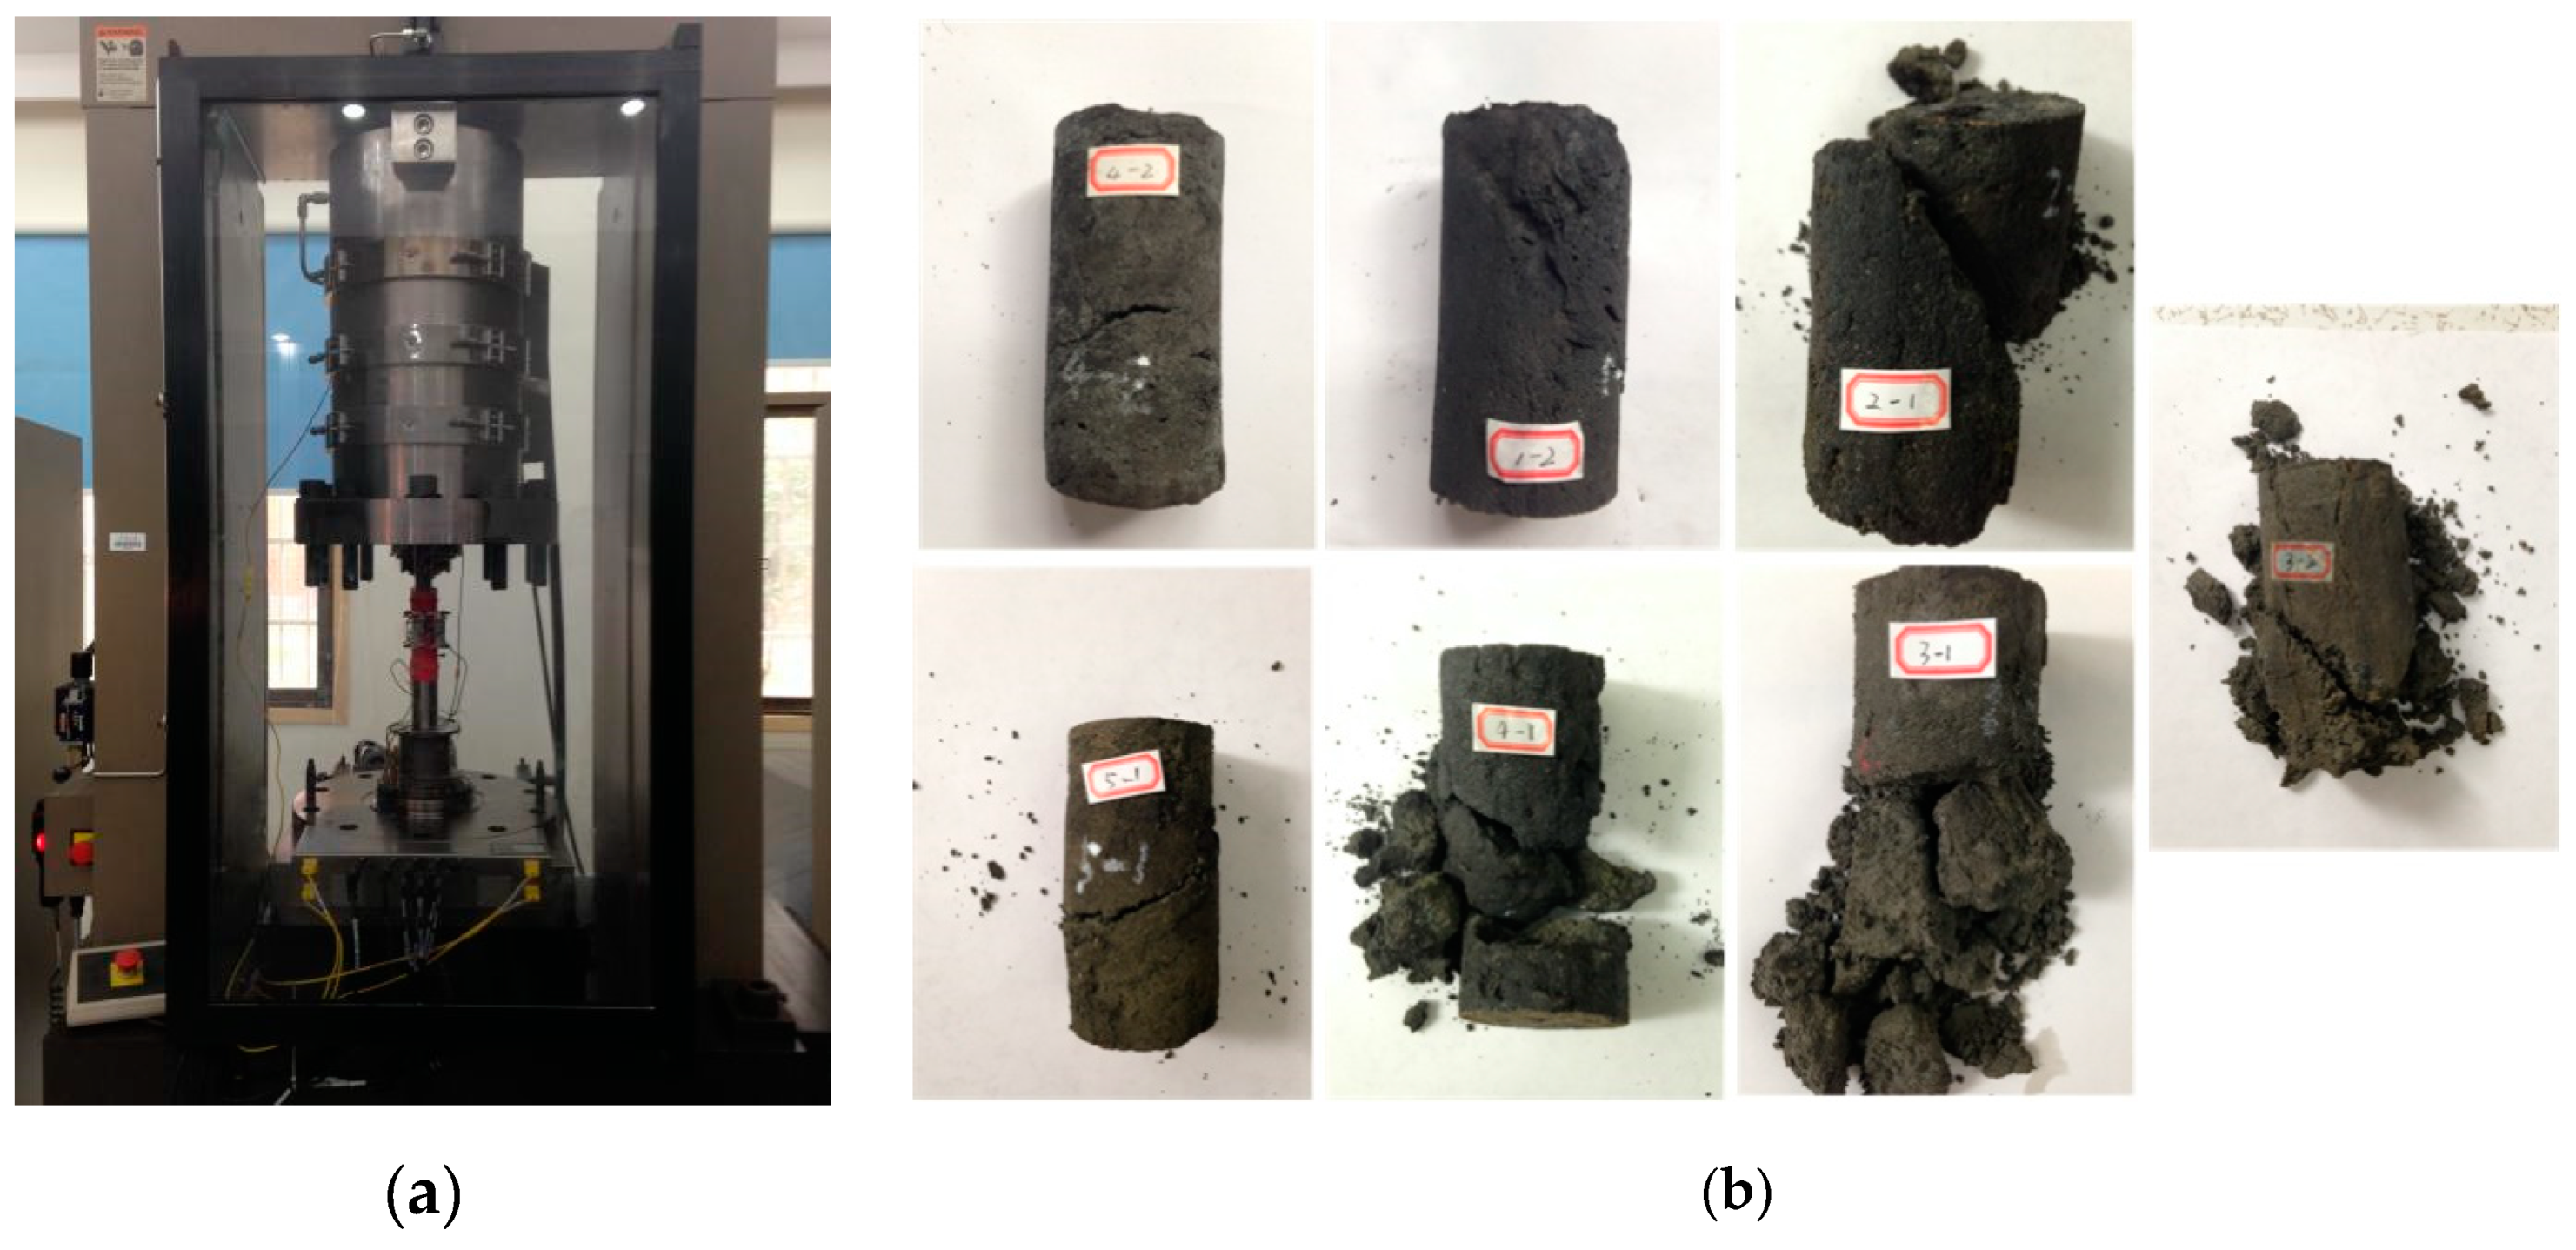
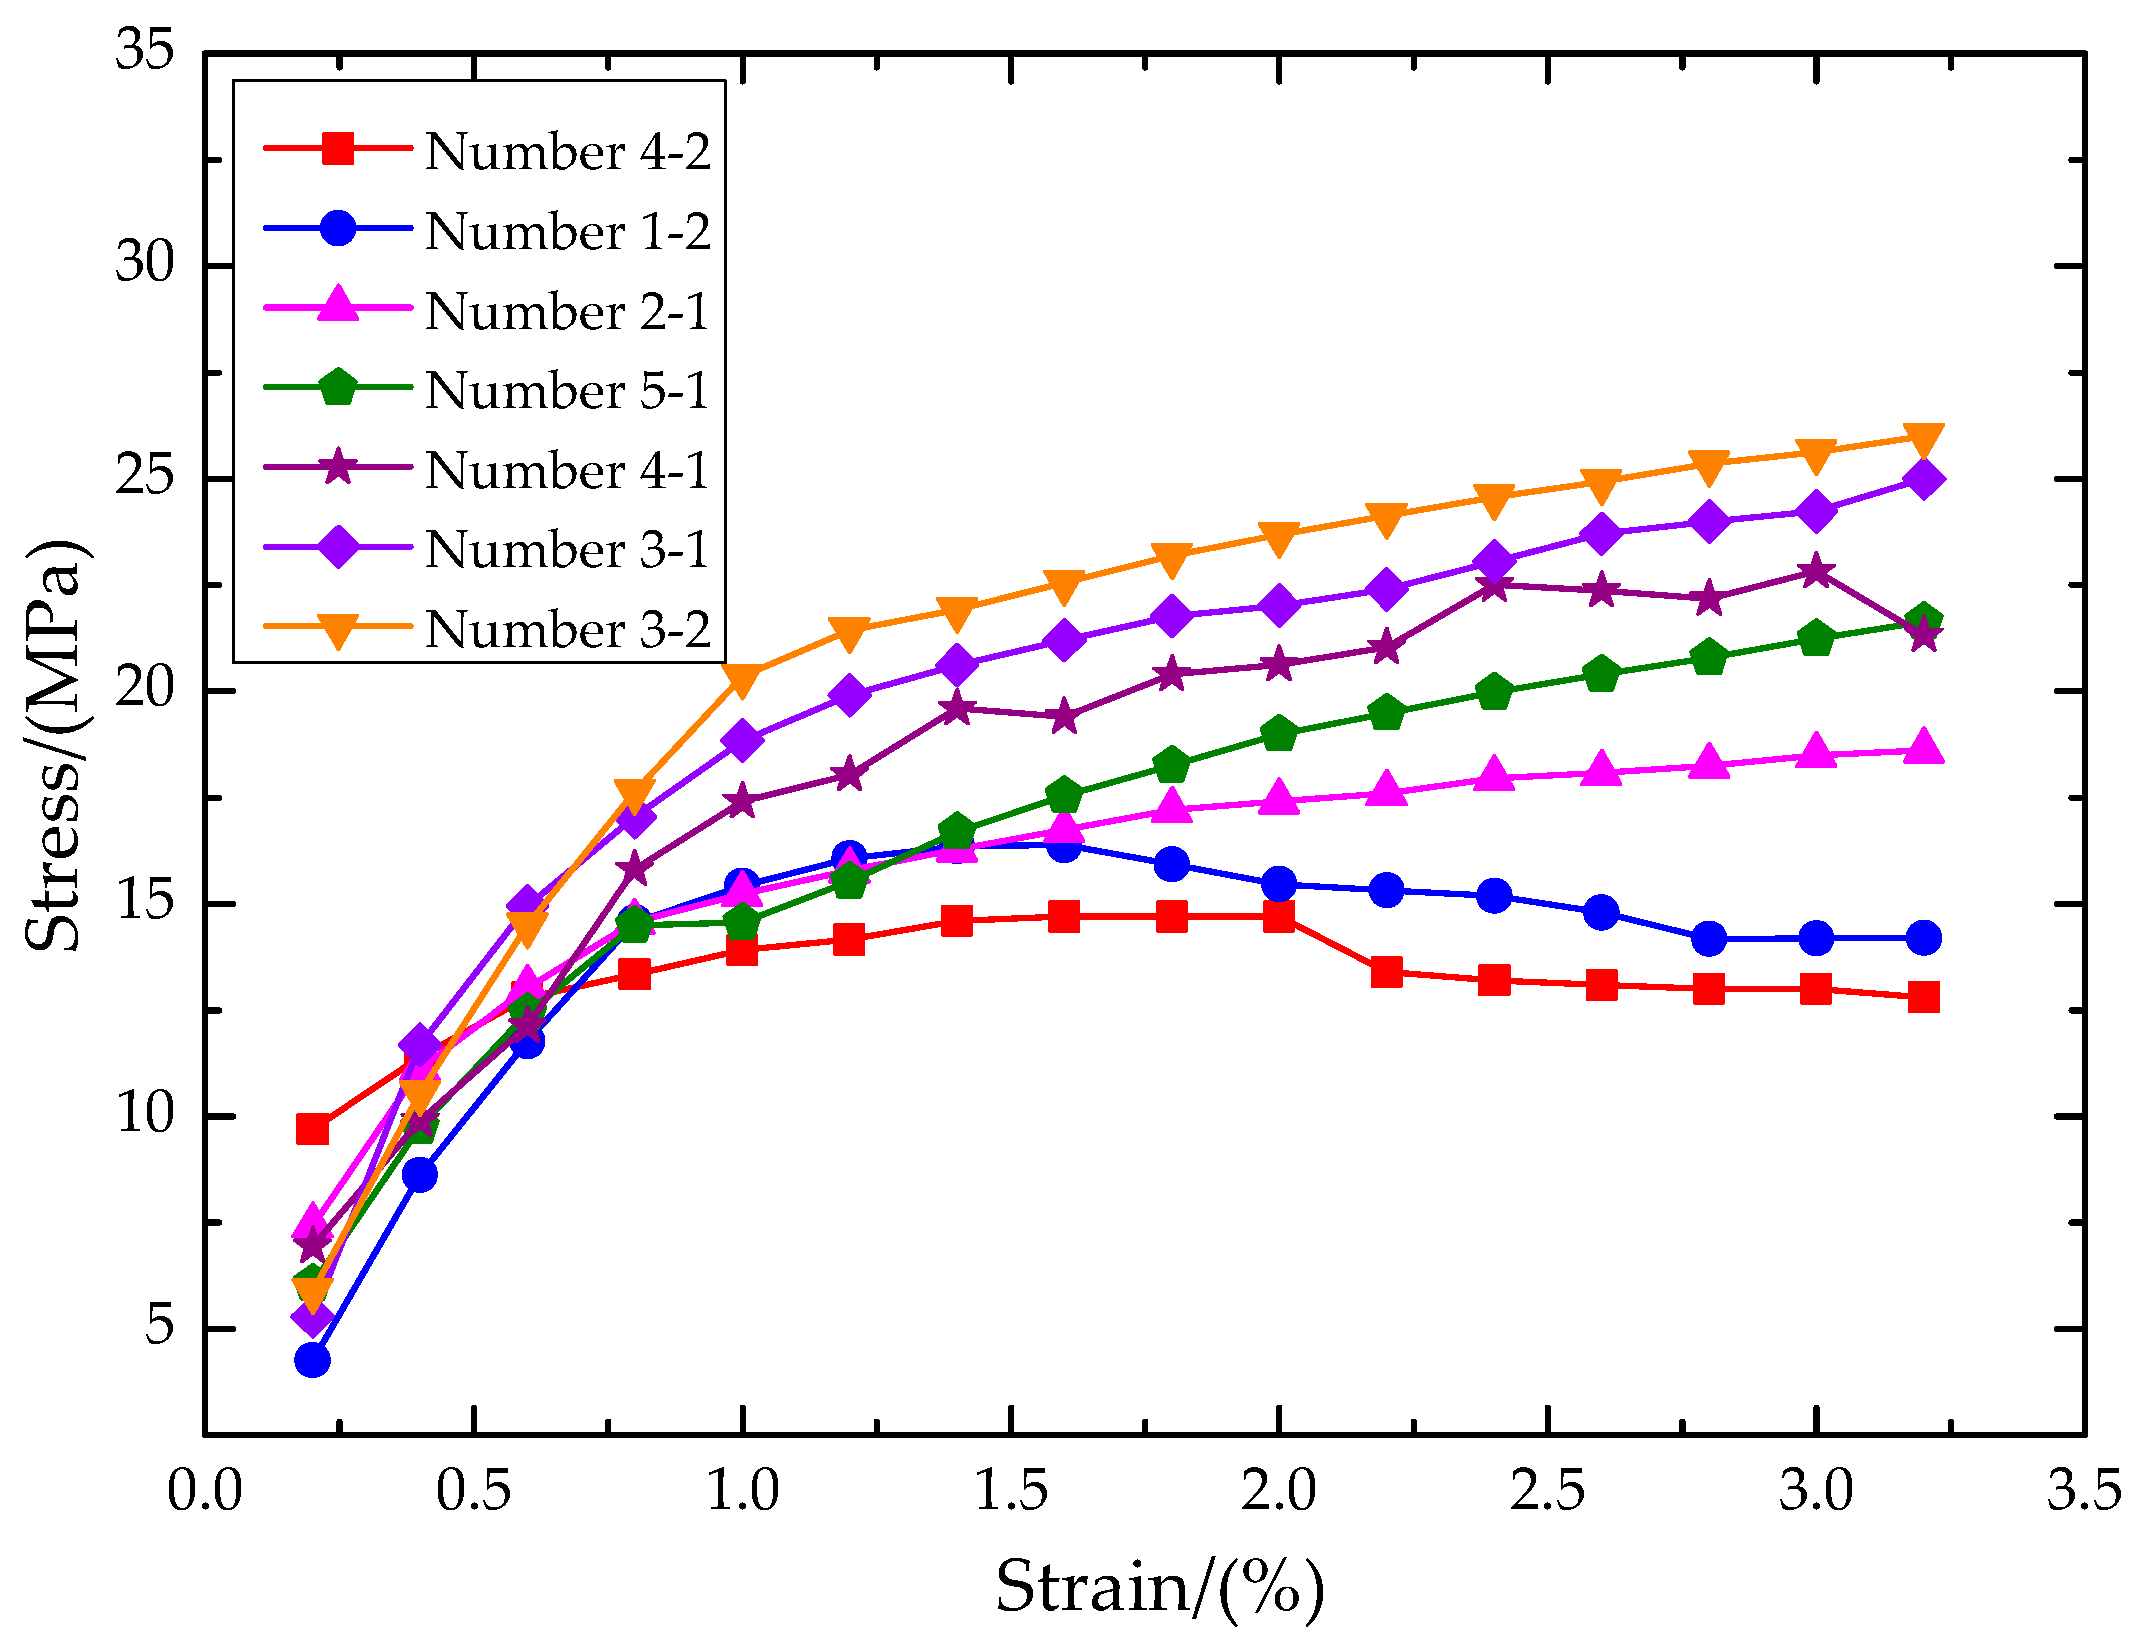
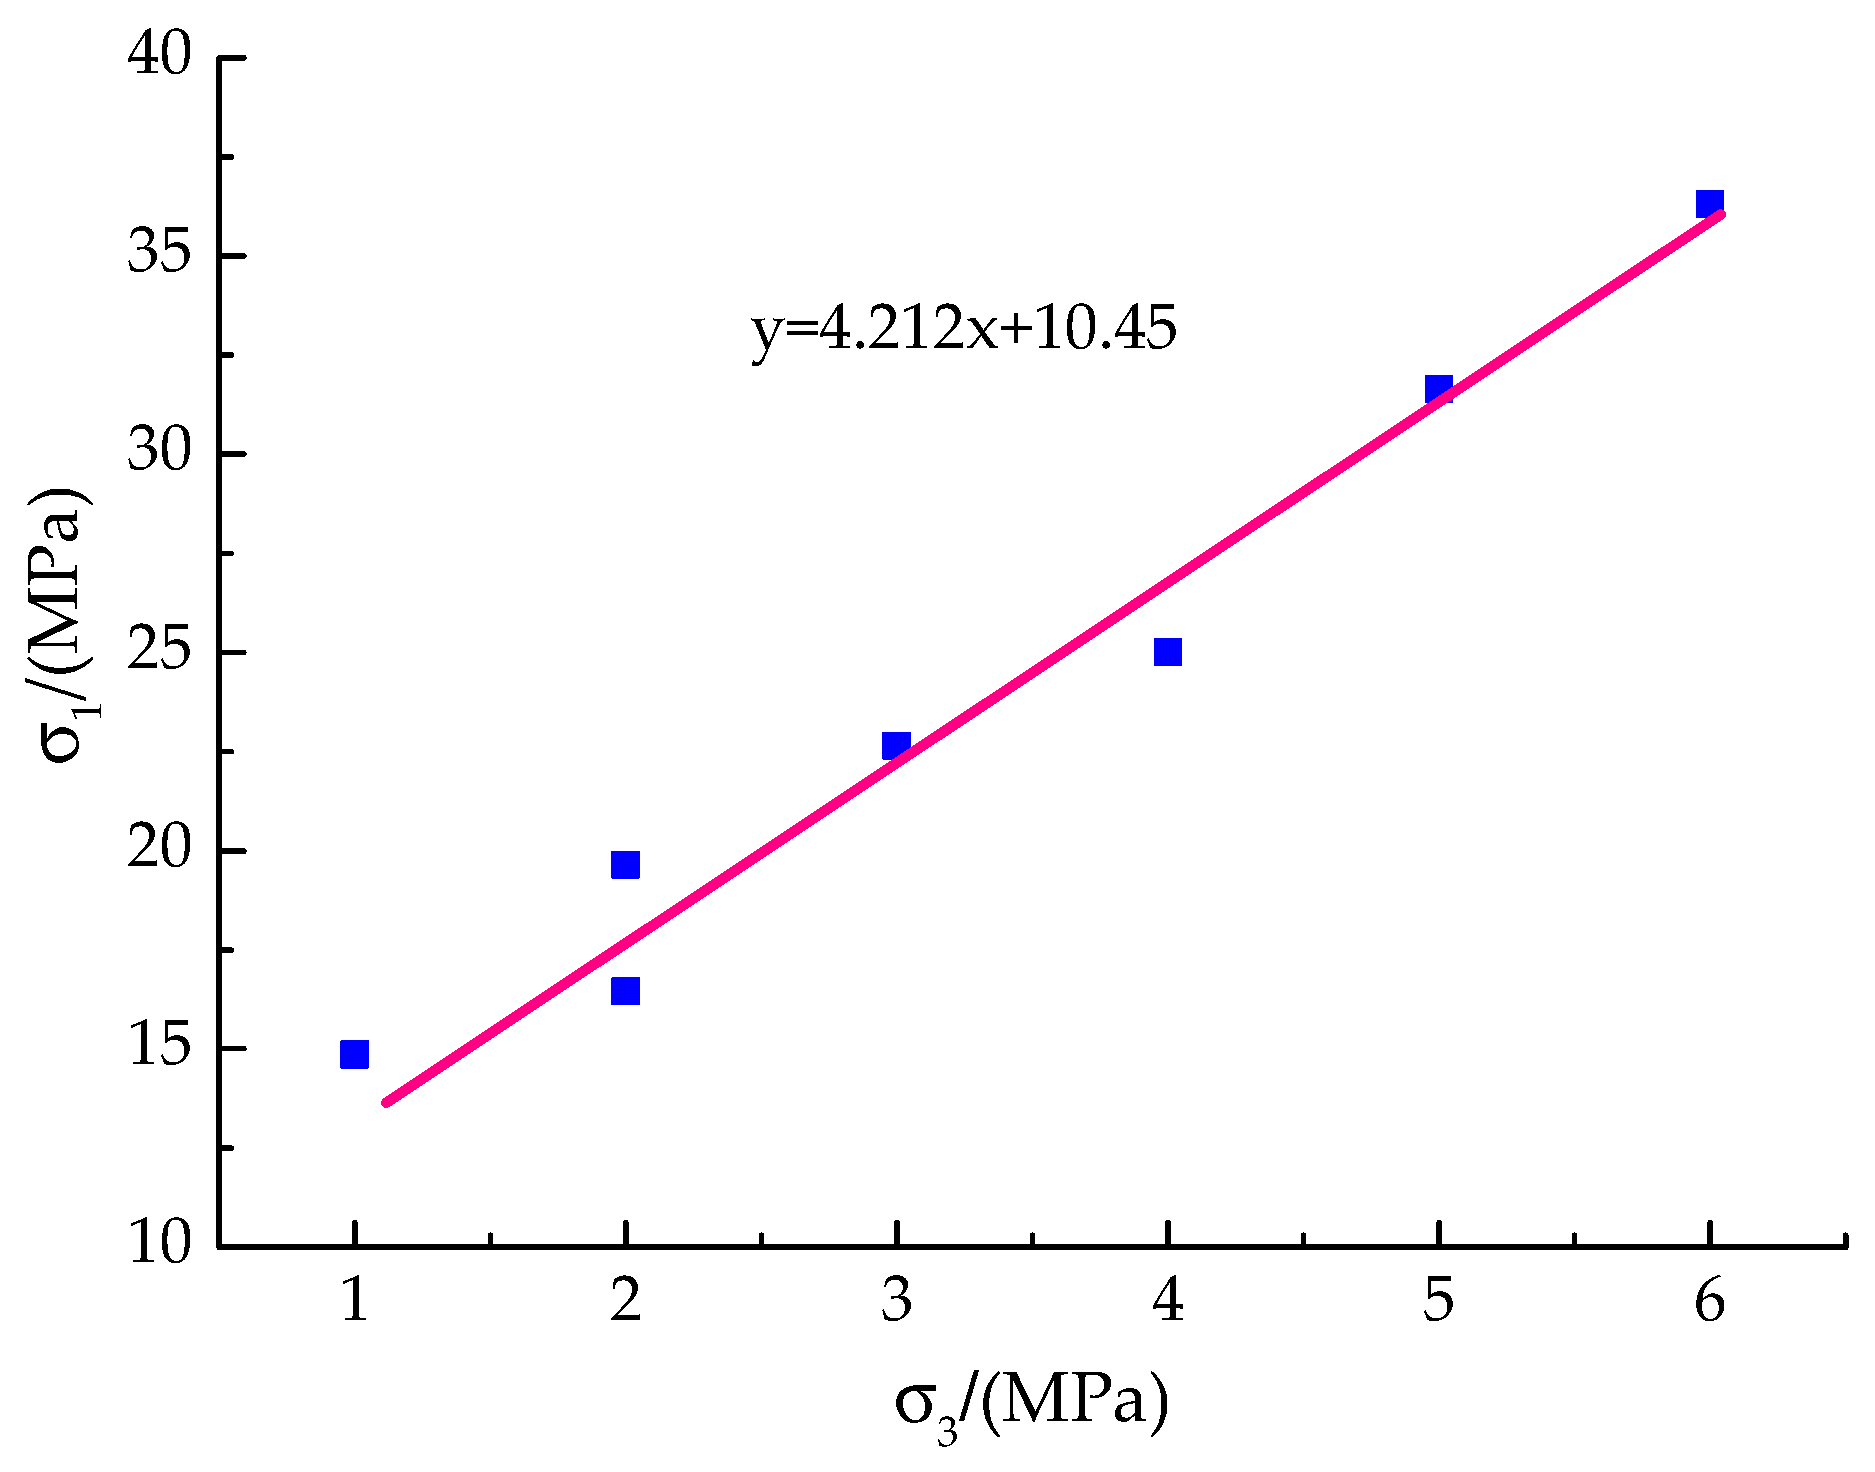
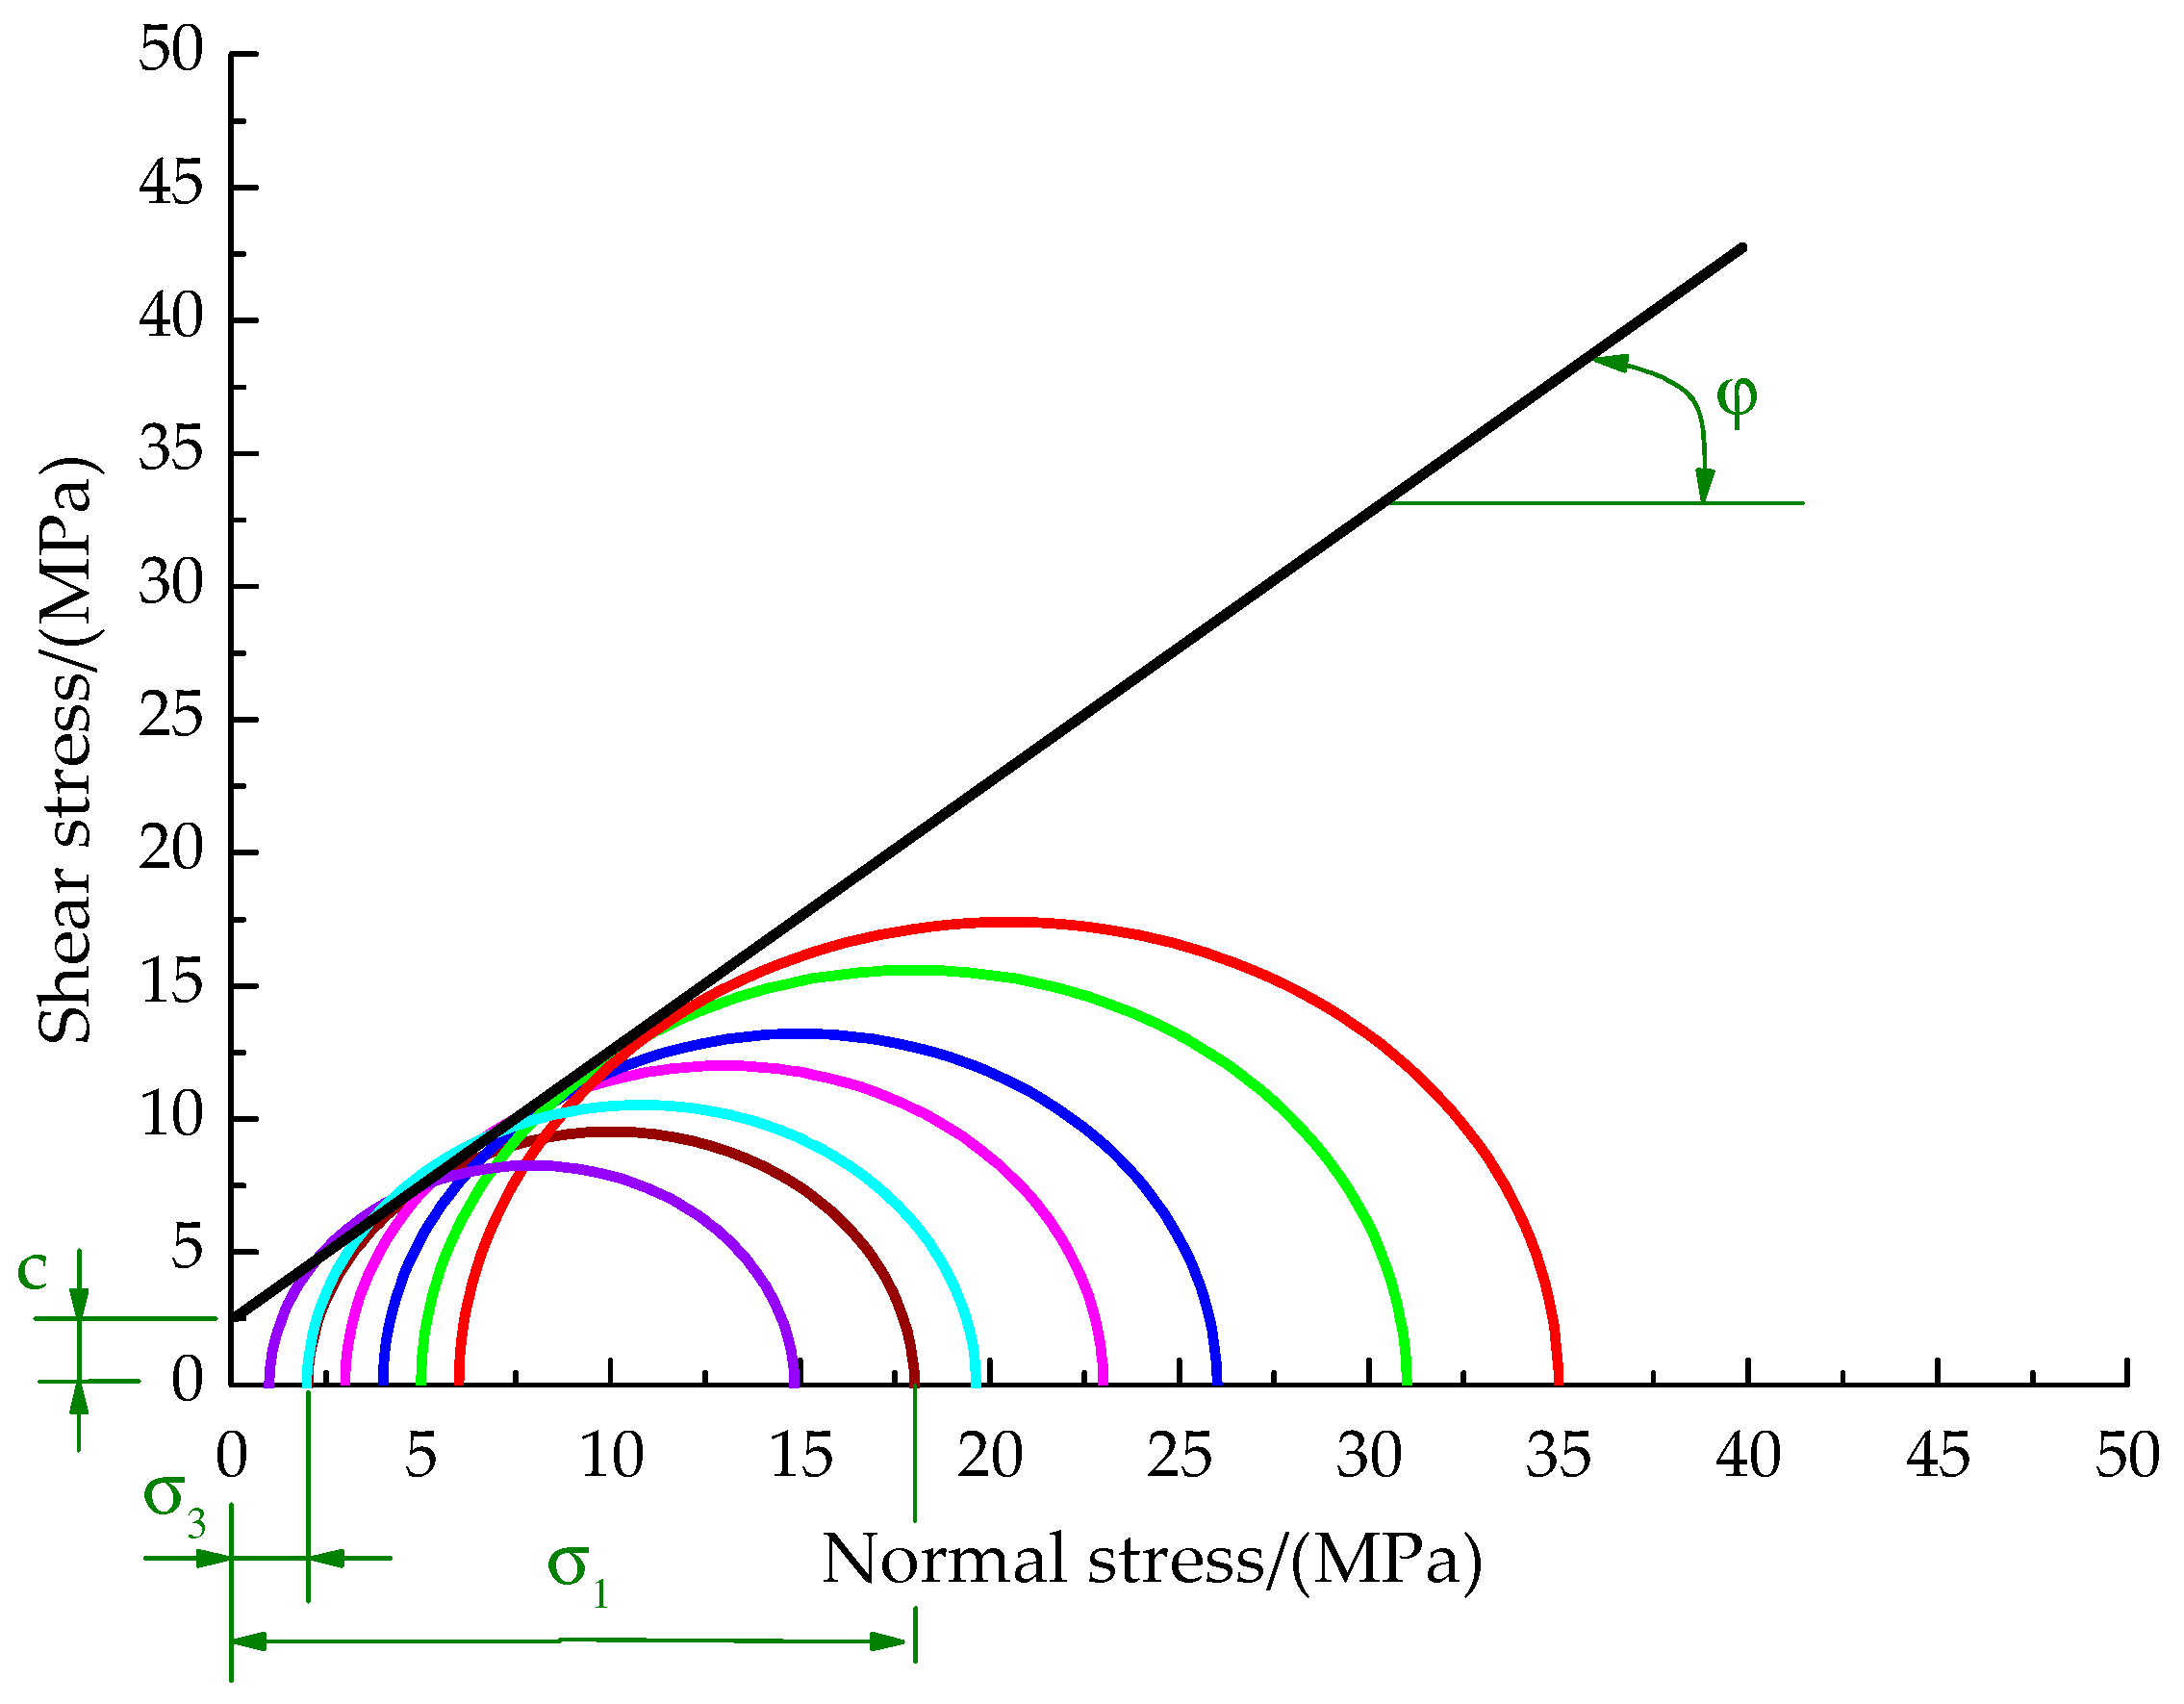
Summarizing the aforementioned, the existing researches clearly show that the investigations on the mechanical properties of SMS and the cutting forces under high hydrostatic pressure are limited and the further investigations are necessary. Therefore, this work starts with the uniaxial compressive strength (UCS) and triaxial compressive strength (TCS) tests to obtain the mechanical properties of sufficient SMS samples. Then, the micro properties are determined through a calibration process. Eventually, the cutting processes of single and two cutting picks are simulated, and the force variation on the cutting picks in the process is obtained.

2. Mechanical Properties Tests

In the research of the cutting and crushing process of SMS, it is necessary to determine the comprehensively key properties, including the internal friction angle, cohesion and compressive strength. However, those properties are difficult to obtain accurate values through existing theoretical equations. Hence, it is of great significance to accurately study the cutting and breaking mechanism under high confining pressure by the corresponding properties of SMS through mechanical properties tests. Additionally, some basic mechanical parameters in the tests, such as Poisson’s ratio and elastic modulus, need to be obtained.

2.1. Test Samples and Testing System

In order to obtain more accurate physical and mechanical properties of SMS, the real ore samples are necessary to be used for the tests. Therefore, our group applied to China Ocean Mineral Resources R & D Association to obtain approximately 40 kg of SMS samples, and parts of them are shown in Figure 1. The samples, from three segments of 20vii-s25-tvg21, 22iii-smar-s012-tvg0 and 26iii-s30-tvg12, basically met the preparation requirements in the mechanical properties tests owing to the characteristics of large quantity and large volume. Additionally, to ensure the accuracy of the test results, these samples were soaked in seawater for 48 h before the tests.
It is known that the compressive strength tests have strict requirements on the size and shape of test samples. Considering the stress distribution and economy, the samples were processed into the standard cylinders with a height to diameter ratio of (2 − 2.5):1, as shown in Figure 2. The main mineralogical compositions of the samples were obtained by chemical composition analysis, as shown in Table 1. Comparing with the mineralogical composition of the SMS in the published literature, it can be considered that the samples are representative of larger SMS units. As can be seen from Table 1, the content of Cu and Fe in Number 4-3 is significantly higher than that in Number 1-1 and 2-2, thus, the theoretical compressive strength is also higher than that in Number 1-1 and 2-2 in the UCS test. Similarly, in the TCS test, the content of Cu from high to low is Number 3-2, 5-1, 1-2, 2-1, 4-1, 3-1 and 4-2 in turn, the theoretical principal stress and peak load are also higher.
All tests were performed by the MTS815 Electro-hydraulic Servo-controlled Rock Mechanics Testing System (shown in Figure 3a) in the Modern Analysis and Test Center of Central South University (CSU). The entire test process, as well as the collection and processing of relevant data, were completed by the computer system. The testing system is mainly capable of the uniaxial tensile test, compressive test, shear test, bending strength test and TCS test at normal and high temperature. Additionally, the basic operation principle and the main performance indexes of the testing system are demonstrated in Figure 3b and Table 2, respectively.

2.2. UCS Test

The main processes of the UCS test are as follows: firstly, the sample was preloaded with 0.1 KN to make full contact with the testing platform. Then, the axial stress was applied to the sample and gradually increased until the sample failed under the condition of no confining pressure. During the test, the load acting on the unit area of the sample is called compressive strength, which is defined as the ratio of the critical load to the cross-sectional area perpendicular to the loading direction. The relationship can be expressed as:
R = P A ,
where R is the UCS of SMS, MPa; P is the failure load, N; A is the cross-section area perpendicular to the loading direction, mm2.
During the UCS test, the static deformation parameters can be measured synchronously to obtain the strain-variable and calculate the elastic modulus E and Poisson’s ratio μ . Figure 4 and Table 3 illustrate the failure samples and the corresponding data monitored in the test, including the UCS, elasticity modulus and Poisson’s ratio.
As Table 3 shows, the UCS, elastic modulus and Poisson’s ratio of the SMS samples are 10.243 MPa, 11487 MPa and 0.11, respectively. Furthermore, the UCS in Number 4-3 are greater than that in Number 1-1 and 2-2, which is consistent with the theoretical analysis results of metal content. Therefore, this further verifies that the samples in this paper can better represent SMS in term of mechanical behavior. Figure 5 demonstrates the stress variation with the strain of the three groups of samples in the UCS test.

2.3. TCS Test

The massive sulfides deposits on the seabed are in the state of high hydrostatic pressure [7,8,17], that is, in the state of triaxial stress. Therefore, the TCS test based on the Mohr-Coulomb criteria is suitable for investigating the mechanical properties of SMS. The main processes of the test are as follows: firstly, similar to the UCS test, the sample was preloaded to make full contact with the testing platform. Secondly, different constant confining pressures σ 3 (corresponding to the minimum principal stress σ 1 min ) were set around each sample. Then, the confining pressure was kept constant, and the axial uniform pressure σ 1 was applied to the sample and gradually increased, as shown in Figure 6a. Finally, when σ 1 increased to the critical value σ 1 max , shear failure occurred to the sample, as shown in Figure 6b.
TCS tests were conducted on seven groups of samples with different confining pressures, and the failure samples are demonstrated in Figure 7b. Meanwhile, Table 4 shows the confining pressure σ 3 (the minimum principal stress) and the maximum principal stress σ 1 of each sample in the test. As Table 4 shows, the distribution of peak load and principal stress σ 1 from high to low satisfies the theoretical results of mineralogical composition, which further validates that the mechanical behavior of the samples can be on behalf of SMS.
Based on the special environment of deep sea, the TCS test in this paper was performed under the special conditions of triaxial stress state and equal lateral pressure. The relationship between the stress and corresponding strain monitored in the test is illustrated in Figure 8.
Figure 9 illustrates the optimal fitting straight line with the maximum principal stress σ 1 as the y-coordinate and the minimum principal stress σ 3 (confining pressure) as the x-coordinate. Several groups of the corresponding values on the fitting straight line are chosen, and the ultimate stress circles (Mohr stress circles) were drawn with ( σ 1 + σ 3 ) / 2 as the center and ( σ 1 σ 3 ) / 2 as the radius in the coordinate system of the normal stress σ and the shear stress τ .
Figure 10 illustrates the envelope of the shear strength obtained by making the common tangent line of the Molar stress circles. According to Mohr-Coulomb strength theory, the shear strength parameters of rock under triaxial stress are determined [26,27,28]. In this coordinate system, the internal friction angle φ of the sample is the included angle between the common tangent line and the abscissa axis, and the cohesion force c is the interception of the common tangent line in the vertical axis direction. Eventually, according to Figure 10, the internal friction angle φ and the cohesion c of the SMS are 38.04° and 2.447, respectively.

3. Numerical Simulation

Particle flow code in three dimensions (PFC3D) based on the discrete element method (DEM) is an effective means to simulate the rock cutting. It provides the rigid particle collection of the rock modeling including the fault, the discontinuity and the crack, which has been widely used to investigate the movements and interactions between the particles in the rock mechanics, the fluid mechanics, the particle material, etc. [17,18,19]. In this paper, PFC3D was utilized to simulate the cutting and crushing process of SMS, and the failure process and the force on the cutting pick are mainly studied. Additionally, the following assumptions are made in the numerical simulations.
  • All particle elements are spherical;
  • All particle elements are ideal rigid bodies in any time step, that is, they only translate and rotate in space, while the size and geometry of particle elements remain unchanged;
  • When the contact of particle elements occurs, the overlap is allowed at the contact point. Moreover, the range of the contact is infinitesimal, that is point contact;
  • The intergranular forces of the particle elements are expressed by tangential force and normal force.
Figure 11 indicates the calculation cycle of PFC3D. In the calculation process, Newton’s second law and Force-displacement law are applied in every time step to update the position, velocity and acceleration of the discrete elements or walls, so as to simulate the movement of the discrete elements.

3.1. UCS Simulation

The difficulty in using PFC3D to simulate the rock cutting is that the input characteristics cannot be obtained directly from the laboratory tests. The unknown micro properties corresponding to the measured macro-properties in the laboratory test must be confirmed through a calibration process [29]. According to the UCS test in Section 2.2, the calculational model with the ratio of height to diameter of 2:1 was established in PFC3D, as shown in Figure 12. The color of the particles indicates the force. The upper and lower surfaces of the model were directly squeezed during the UCS test, so the force was greatest (as shown in the red particles) and the further the particle are from the upper and lower surfaces, the smaller the force is (as shown in the blue particles). The upper and lower walls of the calculation model were set as rigid walls, and the torus was the free boundary. Furthermore, the radius of the particles was set to 0.5–1 mm, and the lateral strain of the particles was calculated by the measuring ball.
In this paper, the peak load, the elasticity modulus, and Poisson’s ratio measured in the laboratory tests were calibrated by controlling a single variable, that is, only one micro property was changed in each calibration. The effective modulus and the normal to the tangential stiffness ratio were usually adopted to match the elastic modulus and the Poisson’s ratio, respectively. Moreover, the UCS can be determined in the process of calibrating the elasticity modulus. Furthermore, the friction factor is set to 0.78. In the calibration process, these micro properties were constantly adjusted and checked until they matched the macro properties of the SMS samples measured in the laboratory tests. Table 5 shows the comparison between the macro properties obtained from the simulation and that measured in the UCS test.
As Table 5 shows, the error between the numerical simulation and test results is controlled within 10%; thus, the calculation model meets the requirements of simulation.
Figure 13 represents the simulated failure model and the failure sample in the laboratory tests, where a very low downward velocity of 0.3 m/s was applied to the upper wall for ensuring the static equilibrium state [17,29] until the model failed in the simulation. When the external force on the model reaches a certain value, shear failure occurs in the relative movement of the model particles (as shown in the cracks of the model) and the maximum stress occurs in the relative movement position (as shown in the red particles). It can be seen from Figure 13 that the failure forms of the two are similar, which indirectly validates the correctness of the simulation model.

3.2. TCS Simulation

The SMS are distributed in the depth range of 1500–3600 m under the sea water [30,31], and the high confining pressure of its surroundings is different from that in the air. Under the condition of high hydrostatic pressure, the rocks are in the high-pressure state of three-dimensional stress, and a ductile cutting process usually occurs in the rock fracture [19,30,32]. In this section, PFC3D program was used to simulate the TCS tests. The TCS numerical simulation mainly includes three parts: particle generation, equilibrium consolidation and loading. Figure 14 illustrates the calculation model, where the radius of the particles was set to 0.5–1 mm.
Similar to the calibration in Section 3.1, the micro properties of the discrete model are continuously adjusted to guarantee that its macro properties are close to those measured in the laboratory tests. Due to the limit of simulation technology, the TCS simulation in this paper was conducted under the condition of equal lateral pressure. Eventually, Table 6 shows the macro properties obtained from the simulation and that measured in the TCS test. It can be concluded that the calculation model basically meets the requirements of simulation within the error range.
Similarly, the simulated failure model and the failure sample in the laboratory tests are illustrated in Figure 15a,b, respectively. In the TCS test, due to the applied confining pressure, the three principal stresses of the sample are equal at the initial stage. As the vertical principal stress gradually increases, the sample finally suffers from shear failure. As can be seen from Figure 15, the failure forms of the two are similar, which indirectly verifies the correctness of the simulation model.
Walls were added to the surface of cylindrical models to simulate the hydro-confining pressure. Due to the limit of simulation technology, it was assumed that the calculational model was composed of closely connected particles without void and crack. Under the condition of equal lateral pressure, the stress monitored in the numerical simulation at the confining pressure of 10 MPa is illustrated in Figure 16a. Additionally, Figure 16b demonstrates the change rules of stress with strain under different confining pressures.
As can be seen from Figure 16a, the confining pressure is always stable at 10MPa; thus, it can be considered that the confining pressure was successfully loaded in the numerical simulation. It can be concluded from Figure 16b that the peak deviatoric stress increases with the increase of the confining pressure.

3.3. Simulation of the Cutting Process

At present, the spiral drums with cutting picks are usually adopted to cut and crush rocks. To prolong the operation life and improve the performance of the cutting picks, the cutting force on the picks in the cutting and crushing process need most concerning. Additionally, it is necessary to maintain a certain confining pressure during the cutting process for accurately simulating the process in deep-sea environment. As we all know, the SMS exists in deep sea. In order to simulate the mining environment as realistically as possible, a two-layer cylindrical model was adopted in the simulations, in which the upper layer and lower layer are used to simulate the seawater and SMS, respectively. Furthermore, the imported cutting pick was established in SolidWorks (a 3D modeling commercial software), as shown in Figure 17. Table 7 shows the basic parameters of the particle model.
It was assumed that the influence of seawater on the cutting process was ignored in deep-sea environments. Since the stiffness of the upper particles was quite different from that of the lower particles and the cutting pick, the penetrating effect would be generated when the cutting pick contact with the upper particles, that is, the upper particles have no influence on the operation of the cutting pick. Meanwhile, the stiffness of the cutting pick was similar to that of the lower particles and the overlap between them was almost 0; thus, the lower particles would be extruded during the cutting process. At the beginning of the simulation, the confining pressure of 30 MPa was applied to the model to simulate the deep-sea confining pressure state to the maximum extent. When the model reached stability, the cutting pick with cutting angle of 30° was imported into the model. Since the size of the cutting pick and the particle model was relatively small, the pick was simplified to move along the coordinate axis in case of a low-speed rotating spiral drum, in which x, y and z coordinates are shown in Figure 17, and the origin is the intersection of the model axis and the interface between the upper and lower layers. Hence, the velocity of the cutting pick in the x, y and z directions were set to be 1 m/s, 1 m/s and 0.5 m/s, respectively, and the initial contact point of the cutting pick is located at any location in the upper layer. Eventually, the simulated cutting effect on the cross sections of the two-layer model is represented in Figure 18.
In Figure 18a, “Contact pb_state” represents the contact state of the parallel bond in PFC3D, where 0, 1, 2 and 3 denote the non-bonding state (red particles), tensile failure state, shear failure state (green particles) and bonding state (blue particles), respectively. In the simulation, the particle model was broken by the cutting pick, and the contact state of particles changed. As can be seen, most of the particles are in the shear failure state. Meanwhile, a small number of particles in the model were separated from the bonding state due to the extrusion of the cutting pick. Due to the influence of confining pressure on the cylindrical wall, except for a small number of particles outside the wall, most of them were permeated into the upper particles, resulting in the effect of the particles being chopped up. At this point, the upper particles were squeezed and the elastic deformation occurred, resulting in the overlap of multiple particles owing to the low stiffness, as shown in Figure 18b.
Figure 19 represents the cutting force on the cutting pick in the x, y and z directions and the resultant force on the cutting pick. During the mining process, the cutting picks often suffer from wear failure, so it is of significance to investigate the maximum resultant force on the cutting picks. Therefore, as can be seen from Figure 19, the force on the cutting pick is about 185 KN in the x direction, 75 kN in the y direction, 10 kN in the z direction and the resultant force is about 330 kN.
In case of all settings being equal, two cutting picks, named as Pick 1 and Pick 2, were imported and they were staggered at a certain angle to simulate the cutting process of two adjacent picks. Similarly, Figure 20 and Figure 21 demonstrate the cutting effect on the cross sections of the two-layer model and the resultant force on the cutting picks, respectively. As can be seen from Figure 20, most particles are in the shear failure state and few particles are in the non-bonding state, which is similar to the results obtained from Figure 18. Additionally, a small number of particles run out of the lower surface due to the cutting effect of cutting picks on the cylindrical model.
As seen from Figure 21, the resultant force on the two picks are almost the same. When the solving steps reach 3.8 × 10 4 , the resultant forces of Pick 1 and Pick 2 change obviously because the cutting picks exceed of the model boundary. Additionally, the resultant force on the cutting pick is approximately 150 kN.

4. Conclusions

The main purpose of this paper is to investigate the force on the cutting picks in the cutting progress of SMS. By analyzing the results, the following conclusions can be drawn:
  • Through the UCS and TCS tests, the accurate and comprehensive mechanical properties of the SMS samples have been obtained, including the cohesive force, internal friction angle, compressive strength, elastic modulus and Poisson’s ratio.
  • The micro properties input in the simulation are matched with the macro properties measured in the laboratory tests through the calibration progress, validating the accuracy of the established particle model for simulating the cutting progress.
  • The cutting progress simulations of the single cutting pick and two adjacent cutting picks using the DEM reveal the trend of the cutting force in x, y and z directions. Moreover, the maximum resultant force on the cutting pick has been obtained.
  • This research can provide a reliable modeling method for the mining process simulation of SMS, which can effectively predict the maximum force on the cutting pick.

Author Contributions

Conceptualization, Y.D. and F.M.; methodology, Y.D. and F.M.; software, F.M. and X.Z; validation, F.M., X.Z. and H.L.; formal analysis, F.M.; investigation, F.M.; resources, Y.D.; data curation, F.M.; writing—original draft preparation, F.M. and Y.D.; writing—review and editing, Y.D., F.M., Z.H and Y.X; visualization, F.M., X.Z. and H.L.; supervision, Y.D.; project administration, Y.D.; funding acquisition, Y.D.

Funding

This research was funded by the National Natural Science Foundation of China, grant number 51774324, the National Key Research and Development Program of China, grant umber SQ2016YF010109 and the Natural Science Foundation of Hunan Province, grant umber 2019JJ40380 and 17B063.

Acknowledgments

We would like to express our thanks to the editors of the “Journal of Marine Science and Engineering” and the anonymous reviewers for their work in processing this article.

Conflicts of Interest

The authors declare no conflict of interest.

Abbreviations

The following abbreviations are adopted in this article:
SMSSeafloor Massive Sulfides
UCSUniaxial Compressive Strength
TCSTriaxial Compressive Strength
BTSBrazilian test strength
DEM Discrete Element Method
PFC3DParticle flow code in three dimensions

References

  1. Dehnavi, A.S.; McFarlane, C.; Lentz, D.R.; McClenaghan, S.H.; Walker, J.A. Chlorite-white mica pairs’ composition as a micro-chemical guide to fingerprint massive sulfide deposits of the bathurst mining camp, Canada. Minerals 2019, 9, 125. [Google Scholar] [CrossRef]
  2. Fallon, E.K.; Frische, M.; Petersen, S.; Brooker, R.; Scott, T.B. Geological, mineralogical and textural impacts on the distribution of environmentally toxic trace elements in seafloor massive sulfide occurrences. Minerals 2019, 9, 162. [Google Scholar] [CrossRef]
  3. Juliani, C.; Ellefmo, S.L. Resource assessment of undiscovered seafloor massive sulfide deposits on an Arctic mid-ocean ridge: Application of grade and tonnage models. Ore. Geol. Rev. 2018, 102, 818–828. [Google Scholar] [CrossRef]
  4. Kowalczuk, P.B.; Snook, B.; Kleiv, R.A.; Aasly, K. Efficient extraction of copper and zinc from seafloor massive sulphide rock samples from the Loki’s Castle area at the Arctic Mid-Ocean Ridge. Miner. Eng. 2018, 115, 106–116. [Google Scholar] [CrossRef]
  5. Cherkashov, G.; Poroshina, I.; Stepanova, T.; Ivanov, V.; Bel’tenev, V.; Lazareva, L.; Rozhdestvenskaya, I.; Samovarov, M.; Shilov, V.; Glasby, G.; et al. Seafloor massive sulfides from the northern equatorial Mid-Atlantic Ridge: New discoveries and perspectives. Mar. Georesour. Geotechnol. 2010, 28, 222–239. [Google Scholar] [CrossRef]
  6. Kuiper, R.J.; Miedema, S.A.; Frumau, J.C.L. Influence of the hyperbaric effect on apparent material strength of fully saturated porous rock for low strain rates. In Proceedings of the Offshore Technology Conference, Houston, TX, USA, 6–9 May 2013. [Google Scholar]
  7. Spagnoli, G.; Jahn, A.; Halbach, P. First results regarding the influence of mineralogy on the mechanical properties of seafloor massive sulfide samples. Eng. Geol. 2016, 214, 127–135. [Google Scholar] [CrossRef]
  8. Grima, M.A.; Miedema, S.A.; Ketterij, R.G.; Yenigül, N.B.; Rhee, C. Effect of high hyperbaric pressure on rock cutting process. Eng. Geol. 2015, 196, 24–36. [Google Scholar] [CrossRef]
  9. Kaitkay, P.; Lei, S. Experimental study of rock cutting under external hydrostatic pressure. J. Mater. Process. Tech. 2005, 159, 206–213. [Google Scholar] [CrossRef]
  10. Helmons, R.L.J.; Miedema, S.A.; Rhee, C. A New approach to model hyperbaric rock cutting processes. In Proceedings of the 33rd ASME International Conference on Ocean, Offshore and Arctic Engineering, San Francisco, CA, USA, 8–13 June 2014. [Google Scholar]
  11. Alvarez, G.M.; Boomsma, W.; Hofstra, F.; Lotman, R. A linear rock cutting test set-up for 3 dimensional tests under hyperbaric pressure. In Proceedings of the Offshore Technology Conference, Houston, TX, USA, 30 April–3 May 2012. [Google Scholar]
  12. Menezes, P.L.; Lovell, M.R.; Avdeev, I.V.; Higgs, C.F. Studies on the formation of discontinuous rock fragments during cutting operation. Int. J. Rock. Mech. Min. 2014, 71, 131–142. [Google Scholar] [CrossRef] [Green Version]
  13. Helmons, R.L.J.; Miedema, S.A.; Grima, M.A.; Rhee, C. Modeling fluid pressure effects when cutting saturated rock. Eng. Geol. 2016, 211, 50–60. [Google Scholar] [CrossRef]
  14. Estay, D.A.; Chiang, L.E. Discrete crack model for simulating rock comminution processes with the Discrete Element Method. Int. J. Rock. Mech. Min. 2013, 60, 125–133. [Google Scholar] [CrossRef]
  15. Rojek, J.; Onate, E.; Labra, C.; Kargl, H. Discrete element simulation of rock cutting. Int. J. Rock. Mech. Min. 2011, 48, 996–1010. [Google Scholar] [CrossRef]
  16. Lei, S.; Kaitkay, P.; Shen, X. Simulation of rock cutting using distinct element method-PFC2D. In Numerical Modeling in Micromechanics Via Particle Methods; Shimizu, Y., Hart, R., Cundall, P., Eds.; Tylor & Francis Group: London, UK, 2004; Volume 1, pp. 63–72. [Google Scholar]
  17. Su, O.; Akcin, N.A. Numerical simulation of rock cutting using the discrete element method. Int. J. Rock. Mech. Min. 2011, 48, 434–442. [Google Scholar] [CrossRef]
  18. Su, O.; Akcin, N.A.; Kamp, L. Modeling of cutting forces acting on a conical pick. In Proceedings of the EURO: TUN 2009 II International Conference on Computational Methods in Tunnelling, Bochum, Germany, 9–11 September 2009. [Google Scholar]
  19. Stavropoulou, M. Modeling of small-diameter rotary drilling tests on marbles. Int. J. Rock. Mech. Min. 2006, 43, 1034–1051. [Google Scholar] [CrossRef]
  20. Lunow, C.; Konietzky, H. Two-dimensional simulation of the pressing and the cutting rock destruction. In Proceedings of the EURO: TUN 2009 II International Conference on Computational Methods in Tunnelling, Bochum, Germany, 9–11 September 2009. [Google Scholar]
  21. Onate, E.; Rojek, J. Combination of discrete element and finite element methods for dynamic analysis of geomechanics problems. Comput. Method. Appl. Mech. Eng. 2004, 193, 3087–3128. [Google Scholar] [CrossRef]
  22. Li, X.Y.; Lv, Y.G.; Jiang, S.B.; Zeng, Q.L. Effects of spiral line for pick arrangement on boom type roadheader cutting load. Int. J. Simul. Model. 2016, 15, 170–180. [Google Scholar] [CrossRef]
  23. Huang, J.; Zhang, Y.; Zhu, L.; Wang, T. Numerical simulation of rock cutting in deep mining conditions. Int. J. Rock. Mech. Min. 2016, 100, 80–86. [Google Scholar] [CrossRef]
  24. Rahman, M.; Schott, D.L.; Miedema, S.A.; Lodewijks, G. Simulation of cutting process by hybrid granular and multibody dynamics software. In Proceedings of the 3rd International Conference on Bulksolids, Glasgow, UK, 9–10 September 2010. [Google Scholar]
  25. Abdeli, M.; Miedema, S.A.; Rhee, C.; Alvarez, G.M. Discrete element method modelling of sand cutting. In Proceedings of the WODCON XIX, Beijing, China, 9–14 September 2010. [Google Scholar]
  26. Escartin, J.; Hirth, G.; Evans, B. Nondilatant brittle deformation of serpentinites: Implications for Mohr-Coulomb theory and the strength of faults. J. Geophys. Res. 1997, 102, 2897–2913. [Google Scholar] [CrossRef]
  27. Griffiths, D.V. Failure criteria interpretation based on Mohr-Coulomb friction. J. Geotech. Eng. 1990, 116, 986–999. [Google Scholar] [CrossRef]
  28. Labuz, J.F.; Zang, A. Mohr–Coulomb failure criterion. Rock. Mech. Rock. Eng. 2012, 45, 975–979. [Google Scholar] [CrossRef]
  29. Wyk, G.; Els, D.N.J.; Akdogan, G.; Bradshaw, S.M.; Sacks, N. Discrete element simulation of tribological interactions in rock cutting. Int. J. Rock. Mech. Min. 2014, 65, 8–19. [Google Scholar]
  30. Spagnoli, G.; Rongau, J.; Denegre, J.; Miedema, S.A. A novel mining approach for seafloor massive sulfide deposits. In Proceedings of the Offshore Technology Conference, Houston, TX, USA, 2–5 May 2016. [Google Scholar]
  31. Spagnoli, G.; Miedema, S.A.; Herrmann, C.; Rongau, J.; Weixler, L.; Denegre, J. Preliminary design of a trench cutter system for deep-sea mining applications under hyperbaric conditions. IEEE J. Ocean. Eng. 2015, 41, 930–943. [Google Scholar] [CrossRef]
  32. Miedema, S.A.; Zijsling, D. Hyperbaric rock cutting. In Proceedings of the ASME 31st International Conference on Ocean, Offshore and Arctic Engineering, Rio de Janeiro, Brazil, 1–6 July 2012. [Google Scholar]
Figure 1. Parts of SMS samples from (a) the segment of 20vii-s25-tvg21; (b) the segment of 22iii-smar-s012-tvg0.
Jmse 07 00252 g001
Figure 2. SMS samples processed in the laboratory.
Jmse 07 00252 g002
Figure 3. (a) Total testing system; (b) the basic operation principle of the testing system.
Jmse 07 00252 g003
Figure 4. (a) The UCS testing platform; (b) the failure samples in the UCS test.
Jmse 07 00252 g004
Figure 5. The stress variation with strain in the UCS test.
Jmse 07 00252 g005
Figure 6. The stress distribution in the case of: (a) no-failure of the sample; (b) shear failure of the sample.
Jmse 07 00252 g006
Figure 7. (a) The TCS testing platform; (b) the failure samples in the TCS test.
Jmse 07 00252 g007
Figure 8. The stress variation with strain in the TCS test.
Jmse 07 00252 g008
Figure 9. The optimal fitting straight line for σ 1 and σ 3 in the TCS test.
Jmse 07 00252 g009
Figure 10. The Mohr stress circles obtained from the TCS test.
Jmse 07 00252 g010
Figure 11. The calculation cycle of particle flow code in three dimensions (PFC3D).
Jmse 07 00252 g011
Figure 12. The calculational model in the UCS simulation.
Jmse 07 00252 g012
Figure 13. (a) The failure model in the simulation; (b) the failure sample in the laboratory tests.
Jmse 07 00252 g013
Figure 14. The calculational model of the TCS simulation.
Jmse 07 00252 g014
Figure 15. (a) The failure model in the simulation; (b) the failure sample in the laboratory tests.
Jmse 07 00252 g015
Figure 16. (a) The stress monitored in the simulation at the confining pressure of 10MP; (b) the change rules of stress with strain under different confining pressures.
Jmse 07 00252 g016
Figure 17. Two-layer particle model.
Jmse 07 00252 g017
Figure 18. (a) The simulated cutting effects; (b) the overlap of multiple particles.
Jmse 07 00252 g018
Figure 19. (a) The cutting force on the cutting pick in the x, y and z directions; (b) the resultant force on the cutting pick.
Jmse 07 00252 g019
Figure 20. The simulated cutting effects with two cutting picks.
Jmse 07 00252 g020
Figure 21. The change rules of the resultant force on the two adjacent cutting picks.
Jmse 07 00252 g021
Table 1. Main mineralogical compositions of the SMS samples.
NumberDiameter (mm)Height (mm)c/%
CuFeZnSSiO2Ba
1-149.71100.671.10 18.83 19.37 17.80 27.17 2.74
1-248.9696.676.14 24.97 12.74 34.49 5.14 0.14
2-151.26100.283.27 26.14 3.97 30.74 7.54 7.98
2-251.68100.132.66 14.21 17.63 30.56 20.03 0.89
3-150.65100.262.57 37.47 4.33 40.99 0.19 0.04
3-250.46100.1814.47 38.67 6.99 29.77 4.25 0.09
4-151.50101.683.07 32.74 17.66 39.62 2.37 0.00
4-249.2396.962.13 22.78 27.98 34.97 2.81 0.14
4-348.89101.545.32 33.31 5.02 30.40 19.50 2.04
5-148.5098.888.84 28.64 9.47 34.13 4.68 0.04
Table 2. Main performance indexes of the testing system.
ParametersValues
Accuracy of load and strain measurements ± 0.5 % of the maximum display value
Triaxial range of temperature ( o C ) room   temperature 200
Axial load (KN) 4600
Pore water pressure (MPa) 140
Confining pressure (MPa) 140
Delta P Permeability (MPa) 2
Table 3. Data monitored in the UCS test process.
NumberPeak Load (KN)UCS (MPa)Elasticity Modulus (MPa)Poisson’s Ratio
1-117.4068.96911,0030.13
2-213.9956.67210,9980.08
4-328.32515.08812,4600.11
Average10.24311,4870.11
Table 4. Data monitored in the TCS test.
NumberPeak Load (KN) σ 3   ( MPa ) σ 1   ( MPa )
4-228.2751.014.856
1-230.9732.016.452
2-140.5472.019.648
5-141.9213.022.691
4-152.1024.025.012
3-163.7565.031.643
3-272.5886.036.298
Table 5. Comparison between the macro properties obtained from the simulation and that measured in the UCS test.
Source of the Results UCS (MPa)Elastic Modulus (GPa)Poisson’s Ratio
The test7.82114870.11
The simulation7.23108740.115
The error between simulation and test7%5%4.5%
Table 6. Comparison between the macro properties obtained from the simulation and that measured in the TCS test.
Source of the Results Internal Friction Angle (°)the Cohesion (MPa)
The test382.447
The simulation36.22.62
The error between simulation and test5%6.6%
Table 7. Basic parameters of the particle model in PFC3D.
ParametersThe Lower LayerThe Upper Layer
The minimum particle size (mm)0.51
Particle size ratio1.21.2
Density (g/cm3)2.51.0
Equivalent elastic modulus (MPa) 9 × 10 3 9 × 10 3
Grain stiffness ratio2.52.5
Frictional coefficient0.780.78
Compressive strength of parallel bond (MPa)10 1 × 10 9
Cohesion of parallel bond (MPa)2 2 × 10 9
Normal stiffness of parallel bond (MPa)300 3 × 10 9
Tangential stiffness of parallel bond (MPa)300 3 × 10 9
Stiffness ratio of parallel bond 11
Radius factor of parallel bond 11

