Article

Assessing the Unreliability of Systems during the Early Operation Period of a Ship—A Case Study

by
Leszek Chybowski
1,*,
Katarzyna Gawdzińska
2,* and
Rafał Laskowski
3
1
Faculty of Marine Engineering, Maritime University of Szczecin, Wały Chrobrego 1-2, 70-500 Szczecin, Poland
2
Faculty of Marine Engineering, Maritime University of Szczecin, Willowa 2-4, 71-650 Szczecin, Poland
3
BP Maritime Services PTE Ltd., 7 Straits View, #26-01 Marina One East Tower, Singapore 018936, Singapore
*
Authors to whom correspondence should be addressed.
J. Mar. Sci. Eng. 2019, 7(7), 213; https://doi.org/10.3390/jmse7070213
Submission received: 13 June 2019 / Revised: 1 July 2019 / Accepted: 9 July 2019 / Published: 11 July 2019

Abstract

:
Sea-going ships are unique systems, and each ship—even those which are mass-produced—are different. Once in service, they are subjected to unique environmental exposure due to a variety of factors, including, but not limited to, their mode of operation, sailing area, cargo, hydrometeorological conditions, crew training, etc. This makes it very difficult, if not impossible, to compare individual units. The aim of this study is to present the damage data and analysis of a selected vessel—a complex technical system—during its first year of operation. To that end, the paper analyses the unreliability of a bulk cargo ship’s technical and energetic system components during its first year of operation. The paper also introduces the failure susceptibility of its technical systems, defines concepts of wear and failure and describes the object of analysis. Observed failures in subsystem components of the marine power plant, in the general systems and in the technological system of the ship, were presented in tabular form. Each failure was described by considering the time of operation until the first failure, type of failure, type of wear, nature of an event and methods used to regain efficiency. Selected failures were described in great detail, and the statistics of the ship’s components’ susceptibility to failure were presented by considering the wear type that caused a failure, the component type and the time to the first failure. Additionally the severity of each failure is discussed. Finally, conclusions regarding the susceptibility to failure of particular ship components were presented.

1. Introduction

Human activities often require the use of complex technical systems, such as marine vessels [1], which are one of the main modes of transport worldwide. In 2012, more than 80% of the world’s commodity circulation was realised using naval transport [2]. Apart from transport ships, there is a group (less than 15% [1,3]) of ships used for specific technological tasks, such as oil and gas production, deep-sea fishing, cabling, pipe-laying on the sea floor, etc. [4]. Any ship can be operated reliably due to the technological and energetic system (TES), a set of machines and devices used to convert mechanical, electrical, and thermal energy [5,6,7].
Functional subsystems are present as components of a ship’s transport system. Despite a significant increase in the reliability of any ships’ technical systems, maritime disasters still occur [8], resulting in loss of life and injuries to crew members and passengers, as well as material losses related to serious ship failures or their sinking [9].
Therefore, to improve maritime safety, it is important to study the possibility of continuous improvements in reliability. The latter part of the paper presents cases of failures occurring during the first year of a ship’s operation (Figure 1).
Wear is a continuous process that gradually damages an object’s surface, which changes the initial mass, structure, and stress state of the surface layer of a material, as well as its chemical composition [10]. The severity of this process depends on the character of certain physicochemical factors, the type of applied loads, and time of operation. When researching wear processes, results are observed only after parts have been mated. It is impossible to observe the wear process as it occurs, and assessing the occurring phenomena is conducted based on the results of mating in relation to velocity, load, the temperature to which the object is subjected, the material, the lubricating agent and the geometry of its components [11].
The wear processes of mechanical objects are related to the conversion of energy into mechanical work, which causes certain forces to act between components [12]. During an object’s usage, reactions from the applied forces exist as kinematic pairs, due to imposed geometrical and kinematic constraints. In the components of kinematic pairs, variable mechanical stresses arise, depending on the load, rotations, and the characteristics of the surface layer.
Tribological wear involves the deterioration of a machine part’s surface layer due to friction, micro-machining and volumetric fatigue, which leads to fractures and adhesive wear. Non-tribological wear processes include, among other issues, corrosion, erosion and cavitation. From a technical perspective, wear can be divided into the following types [13]: Abrasive, adhesive, fatigue-induced, corrosion of metals and non-metals, plastic, erosive, and cavitation- and thermal-induced.
The type of wear that occurs in machine parts depends upon many factors [11], including material, geometrical, environmental, thermal, dynamic and kinematic factors. During the operation of a technical object, its wear increases, starting from an initial value as determined by its design and manufacturing, up to a limiting value, equivalent to the failure of a component. The wear may advance via a number of ageing mechanisms, and machine parameters are constantly or periodically monitored to prevent sudden failure which would terminate the machine’s operation. In an emergency, where it is not possible to observe the state of the object’s components, failures may occur, and stop a machine without any prior symptoms.
Damage (failure) involves the transition of a machine or its components from an operational to a non-operational state. In an operational state, a machine is functional and maintains the parameters described in the technical documentation within specified ranges. A non-operational state occurs when a machine does not fulfil even a single requirement out of those defined in the technical documentation.
Based on [14] the main causes of failures are as following:
  • Construction flaws, resulting from an object being improperly designed;
  • Manufacturing errors, including defects occurring as a result of negligence and the inaccuracy of production processes;
  • Operational errors, resulting from disregarding obligatory rules of operation, or due to the influence of certain external factors, unexpected for typical usage conditions of a given machine;
  • Ageing factors leading to irreversible changes and deterioration in the strength and ability of particular components to work with each other.
Depending on which energy type is responsible for the destructive processes, the causes of these failures may be classified as one of the following types [14]: Mechanical, chemical, electrical or thermal. Since external conditions influence an object and its ability to accomplish given tasks, the initial properties of a machine can change [15]. Machines fail during their operation due to slow, irreversible ageing and wear processes, as well as processes of variable intensity, caused by temporarily exceeding allowable values of one or more factors (mechanical and thermal loads). As a result, plastic strain is present, and fluctuating failures occur by a discontinuous transition in one or more properties outside the permissible limits of a given machine.
Matuszak [16] assigned the failure data of specific ship systems to general populations within time to failure data sets. In some situations, they could not be classified as belonging to one of the general populations, meaning that virtually every set of failure data relating to ship systems can be treated as single and unique. Therefore, the authors do not provide a comparative analysis of different ships, and instead provide data on those failures of the specific ship used in this case study. The literature analysis showed that the presentation of failure data of newly built ships is marginalised in the scientific literature. The provided statistical data presented here mainly involves the second phase of exploitation presented in Figure 1 [16,17,18,19,20]. The abovementioned analysis may be the basis for a future comparative analysis.

2. Materials and Methods

2.1. Object of Analysis

Observations of failures were conducted during the first year of operation of a bulk cargo ship (Figure 2). The ship is a single-engine vessel built in 2011, with an unlimited cruising radius, five cargo bays, four cranes and a superstructure placed at its aft. The basic parameters of the ship are presented in Table 1.
The ship is used to transport large-mass cargos, such as coal, coke, phosphates, metal ores, or grains. It is equipped with one low-speed drive with a two-stroke, crosshead, 6-cylinder turbocharged MCR 9480 kW combustion engine of unilateral operation, and a nominal speed of 122 rpm.

2.2. Data on Failures

The component failures observed during the first year of the ship’s operation after its launch were classified by the subsystem in which they failed. Table 2 presents the failures in the subsystems of the ship’s power plant.
Failures observed in the ship’s general subsystems are presented in Table 3, and systems with part of their components located outside the machine compartments were considered.
Component failures occurred in the following subsystems: The provision refrigeration plant, the sanitary water system, and the ballast-bilge system. Table 4 presents the observed failures in the technological system of the ship, which occurred in the control system of cargo bay covers and in the transhipment system (cranes).
Due to limited space, only selected subsystem failures are described in the latter parts of the paper. The results section presents the characteristics of each observed failure, which includes a cause and effect analysis of each failure mode. Individual cases were analysed using the following characteristics: The number of failures in particular ship systems, the number of failures caused by a specific type of wear, the number of failures caused by operator errors, the number of failures with respect to the type of damaged element, the number of failures for a given time interval until the first failure, and the percentage of failures related to the number of operating hours performed by the damaged equipment.

3. Results

3.1. Seawater Pump Failures

Failures observed in the pumps responsible for transporting seawater included two pumps in the cooling system and two pumps in the ballast-bilge system. In each case, the sealing was responsible for the failure.
The failure of centrifugal pump no. 1 in the seawater cooling system occurred as a result of rubber reinforced with steel net entering the pump which was a leftover from the shipyard works. The rubber wrapped onto the pump rotor (Figure 3a), which translated the centre of gravity of the rotating components, causing intense vibrations and finally, the failure of the pump’s mechanical seal (Figure 3b).
The failure of the mechanical seal of seawater pump no. 2 was related to the fracture of the sealing ring (Figure 4a). During repair, a secondary failure of the pump shaft was observed (Figure 4b).
Failures of ballast pumps nos. 1 and 2 were also caused by the wear of the sealing rings of the mechanical seals, primarily due to the operating conditions of these pumps (i.e., periodic “dry” operation without a working medium). As a result, the intensity of the abrasive wear increased, and thermal strain appeared, which caused the material to fracture.

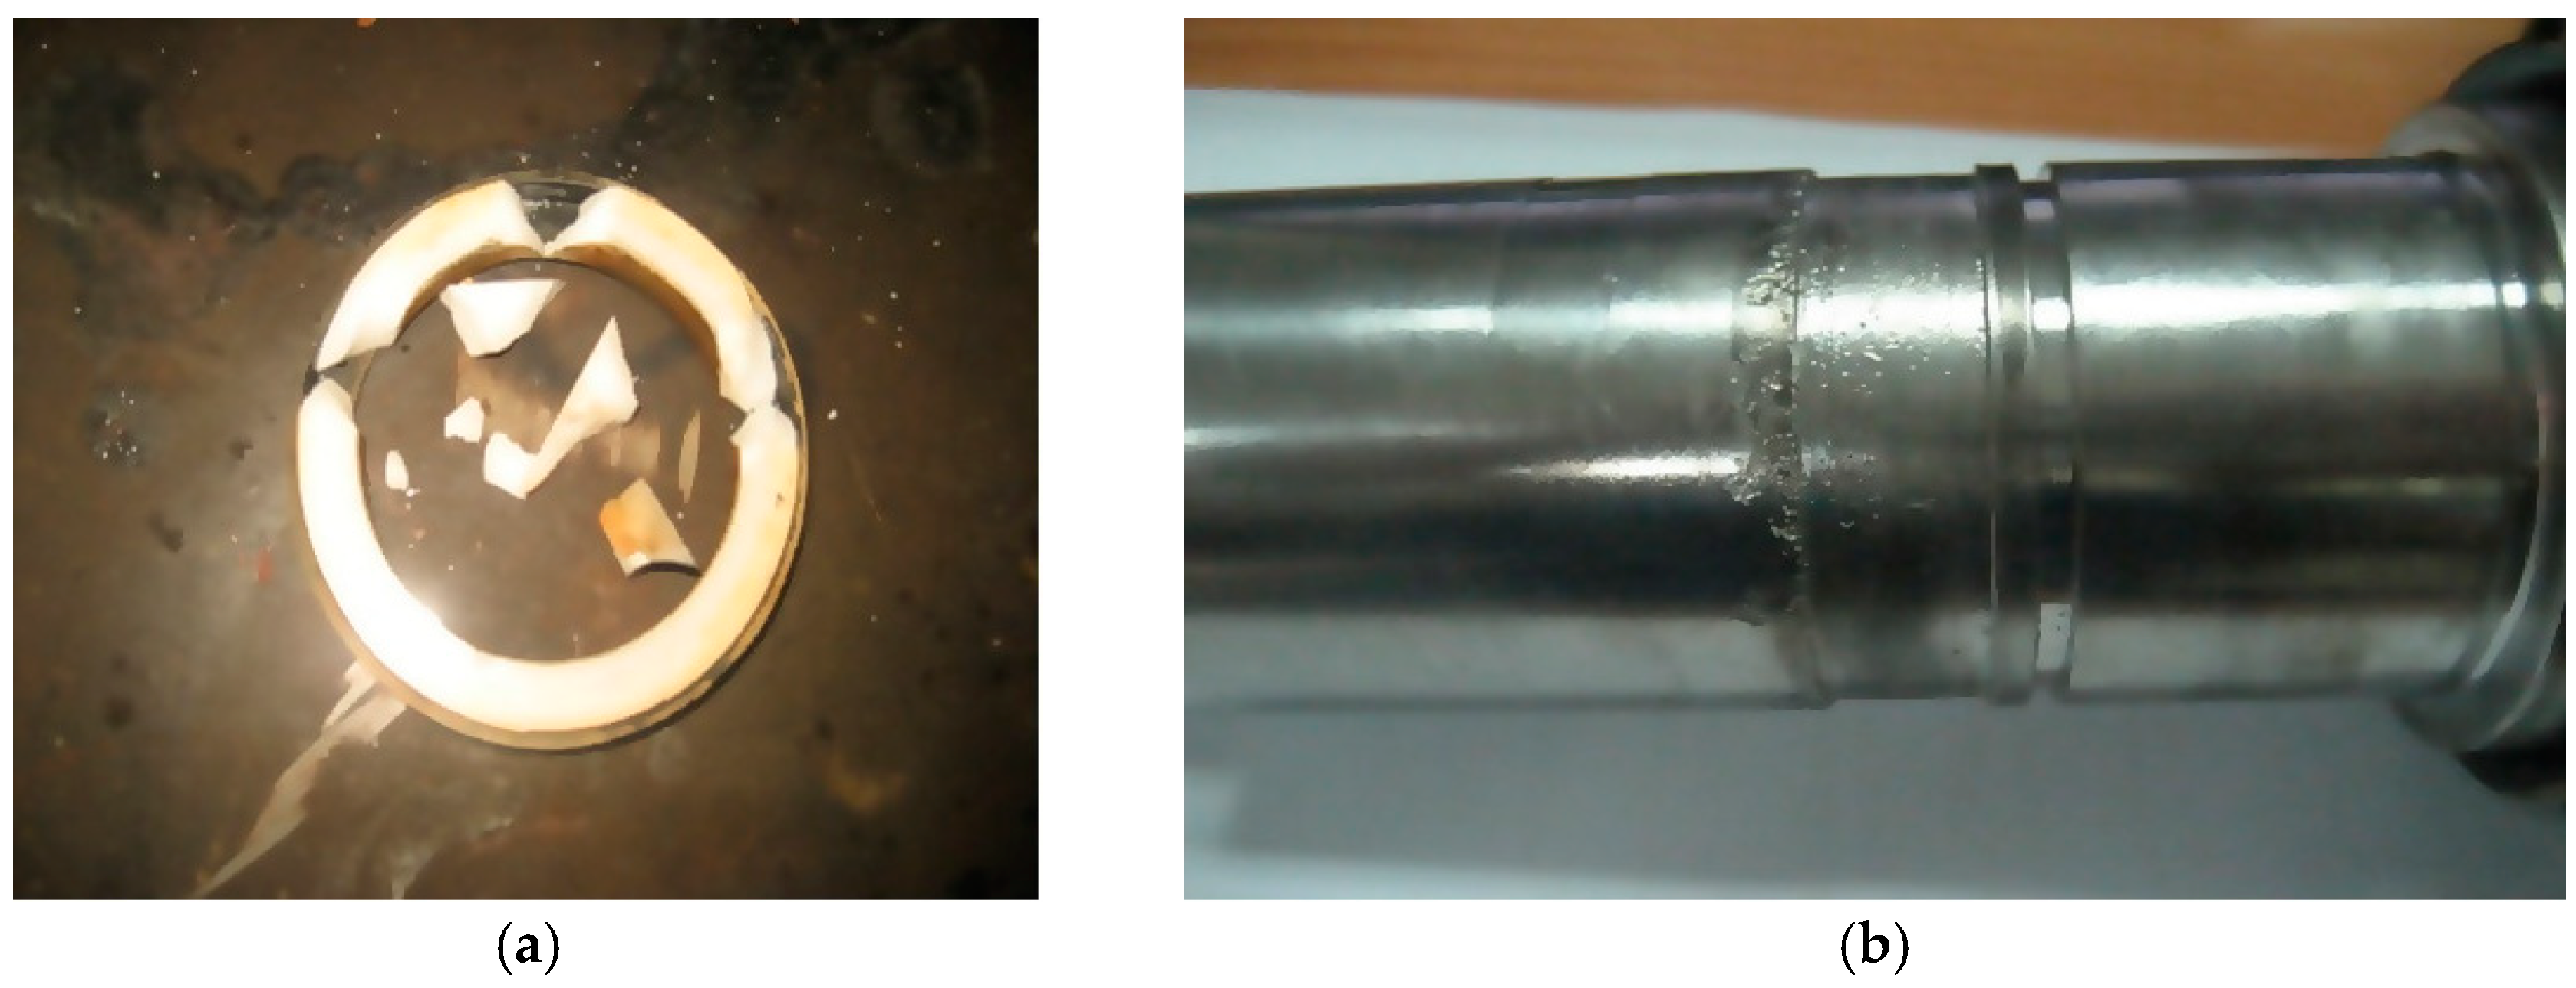
3.2. Failures of Components of the Fuel Centrifuges

Two failures in the HFO purifiers occurred. The centrifuge usually operates with an output of 2450 L/h at a spinning temperature of 98 °C. A symptom of the first observed failure was the “fuel leak from the barrel” alarm. After stopping and opening the machine, it was found that the PTFE sealing ring of the barrel cover had failed. The ring fractured due to thermal wear and fatigue, and no scratches or irregularities were observed, either in the ring groove or on the surface in contact with the ring.
The second failure of the centrifuge was signalled by the “fuel oil low pressure on purifier outlet” alarm, which is the pressure registered by a converter (pressure transmitter), with the symbol PT4. Detailed observation of the centrifuge operation allowed it to be determined that the barrel opened itself too frequently during operation. After stopping and opening the device, the cause was diagnosed—the PTFE plugs installed in the ring in the centrifuge self-cleaning system were worn out, and the height of the plugs was 0.5 mm lower than their nominal value.

3.3. Failures of Components of the Refrigerating Plant

One of the general systems important for the proper operation of the ship is the refrigerating plane [20]. During the operation of the refrigerating plant, the refrigerating compressor no. 1 failed, which is a 4-cylinder piston compressor, working at a nominal rotational speed of 1740 rpm. The failure was related to the fracture of two pumping valves of the valve plate (Figure 5). Due to the malfunction, the electric motor of the compressor was overloaded, and the cylinder head overheated. The temperature increased due to the high pressure in the head, which led to a pumping out of the oil lubricating the cooling system compressor. To correct this failure, the valve plates of both cylinder sets were replaced.
After repairing and restarting the compressor, another failure occurred in the refrigerating plant system. After approx. 18 h of work after that repair, choke occurred in the drier, thermostatic expansion valves and electromagnetic valves, as indicated by the high-temperature alarm in the refrigerating plants. All these components were contaminated with products from the combustion of the lubricating oil. The system was cleaned—an exchangeable drier insert was replaced, and all filters in the expansion and solenoid valves were cleaned. Moreover, the lubricating oil was replaced, and the compressor’s crankcase was cleaned.
The problem repeated itself periodically with increasingly longer intervals between occurrences, until the system was entirely cleaned. Over a period of two weeks, oil in the compressor was replaced three times, four drying inserts were used, and the filters of the expansion valves and electromagnetic valves were cleaned once per day.

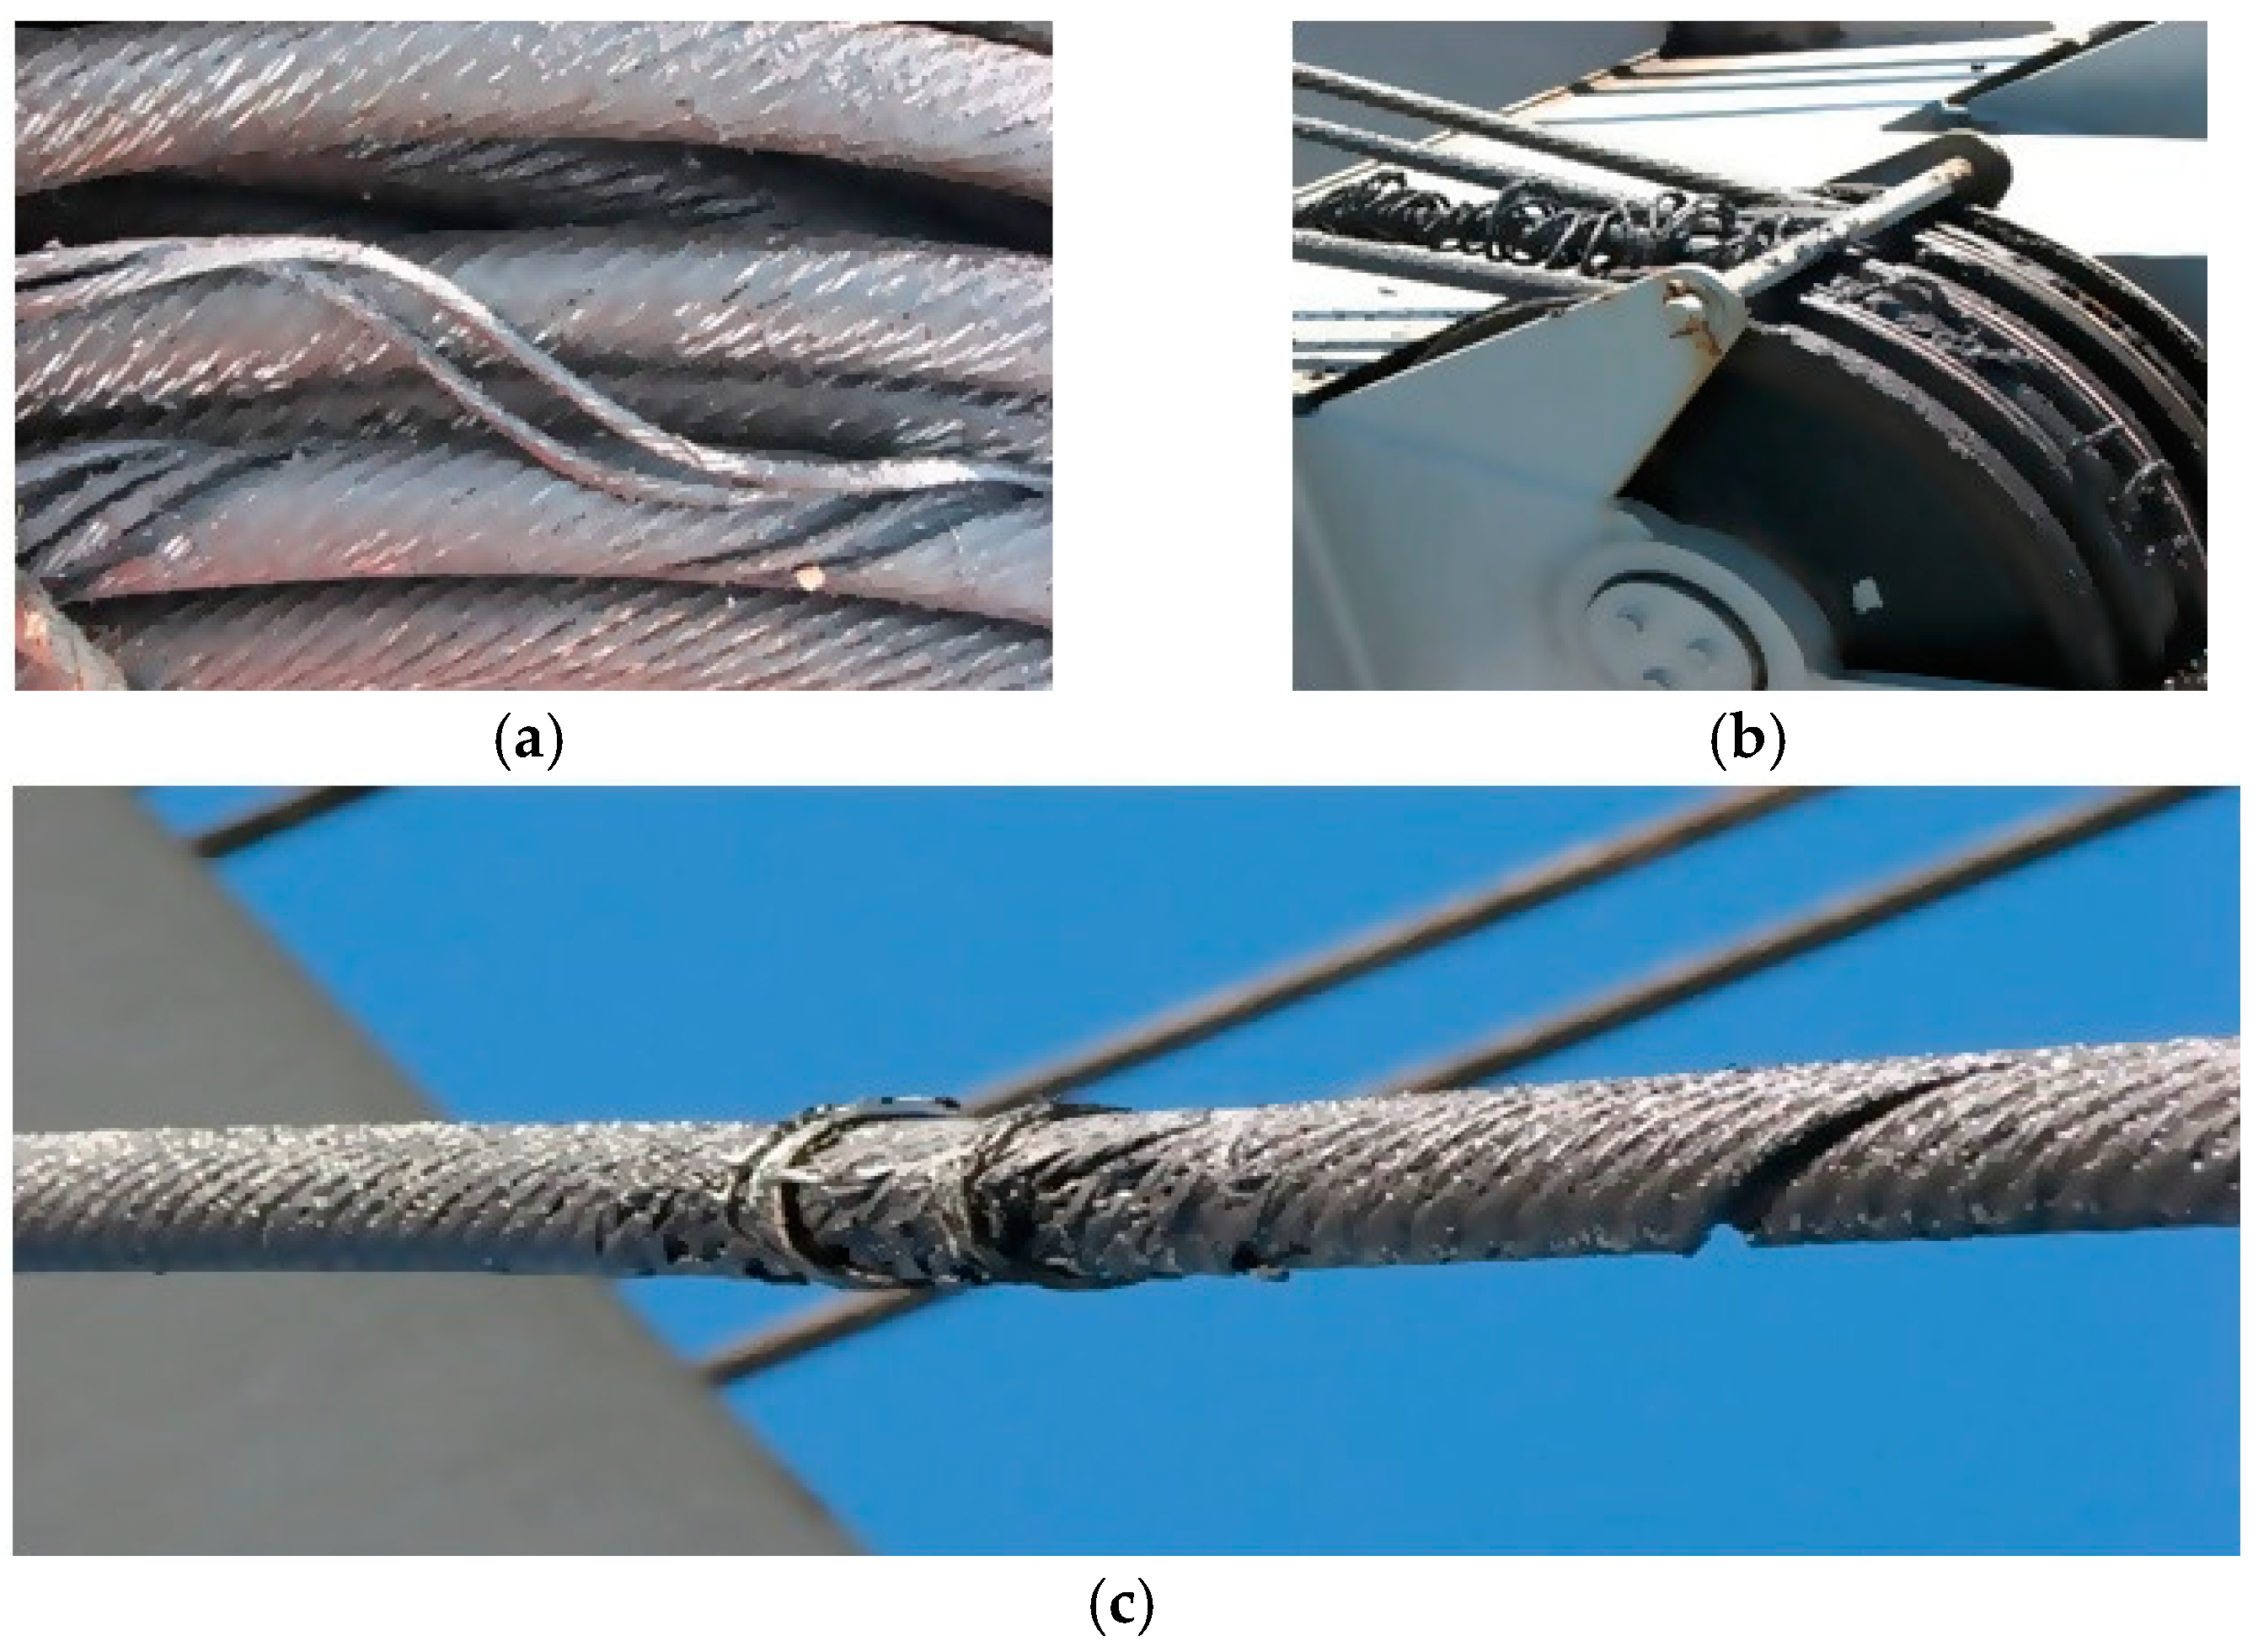
3.4. Failures of the Ship’s Technological System Components
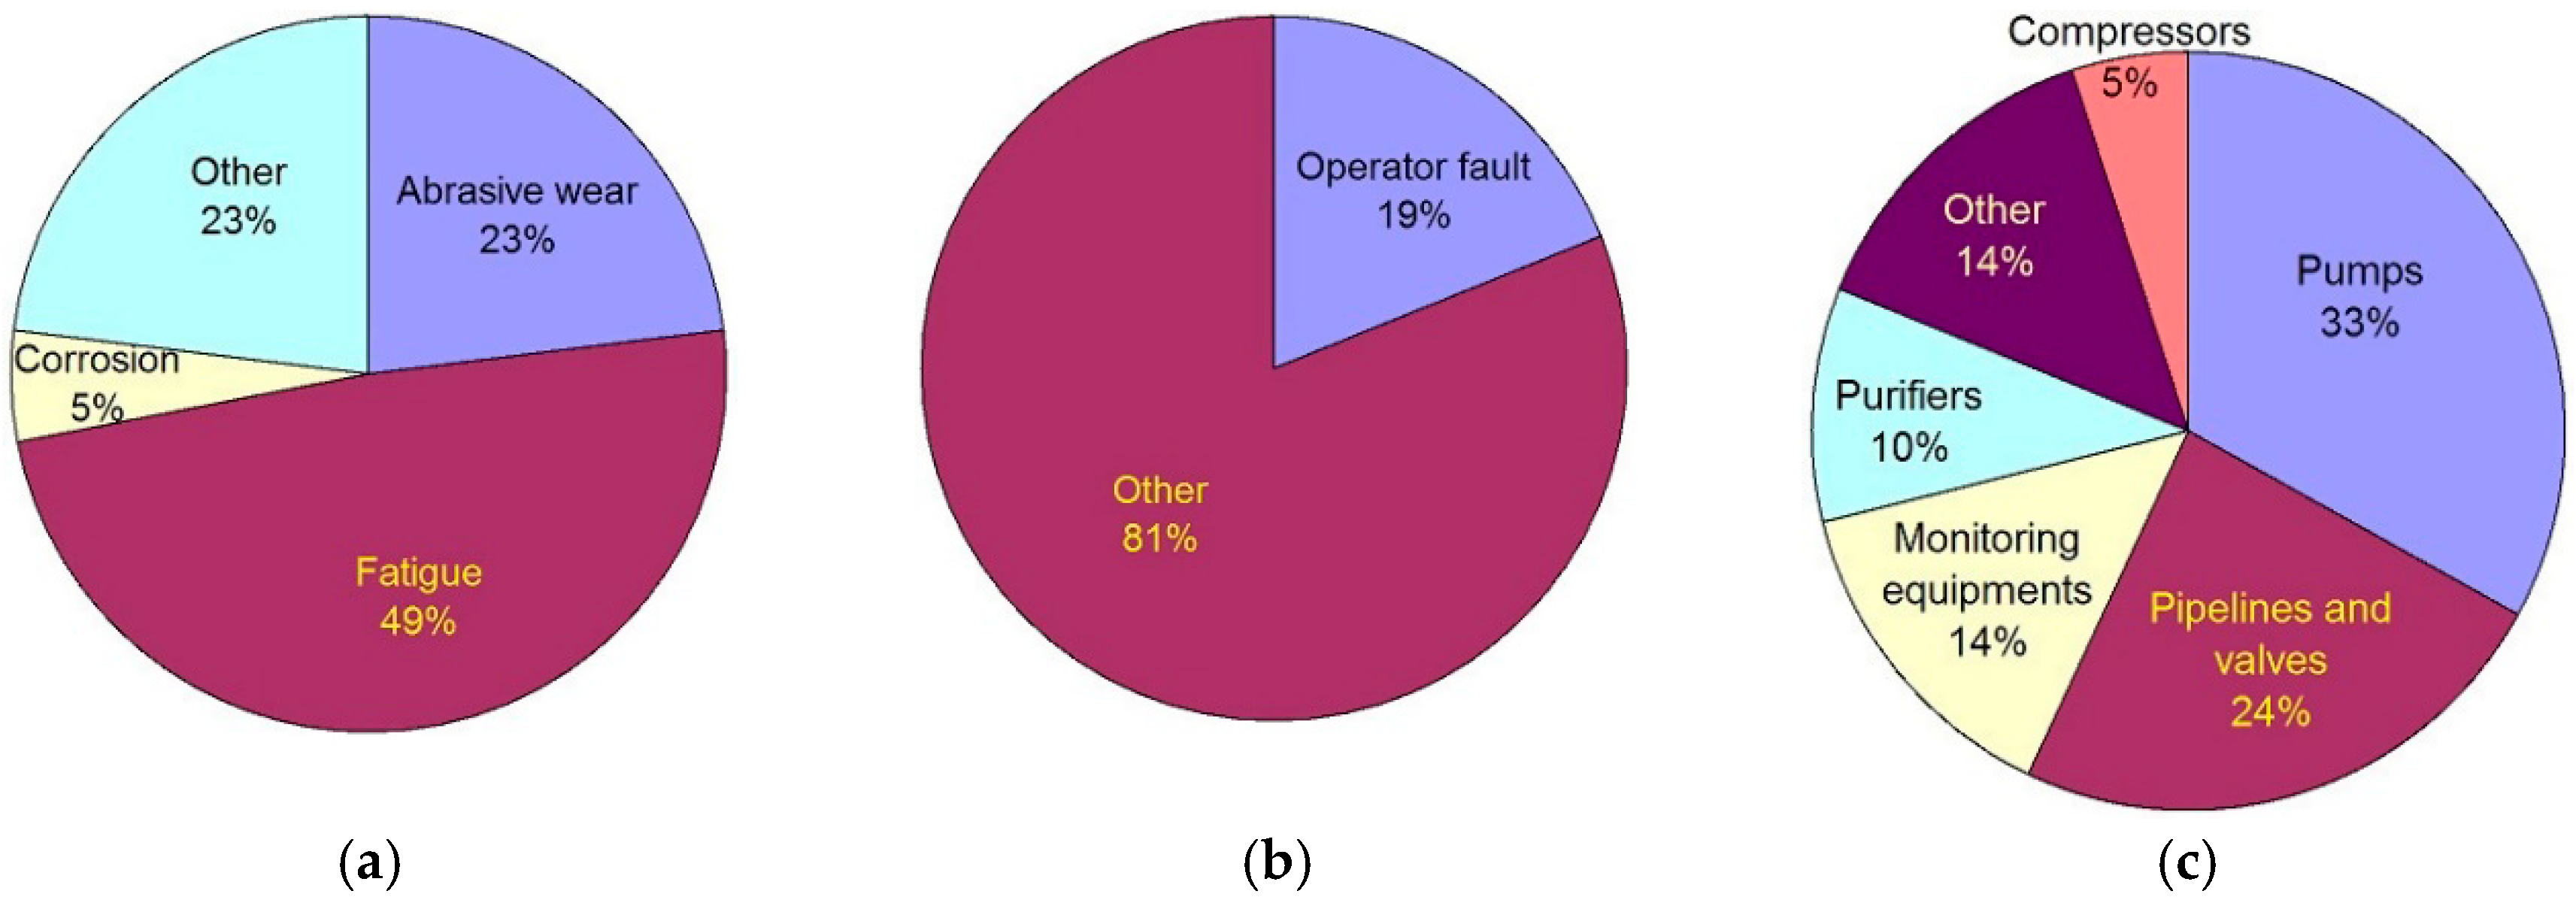
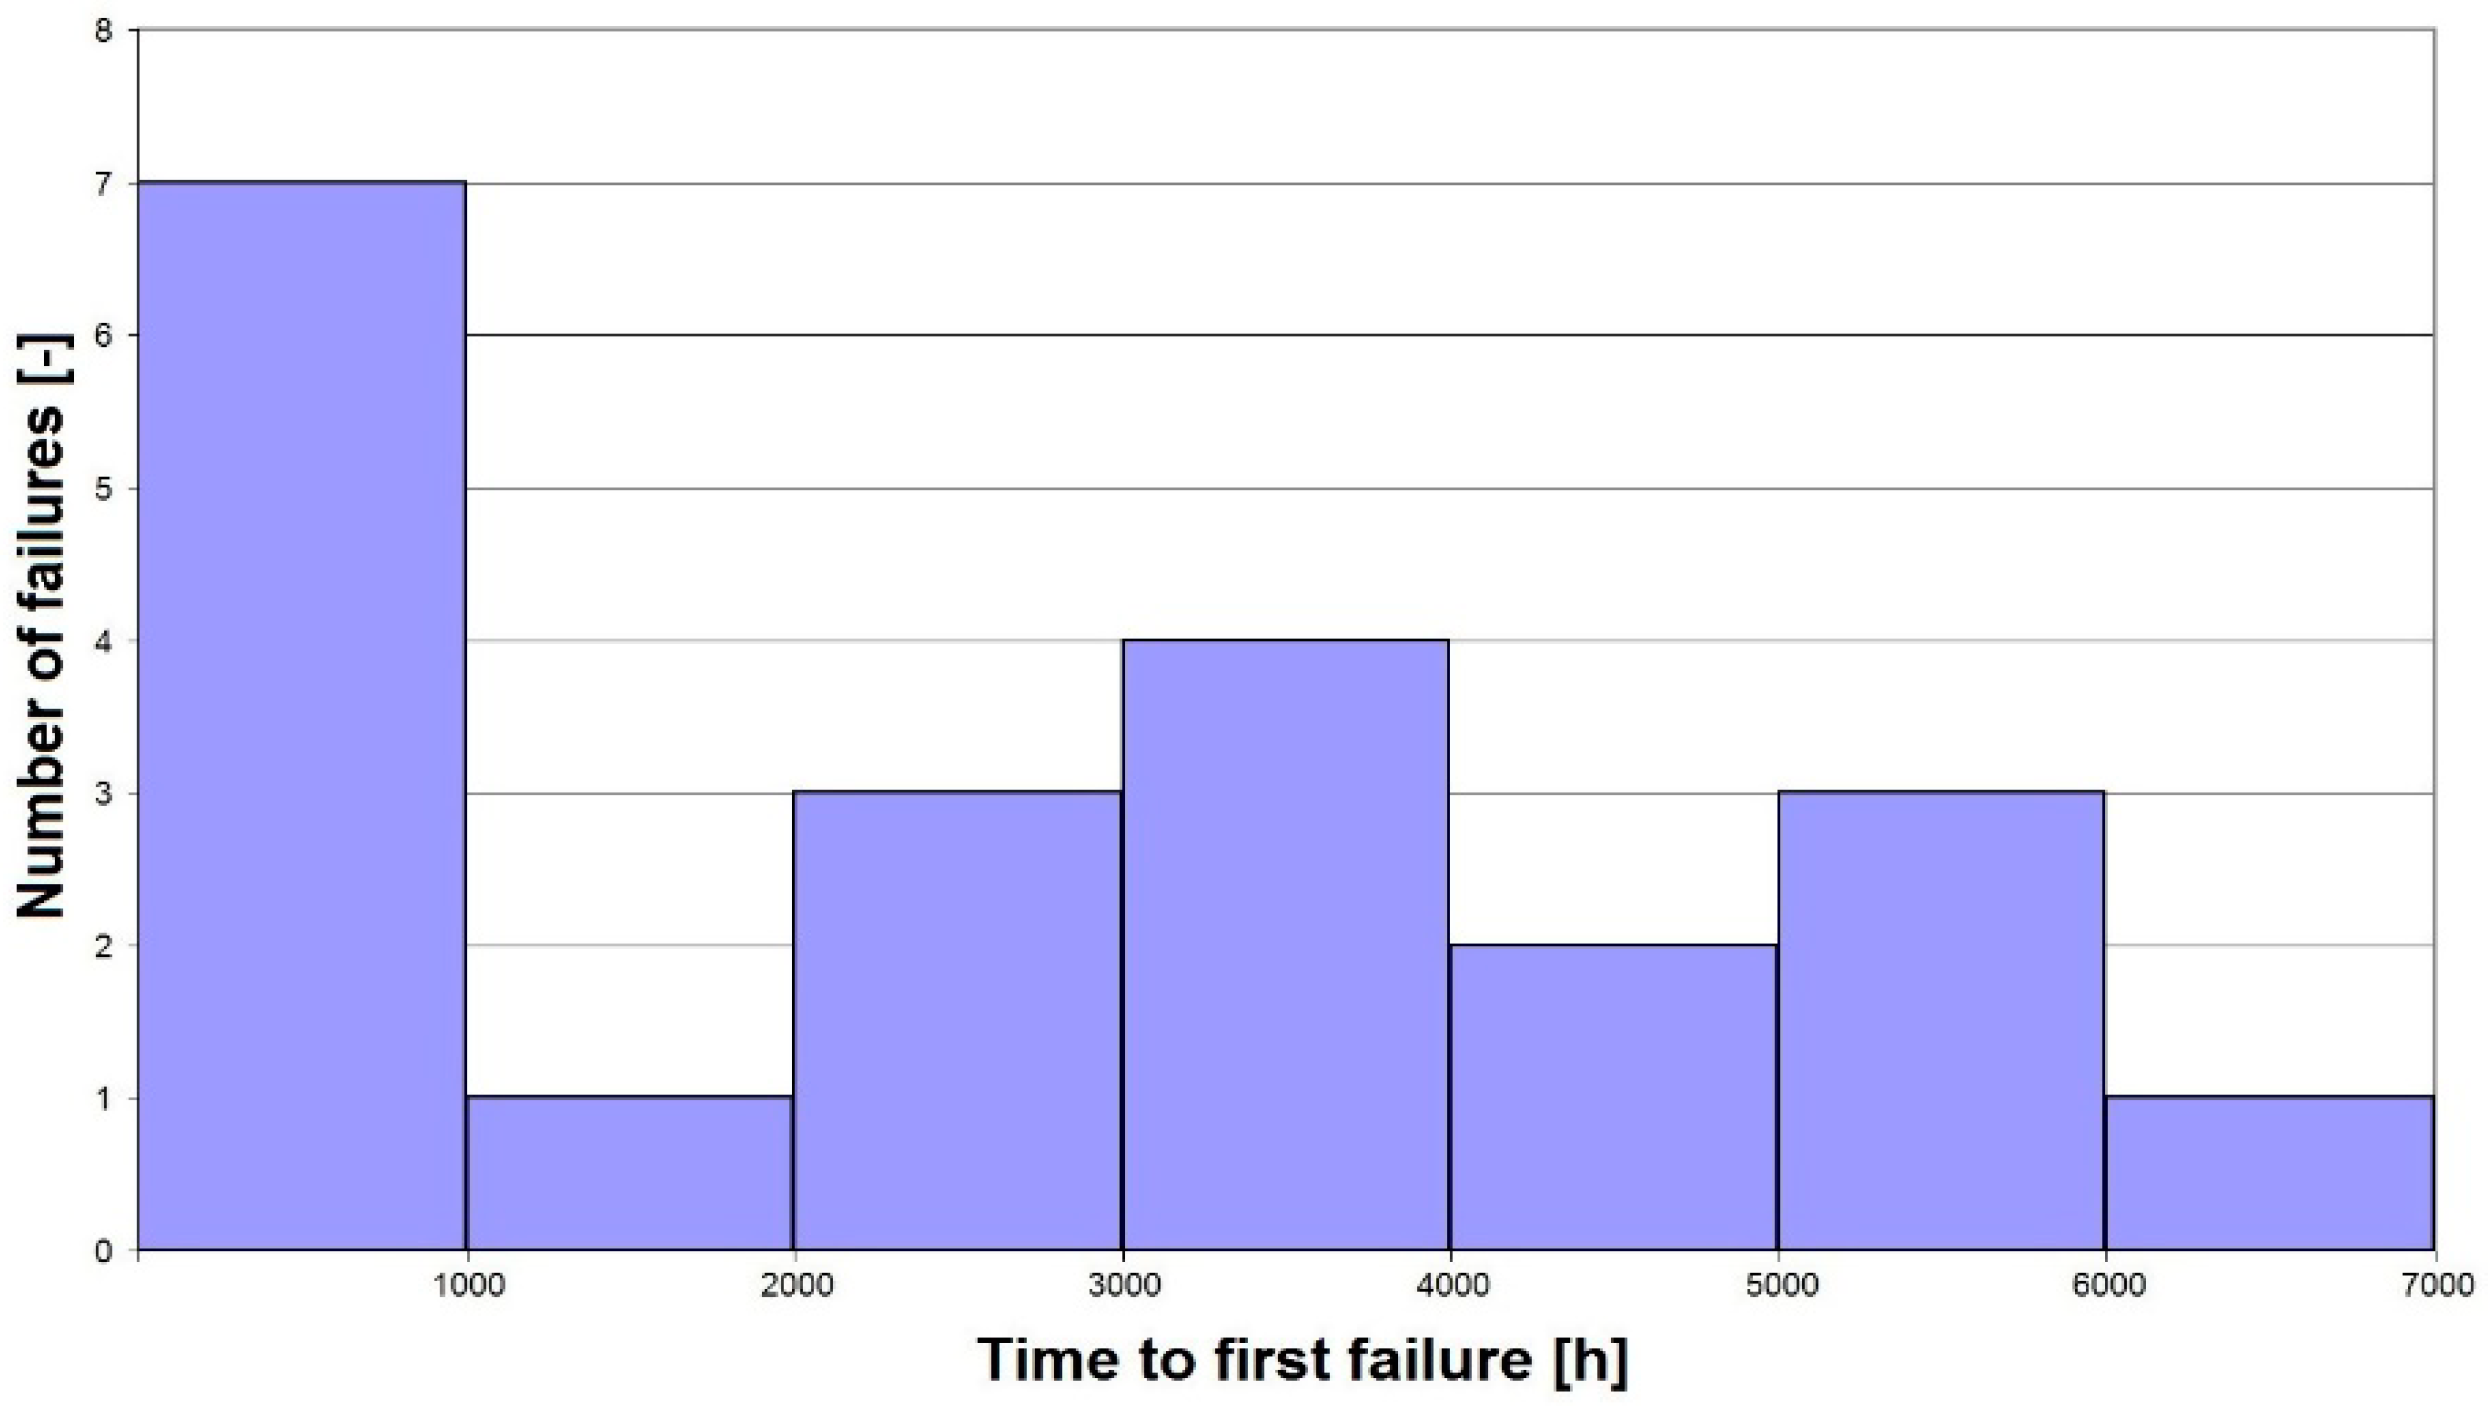
During a hydraulic-electric inspections of the cranes with a maximal load capacity of 35 t, it was found that in cranes nos. 1 and 3, the carrying ropes had fractured strands in different locations (Figure 6). Due to the low number of the total operating hours of the cranes, and the high cost of buying new ropes, the ship was visited by an expert sent by the ship’s owner to evaluate the situation. After surveying the ropes and the cranes and making measurements, the expert, along with the senior mechanic, did not find any reason for the rope breakage on the crane’s side. The cranes, along with the whole tooling, were still under the warranty period by their producer, to which the documentation of failures was sent. In the nearest convenient port, the ship was visited by a service team from the producer, and after making their own inspections and measurements, they also did not find any defect in the crane. Error due to the crane operator was also ruled out, since the ropes could not have been damaged by incorrect operation.
The producer’s inspection results indicated that the responsibility for the rope breakage, which was incorrectly made using low-quality materials, is on the side of the shipyard in which the ship was built. The failed ropes were replaced, and a spare rope was purchased. It was recommended that the ropes on the other two cranes be inspected twice as frequently.

4. Discussion

For the observed failures, statistics of susceptibility to failures were prepared. Moreover, based on the cause and effect analysis conducted on the ship and the available technical documentation, an attempt was made to categorise the particular failures. A quantitative presentation of failures in the particular systems is presented in Figure 7. Most failures occurred in the ballast-bilge system (4 failures) and in the steam heating, fuel cleaning and transhipment systems (3 failures in each system).
A low number of failures in subsequent systems prevented an in-depth analysis of differences in the susceptibility to failures of particular subsystems of the ship, as well as the ability to reliably characterise particular components and subsystems. A general examination of the character of processes occurring during operation is provided by the statistics of a portion of particular events in the failure processes.
Assessing the severity of the observed damage indicated that the cargo crane ropes were the most dangerous elements, and may endanger the lives and safety of the crew. Secondly, ensuring the operation of the seawater pumps is necessary to maintain the readiness of the ship’s engine room. Ensuring the proper operation of these elements made it possible to achieve uninterrupted operation.
Subsequent positions of the severity of the damages were taken by the ballast pumps, air compressors and fuel centrifuges, which are all redundant elements, so that their individual failure will not directly stop the vessel’s operation.
Figure 8a shows the percentage of failures divided by the type of wear, and Figure 8b shows the number of failures due to operator error. The dominant wear type was fatigue wear, which caused 49% of observed failures, followed by abrasive wear (23%), while corrosive wear accounted for 5%. The remaining 32% of failures were related to the operation of components under mechanical and/or thermal overload. Operator errors were a direct cause of 19% of the observed failures. Similarly, particular failures can be divided by the type of failed component. Such a division is presented in Figure 8c, which shows the most common failures were pump failures (33%), pipes and valve failures (24%), and monitoring equipment failures (14%).
Because failures had been recorded since the ship’s launch (i.e., from the beginning of its operation), the observed moments of failures are also values of a specific reliability index—the time to first failure. Figure 9 presents the number of failures observed during 1000 h of the ship’s operation.
The distribution allows it to be concluded that most failures occurred in the first 1000 h of operation (7 failures, which accounted for more than 33% of all observed failures). These resulted from the mutual adjustment of components to specific operating conditions, which is a phenomenon known as running-in. It also confirmed the existence of an infant period in the operation process, during which the majority of material and technological defects in the system components appeared. After the first 1000 h, the failure intensity in subsequent 1000-h operating periods remained within the range of 0.001–0.004 h−1.
The pie chart in Figure 10 represents the percentage of failure modes relative to the number of hours the equipment has been operated. Out of the 13 failures observed in equipment that does not work continuously, as many as 7 (which constitutes 54% of the total failures in this type of equipment), performed for no more than five hundred hours. These problems could not be attributed merely to poor workmanship, or to the usage of improper materials during the production of the given elements. They likely also include errors during the assembly of previously-prepared parts and the improper handling of individual devices by the crew or operators.
To achieve the highest possible efficiency of the ship under increasingly competitive conditions in the shipping industry, and to ensure the formal safety of the ship, ship owners are encouraged to optimise the operation of machines in their ships’ incorporated systems. One of the measures aimed at optimisation is to replace statutory maintenance inspections with diagnoses, and to move from a service strategy by department to a service strategy by condition.

5. Conclusions

The material presents an analysis of the failure data received from a selected vessel during its first year of operation. It shows a relatively high number of failures within this period, which is in line with the bathtub curve model regarding the first operation phase.
In the future, it will be valuable to continue the presented research and collect the reliability data from the same ship during the next years of operation. Such data could be used for a comparative analysis and for modelling of the first two phases of operation, that is, “infant mortality” and “normal life”. It is especially important regarding the failure modes identified as ones with the high severity. The data presented in the paper might also be used for a comparative analysis of similar types of vessels whose failure data belong to the same general population.

Author Contributions

Conceptualization, L.C. and R.L.; methodology, L.C., K.G. and R.L.; software, L.C.; validation, L.C., K.G. and R.L.; formal analysis, L.C., K.G. and R.L.; investigation, L.C., K.G. and R.L.; resources, L.C. and R.L.; data curation, L.C., K.G. and R.L.; writing—original draft preparation, L.C., K.G. and R.L.; writing—review and editing, L.C., K.G. and R.L.; visualization, L.C., K.G. and R.L.; supervision, L.C.; project administration, L.C.; funding acquisition, L.C.

Funding

This publication was developed as part of project Grant 1/S/IESO/17: “Increasing operational effectiveness of complex technical systems by systematic development and implementation of innovations using novel materials and modifying the object’s structure” commenced at the Maritime University of Szczecin.

Acknowledgments

Support given by the Ministry of Science and Higher Education of Poland, from project Grant 1/S/IESO/17.

Conflicts of Interest

The authors declare no conflict of interest.

References

  1. Chybowski, L. Components Importance Analysis in Complex Technical Systems; Institute for Sustainable Technologies–National Research Institute, Scientific Publishers ITE-PIB: Radom, Poland, 2014. (In Polish) [Google Scholar]
  2. Rozmarynowska, M. World economic crisis and its implications for maritime transport sector. Prace Wydziału Nawig. Akad. Mor. W Gdyni 2012, 27, 21–34. (In Polish) [Google Scholar] [CrossRef] [Green Version]
  3. Saputra, H.; Muvariz, M.F.; Satoto, S.W.; Koto, J. Estimation of exhaust ship emission from marine traffic in the straits of Singapore and batam waterways using automatic identification system (AIS) data. J. Teknol. 2015, 77, 47–53. [Google Scholar] [CrossRef]
  4. Balcerski, A.; Bocheński, D. Technological and Energetic Systems of Offshore Vesselss; Publishing House of Gdansk University of Technology: Gdańsk, Poland, 1998. (In Polish) [Google Scholar]
  5. Chybowski, L.; Idziaszczyk, D.; Wiśnicki, B. A Comparative Components Importance analysis of A Complex Technical System with The Use of Different Importance Measures. In Systems Supporting Production Engineering. Review of Problems and Solutions; Kaźmierczak, J., Ed.; P.A. NOVA: Gliwice, Poland, 2014; pp. 23–33. [Google Scholar]
  6. Chybowski, L.; Laskowski, R.; Gawdzińska, K. An overview of systems supplying water into the combustion chamber of diesel engines to decrease the amount of nitrogen oxides in exhaust gas. J. Mar. Sci. Technol. 2015, 20, 393–405. [Google Scholar] [CrossRef]
  7. Laskowski, R.; Chybowski, L.; Gawdzińska, K. An engine room simulator as a tool for environmental education of marine engineers. New Contrib. Inf. Syst. Technol. Adv. Intell. Syst. Comput. 2015, 354, 311–322. [Google Scholar] [CrossRef]
  8. Chybowski, L. Qualitative and Quantitative Multi-Criteria Models of the Importance of the Components in Reliability structure of a Complex Technical System. J. KONBIN 2012, 4, 33–48. [Google Scholar] [CrossRef]
  9. Batalden, B.-M.; Sydnes, A. What causes ‘very serious’ maritime accidents? In Safety and Reliability—Theory and Applications; Cepin, M., Bris, R., Eds.; Taylor and Francis Group: London, UK, 2017; pp. 3067–3074. [Google Scholar]
  10. Gawdzińska, K.; Chybowski, L.; Przetakiewicz, W. Proper matrix-reinforcement bonding in cast metal matrix composites as a factor of their good quality. Arch. Civ. Mech. Eng. 2016, 16, 553–563. [Google Scholar] [CrossRef]
  11. Zółkiewski, S. Diagnostics and transversal vibrations control of rotating beam by means of Campbell diagrams. Key Eng. Mater. 2014, 588, 91–100. [Google Scholar] [CrossRef]
  12. Łuczak, A.; Mazur, T. Physical Ageing of Machine Parts; Polish Technical and Scientific Publishing-WNT: Warsaw, Poland, 1981. (In Polish) [Google Scholar]
  13. Popov, V.L. Contact Mechanics and Friction: Physical Principles and Applications; Springer: Berlin/Heidelberg, Germany, 2010. [Google Scholar] [CrossRef]
  14. Ziemba, S. (Ed.) Physical Aspects of Durability and Reliability of Technical Objects; Polish Scientific Publishers PWN: Warsaw, Poland, 1976. (In Polish) [Google Scholar]
  15. Chybowski, L.; Żółkiewski, S. Basic reliability structures of complex technical systems. New Contrib. Inf. Syst. Technol. Adv. Intell. Syst. Comput. 2015, 354, 333–342. [Google Scholar] [CrossRef]
  16. Matuszak, Z. Modeli Otkazov I Prinadlieznost Danich Ob Otkazach K Gieneralnoi Sobokupnosti Na Primierie Sudovych Energieticzieskich Ustanovok; KGTU: Kaliningrad, Russia, 2002; ISBN 5-94826-015-1. [Google Scholar]
  17. Czajgucki, J.Z. Reliability of Marine Diesel Power Plants; Wydawnictwo Morskie: Gdańsk, Poland, 1984. (In Polish) [Google Scholar]
  18. OREDA Handbook 2015. Offshore and Onshore Reliability Data, 6th ed.; SINTEF: Trondheim, Norway, 2015; Volume 1.
  19. Laskowski, R. Evaluation of Susceptibility to Failures of Components of Ship Power Plant. Master’s Thesis, Faculty of Marine Engineering, Maritime University of Szczecin, Szczecin, Poland, 2012. (In Polish). [Google Scholar]
  20. Kostrzewa, W.; Gawdzińska, K.; Bejger, A. The use of Pareto-Lorenz analysis for the determination of faults in fishing vessel refrigerating systems. Sci. J. Marit. Univ. Szczec. 2013, 36, 90–93. [Google Scholar]
Figure 1. Plot of failure intensity λ of an object during its operation.
Jmse 07 00213 g001
Figure 2. Bulk cargo ship used to record technological and energetic system (TES) failures.
Jmse 07 00213 g002
Figure 3. Failure of pump no. 1 in the seawater cooling system: (a) Primary cause of failure; (b) components of the failed patent mechanical seal.
Jmse 07 00213 g003
Figure 4. Failure modes of pump no. 1 in the seawater cooling system: (a) Failed sealing ring, and (b) secondary failure of the pump shaft caused by abrasive wear.
Jmse 07 00213 g004
Figure 5. Failure of the refrigerating compressor: (a) Fractured valve plates; (b) valve plate on the compressor.
Jmse 07 00213 g005
Figure 6. Failures of the cranes’ carrying ropes: (a,b) Crane no. 3; (c) crane no. 1.
Jmse 07 00213 g006
Figure 7. Number of failures amongst the analysed systems.
Jmse 07 00213 g007
Figure 8. Number of failures by: (a) Type of wear; (b) participation of the operator in the failure occurrence; and (c) component type.
Jmse 07 00213 g008
Figure 9. Components’ number of failures as a function of mission time.
Jmse 07 00213 g009
Figure 10. Representation of the percentage of damage relative to the number of hours worked by the equipment.
Jmse 07 00213 g010
Table 1. Basic data of the analysed ship.
ParameterValueUnit
Overall length189.99M
Length between perpendiculars185M
Moulded breadth32.26M
Summer draught12.8M
Dead weight56,728tonne
Speed13knots
Table 2. Observed failures of components of subsystems of the power plant.
SystemFailed ComponentDescription of Failure TypeTime to First Failure [h]Type of Wear/Character of EventMethod of Restoration
Seawater cooling systemSeawater pump no. 1Leaking mechanical seal; water leak2257Corrosion, unfiltered water, abrasive wear, thermal strainPump repair: Replacement of mechanical seal and bearing
Seawater pump no. 2Leaking mechanical seal; water leak; secondary shaft failure1983Corrosion, unfiltered water, abrasive wear, thermal strainPump repair: Replacement of mechanical seal, bearing and sealing ring
Steam systemHeating coil of the fuel containerFracture of a weld3600OverheatingBlanking off a pipe
Left water-level gauge of the boilerFracture of a glass4320OverheatingReplacement of seals and glasses
Right water-level gauge of the boilerFracture of a seal5760Fatigue wear, material defectsReplacement of seals and glasses
HFO purifying systemPump supplying the centrifugeLeaking mechanical seal; fuel leak2155Abrasive wear, thermal strainPump repair: Replacement of mechanical seal
HFO purifierLeak of fuel from the barrel; fractured PTFE sealing ring of barrel cover2640Vibrations, abrasive wear
in higher temperature
Replacement of sealing ring
HFO purifierBowl opens inadvertently during centrifuge operation3035Vibrations, abrasive wear
in higher temperature
Replacement of PTFE plugs of rubber sealing rings.
Compressed air systemPressure reducing valve
(3/0.7 MPa)
Excessive pressure on the outlet; failed membrane and springs5760VibrationsValve repair: Replacement of the spring and rubber membrane.
System of cleaning main engine scavenging air coolersValve on the pump outletFractured mechanical seal shield; fractured fixing of valve body6480VibrationsReplacement of valve
Table 3. Observed component failures of general ship subsystems.
SystemFailed ComponentDescription of Failure TypeTime to First Failure [h]Type of Wear/Character of EventMethod of Restoration
Sanitary water systemHeater circulating pumpLeaking mechanical seal; water leak3600OverheatingPump repair: Mechanical seal replacement
Thermostatic valveFractured housing of a control unit; water temperature not on a defined level5760Vibrations, Fatigue wearControl unit replacement
Ballast-bilge systemPower plant bilge pumpDecrease of pump efficiency60Abrasive wear/human error (improper operation)Pump repair: Replacement of rotor and stator
Level sensor in left bow bilge wellDamaged high water level signal in the well4320Corrosive wear/human error (improper system of a sealing ring)Sensor replacement
Ballast pump no. 2Fractured mechanical seal; water leak275Corrosion, unfiltered water, abrasive wear, thermal strainPump repair: Replacement of mechanical seal and bearing
Ballast pump no. 1Fractured mechanical seal; water leak315Corrosion, unfiltered water, abrasive wear, thermal strainPump repair: Replacement of mechanical seal and bearing
Provision refrigeration plantRefrigerating compressor no. 1Overload of the electric motor; too high power consumption; thermal safety device turned off the electric motor. Reason: Fracture of two pumping valves of the compressor; secondary contamination of cooling system3320Vibrations, abrasive wear, fatigue wear in higher temperatureValve plate replacement
Table 4. Observed failures in the ship’s technological system components.
SystemFailed ComponentDescription of Failure TypeTime to First Failure [h]Type of Wear/Character of EventMethod of Restoration
Drive of cargo bay hatchesHydraulic oil control systemOil leak out of cut-off ball valve; fractured sealing267Fatigue wear/human error (improper system)Seal replacement
Ship’s transhipment systemGrab of crane no. 4Deformation of arm and jaw of the grab135Plastic strain/human error (improper operation)Damage not repaired
Lift rope of crane no. 3Rope failure; fractured strand283Fatigue wear, material defectsRope replacement
Lift rope of crane no. 1Rope failure; fractured strand314Fatigue wear, material defectsRope replacement

