Article

Identification and Analysis of Vulnerability in Traffic-Intensive Areas of Water Transportation Systems

1
School of Transportation, Wuhan University of Technology, Wuhan 430063, China
2
National Engineering Research Center for Water Transport Safety, Wuhan 430063, China
3
Navigation College, ShanDong JiaoTong University, Weihai 264209, China
4
School of Business, University of Jinan, Jinan 250022, China
*
Author to whom correspondence should be addressed.
J. Mar. Sci. Eng. 2019, 7(6), 174; https://doi.org/10.3390/jmse7060174
Submission received: 28 April 2019 / Revised: 27 May 2019 / Accepted: 29 May 2019 / Published: 2 June 2019

Abstract

:
Water transportation accidents have occurred frequently in recent years. In order to improve the emergency response capability of water transportation systems under traffic-intensive conditions, this paper identifies and analyzes the vulnerability in traffic-intensive areas of water transportation systems. Firstly, the vulnerability identification model was constructed based on the analysis of characteristics and the vulnerability-influencing factors of water transportation systems. The newly proposed model is composed of three parts including the DEMATEL (Decision Making Trial and Evaluation Laboratory) method, ISM (interpretative structural modeling) model, and AHP (Analytic Hierarchy Process)–entropy weight method. Finally, a case study of the Yangtze River was conducted to test the logicality and feasibility of the proposed model. The research results reveal that traffic flow density, ship traffic, tides, fog, and bad weather are the key factors affecting the vulnerability of water transportation in traffic-intensive areas of the Yangtze River estuary. However, the influence of navigation aid configuration, berth, anchorage, and obstruction on the system vulnerability is relatively lower. The findings of this study can provide helpful references for maritime administration authorities on the management of water transportation safety.

1. Introduction

In recent years, water transportation has rapidly developed in China. According to the data of the Ministry of Transport of China, inland water navigation mileage is up to 1.27 million kilometers, and there are 1.45 million transport vessels in China at the end of 2017 [1]. With more and more traffic flow, water system accidents occur frequently, especially in the harsh navigation environments and complicated meteorological conditions. In 2017 only, there were 96 waterborne traffic accidents [1]. Traffic-intensive areas of water transportation systems have become the areas with a high incidence of accidents [2,3]. Traffic congestion and traffic accidents occur frequently in traffic-intensive areas, which not only cause huge economic losses for shipping companies and countries, but also have an immeasurable impact on the water environment. The safety of traffic-intensive areas has attracted the attention of the relevant managing department and researchers [4,5,6]. In order to identify safety concerns in advance and improve the safety of the water transportation system, this paper seeks to identify and analyze the vulnerability factors in traffic-intensive areas of the water transportation system.
The concept of vulnerability was first put forward and taken into practice by Adger in the natural science field [7]. Transport specialists began to study the vulnerability of the transportation network. Sun et al. adopted an urban rail transit network model in a complex system to simulate separate attack strategies and sequential attack strategies, and used average connectivity efficiency as a criterion for judging network vulnerability [8]. Deng et al. used network theory, failure mode effects and critical analysis methods to analyze the vulnerability of the subway system [9]. Jenelius and Mattsson defined the concept of road traffic network vulnerability, and proposed quantitative analysis indicators and algorithms [10]. Kamissoko et al. proposed a general framework for vulnerability analysis of complex systems of infrastructure network from both static and dynamic perspectives. Then, they performed vulnerability assessment through simulation techniques and performed brittleness analysis on decision support systems [11]. Mattsson and Jenelius discussed the latest research status of the vulnerability of transportation systems and proposed a topological traffic network vulnerability analysis model based on traditional graph theory [12]. Fang et al. proposed a new quantitative evaluation method based on road network vulnerability by using the vulnerability data of an origin-destination toll station highway network [13]. Voltes-Dorta et al. analyzed the vulnerability of the European air transport network to major airport closures from the perspective of the delays imposed to disrupted airline passengers [14].
As the complexity and systematisms of the transportation system were gradually recognized, complex network theory and system engineering theory were applied to study the vulnerability of the transportation system. Sun and Guan measured the metro network vulnerability from the perspective of line operation by taking the Shanghai metro network as a case study [15]. Xing et al. quantitatively evaluated the vulnerability of the metro network to different failures or attacks from a networking perspective [16]. Hong et al. proposed a vulnerability model of complementary urban public transportation systems composed of bus systems and subway systems, with the consideration of passengers’ intermodal transfer distance preference to capture different levels of complementary strength between the two systems [17]. Zhang et al. analyzed the networked characteristics of three metro networks, and two malicious attacks were employed to investigate the vulnerability of metro networks based on connectivity vulnerability and functionality vulnerability [18]. Sun et al. quantitatively analyzed statistical topology parameters of the Beijing rail transit network based on complex network theory [19]. Ma et al. examined the impact of rainstorms on the vulnerability of urban–public transport systems consisting of both ground bus and metro systems, which was abstracted into an undirected weighted Bus–Metro complex bilayer network (Bus–Metro CBN) and the passenger volume was regarded as its weight [20].
From the above literature review it can be seen that the vulnerability of transportation systems has been a highlight in the past. Some studies recognized that complex network theory and system engineering theory could handle the vulnerability problems. However, the vulnerability of the water transportation system has rarely been studied, especially in traffic-intensive areas. Therefore, this paper focuses on integrating system engineering theory to identify the key vulnerabilities of the water transportation system. Vulnerability factors are characterized by concealment and ambiguity, and the occurrence of an intensive water accident is generally a small probability event, which makes it difficult to study the vulnerability by using actual data. There are inevitable difficulties and errors in the collection of vulnerability factors. To overcome these challenges, this paper develops a novel model by combining the DEMATEL (Decision Making Trial and Evaluation Laboratory), the ISM (Interpretative Structural Modeling) model, and the AHP (Analytic Hierarchy Process)–entropy weight method for analyzing vulnerabilities of water transportation systems, especially in traffic-intensive areas. The analytical model and method proposed in this paper can integrate the mutual influence degree of the internal structural vulnerability factors of the water transportation system. Further, this method can identify the key vulnerability factors in traffic-intensive areas of the water transportation system.
The rest of this paper is organized as follows. Section 2 establishes the vulnerability identification model. Section 3 describes modeling methods in detail. Section 4 presents a typical case of the Yangtze River estuary to illustrate the application of the proposed model. Finally, Section 5 concludes this study and discusses the limitations and future work.

2. Establishment of the Vulnerability Identification Model

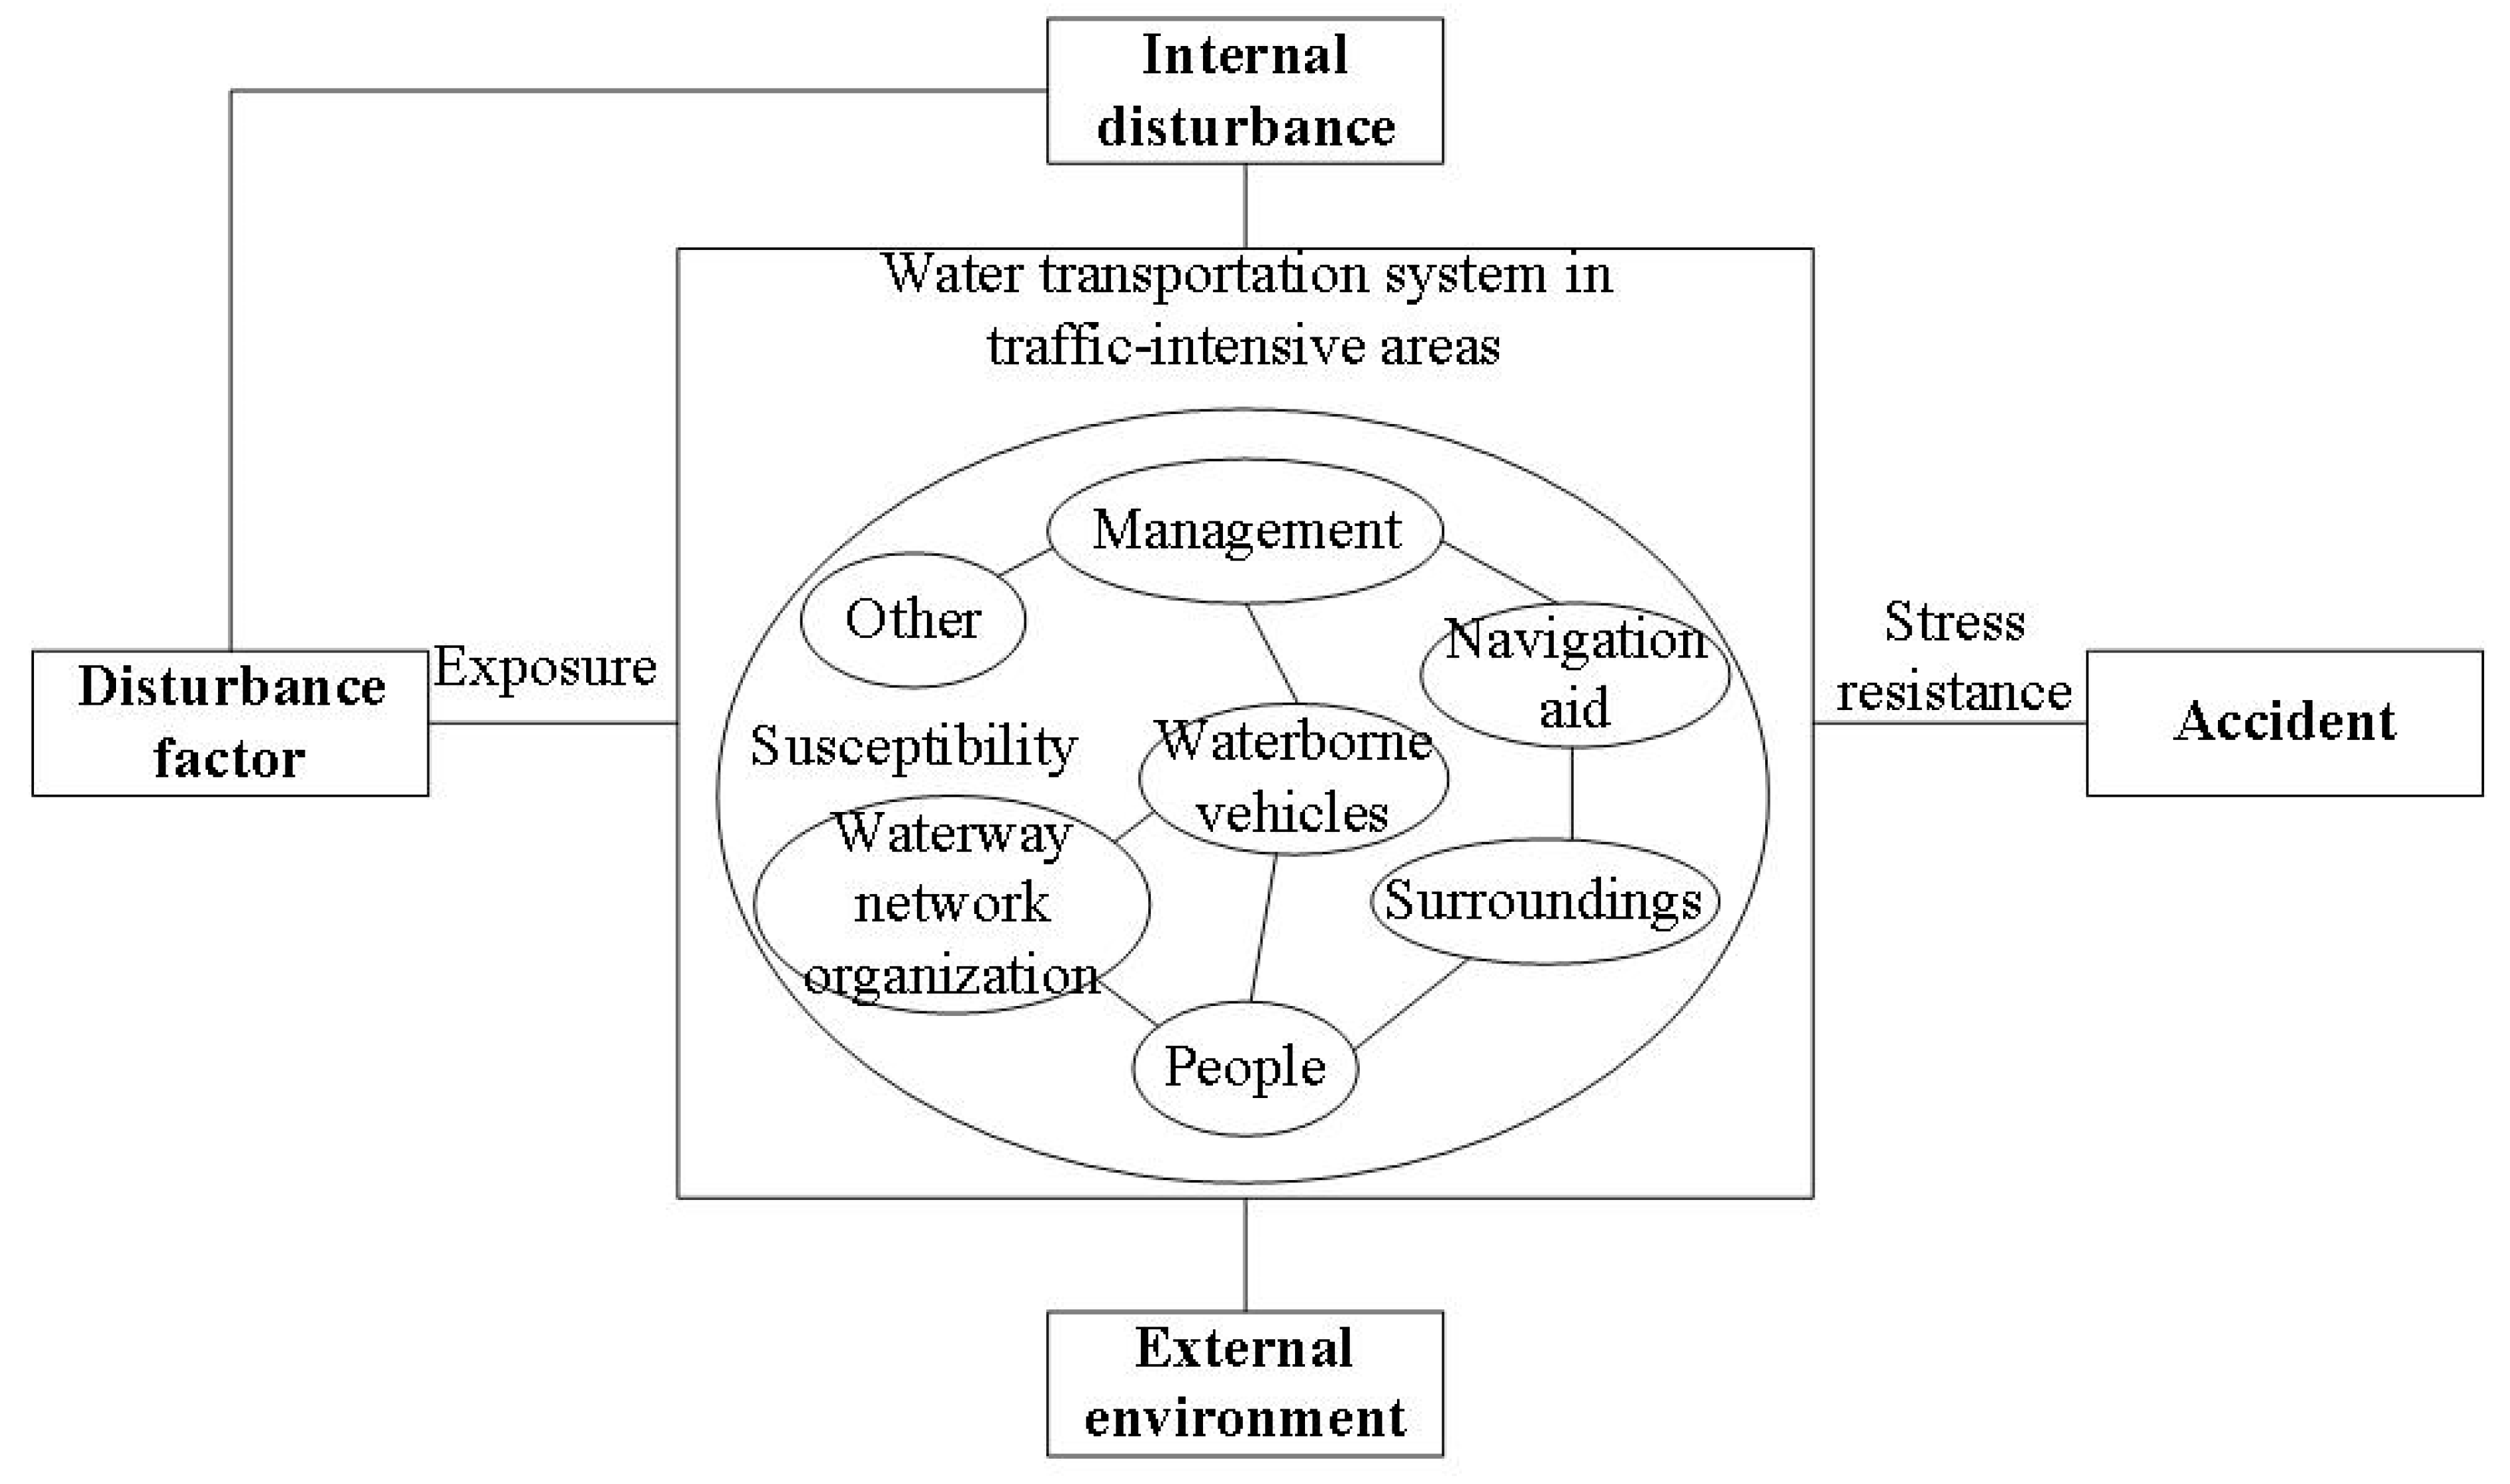
2.1. Definition of Water Transportation Vulnerability

The research on vulnerability first appeared in the field of natural disasters [7]. Now, the vulnerability refers to a system S that is a subsystem or a part of Si, which is sensitive to the environment. When Si is disturbed by internal or external factors or attacks, it will cause other parts or subsystems to collapse, which may cause the entire network to collapse. The definition of vulnerability includes the role of internal factors in the system, and the vulnerability of the system to the external environment [21].
Based on the basic theory of vulnerability, this paper defines the vulnerability of the water transportation system in traffic-intensive waters as the possibility that the vulnerability factor is subject to the disturbance factor and thus exposed to the unfavorable situation. Meanwhile, the system has a certain resistance to the vulnerability of the disturbance until the resilience reaches a limit. After the limit, it will cause the collapse of the water transportation system. In this paper, the definition of the mechanism of vulnerability is mainly considered from three aspects: exposure, susceptibility, and stress resistance. Among these, exposure refers to the degree of influence of the water transportation system itself under the disturbance factor. Susceptibility refers to the lack of effective anti-interference. The anti-stress ability of the water transportation system, or the system structure and operation mechanism, do not change substantially under disturbance. Stress resistance refers to the ability of the system to self-adjust when faced with internal and external disturbances. The mechanism of the vulnerability of the water transportation system in traffic-intensive waters studied is shown in Figure 1.

2.2. Characteristics of Traffic-Intensive Areas of the Water Transportation System

Owing to the coupling of multiple factors, ship navigation accidents occur frequently. Previous studies have indicated that ship accidents are closely connected to traffic-intensive areas [22,23]. Therefore, it is meaningful to analyze the characteristics of traffic-intensive areas of water transportation systems, and it is also beneficial to identify the key vulnerability factors affecting the water transportation system. The traffic flow intensive water transportation system mainly includes the following characteristics, as shown in Table 1.
In conclusion, the characteristics of flow intensive waters are closely related to ship traffic flow, shipping environment, and shipping service. Thus, the vulnerability factors in traffic-intensive areas of water transportation systems are divided into three subsystems: ship traffic flow, shipping environment, and shipping service.

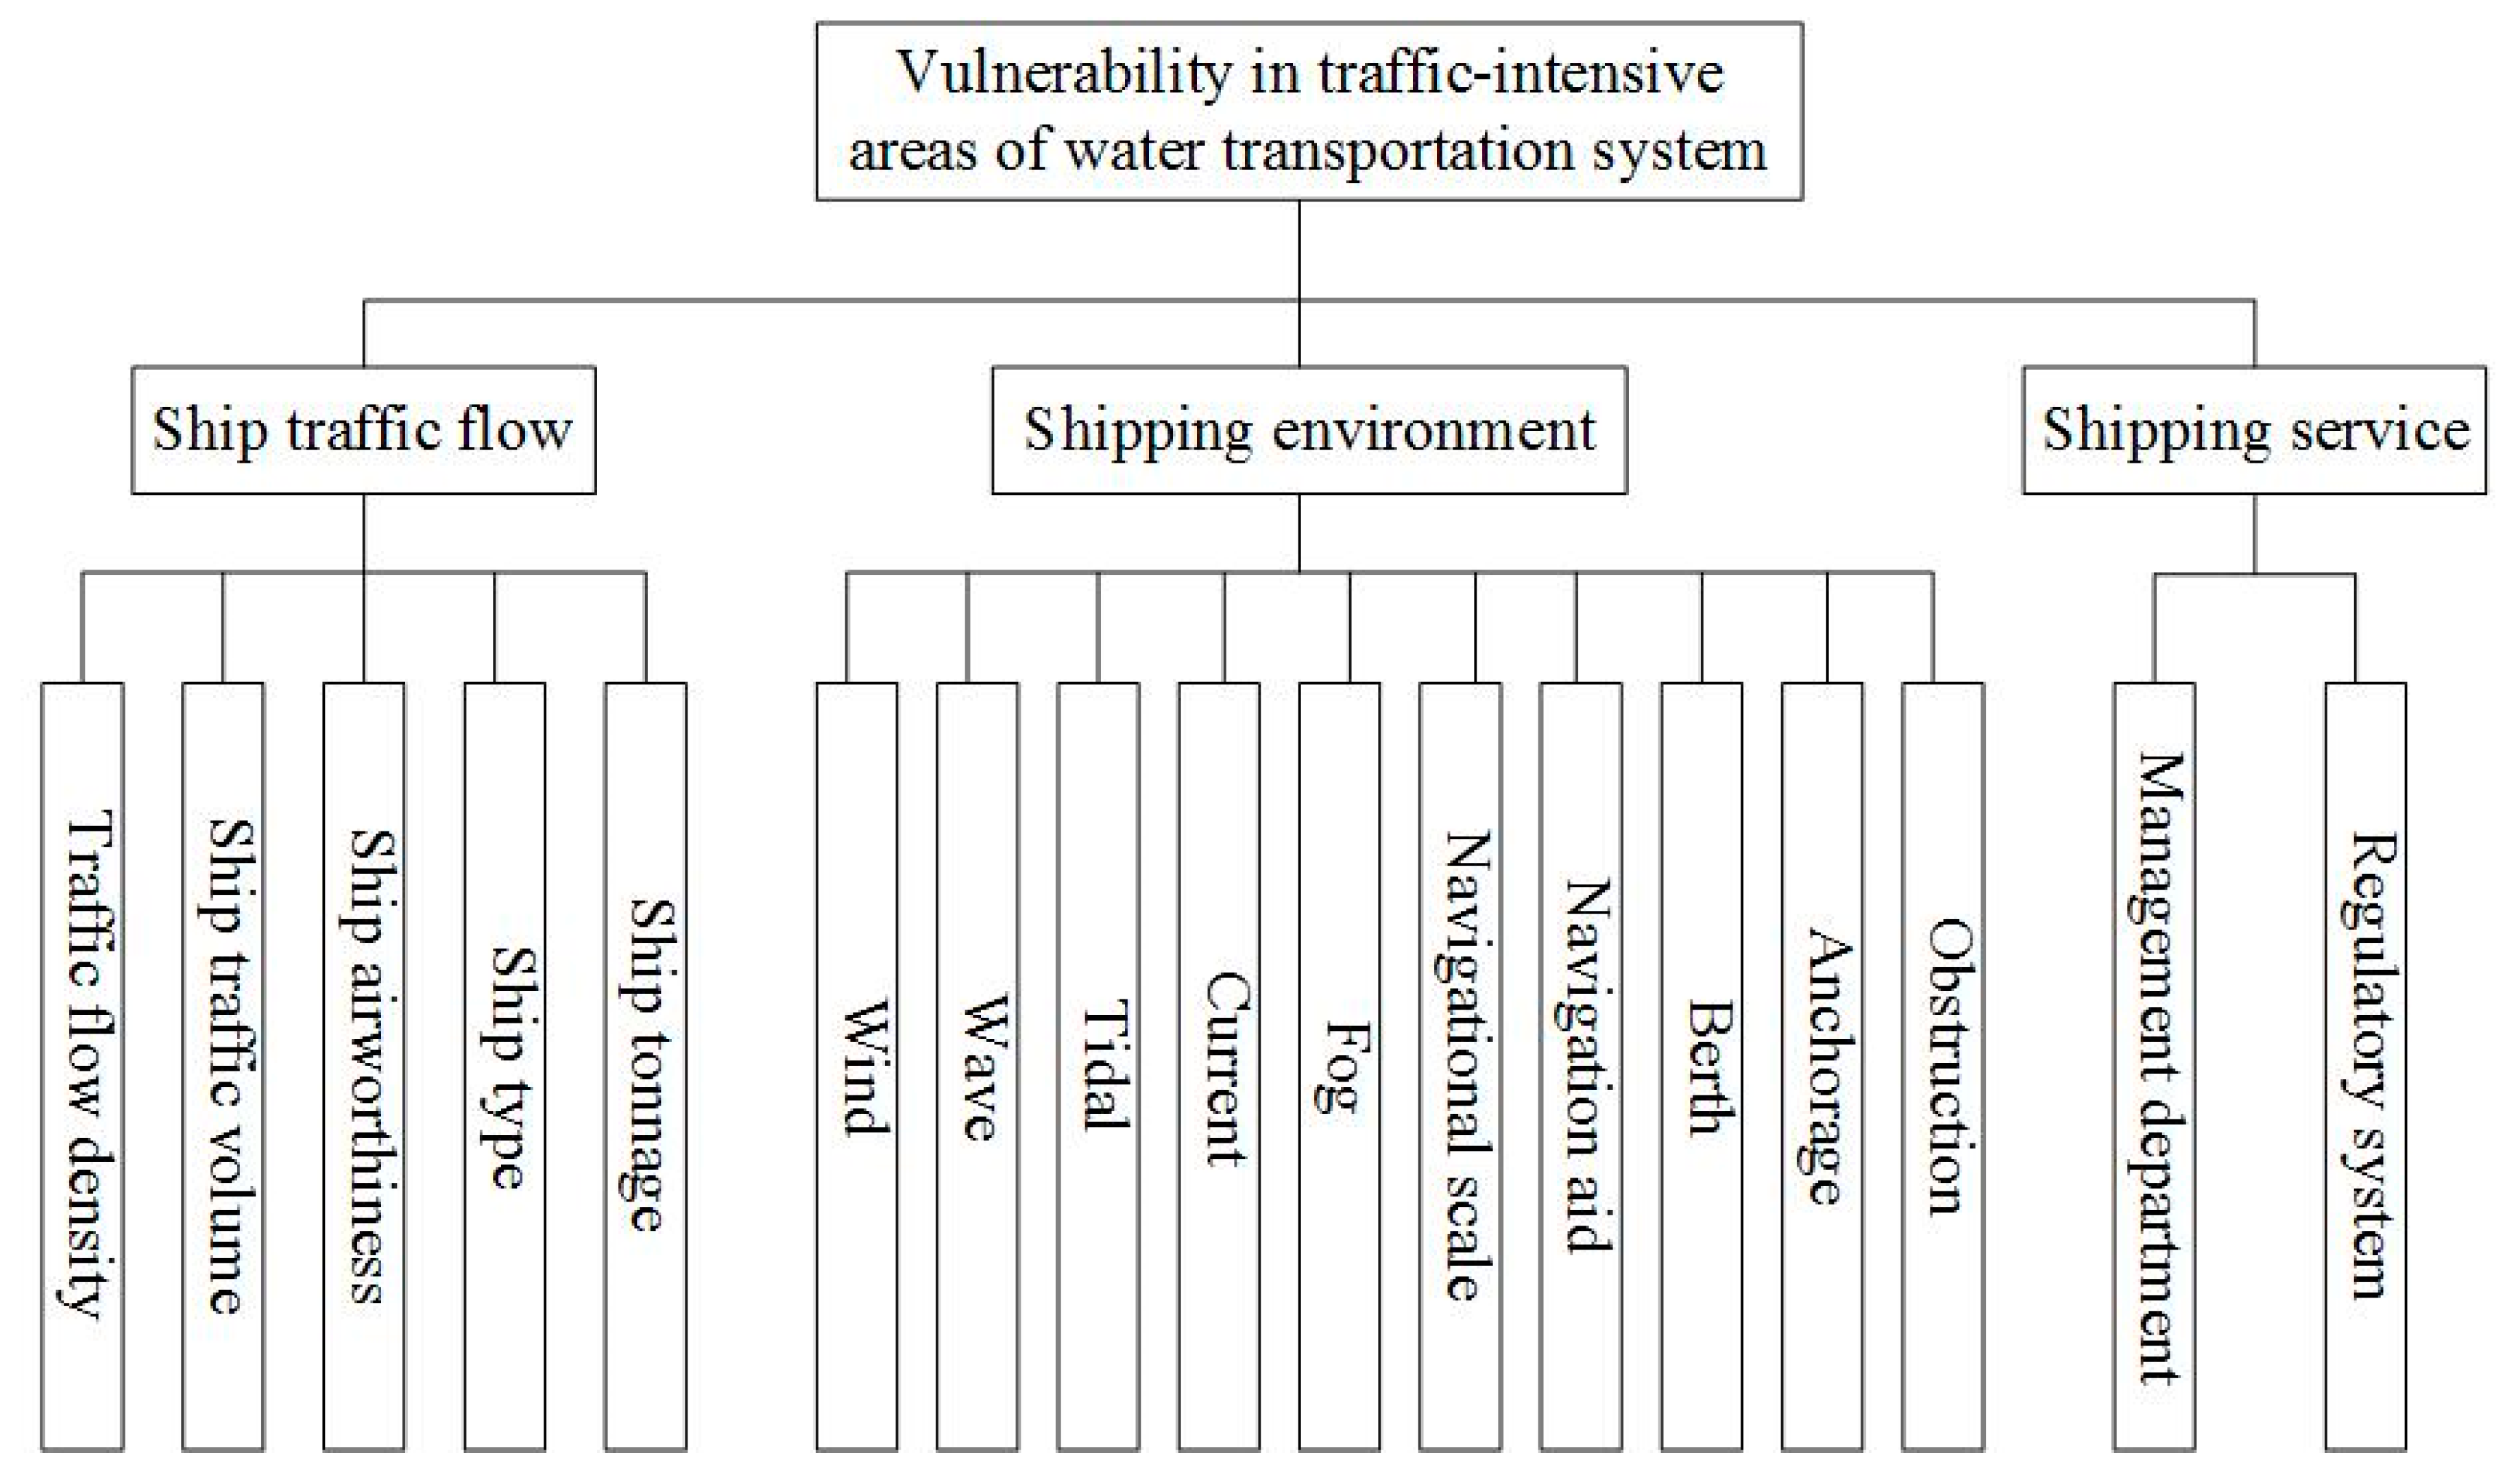
2.3. Analysis of Vulnerability Factors in Traffic-Intensive Areas of Water Transportation Systems

On the basis of Section 2.2, the vulnerability factors in traffic-intensive areas of water transportation systems were divided into three subsystems: ship traffic flow, shipping environment, and shipping service, as shown in Figure 2. The ship traffic flow subsystem includes traffic flow density, ship traffic volume, ship airworthiness, ship type, and ship tonnage. The shipping environment subsystem includes wind, waves, tides, currents, fogs, navigational scales, navigation aids, berths, anchorages, and obstacles. The shipping service includes the management department and regulatory system.

2.4. Construction of the Vulnerability Identification Model
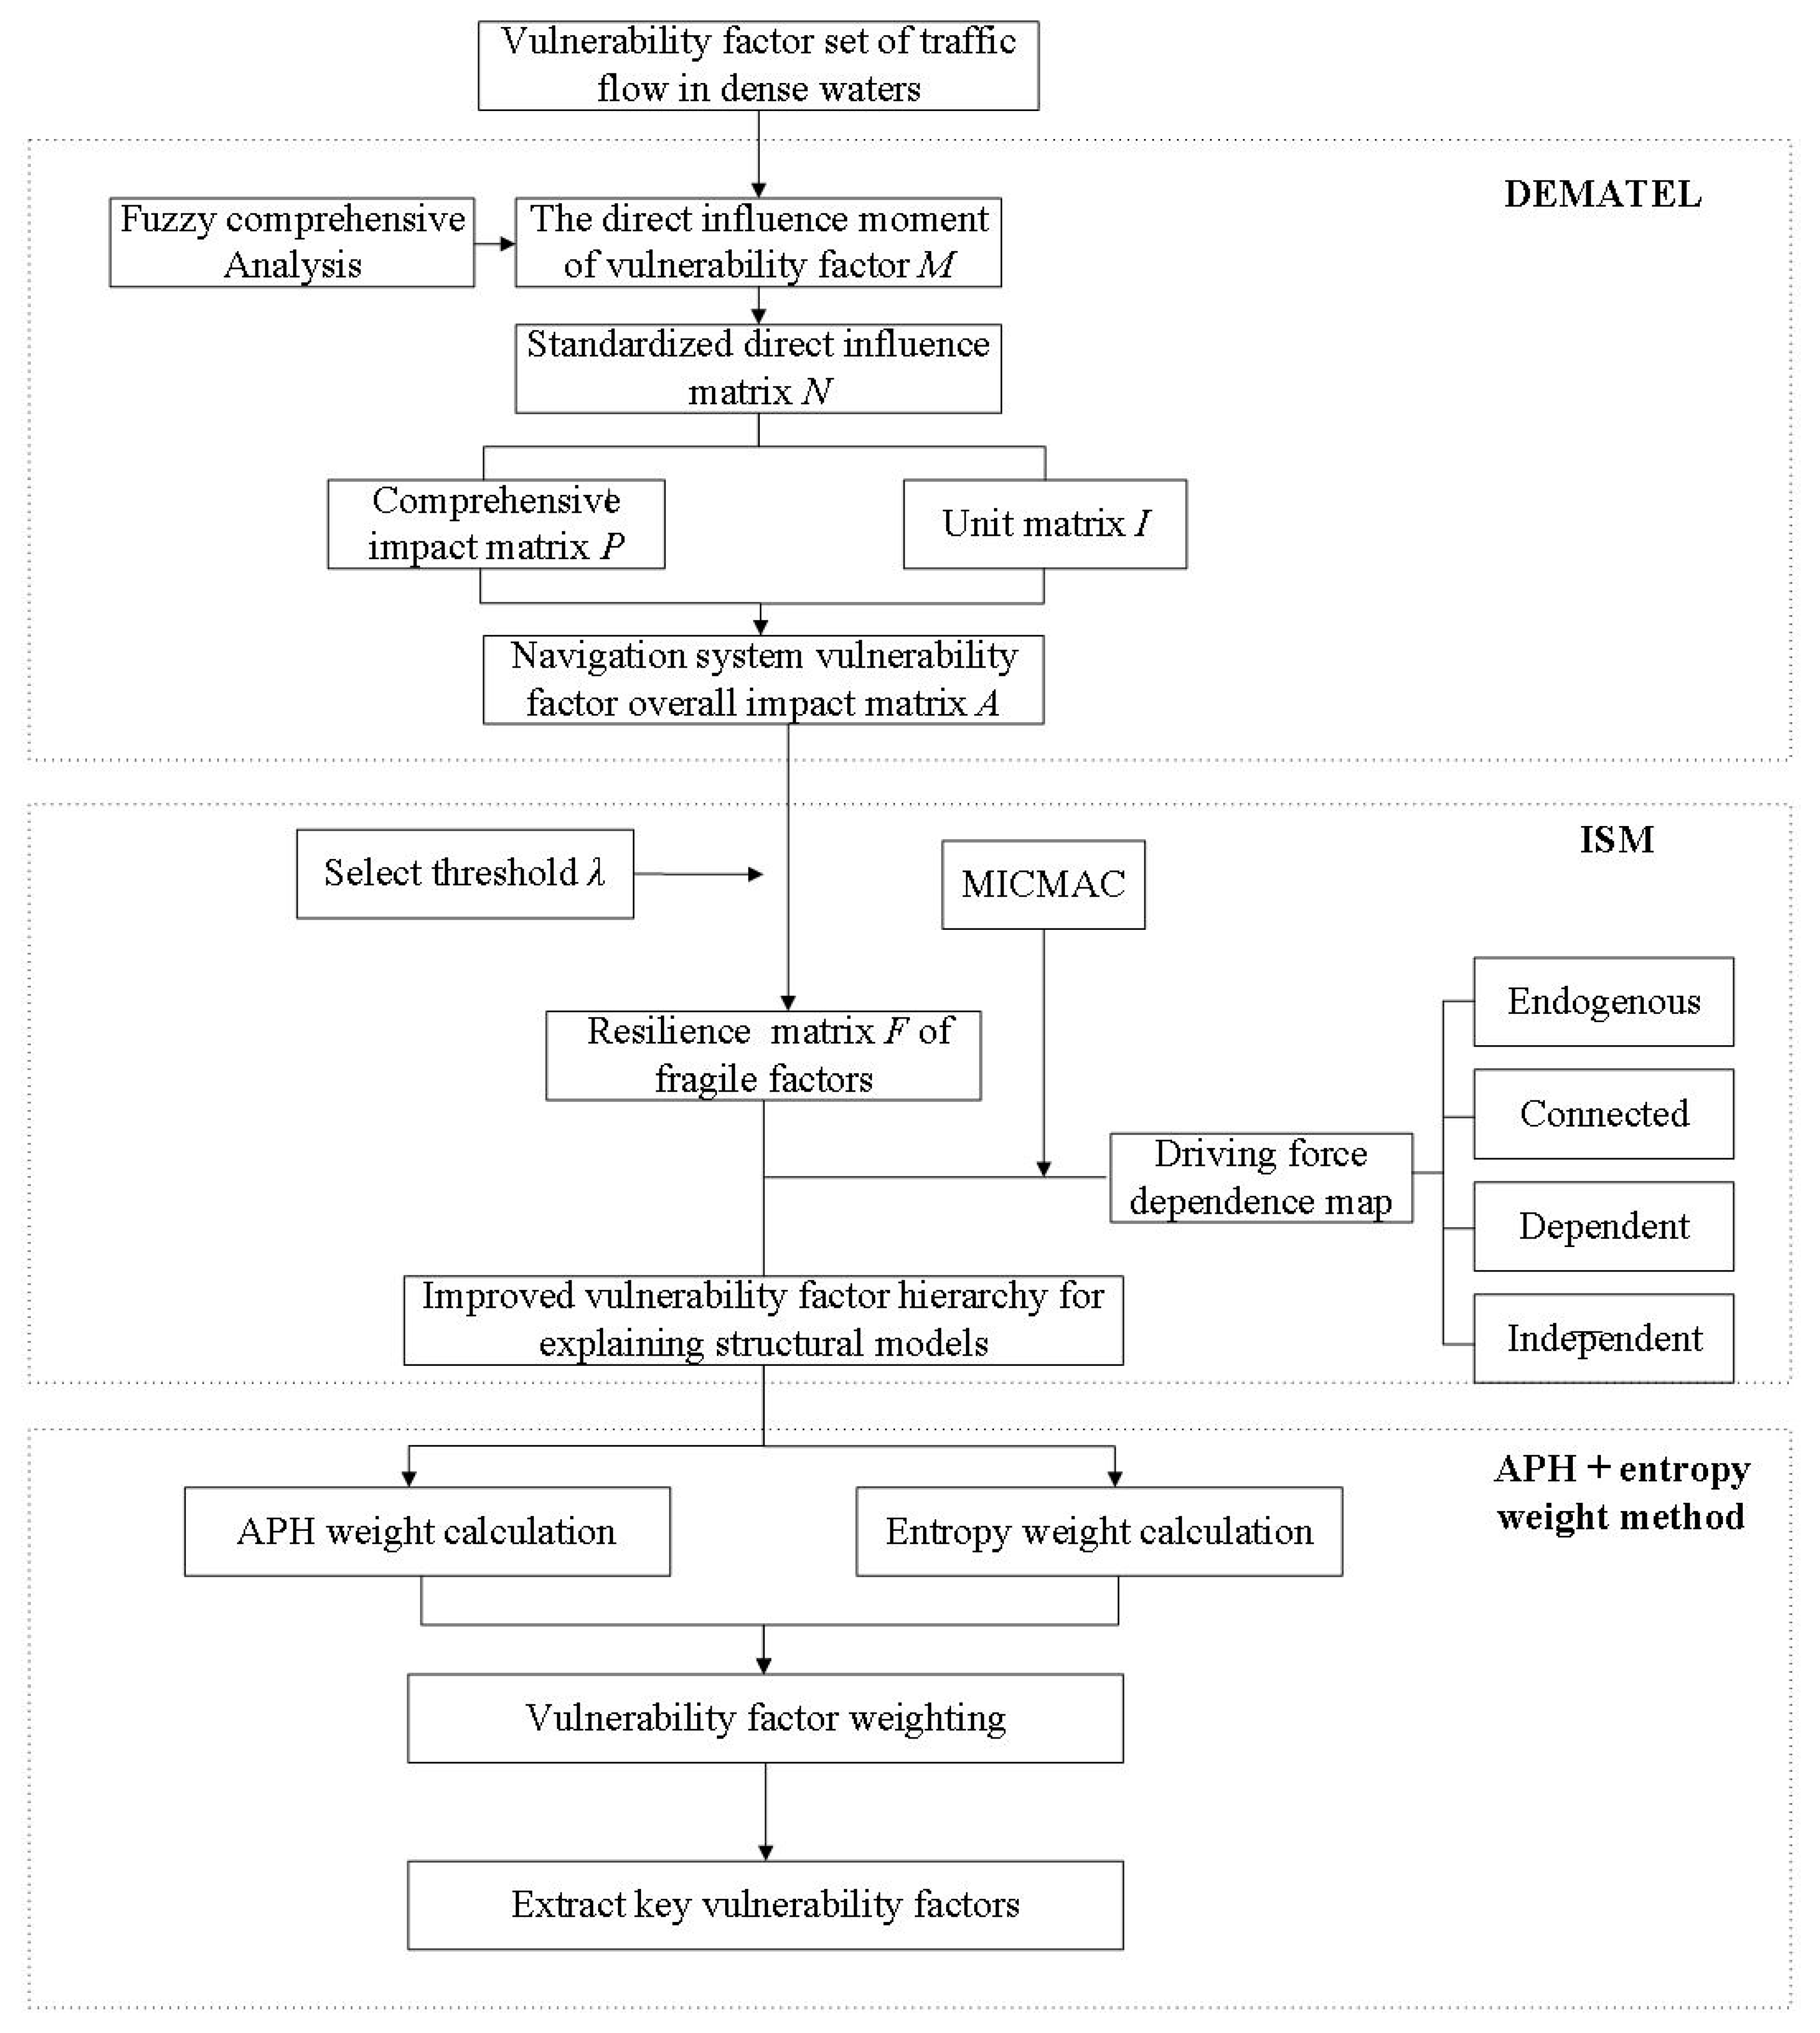
This paper combines DEMATEL, ISM, and the AHP–entropy weight method, and uses subjective and objective weighting methods to construct a new identification model for the vulnerability of traffic-intensive areas of water transportation systems, as shown in Figure 3.
The construction of the model is described as follows.
Firstly, the DEMATEL method was used to construct the overall influence matrix of the vulnerability factors of the water transportation system, which could reflect the comprehensive influence relationship between the factors. The DEMATEL method is often used for problem-solving between influencing factors, and can analyze the comprehensive influence relationship between factors [30,31].
Secondly, a vulnerability factor hierarchy that improves the interpretation of the structural model was generated. The ISM was used for the reprocessing of complex systems to implement a multi-level structural model that can visually characterize the hierarchical relationship of vulnerability factors [32,33]. The ISM model can decompose a complex water transportation system into multiple subsystems or factors, and uses computer aids to construct a multi-level hierarchical network structure model. Thus, this paper used the ISM model to realize the vulnerability analysis of multi-objective and multi-factor aspects of water transportation systems.
Thirdly, the key vulnerability factor was extracted based on the AHP and entropy weight combination model. The network hierarchy of the vulnerability factor of the navigation system is influenced by subjective and objective aspects. With consideration of subjective and objective factors, the entropy weight method was applied to the AHP algorithm, constructing a new vulnerability factor identification method. This combination model could compensate for the shortcomings caused by AHP’s subjective empowerment and identification capabilities, and formed a complementary role between theories. The AHP can realize the analysis of the weight of the hierarchical network structure, subdivide the complex multi-factor problem into multiple-level classes, and then use the weighting method to obtain the weight of the lowest-level vulnerability factor [34,35]. The entropy weight method is a theoretical method based on objective weighting [36]. According to the information theory, if the degree of difference in an index is greater, the recognition effect of the entropy weight method is improved, which is in accord with the case of the vulnerability index of the water transportation system. Thus, this paper uses the AHP weight calculation and entropy weight calculation to obtain the weighting order of vulnerability factors.
Finally, after combining the above three operational steps, the key vulnerability factors were extracted, completing the identification model of the vulnerability factors of the new traffic flow intensive water navigation system.

3. Methodology

3.1. DEMATEL Method

The formulation method is as follows. The fuzzy comprehensive analysis method was used to determine the vulnerability factors of the navigation system, and then the direct influence matrix M of the vulnerability factor of the navigation system was generated by the factor assignment. The direct influence matrix M was standardized and the standardized direct influence matrix, N, was obtained. The overall impact matrix A of the vulnerability factor of the navigation system was obtained.
We used the expert scoring method to screen the factors affecting the vulnerability of the navigation system, and then determine the vulnerability factors through fuzzy comprehensive analysis. According to the vulnerabilities of the traffic flow in dense waters, as shown in Figure 2, the construction factor set u = {u1, u2, … u17}. As follows: u1 (traffic flow density), u2 (ship traffic volume), u3 (ship airworthiness), u4 (ship type), u5 (ship tonnage), u6 (wind), u7 (wave), u8 (tidal), u9 (current), u10 (fog), u11 (navigational scale), u12 (navigation aid), u13 (berth), u14 (anchorage), u15 (obstacle), u16 (management department), and u17 (regulatory system). Among them, u1–u5 belong to the ship traffic flow subsystem, u6–u15 belong to the navigation environment subsystem, and u16–u17 belong to the shipping service subsystem.
(1) Factor assignment
Based on the identified factors affecting vulnerability, the expert group assessed the relationship between each vulnerability factor and its impact. Where the expert believed that mi and mj have no effect, the mi and mj influence values were recorded as 0. Where the expert believed that mi and mj have a marginal level of influence, the mi and mj influence values were recorded as 1. Further, where the expert considered that mi and mj have an average level of influence, the mi and mj influence values were recorded as 2. Otherwise, if mi and mj were considered to have a substantial level of influence, the mi and mj influence values were recorded as 3.
m i j = { 0 - No   influence 1 - Have   a   certain   influence 2 - Have   a   great   influence 3 - Have   a   awesome   influence
(2) Standardized direct influence matrix N
N = 1 max 1 i b j = 1 b m i j M
(3) Reachability matrix of vulnerable factors
Due to the indirect impact between the vulnerability factors, the comprehensive impact matrix is equal to the sum of the direct impact matrix and the indirect impact matrix. On the basis of the comprehensive impact matrix, considering the unit matrix of the matrix itself, the overall impact matrix A of the vulnerability factor of the water transportation system is derived.
A = P + I = lim f N 1 N f 1 1 N + I = N ( I N ) 1 + I = [ C i j ] b × b + I
Given a fixed threshold β, β is assigned a value of 0.2, then the reachability matrix F of the vulnerability factor is obtained: F = f i j b × b .
f i j = { 0 , a i j < β 1 , a i j β
According to Equations (2)–(5), the reachability matrix F of the vulnerability factor of the water transportation system was obtained.

3.2. ISM Model

The basic idea of the ISM model is to screen out the main factors that constitute the vulnerability of the water transportation system through expert discussions and questionnaires, and subsequently use the matrix of vulnerability factors and the adjacent matrix of directed graphs to identify the main vulnerabilities and the relationship between their effects. Through language description and definition of the network structure level of the vulnerability factors, the realization of the vulnerability and understanding of the problem were achieved.
The reachability matrix of the vulnerability factor can be divided into two parts: driving force and dependence. In the reachability matrix F of the vulnerability factor, the value of the driving force Di is equal to the sum of the values of the elements of each row, and the value of the dependency Rj is equal to the sum of the values of the elements of each column.
D i = j = 1 b f i j ( i = 1 , 2 , b )
R j = j = 1 b f i j ( j = 1 , 2 , b )
Through the ISM model, the driving force and dependence of each vulnerability factor were obtained by cross-impact matrix multiplication (MICMAC), and the reclassification of vulnerability factors was realized [37].

3.3. AHP–Entropy Weight Method

The AHP–entropy weight method was used to assign different weights to the influence degree of the vulnerabilities of the water transportation system, and then the index of the vulnerability factors of the hierarchical network was sorted in order to select the key impact factors of the vulnerability factors.
(1) Build a judgment matrix
The overall influence matrix calculated by Equation (3) was subjectively judged from the lowest level of vulnerability factors to the highest level, and then the method of pairwise alignment was used to construct the judgment matrix W = (wij)bxb, where wij is derived from the proportional scale method and b is the estimated quantity.
(2) Calculate the weight matrix U of each vulnerability factor
The calculation formula of the weight matrix U of each vulnerability factor is as follows.
U A H P J = x ( j , d ) i = 1 b ( x , d ) , j = 1 , , b
The weight matrix of the jth vulnerability factor is as shown in Equation (7), where x is the eigenvector matrix of matrix M and d is the column of its largest eigenvalue.
(3) Combine weight based on entropy weighting method
The vulnerability factor indicator differentiation coefficient is E j , the specific calculation formula is as follows.
E j = 1 + k i b N i j ln B i j
Using the entropy method and combining it with Equation (8), the difference coefficient value of the jth vulnerability factor index was obtained, k = 1/lnb. The final calculated weight value is determined by Equation (5).
U j = U A H P j × E j , j = 1 , 2 , b
After using the AHP method to obtain the weighted value of the vulnerability factor, the weights obtained were adjusted by Equation (9) to obtain the final weight value, and then the key vulnerability factors affecting the water transportation systems were identified.
(4) Rank vulnerability factor
According to the results from Step (3), the vulnerability factor rankings were conducted.

4. Case Study

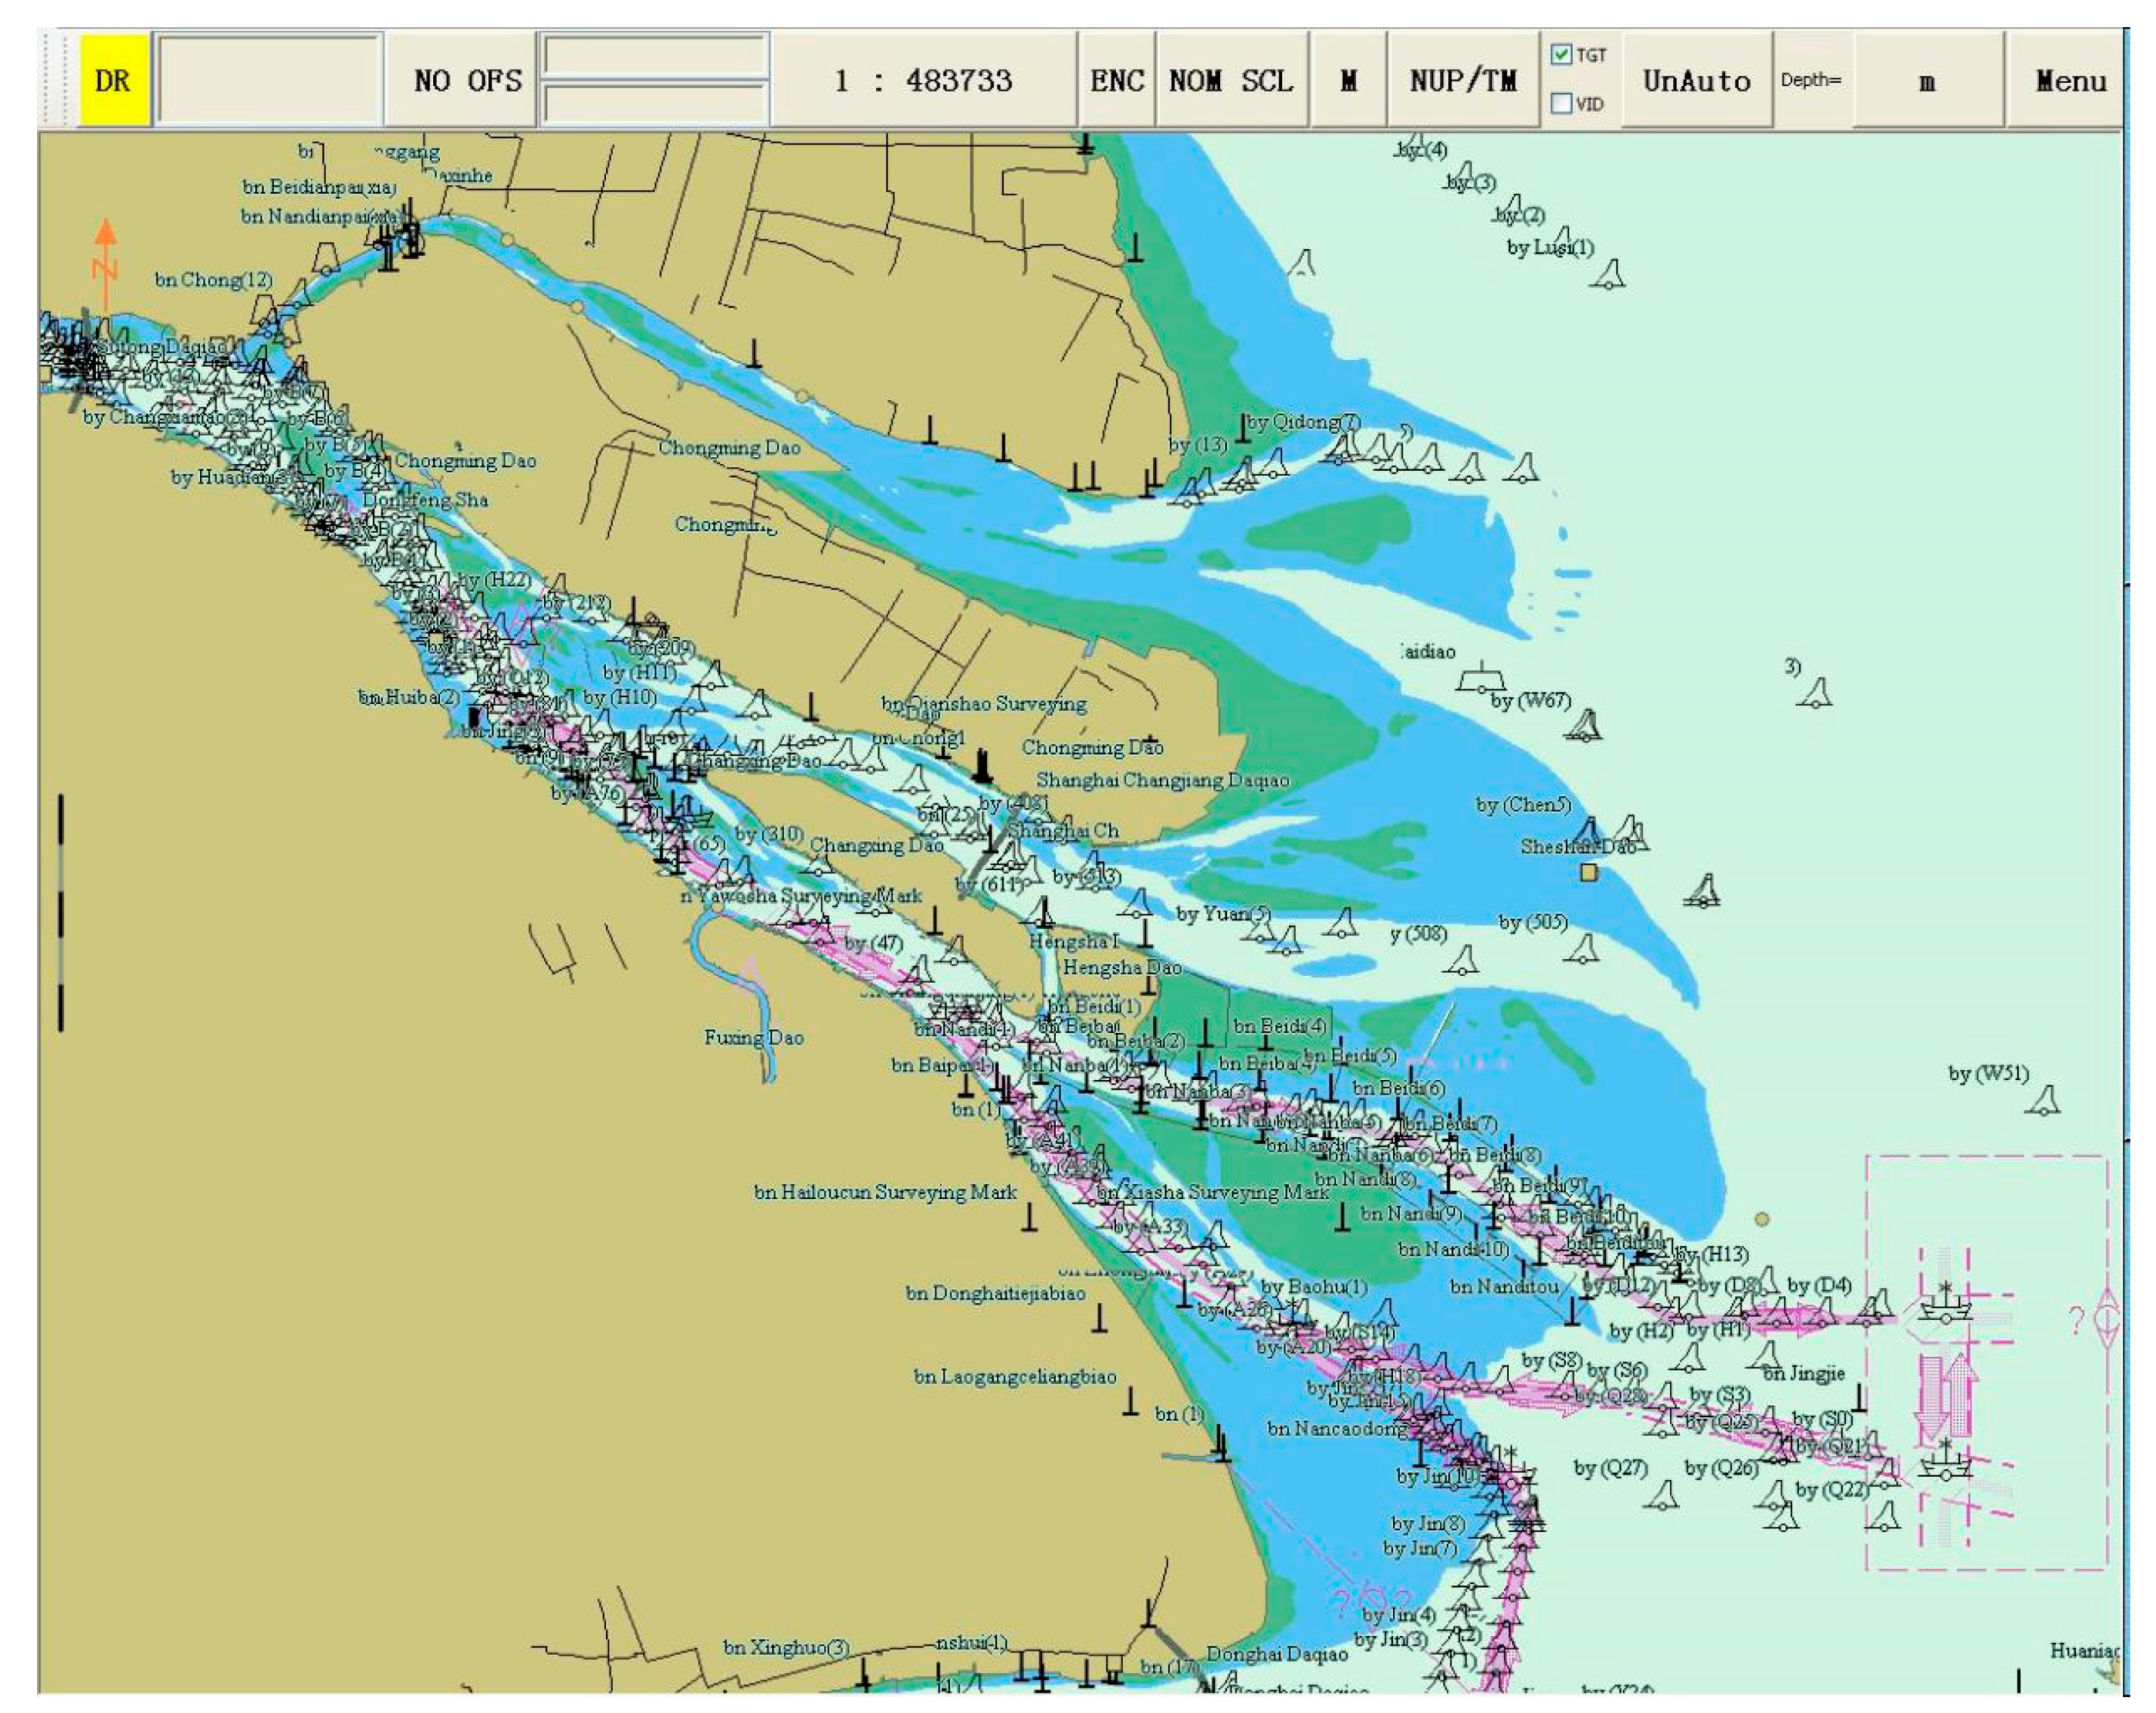
4.1. Background Information

Based on the above vulnerability identification model, the Yangtze River estuary was taken as the case study. The Yangtze River estuary is a traffic-intensive area. It covers a wide area from the Yangtze River estuary anchorage in the east, Taicang anchorage in the west, Shanghai Port in the south, and ports and waters in the north of Jiangsu, as shown in Figure 4.

4.2. Vulnerability Analysis in Traffic-Intensive Areas of the Yangtze River Estuary

4.2.1. Overall Impact of Vulnerability Factor Matrix A and Vulnerability Factor Reachability Matrix F

By combining field investigation and a questionnaire survey, the factors influencing the vulnerability of the ship water transportation system were set up. The survey was conducted with experts, including professors, captains, and supervisors in the field of water transport safety. Experts filled out the questionnaire according to the degree of influence between the vulnerability factors. There were 900 questionnaires distributed and 865 were returned (response rate of 96.1%). As shown in Table 2, and as demonstrated by the demographic characteristics, the proportion of experts from age 18 to 60 was as high as 99.77%; all the experts were professional staff, teachers and students; 17.92% were shipping company managers, and 17.34% were sea pilots. The experts’ education level was high, with 100% of them having an undergraduate or above education background.
The results of the questionnaire survey are presented as follows.
(1) Factor assignment
M = [ 1 2 3 2 2 2 2 2 3 2 1 1 1 2 1 1 1 2 1 2 1 1 1 1 2 2 1 1 1 1 1 1 1 1 3 2 1 2 2 1 1 3 3 2 1 1 1 1 1 1 3 2 1 2 1 2 2 2 2 2 1 1 2 1 3 3 3 3 2 1 2 2 1 1 0 2 2 1 1 2 1 1 2 3 3 2 1 1 2 1 1 1 3 3 2 2 2 2 2 1 1 2 2 1 1 2 0 1 1 3 1 1 1 1 1 1 1 2 3 2 2 3 2 2 3 3 1 3 2 1 1 1 2 2 2 2 3 2 3 2 2 3 1 3 1 2 2 1 2 1 1 1 3 2 1 2 1 1 2 1 2 2 1 2 1 1 2 2 1 1 1 1 1 1 1 2 1 1 2 2 1 0 0 0 1 1 1 1 1 1 2 2 2 1 1 1 1 0 1 0 0 1 1 1 1 1 1 1 1 2 1 1 2 1 0 0 1 1 1 1 1 2 1 1 3 1 2 1 2 1 2 0 0 1 1 1 1 1 1 1 1 3 2 1 1 2 1 2 1 1 1 1 1 2 1 1 1 1 3 3 1 2 2 1 1 1 1 1 1 2 1 1 1 1 3 3 3 2 3 2 3 1 1 1 1 1 1 1 1 ]
(2) Standardized direct influence matrix N
N = [   0.0294   0.0588   0.0882   0.0588   0.0588   0.0588   0.0588   0.0588   0.0882   0.0588   0.0294   0.0294   0.0294   0.0588   0.0294   0.0294   0.0294   0.0588   0.0294   0.0588   0.0294   0.0294   0.0294   0.0294   0.0588   0.0588   0.0294   0.0294   0.0294   0.0294   0.0294   0.0294   0.0294   0.0294   0.0882   0.0588   0.0294   0.0588   0.0588   0.0294   0.0294   0.0882   0.0882   0.0588   0.0294   0.0294   0.0294   0.0294   0.0294   0.0294   0.0882   0.0588   0.0294   0.0588   0.0294   0.0588   0.0588   0.0588   0.0588   0.0588   0.0294   0.0294   0.0588   0.0294   0.0882   0.0882   0.0882   0.0882   0.0588   0.0294   0.0588   0.0588   0.0294   0.0294             0           0.0588   0.0588   0.0294   0.0294   0.0588   0.0294   0.0294   0.0588   0.0882   0.0882   0.0588   0.0294   0.0294   0.0588   0.0294   0.0294   0.0294   0.0882   0.0882   0.0588   0.0588   0.0588   0.0588   0.0588   0.0294             0           0.0588   0.0588   0.0294   0.0294   0.0588             0           0.0294   0.0294   0.0882   0.0294   0.0294   0.0294   0.0294   0.0294   0.0294   0.0294   0.0588   0.0882   0.0588   0.0588   0.0882   0.0588   0.0588   0.0882   0.0882   0.0294   0.0882   0.0588   0.0294   0.0294   0.0294   0.0588   0.0588   0.0588   0.0588   0.0882   0.0588   0.0882   0.0588   0.0588   0.0882   0.0294   0.0882   0.0294   0.0588   0.0588   0.0294   0.0588   0.0294   0.0294   0.0294   0.0882   0.0588   0.0294   0.0588   0.0294   0.0294   0.0588   0.0294   0.0588   0.0588   0.0294   0.0588   0.0294   0.0294   0.0588   0.0588   0.0294   0.0294   0.0294   0.0294   0.0294   0.0294   0.0294   0.0588   0.0294   0.0294   0.0588   0.0588   0.0294             0                     0                     0           0.0294   0.0294   0.0294   0.0294   0.0294   0.0294   0.0588   0.0588   0.0588   0.0294   0.0294   0.0294   0.0294             0           0.0294             0                     0           0.0294   0.0294   0.0294   0.0294   0.0294   0.0294   0.0294   0.0294   0.0588   0.0294   0.0294   0.0588   0.0294             0                     0           0.0294   0.0294   0.0294   0.0294   0.0294   0.0588   0.0294   0.0294   0.0882   0.0294   0.0588   0.0294   0.0588   0.0294   0.0588             0                     0           0.0294   0.0294   0.0294   0.0294   0.0294   0.0294   0.0294   0.0294   0.0882   0.0588   0.0294   0.0294   0.0588   0.0294   0.0588   0.0294   0.0294   0.0294   0.0294   0.0294   0.0588   0.0294   0.0294   0.0294   0.0294   0.0882   0.0882   0.0294   0.0588   0.0588   0.0294   0.0294   0.0294   0.0294   0.0294   0.0294   0.0588   0.0294   0.0294   0.0294   0.0294   0.0882   0.0882   0.0882   0.0588   0.0882   0.0588   0.0882   0.0294   0.0294   0.0294   0.0294   0.0294   0.0294   0.0294   0.0294 ]
(3) Reachability matrix of vulnerable factors
A = [   1.2344   0.2048   0.2924   0.2783   0.2414   0.2554   0.2161   0.2938   0.3149   0.2283   0.1505   0.1498   0.1499   0.2087   0.1863   0.1855   0.2371   0.2049   1.1365   0.2084   0.1893   0.1641   0.1732   0.1458   0.2272   0.2245   0.1532   0.1164   0.1156   0.1159   0.1376   0.1423   0.1419   0.1776   0.2925   0.2084   1.2454   0.2834   0.2496   0.2334   0.1958   0.3241   0.3224   0.2308   0.1530   0.1523   0.1515   0.1836   0.1901   0.1895   0.2956   0.2787   0.1895   0.2836   1.2820   0.2673   0.2753   0.2373   0.3172   0.3079   0.2174   0.1604   0.1914   0.1614   0.2517   0.2613   0.2616   0.3119   0.2420   0.1644   0.2500   0.2675   1.2087   0.2126   0.1525   0.2728   0.2696   0.1857   0.1396   0.1705   0.1391   0.1675   0.2056   0.2331   0.2746   0.2498   0.1688   0.2276   0.2671   0.2051   1.2229   0.1832   0.3065   0.3051   0.2210   0.1723   0.1706   0.1717   0.2013   0.1784   0.1483   0.2517   0.2164   0.1459   0.1960   0.2374   0.1523   0.1890   1.1644   0.2719   0.2134   0.1642   0.1244   0.1248   0.1240   0.1509   0.1562   0.1837   0.2486   0.2939   0.2271   0.3240   0.3167   0.2721   0.3137   0.2715   1.3043   0.3509   0.2553   0.1705   0.1700   0.1698   0.2326   0.2398   0.2391   0.2982   0.3147   0.2242   0.3220   0.3071   0.2687   0.3111   0.2128   0.3506   1.2946   0.2511   0.1952   0.1659   0.1937   0.2007   0.2068   0.2045   0.3181   0.2283   0.1531   0.2306   0.2170   0.1852   0.2258   0.1638   0.2552   0.2512   1.1754   0.1602   0.1292   0.1302   0.1844   0.1897   0.1596   0.2005   0.1505   0.1162   0.1528   0.1600   0.1392   0.1759   0.1241   0.1704   0.1953   0.1602   1.1052   0.0732   0.0728   0.0906   0.1234   0.1213   0.1521   0.1498   0.1155   0.1522   0.1911   0.1701   0.1744   0.1245   0.1699   0.1660   0.1292   0.0732   1.1056   0.0721   0.0917   0.1255   0.1252   0.1542   0.1499   0.1158   0.1514   0.1610   0.1386   0.1753   0.1237   0.1697   0.1938   0.1302   0.0728   0.0721   1.1028   0.1198   0.1221   0.1209   0.1516   0.2087   0.1375   0.1835   0.2513   0.1670   0.2057   0.1506   0.2326   0.2008   0.1844   0.0907   0.0917   0.1198   1.1471   0.1495   0.1475   0.1822   0.1867   0.1425   0.1903   0.2614   0.2055   0.1843   0.1562   0.2402   0.2074   0.1900   0.1237   0.1258   0.1224   0.1499   1.1578   0.1860   0.1908   0.1932   0.1470   0.1965   0.2696   0.2391   0.1893   0.1892   0.2485   0.2140   0.1664   0.1266   0.1305   0.1262   0.1537   0.1913   1.1648   0.2000   0.2372   0.1775   0.2955   0.3115   0.2741   0.2575   0.2482   0.2981   0.3183   0.2005   0.1522   0.1542   0.1516   0.1823   0.1904   0.1923   1.2452 ]
According to Equations (2)–(4), the reachability matrix F of the vulnerability factor of the water transportation system of the Yangtze River estuary was obtained, as shown in Table 3.

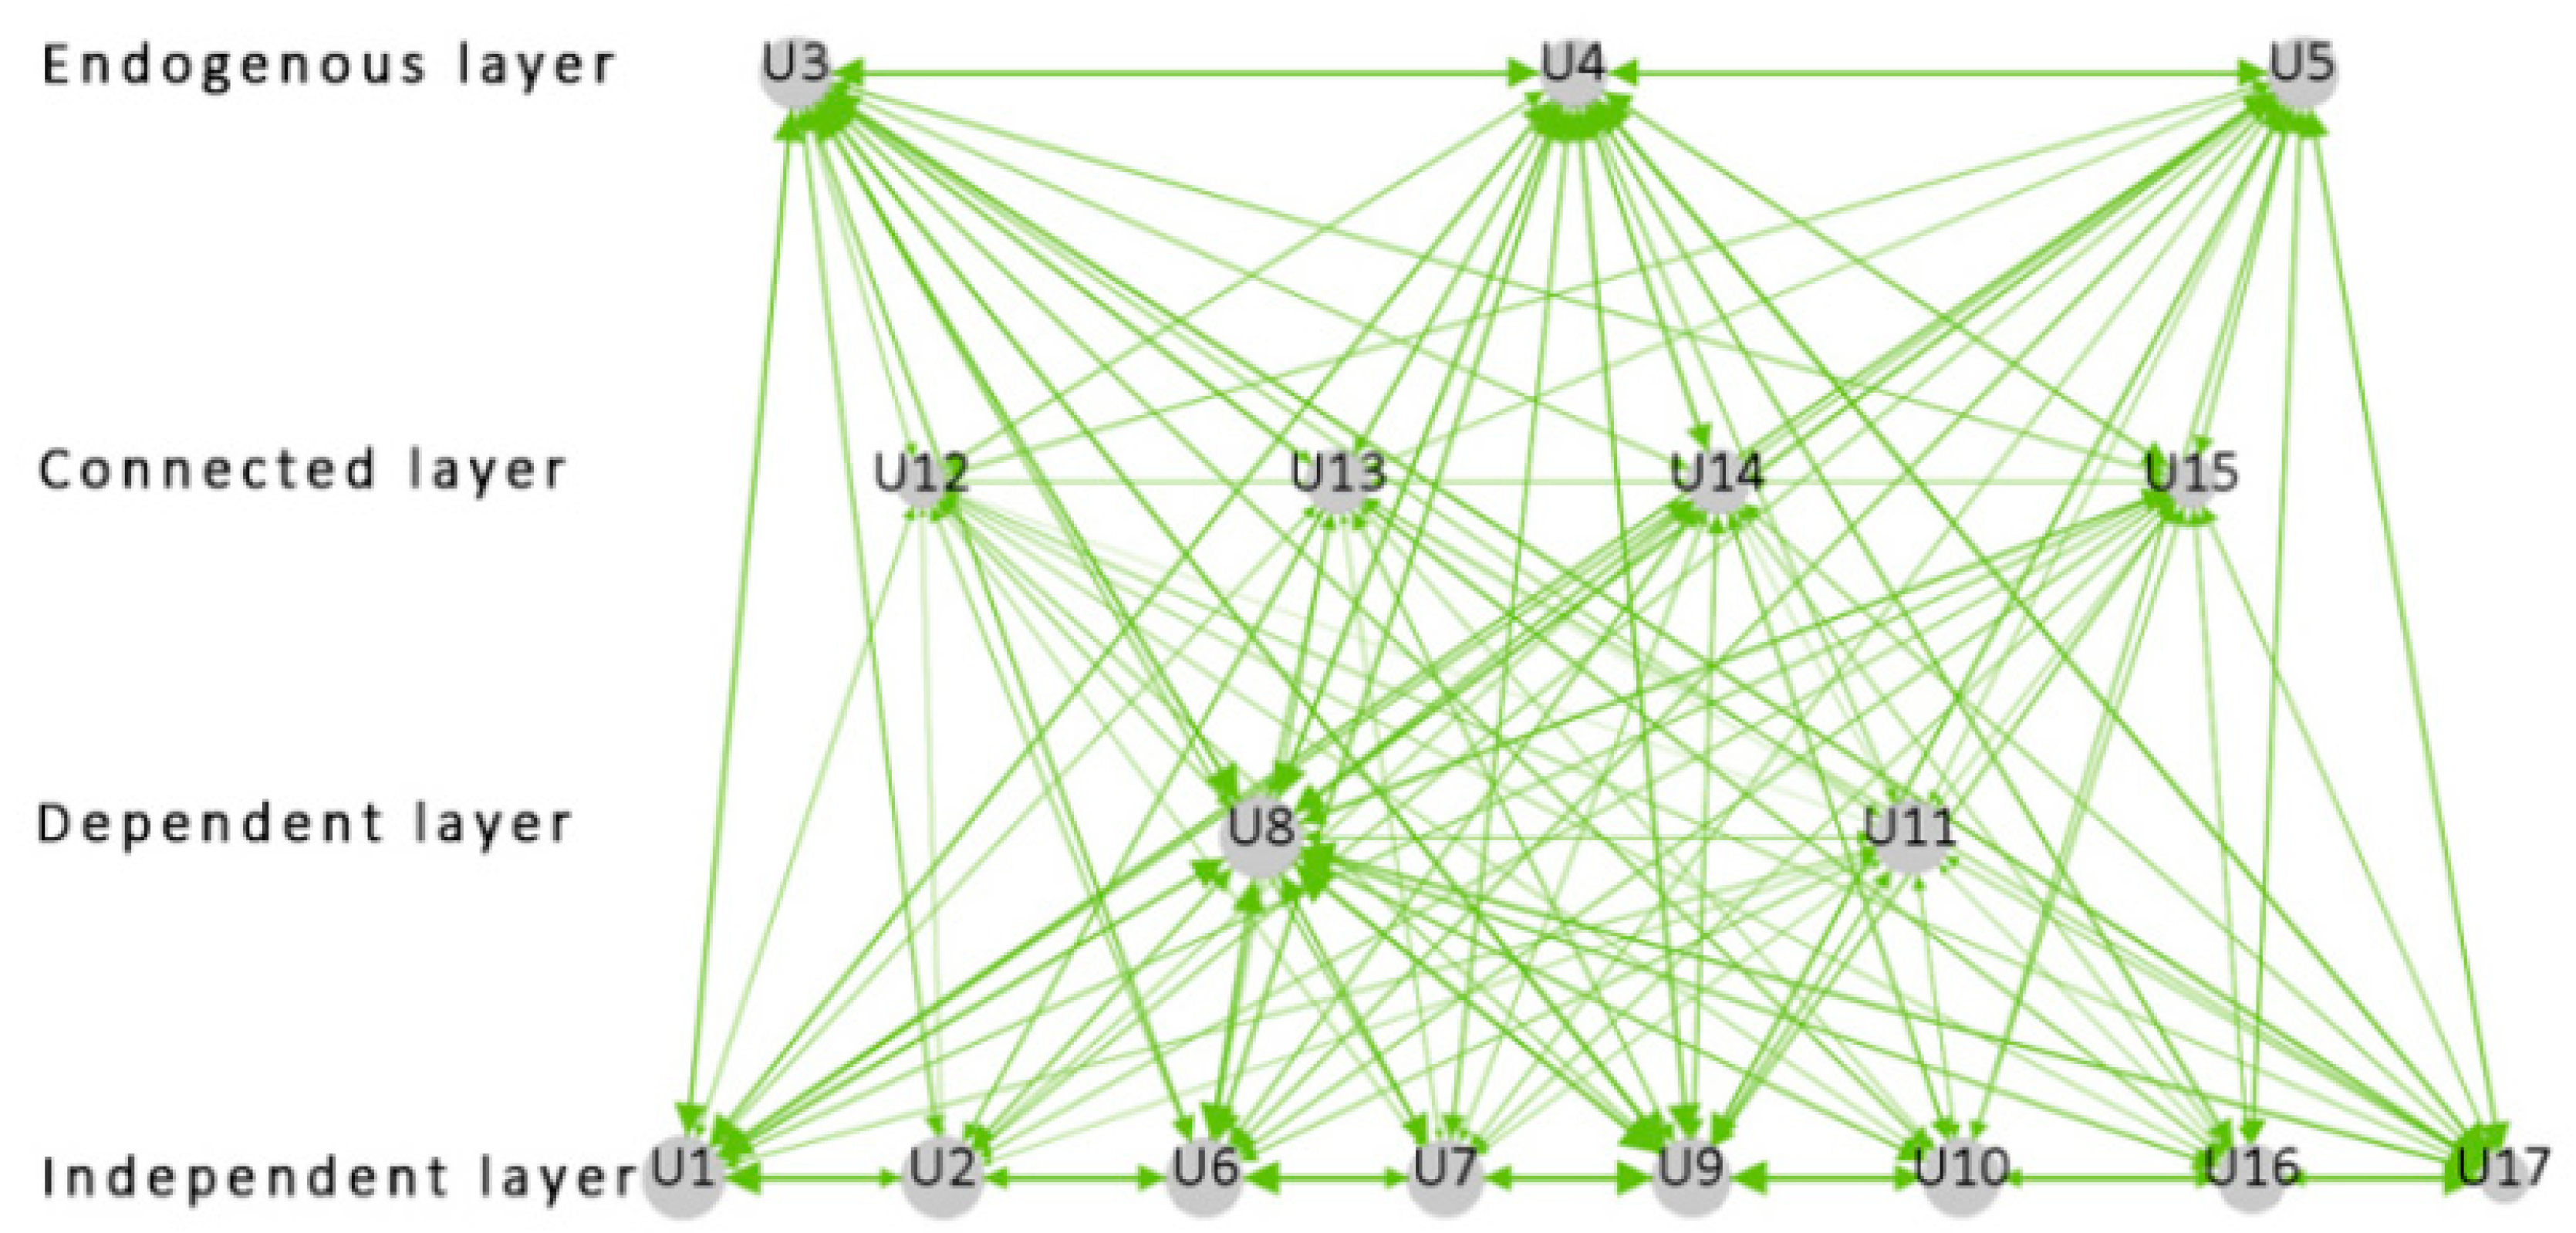
4.2.2. Building the Driving Force—Dependency Network Level

According to the driving force and dependence of the vulnerability factors in Table 3, the social network processing tool UCINET software was used to draw the network diagram of the vulnerability factors of the traffic flow intensive water transportation system, and generate the net format [38]. As UCINET software cannot show the thickness of the lines between nodes, Gephi visual complex network processing software was used to reprocess the net format [39]. After inputting the weight value, structural relationship, and node attribute of the vulnerability factor, the relationship diagram of the vulnerability factors of the traffic flow in the dense waters were generated, as shown in Figure 5.
As shown in Figure 5, the vulnerability factors (u1–u17) are divided into four layers in the ISM. The circle represents the vulnerability factor, the circle size represents the weight of the vulnerability factor, and the line thickness represents the strength between the factors. The vulnerability factors of traffic flow in dense waters are divided into four structural network levels: endogenous, connected, dependent, and independent. The endogenous layer is divided into ship airworthiness (u3), ship type (u4), and ship tonnage (u5). These three vulnerability factors are derived from the intrinsic mechanism and the risk induction of the water transportation system is relatively independent. The connected layer includes a navigation aid (u12), berth (u13), anchorage (u14), and obstacle (u15). These four vulnerability factors are in the upper and lower positions of the ISM. The stability is relatively poor and easily overcomes the influence of external factors on the system. The dependent layer includes the tidal (u8) and navigational scale (u11), which are the two most direct factors for the vulnerability of the water transportation system. The independent layer includes traffic flow density (u1), ship traffic volume (u2), wind (u6), waves (u7), current (u9), fog (u10), the management department (u16), and the regulatory system (u17). These factors are the most fundamental factors affecting the vulnerability of water transportation systems.

4.2.3. Screening of Key Factors of Vulnerability of Water Transportation System Based on the AHP–Entropy Method

After using the AHP method to obtain the weighted value of the vulnerability factor, the weights obtained were adjusted by Equation (9) to obtain the final weight value, and then the key vulnerability factors affecting the water transportation system were identified. The ranking of the vulnerability factors is shown in Table 4.

4.3. Discussion of the Results

Through the method proposed in this paper, the vulnerability in traffic-intensive areas of the water transportation system of the Yangtze River estuary was identified and analyzed. According to the results, traffic flow density, ship traffic volume, tides, fog, and other bad weather are the key factors affecting the vulnerability of water transportation in traffic-intensive waters of the Yangtze River estuary. Furthermore, the degree of importance of navigation aid, berth, anchorage, and obstacles is relatively lower.
In conclusion, more attention should be paid to traffic flow density, ship traffic volume, and tides during daily supervision in order to guarantee more reliable water transportation in the Yangtze River estuary. Moreover, in fog, wind and other bad weather, security measures should be strengthened.

5. Conclusions

In order to avoid potential safety concerns in traffic-intensive areas of the water transportation system, this paper proposes a definition of the vulnerability of a water transportation system. Then, after analyzing characteristics and vulnerability factors in traffic-intensive areas of water transportation systems, the vulnerability identification model was constructed, which combines the system engineering theory of DEMATEL, ISM, and the AHP–entropy weight method. Lastly, this paper analyzed the case, identification and analysis of vulnerabilities in traffic-intensive areas of the water transportation system in the Yangtze River estuary, based on the vulnerability identification model. The research results prove that in the Yangtze River estuary, the vulnerability factors of water transportation in traffic-intensive waters could be divided into four levels: endogenous, dependent, connected, and independent. Moreover, traffic flow density, ship traffic volume, tides, fog, and other bad weather are the key factors affecting vulnerability. In addition, the influence of navigation aids, berth, anchorage, and obstacles on vulnerability is relatively lower. The findings of this study are conducive for agencies to improve the safety of the water transportation system.
It should be pointed out that the vulnerabilities of line and boundary of the water transportation system have not been considered. In future studies, the specific line and boundary of the water transportation system could be taken into consideration. Furthermore, the detail of strategies for reducing vulnerability in traffic-intensive areas of water transportation system can be studied.

Data Availability

The data of the thesis were obtained through the questionnaire designed by the author. A total of 900 questionnaires were distributed and 865 were returned with a response rate of 96.1%. After obtaining the expert feedback data, the initial data were obtained. The initial data values are listed on the tenth page of the direct influence matrix M. The questionnaire webpage can be found at https://www.wjx.cn/jq/33528766.aspx.

Author Contributions

Conceptualization, Y.-j.C. and Q.L. (Qing Liu); methodology, Y.-j.C.; software, Y.-j.C. and C.-p.W.; validation, Y.-j.C., C.-p.W. and Q.L. (Qin Li); formal analysis, Y.-j.C.; investigation, Y.-j.C., C.-p.W., Q.L. (Qin Li) and P.-w.Y.; resources, Q.L. (Qing Liu); data curation, Y.-j.C. and Q.L. (Qing Liu); writing—original draft preparation, Y.-j.C.; writing—review and editing, Y.-j.C., C.-p.W. and Q.L. (Qin Li); visualization, P.-w.Y.; supervision, Q.L. (Qing Liu); project administration, Y.C; funding acquisition, Q.L. (Qing Liu) All of the authors above approved the final manuscript for submission.

Funding

This study was financially supported by the National Natural Science Foundation of China (Grant number: 51379171) and the Shandong Natural Science Foundation (Grant number: ZR2017BG009), and the Technical Innovation Project of Hubei province (Grant number: 2018AHB003).

Acknowledgments

The authors wish to express their special appreciation to all participants joining this study. We also thank the anonymous reviewers for their constructive comments on the manuscript of this paper.

Conflicts of Interest

The authors declare no conflict of interest.

References

  1. China’s Ministry of Transport. China Transportation Industry Developed Statistical Bulletin 2017. Available online: http://www.gov.cn/xinwen/2018-03/30/content_5278569.htm (accessed on 30 March 2018).
  2. Mou, J.M.; Van Der Tak, C.; Ligteringen, H. Study on collision avoidance in busy waterways by using AIS data. Ocean Eng. 2010, 37, 483–490. [Google Scholar] [CrossRef]
  3. Zhang, W.; Goerlandt, F.; Montewka, J.; Kujala, P. A method for detecting possible near miss ship collisions from AIS data. Ocean Eng. 2015, 107, 60–69. [Google Scholar] [CrossRef]
  4. Hu, S.; Fang, Q.; Xia, H.; Xi, Y. Formal safety assessment based on relative risks model in ship navigation. Reliab. Eng. Syst. Saf. 2007, 92, 369–377. [Google Scholar] [CrossRef]
  5. Zhang, J.; Teixeira, Â.P.; Guedes Soares, C.; Yan, X.; Liu, K. Maritime transportation risk assessment of Tianjin Port with Bayesian belief networks. Risk Anal. 2016, 36, 1171–1187. [Google Scholar] [CrossRef] [PubMed]
  6. Hu, S.; Li, Z.; Xi, Y.; Gu, X.; Zhang, X. Path Analysis of Causal Factors Influencing Marine Traffic Accident via Structural Equation Numerical Modeling. J. Mar. Sci. Eng. 2019, 7, 96. [Google Scholar] [CrossRef]
  7. Adger, W.N. Vulnerability. Glob. Environ. Chang. 2006, 16, 268–281. [Google Scholar] [CrossRef]
  8. Sun, D.; Zhao, Y.; Lu, Q.C. Vulnerability analysis of urban rail transit networks: A case study of Shanghai, China. Sustainability 2015, 7, 6919–6936. [Google Scholar] [CrossRef]
  9. Deng, Y.; Li, Q.; Lu, Y. A research on subway physical vulnerability based on network theory and FMECA. Saf. Sci. 2015, 80, 127–134. [Google Scholar] [CrossRef]
  10. Jenelius, E.; Mattsson, L.G. Road network vulnerability analysis: Conceptualization, implementation and application. Comput. Environ. Urban Syst. 2015, 49, 136–147. [Google Scholar] [CrossRef]
  11. Kamissoko, D.; Pérès, F.; Zaraté, P.; Gourc, D. Complex system representation for vulnerability analysis. IFAC-PapersOnLine 2015, 48, 948–953. [Google Scholar] [CrossRef] [Green Version]
  12. Mattsson, L.G.; Jenelius, E. Vulnerability and resilience of transport systems–A discussion of recent research. Transp. Res. Part A Policy Pract. 2015, 81, 16–34. [Google Scholar] [CrossRef]
  13. Fang, S.; Bian, K.; Xie, K. Vulnerability analysis of highway traffic networks using origin-destination tollgate data. In Proceedings of the 2016 IEEE 19th International Conference on Intelligent Transportation Systems (ITSC), Rio de Janeiro, Brazil, 1–4 November 2016; pp. 1957–1963. [Google Scholar]
  14. Voltes-Dorta, A.; Rodríguez-Déniz, H.; Suau-Sanchez, P. Vulnerability of the European air transport network to major airport closures from the perspective of passenger delays: Ranking the most critical airports. Transp. Res. Part A Policy Pract. 2017, 96, 119–145. [Google Scholar] [CrossRef] [Green Version]
  15. Sun, D.J.; Guan, S. Measuring vulnerability of urban metro network from line operation perspective. Transp. Res. Part A Policy Pract. 2016, 94, 348–359. [Google Scholar] [CrossRef]
  16. Xing, Y.; Lu, J.; Chen, S.; Dissanayake, S. Vulnerability analysis of urban rail transit based on complex network theory: A case study of Shanghai Metro. Public Transp. 2017, 9, 501–525. [Google Scholar] [CrossRef]
  17. Hong, L.; Yan, Y.; Ouyang, M.; Tian, H.; He, X. Vulnerability effects of passengers’ intermodal transfer distance preference and subway expansion on complementary urban public transportation systems. Reliab. Eng. Syst. Saf. 2017, 158, 58–72. [Google Scholar] [CrossRef]
  18. Zhang, J.; Wang, S.; Wang, X. Comparison analysis on vulnerability of metro networks based on complex network. Phys. A Stat. Mech. Appl. 2018, 496, 72–78. [Google Scholar] [CrossRef]
  19. Sun, L.; Huang, Y.; Chen, Y.; Yao, L. Vulnerability assessment of urban rail transit based on multi-static weighted method in Beijing, China. Transp. Res. Part A Policy Pract. 2018, 108, 12–24. [Google Scholar] [CrossRef]
  20. Ma, F.; Liu, F.; Yuen, K.F.; Lai, P.; Sun, Q.; Li, X. Cascading Failures and Vulnerability Evolution in Bus–Metro Complex Bilayer Networks under Rainstorm Weather Conditions. Int. J. Environ. Res. Public Health 2019, 16, 329. [Google Scholar] [CrossRef]
  21. Lu, Q.C. Modeling network resilience of rail transit under operational incidents. Transp. Res. Part A Policy Pract. 2018, 117, 227–237. [Google Scholar] [CrossRef]
  22. Eliopoulou, E.; Papanikolaou, A.; Voulgarellis, M. Statistical analysis of ship accidents and review of safety level. Saf. Sci. 2016, 85, 282–292. [Google Scholar] [CrossRef]
  23. Erol, S.; Demir, M.; Çetişli, B.; Eyüboğlu, E. Analysis of Ship Accidents in the Istanbul Strait Using Neuro-Fuzzy and Genetically Optimised Fuzzy Classifiers. J. Navig. 2018, 71, 419–436. [Google Scholar] [CrossRef]
  24. Zhang, J.; Yan, X.; Zhang, D.; Haugen, S.; Yang, X. Safety management performance assessment for Maritime Safety Administration (MSA) by using generalized belief rule base methodology. Saf. Sci. 2014, 63, 157–167. [Google Scholar] [CrossRef]
  25. Yip, T.L. Port traffic risks—A study of accidents in Hong Kong waters. Transp. Res. Part E Logist. Transp. Rev. 2008, 44, 921–931. [Google Scholar] [CrossRef]
  26. Mou, J.M.; Chen, P.F.; He, Y.X.; Yip, T.L.; Li, W.H.; Tang, J.; Zhang, H.Z. Vessel traffic safety in busy waterways: A case study of accidents in western shenzhen port. Accid. Anal. Prev. 2019, 123, 461–468. [Google Scholar] [CrossRef] [PubMed]
  27. Wu, X.; Mehta, A.L.; Zaloom, V.A.; Craig, B.N. Analysis of waterway transportation in Southeast Texas waterway based on AIS data. Ocean Eng. 2016, 121, 196–209. [Google Scholar] [CrossRef]
  28. Kujala, P.; Hänninen, M.; Arola, T.; Ylitalo, J. Analysis of the marine traffic safety in the Gulf of Finland. Reliab. Eng. Syst. Saf. 2009, 94, 1349–1357. [Google Scholar] [CrossRef]
  29. Zhang, L.; Meng, Q.; Fwa, T.F. Big AIS data based spatial-temporal analyses of ship traffic in Singapore port waters. Transp. Res. Part E Logist. Transp. Rev. 2017, in press. [Google Scholar] [CrossRef]
  30. Shieh, J.I.; Wu, H.H. Measures of consistency for DEMATEL method. Commun. Stat. Simul. Comput. 2016, 45, 781–790. [Google Scholar] [CrossRef]
  31. Han, Y.; Deng, Y. An enhanced fuzzy evidential DEMATEL method with its application to identify critical success factors. Soft Comput. 2018, 22, 5073–5090. [Google Scholar] [CrossRef]
  32. Wu, W.S.; Yang, C.F.; Chang, J.C.; Chateau, P.A.; Chang, Y.C. Risk assessment by integrating interpretive structural modeling and Bayesian network, case of offshore pipeline project. Reliab. Eng. Syst. Saf. 2015, 142, 515–524. [Google Scholar] [CrossRef]
  33. Chauhan, A.; Singh, A.; Jharkharia, S. An interpretive structural modeling (ISM) and decision-making trail and evaluation laboratory (DEMATEL) method approach for the analysis of barriers of waste recycling in India. J. Air Waste Manag. Assoc. 2018, 68, 100–110. [Google Scholar] [CrossRef] [PubMed]
  34. Bian, T.; Hu, J.; Deng, Y. Identifying influential nodes in complex networks based on AHP. Phys. A Stat. Mech. Appl. 2017, 479, 422–436. [Google Scholar] [CrossRef]
  35. Rashidi, M.; Ghodrat, M.; Samali, B.; Kendall, B.; Zhang, C. Remedial modelling of steel bridges through application of analytical hierarchy process (AHP). Appl. Sci. 2017, 7, 168. [Google Scholar] [CrossRef]
  36. He, Y.; Guo, H.; Jin, M.; Ren, P. A linguistic entropy weight method and its application in linguistic multi-attribute group decision making. Nonlinear Dyn. 2016, 84, 399–404. [Google Scholar] [CrossRef]
  37. Bhosale, V.A.; Kant, R. An integrated ISM fuzzy MICMAC approach for modelling the supply chain knowledge flow enablers. Int. J. Prod. Res. 2016, 54, 7374–7399. [Google Scholar] [CrossRef]
  38. Yang, H.; Li, Z.F.; Wei, W. Instance analysis of social network based UCINET tool. Inf. Technol. J. 2014, 13, 1532–1539. [Google Scholar] [CrossRef]
  39. Jacomy, M.; Venturini, T.; Heymann, S.; Bastian, M. ForceAtlas2, a continuous graph layout algorithm for handy network visualization designed for the Gephi software. PLoS ONE 2014, 9, e98679. [Google Scholar] [CrossRef]
Figure 1. Water transportation system vulnerability mechanism.
Jmse 07 00174 g001
Figure 2. Vulnerability factors of a water transportation system in traffic-intensive waters.
Jmse 07 00174 g002
Figure 3. Vulnerability model of a water transportation system in traffic-intensive waters.
Jmse 07 00174 g003
Figure 4. The Yangtze River estuary (This figure was produced by HTA-ES5000 Electronic Chart Simulator (ED001, Dalian, CHINA).
Jmse 07 00174 g004
Figure 5. Relationship diagram of vulnerability factors of traffic flow in dense waters.
Jmse 07 00174 g005
Table 1. Characteristics of traffic-intensive areas of the water transportation system.
NumberCharacteristicsResearchersKey Factors
1Ship traffic flow is heavy and it is easy to generate conflicts in ship flow. The scope of ship conflict is wide.Zhang et al. [24], Yip [25], Mou et al. [26]ship traffic flow
2The density of ships is high and the number of encounters is high. It is difficult for the ship to sail freely to avoid various urgent situations, and the risk of collision is high.Zhang et al. [24], Mou et al. [26]ship traffic flow, shipping environment
3The flow of ship traffic is complicated and difficult to operate well, and it is prone to secondary accidents.Wu et al. [27]ship traffic flow
4The navigation conditions of the water are complicated, and the range of collision avoidance and rotation is small.Wu et al. [27], Kujala et al. [28]Shipping environment, shipping service
5The transportation network structure is complex, the flight lines are staggered, and the ship’s organizational structure and speed are relatively scattered.Zhang et al. [29]Shipping environment, shipping service
Table 2. Demographic data of experts interviewed.
VariableDescriptionFrequencyPercentage (n = 865):%
Age18–30 years34640.00
30–45 years32437.46
45–60 years19322.31
>60 years20.23
OccupationProfessor202.31
Research assistant354.05
Associate Professor455.20
Captain809.25
Chief officer809.25
Second officer10011.56
Third officer10011.56
Sea Pilot15017.34
Shipping company manager15517.92
Maritime organizations10011.56
Education levelDoctor667.64
Master12013.87
Bachelor67978.49
Table 3. Reachability matrix F of vulnerability factors.
factoru1u2u3u4u5u6u7u8u9u10u11u12u13u14u15u16u17D
u11111111111000100112
u2111000010000000004
u31111110111100000111
u41011111111000111113
u51011110110000011110
u61011110111000100110
u7100100111000000016
u81111111111000111114
u91111111111000111114
u10101101011100000018
u11000000000010000001
u12000000000001000001
u13000000000000100001
u14100101011000010006
u15000110011000001005
u16000110011000000116
u171011111111000000110
R1251013101061313821165511
Table 4. Weighted ranking of vulnerability factors.
VariableFactorsEntropy Weight Method WeightAHP WeightCorrected WeightRank
u1Traffic flow density0.04230.07820.06051
u2Ship traffic volume0.04350.07430.06042
u3Ship airworthiness0.05610.05680.05917
u4Ship type0.06090.05290.05869
u5Ship tonnage0.05830.05270.05898
u6Wind0.04910.06900.05984
u7Wave0.05110.06620.05965
u8Tidal0.04350.07430.06042
u9Current0.04940.06880.05984
u10Fog0.04870.06750.05993
u11Navigational scale0.05250.06240.05956
u12Navigation aid0.08350.04040.056311
u13Berth0.06640.04890.058010
u14Anchorage0.06690.05060.058010
u15Obstacle0.08320.04060.056311
u16Management department0.06130.0540.05869
u17Regulatory system0.08310.04020.056311

