Article

Prediction of Self-Propulsion Performance of Ship Model with Double L-Type Podded Propulsors and Conversion Method for Full-Scale Ship

1
College of Shipbuilding Engineering, Harbin Engineering University, Harbin 150001, China
2
Longjiang Forest Industry, Harbin 150008, China
*
Author to whom correspondence should be addressed.
J. Mar. Sci. Eng. 2019, 7(5), 162; https://doi.org/10.3390/jmse7050162
Submission received: 5 May 2019 / Revised: 23 May 2019 / Accepted: 23 May 2019 / Published: 27 May 2019
(This article belongs to the Special Issue Marine Propulsion)

Abstract

:
In this study, the self-propulsion performance of a ship model with double-L-type podded propulsors was predicted. Additionally, a conversion method for the performance of a full-scale ship was established based on the correction method published by the International Towing Tank Conference (ITTC) for the scaling effect of a single podded propeller and research reports on pod tests conducted by different ship research institutes. The thrust deduction and wake fraction of the ship were also analyzed. Furthermore, the self-propulsion performance of a full-scale ship with double L-type pods was determined, the full- and model-scale ships compared in terms of their flow fields and pressure charts, and the influence of the scaling effect analyzed. In addition, the calculation results were compared with the conversion results of a full-scale ship, and the reliability of the method adopted for the performance estimation of a full-scale ship with double podded propulsors was verified. The findings reported herein can provide statistics and technical support for the design of L-type podded propulsors and their application in full-scale ships, which are of theoretical significance and practical value in the engineering domain.

1. Introduction

Open water and resistance tests are conducted on propellers to obtain the respective performances of the hull and the propeller, whereas self-propulsion tests are used to analyze the influence of various efficiency parameters and stern wake flow on propeller efficiency and the impact of the propeller on ship resistance; the information obtained from these tests can provide references for propeller design. The performance prediction of a full-scale ship involves experimentally determining the relationship between the host power, rotational speed, and ship speed; estimating the speed of a full-scale ship; verifying if the designed ship satisfies the speed requirements specified in the mission book; and determining whether the propeller, main engine, and hull work well as a whole. To estimate the self-propulsion performance of a ship with a podded propulsor, it is necessary to accurately predict the hydrodynamic interactions among the pod, propeller, and hull. Podded propulsors are located at the stern of the ship, and thus, their performance as well as the maneuverability of the ship are considerably affected by the wake of the ship. Therefore, it is vital to conduct research on the mutual interference between the hull and the pod.
Two theoretical methods, namely, the potential flow method and the viscous flow method [1,2,3,4,5], exist for calculating the mutual interference between the podded propulsor and the hull. Streckwall et al. [6], using computational fluid dynamics (CFD) simulations and model tests, examined a ferry equipped with two Siemen–Schottel propulsor (SSP) units. In the numerical simulation, the flow and resistance of the hull were calculated via three methods, which can be differentiated by the treatments concerning the free surface: The first method determined only the single-phase flow of water; the second involved investigating the two-phase flow of water and gas; and the third simplified the propeller by using the body force model, making the free surface treatment more convenient and increasing the amount of obtained information concerning the flow around the hull. Ohashi et al. [7] simplified the model of a contra-rotating podded propulsor using the body force method and analyzed the self-propulsion performance of a contra-rotating propeller ship. The results suggested that the method was valuable for predicting the hull resistance; however, it could not ensure calculation accuracy for the thrust deductions and wake flow fractions. Kang [8] used CFD to determine the performance of stand-on container vessels equipped with podded propulsors, and the calculation results demonstrated that the hull wake flow had a positive influence on the thrust and torque of the podded propulsor. Chuang [9] examined the influence of the deflection angle on the performance of a podded propulsor installed at the back of the ship. The results obtained indicated that when the incoming flow remained unchanged, both the thrust and torque increased with increasing deflection angle. Shamsi et al. [10,11] carried a comparison of the hydrodynamic performance of the podded propulsor using the Reynolds-Averaged Navier Stokes (RANS) method and the Boundary Element Method (BEM) method. It was found that the results predicted by the RANS method were closer to the experimental data than those of the BEM method. Based on the result of simulations, the relative errors for axial force and side force coefficient in the BEM calculation are greater than for the RANS solver. This discrepancy between the numerical results is likely to be related to the interaction between the propeller, pod, and strut.
In terms of experimental research, Maritime Reesarch Institute Netherlands (MARIN), Hamburgische Schiffbau-Versuchsanstalt GmbH (HSVA), and other scholars have conducted a large number of tests on the hydrodynamic performance of podded propulsors. In their research, they suggested that research methods concerning the tests and measurement of the mutual interference between the pod and the hull should be adapted for different types of podded propulsors (pushing or pulling). Their research also indicated that the hull forms of ships with podded propulsors have a direct impact on whether the standards for yaw checking can be satisfied, which must be especially focused on during the design process of the pod [12]. Ilkka et al. [13] analyzed cruisers with a podded propulsor via model-based testing, and investigated the influence of sterns and wedge structures with different geometric shapes on the performance of the pod. Wang et al. [14] utilized laser Doppler anemometry (LDA) to conduct model-based testing and measured the flow field around the rear pod in a cavitation tunnel; they studied the interference between the pod and the hull by simulating the hull boundary layer with pseudo-components and an axial grille for the wake flow. The study results indicated that pods exert considerable influence on the stern flow fields. Full-scale ship performance was focused on by the following studies: Putoshny et al. [15] explored the performance of ships fitted with two pulling-type podded propulsors under non-design working conditions and found that propeller cavitation increased with changes in the blade angle. Friesch et al. [16,17], considering the Hamburg ship model basin, employed model-based testing and investigated the performance of ships fitted with pulling-type, twin-propeller, and hybrid contra-rotating propellers. In this work, the focus was on the propulsion, cavitation, and noise performance of the podded propulsor at the stern of the ship, and it was noted that the tail flow field of a ship with a podded propulsor was extremely uniform, especially in terms of vibration and noise performance.
Further, the scaling effect of podded propulsors and the conversion method of full-scale ship performance have not been researched extensively. Self-propulsion testing of double pods and performance estimation of full-scale podded ships remain critical and challenging research areas globally [18,19,20].
The L-type pod propulsor is a new type of pod launched by ABB Company in recent years. Its power range is from 1.3 to 4.5 MW. The arrangement of the support and cabin is L-shaped, and the distance between the support and the blade is relatively long, which can improve the uniformity of the inflow of the blade and reduce the bracket pulsation force caused by the blade wake. The L-type podded propulsor directly uses the water outside the pod to cool, which can improve the overall propulsion efficiency and has excellent energy saving performance. In recent years, the L-type podded propulsor has been favored by more and more users. However, up to now, little research has been undertaken on the hydrodynamic performance of the L-type podded propulsor. Because of its special support form, the conversion method to full scale is different from that of a conventional podded propulsor. Therefore, it is necessary to develop relevant numerical prediction methods to provide technical support for design.
In this study, the conversion method for the performance of a full-scale ship with double pods was established based on the correction method published by the International Towing Tank Conference (ITTC) for the scaling effect of a single podded propeller and research reports on pod tests conducted by different ship research institutes. In addition, the thrust deduction and wake fraction of the ship were analyzed. Furthermore, the self-propulsion performance of a full-scale ship with double L-type pods was estimated, the flow fields and pressure charts of the full scale and model scale ships compared, and the influence of the scaling effect investigated. The calculation results were also compared with the conversion results of a full-scale ship, and the reliability of the method adopted for estimating the performance of a full-scale ship with double podded propulsors verified.

2. Materials and Methods

2.1. Model Parameters for Ship Model Self-Propulsion Performance Estimation

The principal dimensions of the ship being considered are listed in Table 1, and the main parameters of the podded propulsor model are listed in Table 2.

2.2. Boundary Conditions and Hull Meshing for Ship Model Self-Propulsion Performance Estimation

We selected a cuboid as the calculation domain, extending vertically over the overall length of the ship from the bow upstream, three times its overall length from the stern downstream, and the overall length in each direction of the draught and width. The boundary conditions are shown in Figure 1. The shear stress transport (SST) k - ω model was used for turbulence modeling, and the volume of fluid (VOF) method was used for free surface capture.
The ship model with double L-type podded propulsors is shown in Figure 2. The grid division of the model is shown in Figure 3. The sliding mesh method was adopted for simulating rotating propellers. The time step was the time taken for a propeller to rotate by 1°.

2.3. Calculation Results for Ship Model Self-Propulsion Performance

The calculated speed was 1.221 m/s, corresponding to 10 knots of real ship speed. The number of grids, y+ values and the drag calculation values of each set of grids are shown in Table 3.
From the resistance calculation results in the table, it can be seen that the difference between the resistance values of the fifth set and the sixth set is about 0.2%. Therefore, it is reasonable to select the fifth set of grids to calculate the resistance of the model.
In Figure 4 and Figure 5, K T B and K Q B , respectively, represent the thrust and torque coefficients of a podded propulsor for the self-propulsion condition, and K T O and K Q O , respectively, represent the thrust coefficient and torque coefficient of a podded propulsor in open water conditions. K T B and K Q B , respectively, denote the mean coefficients of the propellers in the self-propulsion and open water conditions. It can be seen from the figures that K T B and K Q B are both larger than K T O and K Q O by approximately 9.5% each, primarily due to the existence of a non-uniform flow around the ship’s hull, which improved the hydrodynamic performance of the pod.

2.4. Methods for Performance Prediction of Full-Scale Podded Propulsors

When a podded propeller is regarded as a holistic unit, its speed prediction method is similar to that for a conventional propeller, which is the method proposed by the Propulsion Committee at the 25th ITTC meeting [12], as described below; however, it should be noted that the resistance of a pod requires special processing to adjust for the scaling effect.
The 1978 ITTC Performance Prediction method is a simple method for estimating the resistance of a pod. The pod resistance R P o d can be divided into four components:
R P o d = R B o d y + R S t r u t + R I n t + R L i f t
where R B o d y and R S t r u t represent the resistances of the hull and the bracket, respectively; R I n t is the interference force between the hull and the bracket; and R L i f t is the additional resistance caused by the wake flow of rotating blades, which acts mainly on the bracket. Each of these components is discussed in detail in the following section.

2.4.1. Resistances of the Pod Hull and Bracket

Similar to the determination for the ship hull resistance, the shape factor method is used to predict the resistances of the hull and the bracket:
R B o d y = ( 1 + k B o d y ) R B o d y F
R S t r u t = ( 1 + k S t r u t ) R S t r u t F
where the superscript F represents the frictional resistance.
The following formula can be used to calculate the shape factor of the hull:
k B o d y = 1.5 ( D L ) 1.5 + 7 ( D L ) 3
where D is the (maximum) diameter of the hull, and L is its length.
The shape factor of the bracket is calculated according to the following equation:
k S t r u t = 2 δ S + 60 δ S 4
where δ S is the average thickness ratio or average thickness-to-chord ratio span of the bracket.
The frictional resistances of the hull and bracket, denoted by R B o d y F and R S t r u t F , respectively, can be calculated using the following equation:
R F = 0.5 C F ρ V I n f l o w 2 S W
where V I n f l o w is the inflow velocity, and S W is the wetted area.
Considering that the hull and the A P bracket are in the wake region of the propeller, the frictional resistance coefficient can be calculated as follows:
C F = 0.075 ( l o g 10 R e 2 )
The frictional resistance of the remaining parts can be calculated using the following equation:
C F = { 1.327 R e 0.5 ( R e < 5.25 × 10 4 ) C F 0 10 0.117 f ( R e ) ( 5.25 × 10 4 R e < 2 × 10 6 ) 1 ( 3.46 l o g 10 R e 5.6 ) 2 1700 R e ( R e 10 6 )
where C F 0 = 1 [ 3.46 l o g 10 ( 2 × 10 6 ) 5.6 ] 2 1700 2 × 10 6 2.96 × 10 3 , and f ( R e ) = ( l o g 10 R e 6.3 ) 2 .
The following equation can be used to calculate the flow velocity of the hull and the bracket for pulling-type podded propulsors:
V I n f l o w = V A ( 1 + C T ) 0.5
where C T = T ( 0.5 ρ V A 2 A P ) represents the thrust load factor of the propeller, and A P is the disc area.
The following estimation equation to calculate the flow velocity of the hull and bracket, which applies to both pulling- and pushing-type podded propulsors has also been introduced:
V I n f l o w = α ( n p ) + ( 1 α ) V A
where P is the average blade pitch; n is the rotational speed of the propeller; and α is the empirical coefficient, which is set as 0.25 for pushing-type propellers and 0.8 for pulling type propellers.

2.4.2. Interference Resistance of the Pod Hull and Bracket

Further, the following equations can be used to calculate the interference resistance:
R I m t = 0.5 ρ V I n f l o w 2 t 2 f ( t r o o t c r o o t )
f ( t r o o t c r o o t ) = C r o u n d [ 17 ( t r o o t c r o o t ) 2 0.05 ]
where t r o o t is the thickness of the section at the foot of the bracket; and c r o o t is the chord length of the section at the foot of the bracket, which ranges between 0.6 and 1.0 depending on the rounded angle of the foot. R I n t plays a critical part in the resistance of the pod, which is not dependent on the Reynolds number.

2.4.3. Additional Flow Resistance Caused by Wake Flow

When the shape of the pod is relatively smooth and the blade load is relatively low, R l i f t can be ignored. In fact, current ITTC procedures do not specify any estimation methods for R l i f t .
By using the method described above, the thrust and torque coefficients of full-scale open water podded propulsors, i.e., K T U and K Q U , can be determined:
K T U = ( K T U ) m + Δ K T P + Δ K T U
K Q U = ( K Q U ) m + Δ K Q P
Δ K T U = Δ R B o d y + Δ R S t r u t ρ n 2 D 4
In the above equations, the subscript U represents a propulsion unit, P refers to the blade, m is the model test value, and S is the full-scale ship data.
The corrected pod resistance Δ R , excluding the subscripts for body and strut, can be expressed as:
Δ R = 0.5 ρ V I n f l o w 2 S W ( 1 + k ) ( C F m C F s )
The corrected scaling effect parameters for the blades, namely, Δ K T P and Δ K Q P , can be calculated by using the 1978 ITTC method.

2.5. Performance Conversion Method for A Full-Scale Ship with Double L-Type Podded Propulsors

Conversion of the performance of a full-scale ship with double podded propulsors has been recognized as a crucial but challenging topic. The following section introduces the conversion method used in this study.
The corrected frictional resistance F D is:
F D = R m ρ m R s ρ s λ 3 = 1 2 ρ m S m V m 2 ( C f m C f s Δ C f )
The simulation of the self-propulsion tests aims to adjust the rotational speed of the podded propulsors so that the overall force on the pod propulsion system is equal to the corrected frictional resistance FD. The method involves calculating approximately five different rotational speeds to include the corrected frictional resistance within the range of the overall force, and to obtain the following factors when the overall force is equal to the corrected frictional resistance by interpolation: the rotational speed n , propeller thrust T P m , torque T Q m , and thrust T u m and torque Q u m of the pod units.
Assuming that the thrust deduction is free from scaling effects, the thrust deduction factor tm is determined using the following equation:
t m = 1 R t m F D 2 T m
The thrust Tm can be determined using the following expression:
T m = T u m + ( T p m T u m ) γ
where γ is the shape factor of the pod. Previous experimental results have indicated that a shorter and thicker bracket corresponds to a smaller value of γ . In this study, the value of γ was taken as 0.5.
On the basis of the thrust identity method, the advance speed coefficient J , and the torque coefficient K Q m can be obtained by using the thrust coefficient K T m pertaining to the open water characteristic curve of the propeller model.
The wake fraction can be determined as follows:
w m = 1 J m n m D m V m
Assuming that the thrust deduction t and the relative rotational efficiency η R do not have a scaling effect:
t m = t s ,   η R m = η R s
Details concerning the calculation of the open water efficiency of the propeller, η P , and the hull efficiency η H can be found in the standard 1978 ITTC conversion method [21].
Considering that the pod does not require a rudder, the full-scale ship wake fraction can be calculated using the following equation:
w s = t m + ( w m t m ) C ts + Δ C f C f m
The full-scale propeller load is:
K T s J 2 = C t s S s 2 D s 2 ( 1 t ) ( 1 w s ) 2
The speed coefficient, torque coefficient and the full-scale propeller open water efficiency, η P s , can be obtained from the full-scale propeller open-water characteristic curve by using the full-scale propeller load. The rotational speed is determined using the following equation:
n s = ( 1 w s ) V s / ( J s D s )
The pod propulsion efficiency η U s is:
η U s = η P s η R 1 t m 1 w s
The power P D that each individual propeller receives is:
P D = P E / 2 η U s
P E is the effective power of the full-scale ship and can be calculated as follows:
P E = R t s V s / 1000

3. Results and Discussion

3.1. Conversion of Self-Propulsion Performance for Full-Scale Double L-Type Podded Propeller

The previous results concerning the model self-propulsion were processed using the conversion method outlined above; the results are presented in Table 4. Both the power factor C P and the speed factor C N were one.

3.2. Numerical Calculation of the Self-Propulsion Performance for a Full-Scale Ship with Double Podded Propulsors

In this study, the self-propulsion parameters of a full-scale ship were calculated to verify the conversion method for pod self-propulsion and for in-depth analysis of its scaling effect. The calculation results for the resistance of a full-scale ship are presented in Table 5. It can be seen from the table that the resistance values of the last three sets of grids are relatively similar. Considering the calculation time, the fourth set of grid settings was selected for the self-propulsion calculation. The grid had approximately 20 million cells, and the value range of y+ was from 80 to 250. The resistance performance and the self-propulsion performance were determined using only one speed, with Fn = 0.182. Figure 6 is a meshing diagram of the full-scale model.
In Table 6, Cal-Real refers to the calculation results for the full-scale ship, EXP-Model represents the conversion values of the ship model, and ε represents the error. The table indicates that the difference between the conversion result of the full-scale ship resistance and the calculation result is 5.79%, and the conversion data obtained using the two-dimensional method appear to be more accurate. The determination of the self-propulsion performance is based on the resistance of the model involving the propeller, of which the grid parameter settings are generally the same, which means that the difference between the self-propulsion performance and the resistance performance of a full-scale ship is minor. The prediction of the rotational speed has an error of approximately 2.51%, which is a minor deviation. The error of the thrust and torque are each approximately 15%.
Figure 7 and Figure 8 compare the distribution of propeller wake flow at X/ L p p = 0.115 (in front of the propeller) and X/ L p p = 0.103 (behind the propeller). It can be seen that the axial flow fields of the full scale and the model scale are similar. This is because the Reynolds number of the propeller has exceeded a certain value, and its scaling effect has been considerably reduced. As a result, the dimensionless quantities of the wake flow are similar.
However, these values are not similar in the section of the pod behind the propeller. The full-scale boundary layer near the pod is quite thin, while the velocity gradient distribution of the model scale is obvious. This is because the relative scale of the full-scale boundary layer is quite small, which matches the industry’s perceptions of the boundary layer. According to the distribution of the flow field, the results of the full-scale simulations reflect the actual circumstances fairly accurately.
Figure 9 shows a comparative view of the overall pressure distribution of the full-scale and the model-scale L-type podded propulsors. Considering that the pressure distributions of the left and right pods are basically symmetrical, the pressure distribution of only the left pod is presented. The pressure was made dimensionless to facilitate the comparison. It is noted that although the pressure distributions for the full scale and the model scale differ slightly, they are reasonably similar overall. Excluding the blades at the top and the bottom, the other two blades demonstrate similar pressure distributions because the considered pressure chart is a static pressure chart that includes gravitational factors. Further, the full-scale blades are quite large, and the water pressure generated by the force of gravity in the full-scale case is not similar to that for the model-scale case, which also results in the dissimilarity of the pressure distributions of the pod.
Figure 10 shows a comparison of the model-scale and full-scale flow fields in the longitudinal section in which Y/ L p p = 0.041. The comparison suggests that the boundary layer of the full-scale pod is thinner than that of the model scale. There are notable differences between the flow fields behind the propeller and that around the bracket. The range of the low-speed flow field of the full-scale pod is small. The flow disturbance of the area surrounding the podded propeller is quite complicated, as noted from the mutual interference among the ship hull, dead wood, propeller, pod, and bracket. In addition, the Reynolds numbers of the full scale and the model scale L-type podded propulsors are considerably different, which inevitably leads to the dissimilarity of flow fields near the wall and the similarity of the flow fields far from the ship hull.

4. Conclusions

This paper proposed a conversion method for the performance of a full-scale ship with two L-type podded propulsors. The self-propelled performance of the model scale and real scale ship were determined under different speeds, and the influence of the scale effect on the flow field and pressure distribution analyzed. The obtained conclusions are as follows:
(1)
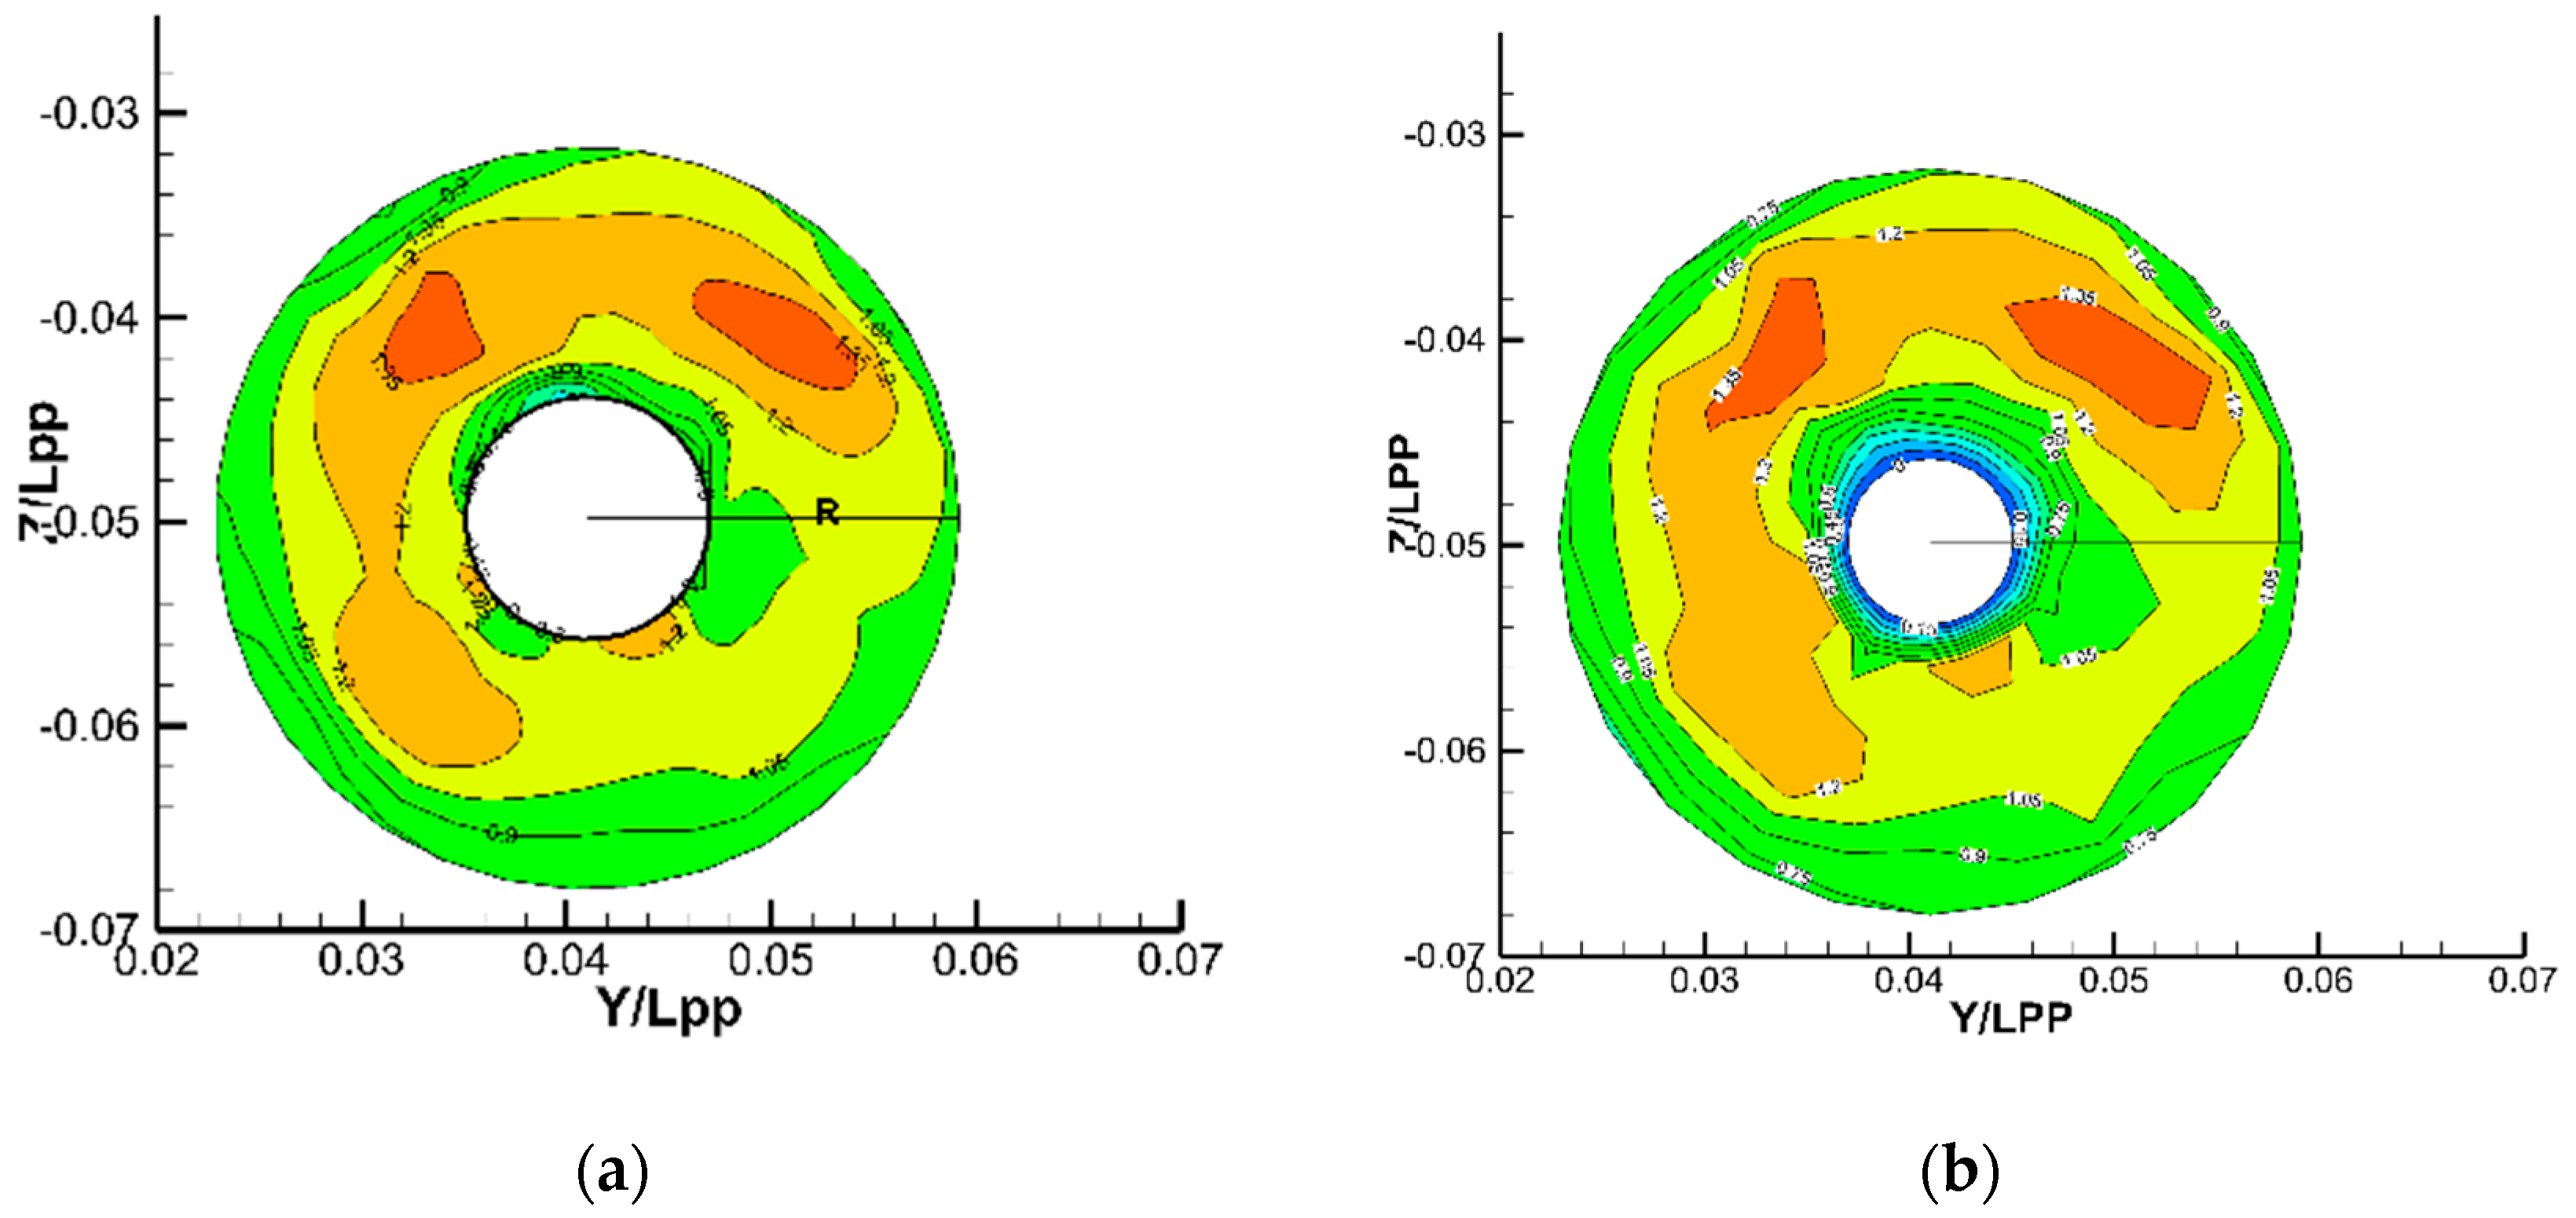
The influence of dead wood on the wake flow at the stern of the ship improves the performance of the podded propeller.
(2)
The calculation results for the full-scale case indicate that the conversion method for the self-propelled double pods is feasible to some extent.
(3)
The Reynolds numbers of the full scale and model scale podded propulsors are quite different, resulting in a significant difference in the thicknesses of the boundary layer and dissimilarity of the flow fields near the wall.
The findings in this paper can provide statistics and technical support for the design of L-type podded propulsors and their application in full-scale ships, which are of theoretical significance and practical value in the engineering domain.

Author Contributions

Writing—original draft preparation, D.Z.; Writing—review and editing, D.Z.; Methodology, C.G.; Formal analysis, J.L.; Conceptualization, Z.Z.; Investigation, X.B.

Funding

This study was funded by the National Natural Science Foundation of China, grant numbers 51709060 and 51609030; Fundamental Research Funds for the Central Universities, grant number HEUCFM180104; and the National High Technology Joint Research Program of China, grant number (2016) 548.

Acknowledgments

Several individuals offered valuable help to produce this research. I wish to take this opportunity to thank my tutor, Guo, who provided constructive advice in the process of composing this paper, and also helped in its correction and revision. Finally, I thank my parents, who raised me well with their warmth and care.

Conflicts of Interest

The authors declare no conflict of interest. The funders had no role in the design of the study; in the collection, analyses, or interpretation of data; in the writing of the manuscript; or in the decision to publish the results.

References

  1. Lobachev, M.P.; TchitcherineL, A. The full-scale resistance estimation for podded propulsion system by RANS method. In Proceedings of the International Symposium on Ship Propulsion, St Petersburg, Russia, 19–21 June 2001; pp. 39–44. [Google Scholar]
  2. Chicherin, I.A.; Lobachev, M.P.; Pustoshny, A.V.; Sanchez, C.A. On a propulsion prediction procedure for ships with podded propulsors using RANS-code analysis. In Proceedings of the 1st International Conference on Technological Advances in Podded Propulsion; Atlar, M., Clarke, D., Glover, E.J., Sampson, R., Woodward, M., Eds.; University of Newcastle: Newcastle upon Tyne, UK, 2004; pp. 223–233. [Google Scholar]
  3. Sanchez-Caja, A.; Slaminen, E.; Rautaheimo, P.; Siikonen, T. Computation of the incompressible viscous-flow around a tractor thruster using a sliding-mesh technique. In Proceedings of the 7th International Conference on Numerical Ship Hydrodynamics, Nantes, France, 19–22 July 1999; pp. 1–12. [Google Scholar]
  4. Lee, S.K.; Chen, H.C. A coupled RANS/VLM approach for multi-component propulsor analysis. In Proceedings of the Propellers/Shafting’s 2003 Symposium, Virginia Beach, VA, USA, 17–18 September 2003; pp. 1–19. [Google Scholar]
  5. English, J.W. Propeller/Hull interaction. In Proceedings of the 14th International Towing Tank Conference, Ottawa, ON, Canada, September 1975. [Google Scholar]
  6. Streckwall, H.; Gatchell, S.; Tigges, K. A completer numerical model for podded propulsion. In Proceedings of the 9th Symposium on Practical Design of Ships and Other Floating Structures, Luebeck-Travemuende, Germany, 12–17 September 2004; pp. 1–6. [Google Scholar]
  7. Ohashi, K.; Hino, T. Numerical simulations of flows around a ship with podded propulsor. In Proceedings of the 1st International Conference on Technological Advances in Podded Propulsion; Atlar, M., Clarke, D., Glover, E.J., Sampson, R., Woodward, M., Eds.; University of Newcastle: Newcastle upon Tyne, UK, 2004; pp. 211–221. [Google Scholar]
  8. Kang, D. Study on Hydrodynamic Performance of Container Ship with Podded Propulsor Based on CFD Method. Master’s Thesis, Zhejiang University, Hangzhou, China, 2016. [Google Scholar]
  9. Chuang, Z. Using CFD Method to Research on the Hydrodynamic Performance of Podded Propulsor. Master’s Thesis, Harbin Engineering University, Harbin, China, 2009. [Google Scholar]
  10. Shamsi, R.; Ghassemi, H.; Iranmanesh, M. A Comparison of the BEM and RANS Calculations for the hydrodynamic performance of the PODS. Mech. Ind. 2017, 18, 205. [Google Scholar] [CrossRef]
  11. Shamsi, R.; Ghassemi, H. A BEM/RANS Coupled Method for Numerical Simulations of Podded Drive System. Modares Mech. Eng. 2017, 17, 65–76. [Google Scholar]
  12. The Specialist Committee on Azimuthing Podded Propulsion. In Proceedings of the 25th ITTC, Fukuoka, Japan, 14–20 September 2008. Final Report and Recommendations to the 25th ITTC.
  13. Ilkka, S.; Ahti, A. New type of dynamometers for pod-propulsor model tests. Marit. Res. News 2003, 17, 11. [Google Scholar]
  14. Wang, D.; Atlar, M.; Glover, E.J.; Paterson, I. Experimental investigation of flow field around a podded propulsor using LDA. In Proceedings of the 1st International Conference on Technological Advances in Podded Propulsion; Atlar, M., Clarke, D., Glover, E.J., Sampson, R., Woodward, M., Eds.; University of Newcastle: Newcastle upon Tyne, UK, 2004; pp. 483–498. [Google Scholar]
  15. Pustoshny, A.V.; Kaprantsev, S.V. Azipodded propeller blade cavitation observations during ship maneuvering. In Proceedings of the 4th Symposium on Cavitation, Pasadena, CA, USA, 20–23 June 2001. [Google Scholar]
  16. Friesch, J. Investigations of podded drivers in a large cavitation tunnel. In Proceedings of the PRADS 2001, Shanghai, China, 16–21 September 2001; pp. 749–756. [Google Scholar]
  17. Friesch, J. Cavitation and vibration investigations for podded drivers. In Proceedings of the 1st International Conference on Technological Advances in Podded Propulsion; Atlar, M., Clarke, D., Glover, E.J., Sampson, R., Woodward, M., Eds.; University of Newcastle: Newcastle upon Tyne, UK, 2004; pp. 387–399. [Google Scholar]
  18. Gierusz, W. Simulation model of the LNG carrier with podded propulsion, Part II: Full model and experimental results. Ocean Eng. 2016, 123, 28–44. [Google Scholar] [CrossRef]
  19. Pacuraru, F.; Lungu, A. Numerical Investigation on Ship Podded Propulsion. In Proceedings of the International Conference on Numerical Analysis and Applied Mathematics, Rhodes, Greece, 19–25 September 2010; Volume 1281, pp. 111–114. [Google Scholar]
  20. Hanninen, S.; Ojanen, M.; Uuskallio, A.; Vuorio, J. Recent development of podded propulsion in arctic shipping. In Proceedings of the 19th International Conference on Port and Ocean Engineering Under Arctic Conditions (POAC 2007), Dalian University of Technology, Dalian, China, 27–30 June 2007; pp. 469–481. [Google Scholar]
  21. Report of Resistance Committee. In Proceedings of the 15th ITTC, Hague, The Netherlands, 3–10 September 1978.
Figure 1. Boundary conditions calculation domain.
Jmse 07 00162 g001
Figure 2. Model of the self-propelled ship.
Jmse 07 00162 g002
Figure 3. Grid generation for model of self-propelled ship.
Jmse 07 00162 g003
Figure 4. Thrust coefficient of podded propulsor in self-propulsion and open water conditions.
Jmse 07 00162 g004
Figure 5. Torque coefficient of podded propulsor in self-propulsion and open water conditions.
Jmse 07 00162 g005
Figure 6. Mesh of a full-scale ship.
Jmse 07 00162 g006
Figure 7. Axial flow field of full scale and model scale at X/ L p p = 0.115: (a) Full scale: Fn = 0.182, n = 1.555 rps; (b) Model scale: Fn = 0.182, n = 6.707 rps.
Jmse 07 00162 g007
Figure 8. Axial flow field of the full scale and model scale at X/ L p p = 0.103: (a) Full scale: Fn = 0.182, n = 1.555 rps; (b) Model scale: Fn = 0.182, n = 6.707 rps.
Jmse 07 00162 g008
Figure 9. Pressure distributions of the full scale and the model scale cases: (a) Full-scale side view (left pod); (b) model-scale side view (left pod); (c) full-scale top view (left pod); (d) model-scale top view (left pod); (e) full-scale front view (left pod); (f) model-scale front view (left pod).
Jmse 07 00162 g009aJmse 07 00162 g009b
Figure 10. Flow field of the full-scale and the model-scale cases in the longitudinal section pertaining to Y/LPP = 0.041: (a) Full scale (b) Model scale.
Jmse 07 00162 g010aJmse 07 00162 g010b
Table 1. Principal dimensional parameters of the ship.
ParameterValue
Length overall Loa (m)122.5
Length between perpendiculars Lpp (m)117.0
Molded breadth B (m)22
Molded depth D (m)11.8
Design draught T (m)8.0
Wetted surface area S (m2)350
Contracted scale λ 17.708
Table 2. Main parameters of the podded propulsor model.
ParameterValue
Bracket angle (°)60
Overall length of the pod (m)0.473
Maximum radius of the pod (m)0.049
Number of blades4
Diameter of propeller (m)0.240
Pitch ratio (0.7 R)1.284
Table 3. y+ and resistance calculation results of the six different meshes.
Number of Grid Cells
(×10,000)
Value of y+ maxResistance Value (KN)
111276450.583
215658541.857
322043235.285
434522433.852
555211933.322
67537833.315
Table 4. Forecast results of full-scale ship performance.
VSNSTSQSPEPDS
(kn)(rps)(rpm)(KN)(KNm)(KW)(KW)
40.54332.58649.18217.88070.32361.015
60.87652.547120.23749.355263.170271.583
81.08965.331185.01076.753533.352525.099
101.30678.374267.041111.881953.825918.241
121.59495.635395.021163.8621676.2431641.060
141.945116.710588.609243.0192918.2872970.138
162.299137.957818.460345.8134979.9764995.888
182.780166.7901201.100480.0198250.3308384.083
VSKTS/JS2JStSωSηPsηHs
(kn)
40.92970.7110.3050.22520.6470.897
60.92490.7120.2900.19300.5670.879
80.91450.7140.2990.23050.5690.911
100.92110.7130.3050.25420.5680.932
120.90640.7160.3120.24470.5710.911
140.90740.7160.3110.21860.5710.882
160.89670.7180.2600.18050.5730.903
180.9060.7160.2580.13600.5710.859
VSηRsηUsNTPDT
(kn)(rps)(rpm)(KW)(hp)
40.9940.5760.54332.58661.01583.013
60.9710.4850.87652.547271.583369.501
80.9790.5081.08965.331525.099714.420
100.9800.5191.30678.374918.2411249.307
120.9820.5111.59495.6351641.0602232.735
140.9760.4911.945116.7102970.1384041.005
160.9630.4982.299137.9574995.8886797.126
181.0020.4922.780166.7908384.08311,406.915
Table 5. Results of different grids.
Number of Grid Cells (×10,000)Value of y+ maxResistance Value
(KN)
11000628178.952
21200573206.324
31500381237.561
41980234256.853
52200112265.385
Table 6. Calculated values for full ship and extrapolated values for model.
Rs
(KN)
Ns
(rps)
Ts
(KN)
Qs
(KNm)
Cal-Real256.8531.555341.218142.450
EXP-Model271.7151.594395.021163.863
ε/%5.792.5115.7715.03

