Article

Influence Mechanism of Different Flow Patterns on the Softening of Red-Bed Soft Rock

1
School of Civil Engineering, Sun Yat-Sen University, Zhuhai 519082, China
2
Guangdong Engineering Research Centre for Major Infrastructures Safety, Guangzhou 510275, China
3
Research Center for Geotechnical Engineering and Information Technology, Sun Yat-Sen University, Guangzhou 510275, China
4
School of Marine Sciences, Sun Yat-Sen University, Zhuhai 519082, China
*
Author to whom correspondence should be addressed.
J. Mar. Sci. Eng. 2019, 7(5), 155; https://doi.org/10.3390/jmse7050155
Submission received: 15 April 2019 / Revised: 6 May 2019 / Accepted: 14 May 2019 / Published: 18 May 2019
(This article belongs to the Section Coastal Engineering)

Abstract

:
As a typical representative of red beds, the softening and disintegration of red sandstone when it encounters water is an important cause of initiated engineering disasters. However, research on the softening of this kind of rock has mainly focused on the still water–rock interaction. There is still a lack of quantitative analysis and a mechanistic explanation for the basic experimental study of dynamic water–rock interactions. Therefore, based on the independently developed multifunctional open channel hydraulic test equipment, the still water was used as the reference by designing the saturation test of red sandstone under two typical flow patterns—laminar flow and turbulent flow—and combined with a three-dimensional numerical simulation; specifically, the chemical, physical and mechanical effects of different flow patterns on the softening of red sandstone are discussed, and the mechanism of the influence of different flow patterns on the softening of red sandstone was further revealed. The results show that under different flow patterns, as the flow of water increased, the alkalinity of the circulating solution became stronger, the speed of stabilization of the ion concentration became faster, the development of the microscopic structure of the corresponding rock became higher and the decrease in mechanical strength became greater. The flow state affects the processes of rock softening and breaking by acting on the rock from the three aspects of chemistry, physics and mechanics. The study makes up for the deficiency of the quantitative analysis index of rock softening under dynamic water conditions and further improves the influence mechanism of different flow patterns on soft rock softening in red beds under dynamic water conditions. This research also provides a specific method for the protection of estuarine and coastal bank slopes with rich red-bed soft rock dissection under different flow patterns.

1. Introduction

As a kind of special soft rock, red sandstone is often encountered in major engineering construction efforts, such as the Gezhouba hydraulic engineering project, the three Gorges Reservoir area and the South-to-North Water Transfer project. In the past, scholars have mainly focused attention on the softening mechanism of this kind of rock mass under hydrostatic conditions [1,2,3,4,5,6,7,8,9]; for example, Hadizadeh et al. [1] considered that the size and morphology of pores in sandstone, the composition of the cemented matter and the boundary condition of particles were the main factors affecting the water–rock interaction. Lepokurova et al. [2] found that water was not in equilibrium with primary enclosing rock aluminosilicate minerals (e.g., feldspar, muscovite, biotite, pyroxene and epidote); rather, these rocks dissolved in water and, consequently, were enriched by Fe, Ca, Mg, K, Na, Si, Al and Mn. Furthermore, the accumulation of these elements in the solution resulted in clay–water equilibrium (e.g., kaolinite, montmorillonite, partially and chlorite), carbonate–water equilibrium (e.g., rhodochrosite, calcite, dolomite and siderite), Fe oxide–water equilibrium and hydroxide–water equilibrium. Brusky et al. [3] established a reversible and irreversible water–mineral interaction model by simulating the geochemical evolution of old groundwater in the Cenomanian and Turonian sandstone aquifers in the Bohemian Cretaceous Basin in Central Europe and proposed that the processes of water–rock interactions were the irreversible dissolution of feldspars and carbonate, aluminium and silica equilibrium. Zhou et al. [4] conducted an experimental study on the saturated water of red-bed soft rock under still water conditions, and it was pointed out that the main reason for the decrease of physical and mechanical properties of rock mass caused by water softening of soft rock was that the water–rock interaction changed the structure of soft rock, which was the result of the combined action of physics, chemistry and mechanics. Although we have already formed a more perfect theory on the softening mechanism of red-bed soft rock under static water conditions, real-life disasters such as bank slope collapse and slides still exist. The explanation of the softening mechanism of red-bed soft rock under still water conditions does not meet the protection demand of actual hydraulic engineering and the red-bed bank slope.
Due to differences in topography, geomorphology and hydrological conditions, different waters of an open channel river have different hydrodynamic characteristics. Disaster-related problems encountered in real-life hydraulic engineering and river banks are often closely related to different hydrodynamic conditions [10,11,12,13,14,15]. For example, Zhang et al. [10], based on the cyclic loading test considering reservoir water level fluctuation and soaking-air-drying cyclic water–rock interaction in different water–rock cycles, found that the dynamic characteristics of sandstone showed obvious degradation trend in the process of water–rock interaction. As the water–rock interaction period increased, the dynamic response of the slope hydro-fluctuation belt zone increased gradually, resulting in a direct influence on the long-term seismic performance of the bank slope. Tang et al. [13,14], based on water–rock chemistry experiments, investigated whether the flow of aqueous solution has a great influence on the fracture mechanics effect of rock. The effects of water on the fracture mechanics of a rock mass with a structural plane (crack or joint) are direct and indirect. The direct action comes from the hydrostatic pressure or hydrodynamic pressure in the crack, and the indirect effect comes from the damage by water to shear strength (cohesion and internal friction angle) on the crack surface. The intensity of the water–rock chemical reaction is proportional to the flow rate of the aqueous solution. Based on the uniaxial compression fracture process of fractured rock under a hydro-chemical environment, Lu et al. [15] found that the effect of the solution pH value and immersion velocity on the strength corrosion of the fractured rock was obvious. The research described above was limited to the qualitative analysis of the influences of different hydrodynamic factors on rock mass or rock softening under dynamic water conditions, but the quantitative analysis and mechanism explanation based on quantitative analysis index were lacking.
Considering the limitations of many external environmental influencing factors and the lack of relevant idealized simulation equipment, Therefore, based on the independently developed multifunctional open channel hydraulic test equipment and using still water as the reference condition, the experiments investigating the water saturation of red sandstone with laminar flow and turbulent flow under dynamic water conditions was carried out. The effects of circulating solution chemical action on ion balance and microfissure propagation of red sandstone softening in different flow patterns were studied. Based on uniaxial compression test, the influence of different flow patterns on the mechanical properties of red sandstone was studied. Combined with three-dimensional (3D) numerical simulations, the effects of different flow patterns on the stress and deformation of red sandstone were studied, and the influence law and mechanism of different flow patterns on the softening of red sandstone were revealed quantitatively. The results and methods can provide a theoretical reference and analysis basis for the improvement of the catastrophic mechanism of the red-bed bank slope and the protection of estuarine and coastal bank slope and reclamation engineering.

2. Research Methods

This paper consists of two parts: laboratory test and numerical test. The objective of this study was to quantitatively analyse and identify the influence law and mechanism of different flow states on saturated water softening of red sandstone under dynamic water conditions from as many angles as possible. Based on the independently developed multifunctional open channel hydraulic test equipment, an experimental study on the saturated water softening of red sandstone under dynamic water conditions was conducted. After earlier laboratory tests, it was found that, on the one hand, because the flow velocity was too low in laminar flow, the horizontal force of the flow could not be accurately induced by attaching conventional strain gauges to the rock specimen. On the other hand, because the samples were too small, the strain gauges not only have constraints, but also indirectly partially offset the horizontal force of water on rock, and this influence affected the erosion effect of water on rock. The saturated test of red sandstone under different flow pattern conditions carried out by multifunctional hydraulic test equipment can be based only on chemical indexes, the extension of rock microfissure and the change in rock mechanical strength to quantitatively analyse the effect law and mechanism of different flow patterns on the softening of red sandstone. However, it is impossible to compare and analyse various stress and deformation indexes in the process of water–rock interaction based on laboratory tests. Therefore, by combining numerical experiments, a numerical model was established based on the boundary conditions and related parameters of the saturated red sandstone test under dynamic water conditions. The effect law and mechanism of different flow patterns on the softening of red sandstone under dynamic water conditions can be further illustrated by the stress and deformation of the water–rock interface caused by different flow patterns.

2.1. Laboratory Experimental Study
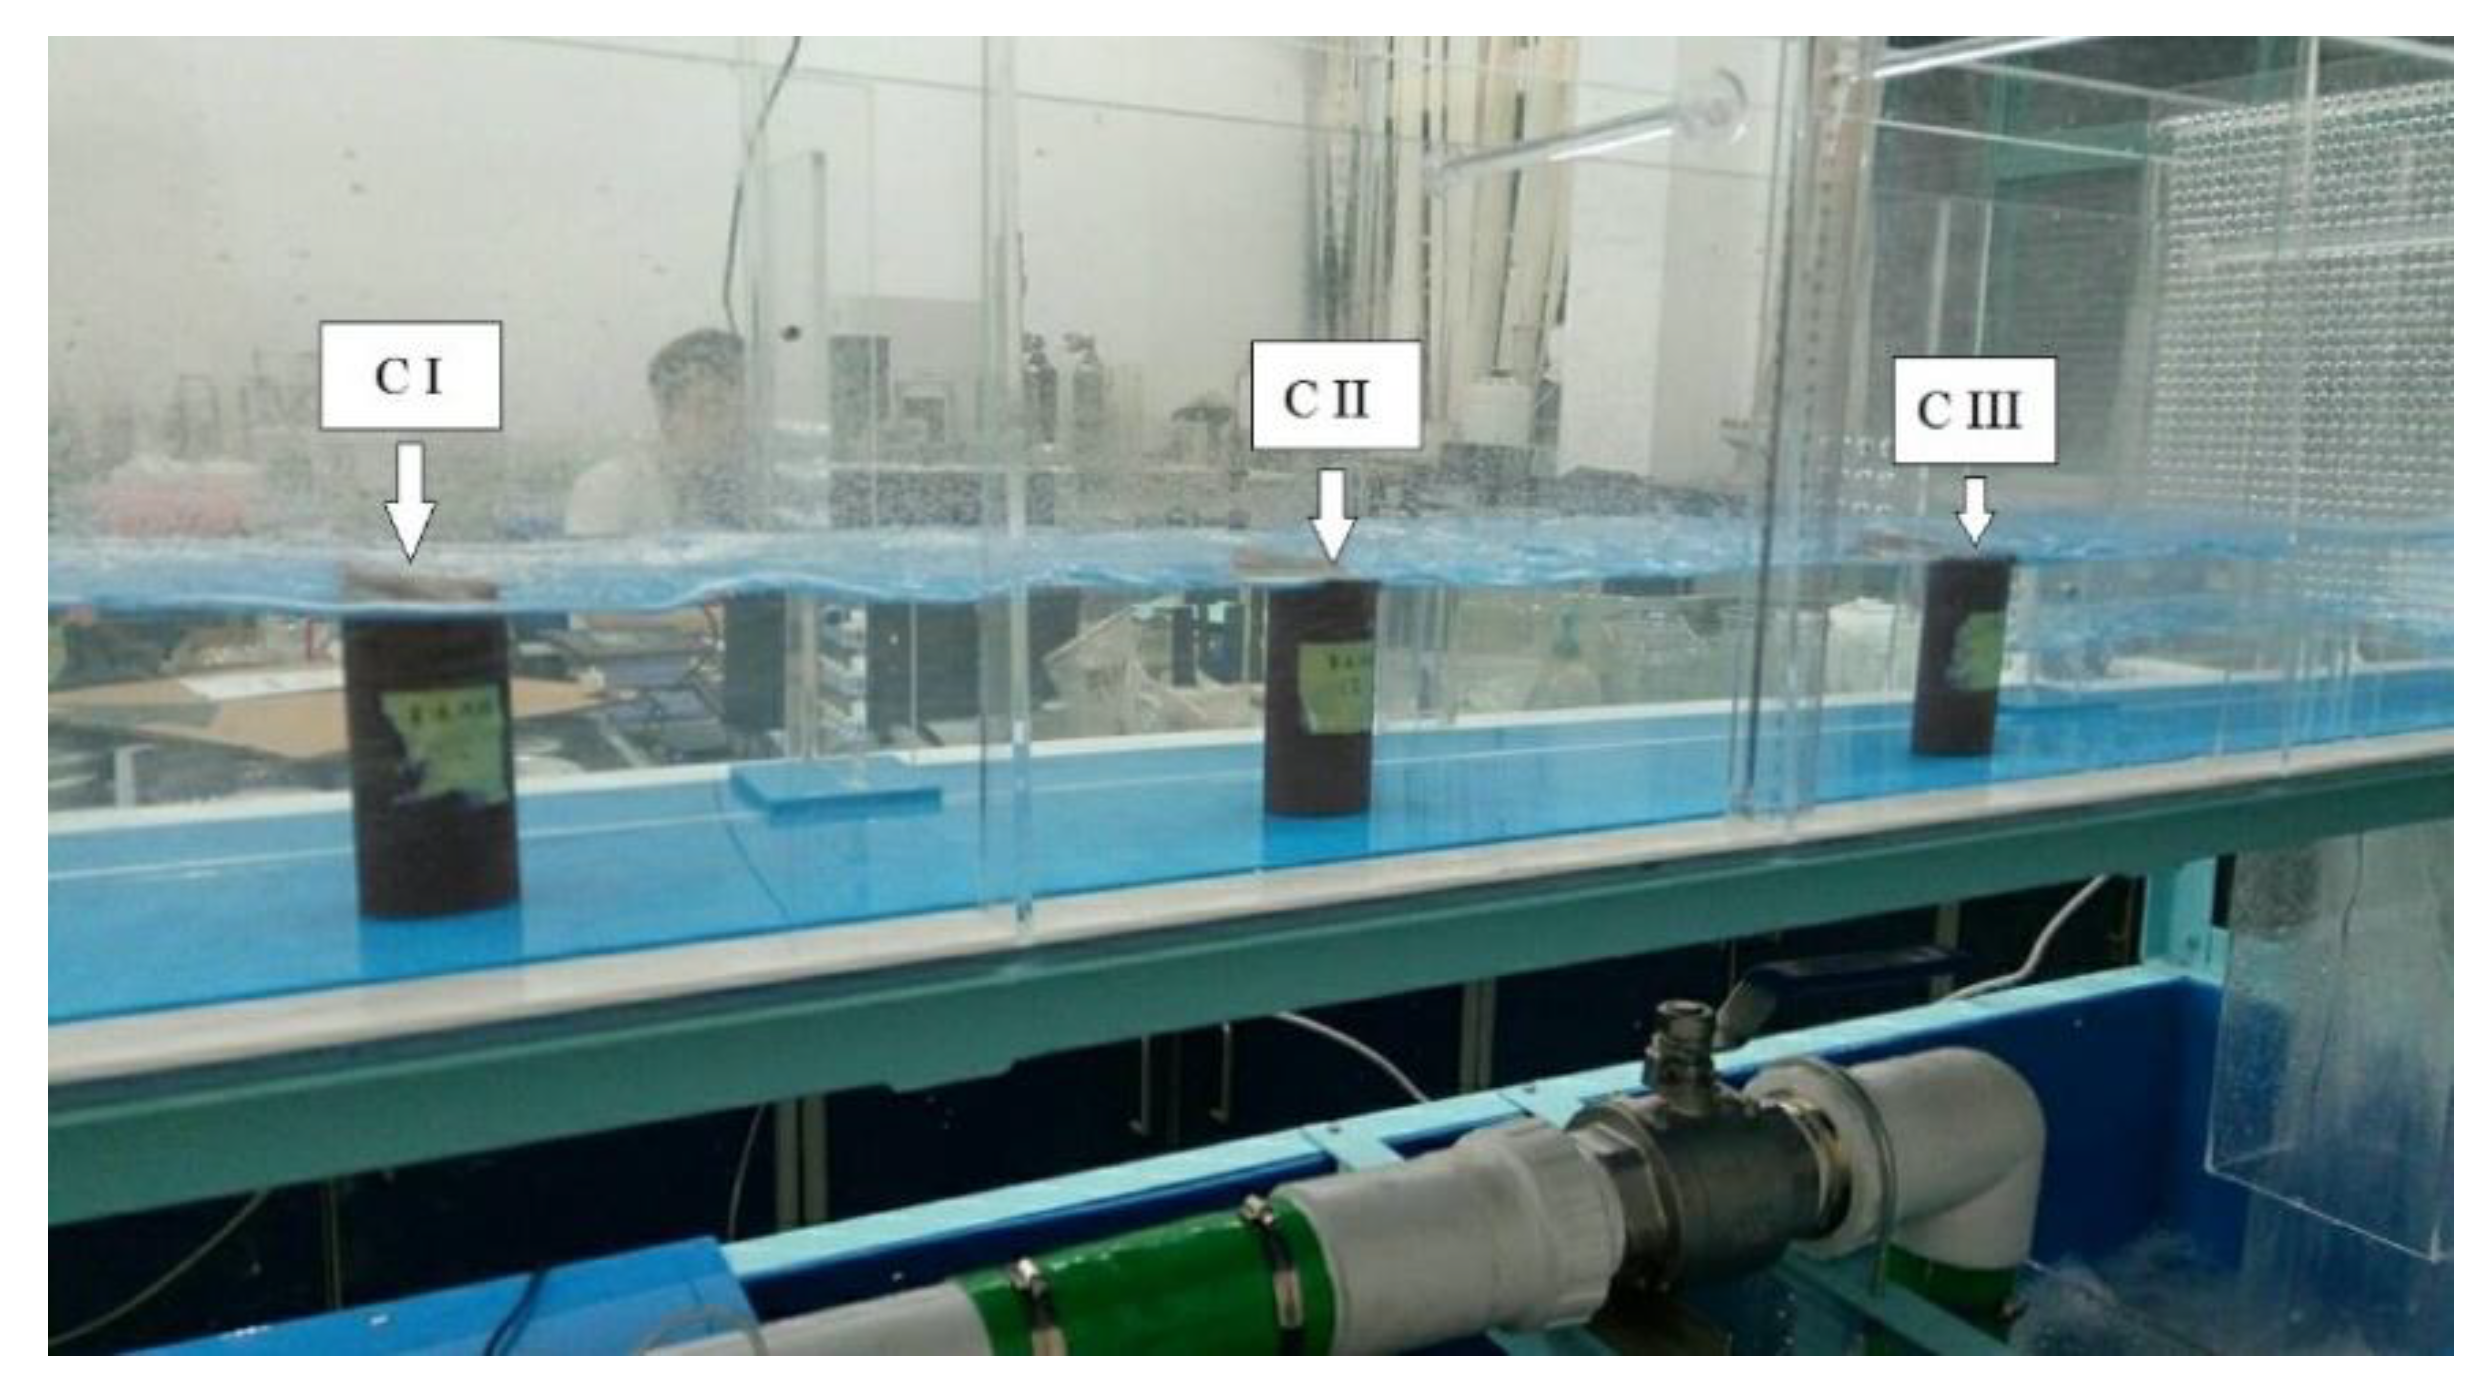
2.1.1. Test Method

To reasonably expound the influence law and mechanism of different flow patterns on the softening of red sandstone under dynamic water conditions using the saturation test of red sandstone under still water conditions (reference), the experiments of saturated red sandstone in laminar flow and turbulent flow were conducted using equal volumes of circulating solution. The chemical law of the influence of flow state on the softening of red sandstone was discussed from two aspects: the pH value of the circulating solution and the main anion concentrations. The physical law of the effect of flow pattern on the softening of red sandstone was contrasted and summarized from the extension of the rock microfissure and the development of rock pores, and the mechanical law of the effect of flow pattern on the softening of red sandstone was compared and analysed from the angle of uniaxial compressive strength. Finally, based on the above three aspects, the effects law and mechanisms of different flow patterns on the softening of red sandstone were studied.

2.1.2. Development of Test Equipment

Based on the availability of small circulation equipment that can obtain stable and sustainable open channel water flow over a long period of time, this equipment (Hangzhou Yuanliu Technology Inc., Hangzhou, China) adopts the design idea of a water flow cycle and automatic supplement water combined with the automatic control of temperature, and it adjusts the flow rate by means of an electromagnetic flow metre and tailgate opening wheel; finally, the equipment realizes the flow patterns under different water depths and velocities. The structural schematic diagram of the test equipment is shown in Figure 1. The equipment consists of three modules: flow control module, temperature control module and automatic make-up water module. The flow regulatory module was composed of a self-circulating open channel flume, an electromagnetic flow metre, a flow regulator, an electronic valve and a recorder, which was used to obtain the flow states under different water depths and velocities. The temperature control module consisted of a temperature sensor, a heating instrument, a refrigeration instrument, a recorder and a temperature controller, which can be used to adjust and record the temperature in real time according to the experimental requirements. The automatic make-up water module consists of a liquid level sensor, a pressure switch, a water pump, an indicator light and a recorder, which was used to restore water to the initial water level over time and ensure that the total water volume remained unchanged. The size of the flume test section was length × width × height = 200 × 30 × 40 cm, the velocity range of the equipment test section was 0–0.5 m/s, the flow range was 0–36 m3/s and the temperature regulation range was 0–60 °C. The experimental equipment can sustain the integrated control of the flow, temperature and water level and then obtain the target flow pattern. As shown in Figure 2, this experimental study was based on the equipment shown in the graph.

2.1.3. Test Content and Process

This experiment selected typical soft rocks of red sandstones that are widely distributed in South China as test samples. The samples were processed into cylindrical form with the following size: diameter (D) = 50 mm and height (H) = 100 mm. Twelve test specimens were randomly divided into 4 groups. Group A was used as a comparative reference for the natural rock samples, Group B was used for the laminar flow test, Group C was used for the turbulent flow test and Group D was used for the still water test (as shown in Figure 3). Tap water was selected as the test water source, and the open channel self-recirculating flume test equipment was used to obtain different flow patterns. Considering the boundary conditions, we chose the Reynolds number as the criterion of the different flow pattern. The average experimental flow velocity of the laminar section was set to 0.4 cm/s and the average velocity of the turbulent flow state was set to 36.25 cm/s, as shown in Figure 4. According to the hydrological forecast data of the Hukou Hydrometric Station of the Hydrology Bureau of the Yangtze River, this velocity approximately represents the mean velocity of the cross-section of the river from Poyang Lake to the Yangtze River. Before the test, we first determined the initial pH value of the water source and the main anion and cation concentrations to be used as reference values. After the same saturation time, a Thermo Dionex ICS-5000 ion chromatograph (Thermo Fisher Scientific, Sunnyvale, CA, USA), IRIS Advantage (HR) full-spectrum direct reading plasma-atomic emission spectrometer (PerkinElmer Enterprise Management (Shanghai) Inc., Shanghai, China), portable pH metre (Taiwan Hengxin technology Inc., Taiwan, China) and other instruments were used to test the main anion and cation concentrations as well as the pH value in the cycle solution. The microstructure changes of the red sandstone powders were observed in the four groups using a thermal field scanning electron microscope.
The three groups of rock specimens—B, C and D—were completely immersed in three different flow patterns: laminar, turbulent and still water. The concentrations of the main anions and cations and the pH values were checked once every three days using a portable pH metre for subsequent comparative analysis. At the same time, the total amount of water in the water–rock reaction process was kept consistent with the initial amount of water by controlling the addition of pure water.

2.2. Numerical Experiments Study

In this simulation, the fluid–structure coupling analysis module of ADINA software was used for modelling; the overall control parameters were specified, the materials, boundary conditions, initial conditions and loads were defined, and the grid to perform the numerical simulation was divided. Two examples were calculated under laminar and turbulent conditions. Through the comparison of the two sets of numerical simulation results, the influence of the two typical flow patterns on the softening of red sandstone was explored from the perspective of mechanic effects.
Direct numerical simulation is currently limited to a smaller number of Re. At the same time, the selection of the model mainly depends on whether or not the fluid is compressible, the establishment of special feasible problems, the requirement of precision, the ability of the computer and the limitation of time. On the basis of these considerations, under the condition that the calculation is guaranteed to be accurate, it is more appropriate to use turbulence model to define the fluid material according to the high Reynolds number turbulence developed in the actual laboratory test.

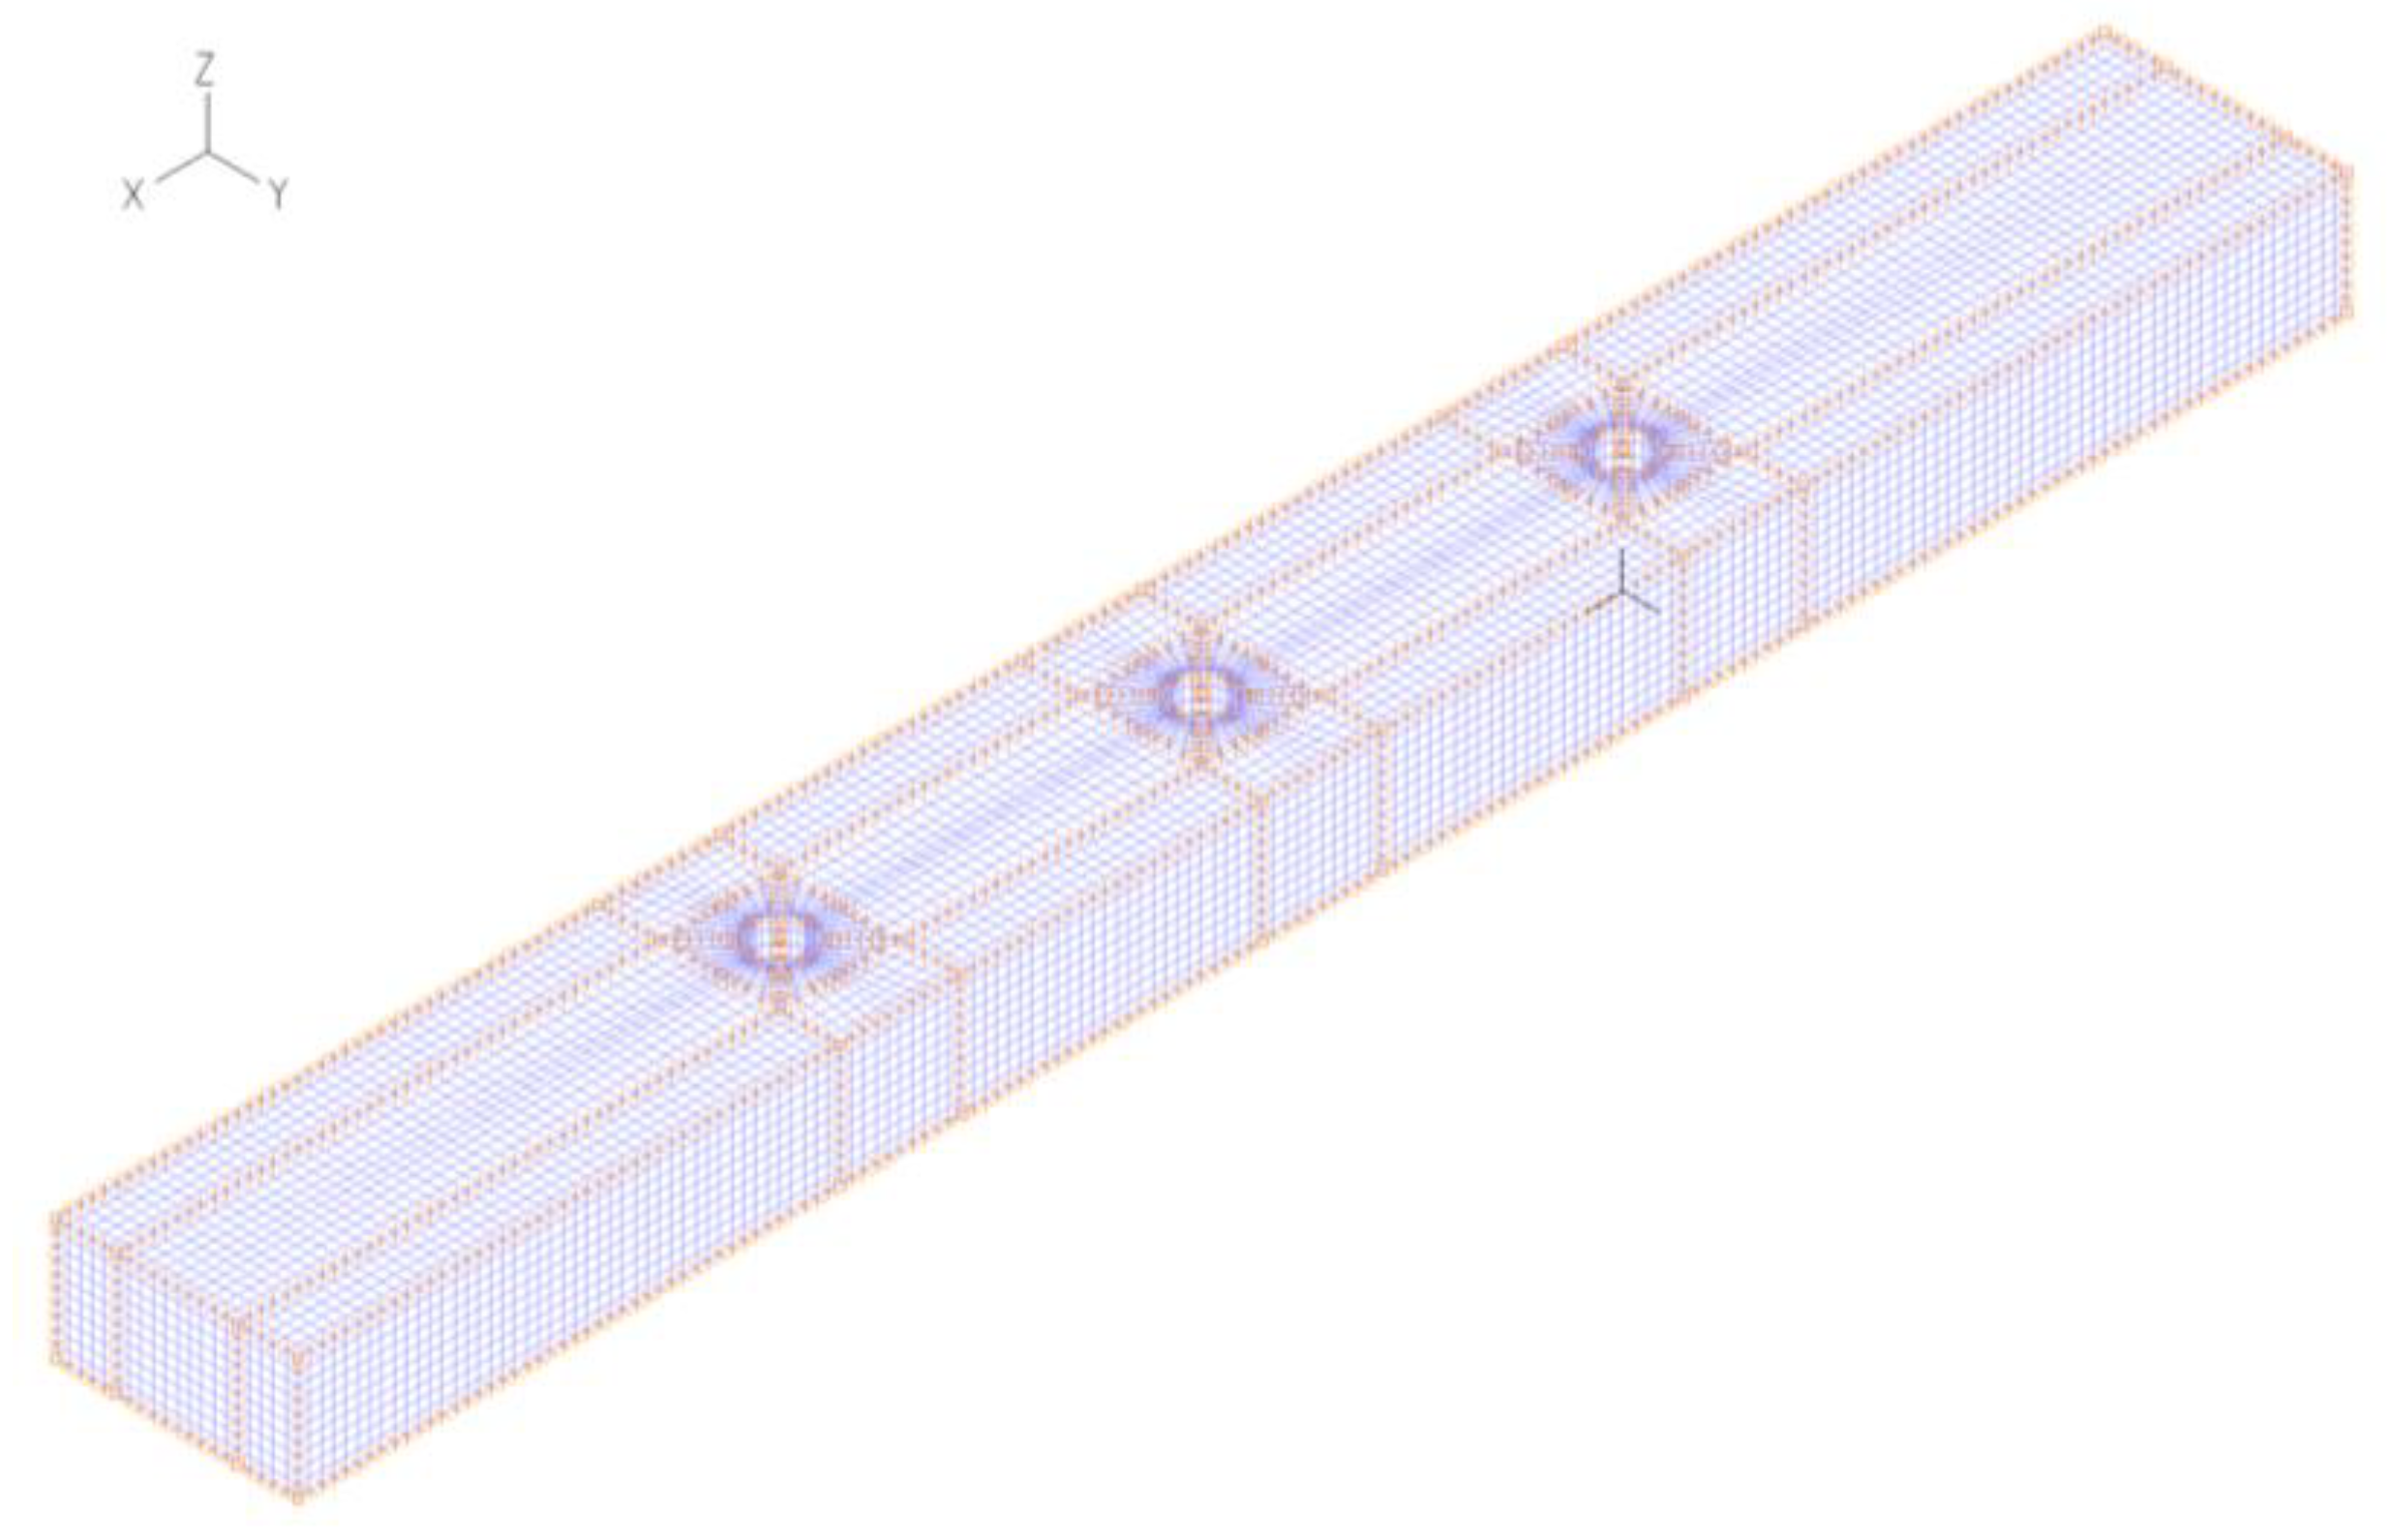
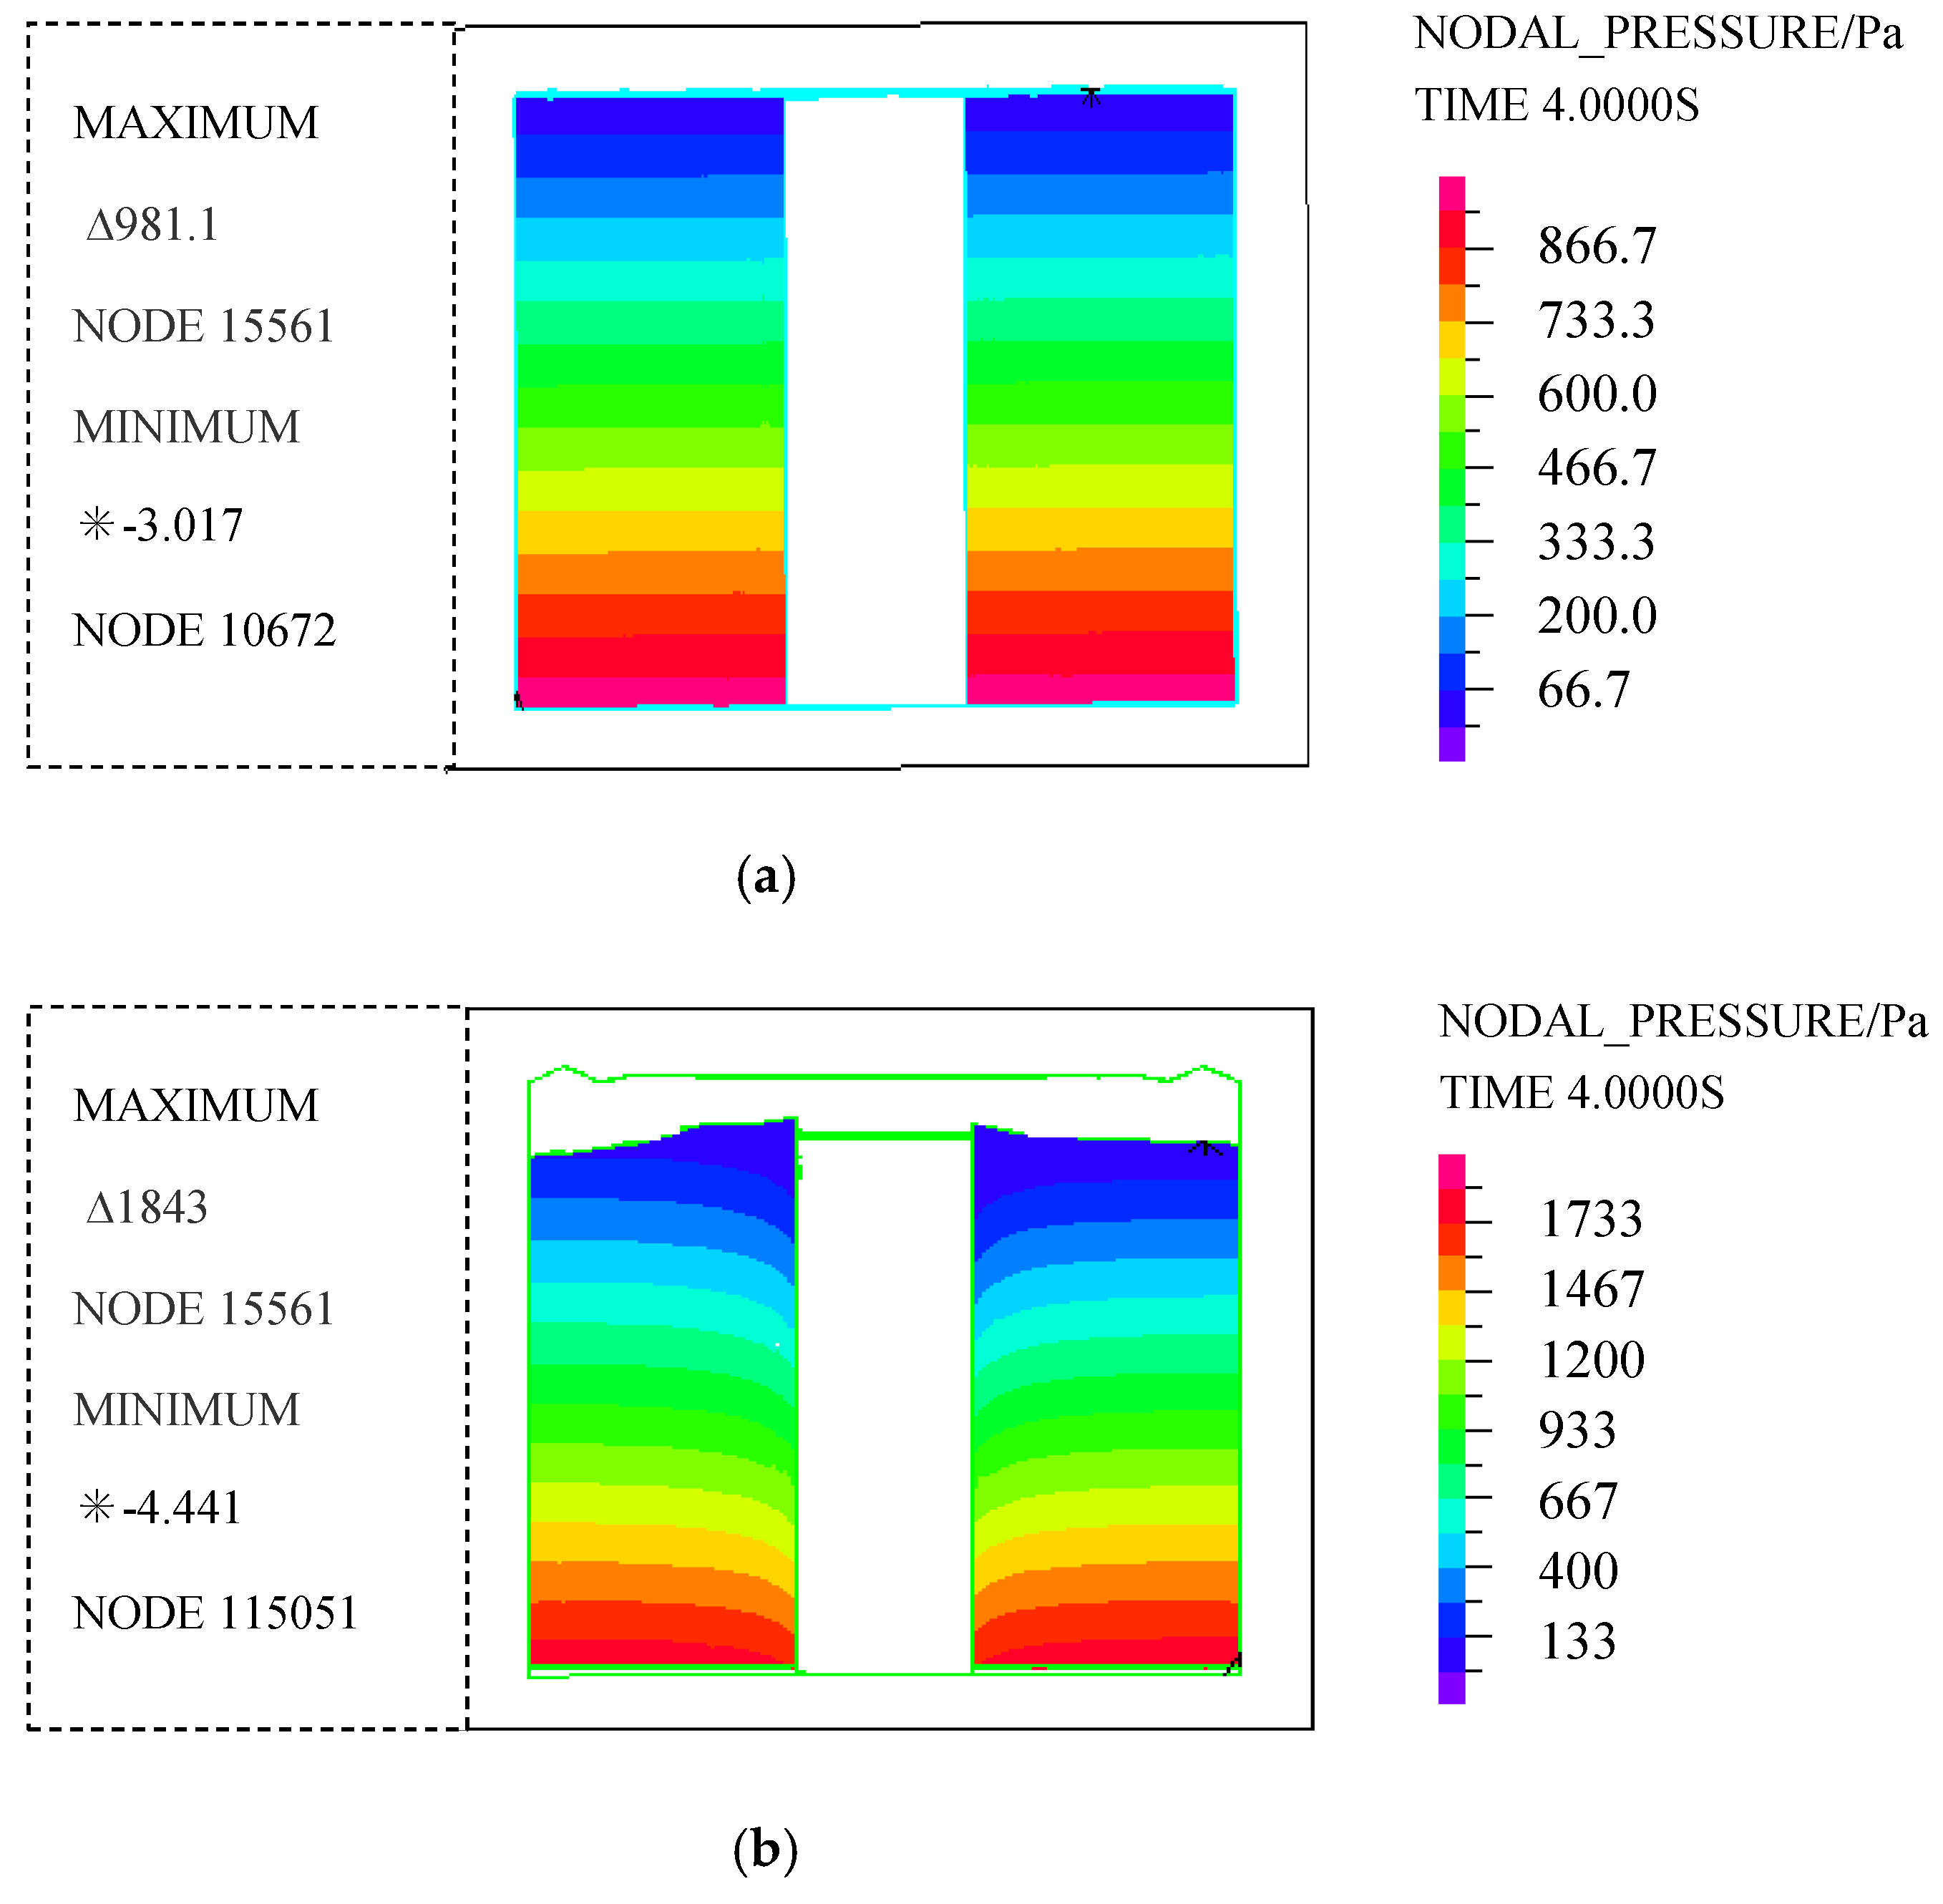
Establishment of Numerical Model of Water–Rock Interaction in Different Flow Patterns

(1) Laminar flow field model
The whole flow field was a cuboid of 170 cm × 20 cm × 10 cm (L × W × H). The field contained three cylindrical rock samples of the same size. The distance between each set of rock samples was 35 cm.
The fluid materials were defined as laminar flow models, the viscosity of water was 0.001 Pa·s, the density of water was 1000 kg·m−3 and the bulk modulus was 2.56 × 10⁹ Pa.
The flow rate was defined as the measured flow rate of 0.4 cm/s. Because the model uses the same hydraulic radius as the turbulence model, the laminar flow rate was very small. Therefore, in this simulation, the flow forms a still water state after passing through the first rock sample. This condition explains why some parameter values are zero in some graphs. Heat transfer was not considered in setting the model control parameters. One wall boundary condition and three fluid–structure coupling boundary conditions were defined for the boundary conditions. The laminar flow field grid is shown in Figure 5.
(2) Turbulent flow field model
According to the specific parameters of the red sandstone saturation test under different flow patterns, the basic parameters to be used for input were consistent with those used for the laminar flow. The main differences were as follows.
The speed load was defined as 0.3625 m/s. In terms of defining the fluid material, to simulate the complete turbulent flow process, a standard K ε model was used; thus, it was necessary to calculate this value when setting the relevant parameters:
Turbulence intensity I was calculated as follows
I = 0.16 ( R e D H ) 1 8
where R e D H was the Reynolds number calculated from the hydraulic diameter D H .
The turbulence length scale l was calculated as follows
l = 0.07 L
where L stands for the correlation size. For fully developed turbulence, the desirable L is equal to the hydraulic diameter.
Turbulent kinetic energy K was calculated as follows
K = 3 2 ( u ¯ I ) 2
where u ¯ stands for turbulent mean velocity.
The turbulent dissipation rate ε was calculated as follows
ε = C μ 3 4 K 3 2 l
where Cμ was an empirical constant: Cμ = 0.09.
Referring to the above formula, we calculated the turbulent kinetic energy and the turbulent dissipation rate:
K = 1.374 × 10 4 J
ε = 1.89 × 10 7
In setting model control parameters, the PISO algorithm and FCBI-C element were used. These elements have two-dimensional triangle elements, quadrilateral and three-dimensional tetrahedron elements and pyramid, prism and hexahedron elements. All degrees of freedom were defined at the centre of the unit. In the process of calculation, the solution ratio variable was considered to be a piecewise constant in the element, and the final solution was to integrate the value at the corner node in the postprocessing process [16,17]. The turbulent flow field grid was consistent with that of the laminar flow field, as shown in Figure 5. Both the flow field and the rock sample minimum mesh element are hexahedral elements with a grid accuracy of 1 cm. The specific grid creation steps are described in detail as follows.
  • Three cylindrical coordinate systems are defined.
  • Set up 47 initial points, and then connected and generated 30 fundamentals.
  • Set mesh density to 1 cm, stretch a face into a body along the Z axi.
When the mesh density is set, the line segments are divided. For the segment around the cylinder of the rock sample model, the method of "dividing according to the number of subdivisions" is adopted, so that the mesh density around the cylinder will be larger and the calculation results will be more accurate.
PISO algorithm, implicit operator segmentation algorithm for pressure. PISO is followed by a series of pressure solutions and explicit velocity correction after an implicit velocity prediction; the adjacent correction is considered in the iterative process.
FCBI-C element is an approach based on finite volume technology. It complies with the conservation of mass and momentum locally. Compared with other element algorithms, this element usually has better stability and accuracy, and is appropriate for solving large-scale problems. The vortex problem can be simulated by using the compound time integral (Composite) in transient analysis.
(3) Rock sample model
The size of the rock sample was the same as the experimental sample size: D = 50 mm, H = 100 mm.
In terms of defining materials, considering the finiteness of data and the convenience of calculation, the rock samples were modelled as linear elastic materials. The simulated detailed data of the rock samples were established in reference to the mean value of each actual rock sample, as shown in Table 1.
In defining the boundary conditions, the fluid–solid coupling boundary was defined around the surface of each rock sample, and this boundary corresponds to the one-to-one fluid–solid coupling boundary in the flow field model.
In defining the constraints and considering the material properties of the rock itself and the characteristics of the flow field, the upper and lower surfaces of the rock sample were fixed to make it easier to analyse the effects of the two different flow patterns on the deformation of the rock sample.
(4) Defining time functions and time step
The main purpose of setting the time function was to control the loads, and this was important in the problems where the loads varied over time, such as the multistage loading of the solidification problem and the periodic loading of the dynamic problem. Adina software defaults to complete loading, and it does not change after the load is applied; thus, the time function was 1 at the beginning (the time point was 0) and increased to infinity (the time point was 1 × 10 20 ). In Table 2, time represents the time defined in the time function and value represents the load scale factor at the corresponding time. For the problem of load changing with time, the time function defines the changing process of the load proportionality factor over time. The time step (also called the load step) was used to describe the number of steps and the step size, which determines the load value in the corresponding load–time curve. The total time defined in the time function was greater than or equal to the total length of time set in the time step. In this numerical simulation, we define the time function as shown in Table 2.
In setting the time step, the number of time steps was 1600, the step length was 0.0025 and the total solution time was 4 s.

3. Result and Discussion

3.1. The Chemical Law of the Influence of Different Flow States on the Softening of Rock

3.1.1. Analysis of the pH Value of Circulating Aqueous Solution in the Water–rock Interaction Process under Different Flow Patterns

Figure 6 shows the pH value of the still water solution has the largest variation; however, the peak level was lower than that of the turbulent and laminar solution at the beginning, while for the turbulent flow and laminar flow, the pH values of the solutions increase obviously during the first week and then stabilize at a certain value. Overall, the turbulent solution has a higher pH level than that of the laminar flow. The mineral composition of red sandstone is mainly composed of detrital minerals and clay minerals, among which detrital minerals are mainly quartz, feldspar, calcite and calcium. The calcium and iron cement in calcite and red sandstone are easily corroded by aqueous solutions and react with H+, then, they consume a large amount of H+ in the aqueous solution, which increases the pH of the solution. The author believes that the reason why the pH value of the aqueous solution continues to fluctuate for a long time with a considerable amplitude is that under static water conditions, the solution ions do not easily diffuse during the water–rock interaction process; additionally, the chemical reaction and ion exchange with more ions in the soft rock occur only when the water molecule or ion penetrates further into the soft rock, which causes a new change in the pH value. Under dynamic water conditions, because the influence of water flow has promoted the reaction between calcium and iron cements, which are easily corroded by H+ of aqueous solution, the pH value increases with the increasing fluidity of flow within a certain range. At the same time, as the fluidity of flow increases, the pH value in the solution will stabilize faster.

3.1.2. Analysis of Concentration Changes of Main Anions and Cations in Circulating Water Solution

Figure 7 and Figure 8 show the concentration curves of the main cations and anions in the aqueous solution during the water–rock interaction process under different flow conditions over time. The curves show that the ion concentrations have the following characteristics.
(1) Analysis of concentrations of main cations in circulating aqueous solution in the water–rock interaction process under different flow patterns
Comparing the curves under the three conditions, we see that in static water, the main cation concentration had a decreasing trend and less fluctuation; specifically, Na +, K +, Ca2 +, Mg2 + and Si4 + began to fluctuate slightly in approximately three weeks, then the concentrations became relatively stable. In dynamic water, the ion concentration increased obviously with the increasing fluidity of flow in the open channel self-recirculating flume. After two weeks, there was a large fluctuation followed by a linear increase. The concentration of Zn2+ was relatively low and tended to decrease because in the weakly alkaline solution, the ions combined with OH to form water-insoluble precipitates. At the same time, in the experiments, the concentrations of Al3+, Fe3+ and other cations were close to null, which were far lower than the concentrations of the major cations listed above.
As the red-bed soft rock contains more clay minerals with exchangeable ions, such as montmorillonite, kaolinite and illite, the ion exchange in the water–rock interaction process is an important driver of the destruction of the microstructure of rock. The author believes that ions do not diffuse easily during water–rock interactions in static water, except when molecules or ions of the solution penetrate further into the soft rock. The chemical reactions and ion exchanges could then occur with more ions in the soft rock and result in slight changes in ion concentration. In dynamic water, because of the effect of water flow, the action of molecules or ions in water on erosion, dissolution and exchange of rock minerals was promoted, thus positively promoting the ion reaction. In addition, the concentration of exchangeable ions and the pH of the solution are important factors that affect ion exchange and adsorption. As the exchangeable ion concentration increases, the exchange reaction becomes faster. As the fluidity of flow increases, the exchangeable ion concentration also increases, which accelerates the destruction of the rock microstructure.
(2) Analysis of concentrations of main anions of circulating aqueous solution in the water–rock interaction process under different flow patterns
The concentrations of main anions under the three flow state conditions showed large differences; the initial concentrations of the Cl, NO3 and SO42− ions remained basically unchanged in static water, while in turbulence and laminar flow, the concentrations of the main anions showed an approximate linear growth in the short term; furthermore, the concentrations were much greater than those in static water and then increased with the fluidity of flow.
The changes of major anion concentrations also showed that within a certain time, the increase in the fluidity of flow accelerated the dissolution and exchange of ions in soft rock and then promoted the soft rock–water chemical interaction. At the same time, it was also found in the experiment that the F concentration was close to null, which shows that this ion basically did not participate in the water–rock reaction process. It should be noted that NO3 changes little in turbulent flow, which may be related to the increase in the water temperature caused by the heat transfer effect of the pump in the self-recirculating flume.

3.2. Physical Laws of the Effects of Different Flow Patterns on Rock Softening

3.2.1. Qualitative Analysis of Microscopic Phenomena

Figure 9 shows that the microscopic scans of the four groups of rock sample particles produced by the uniaxial compression test were each magnified 3000 times (maximum magnification of 300,000 times) using a thermal field scanning electron microscope. It can be seen that the microstructure of the natural rock sample was smoother and had fewer micropores; a petal-shaped structure appeared in rock sample after still water immersion, the pores and microfissures increased and the overall structure became porous and loose; the distribution of the pores tended to be uniform after laminar soaking of rock sample and the connection between the particles tended to be loose; regardless of the sizes of the pores, the shapes of the pores tended to be transformed from the original irregular polygons to circles; after the turbulent soaking, the connection between the particles was looser than that of the samples soaked in the laminar flow, the arrangement of rock sample particles was directional and the rate of pore creation was higher. Comparing the changes in the microstructure of the four groups of rock samples, it can be seen that with the increase in the fluidity of flow, the microscopic joints and pore development of the rock samples become more obvious.

3.2.2. Quantitative Calculation of Plane Fractal Dimensions

The size, distribution, arrangement and connectivity of pore creation are important signs of changes in the microstructure. Therefore, the fractal dimension (D) of pore distribution and porosity (n) were used as parameters for the quantitative description of the microstructure in this study. Using scanning electron microscopy (SEM) and computer image processing methods, debris from the samples in nature, still water, laminar flow and turbulent flow were observed and processed using the sandbox method based on the fractal theory and porosity solving programme of MATLAB. The D of the pore distribution and n were obtained, respectively, as shown in Table 3.
Table 3 shows that the value of the plane fractal dimension and porosity increased with the fluidity of flow. Combined with Figure 9, we see that as the value of the plane fractal dimension becomes larger, the degree of collectivization of rock particles becomes lower; furthermore, the dense degree also becomes lower, the connectivity of porosity becomes stronger and the connections between the particles and the structure become looser. With the increase in the fluidity of flow, the microscopic joints of the rock samples were transformed into loose and porous granular structures with flocculating and petal-like structures, which were closely at the beginning and had greater strength. This result shows the characteristics of the swelling deformation of soft rock under water in different flow patterns. This result occurred because the increased water flow rate increased the scouring effect of the horizontal thrust of the water on the rock mass, which in turn, increased the hydrodynamic seepage pressure on the rock. In other words, the force exerted on the fracture wall and the filling material in the fracture increased to overcome the resistance action of the water in the course of the movement along the fracture; however, the direction of the hydrodynamic pressure was the same as the direction of the water movement. As the hydrodynamic pressure increased, more fillers were taken away from the fissures, the shear strength decreased more and it became easier to produce displacement or shear deformation along the structural surface. The water–rock interaction of the internal material also promotes the formation of new fissures, which accelerates the expansion of clay minerals and the propagation of fissures. At the same time, the pH value of the aqueous chemical solution affects the propagation of cracks. When the acidity or the alkalinity of the solution is stronger, the corrosion is greater and the crack propagation is faster. When the pH is neutral, the corrosion effect is greatly relieved and the cracks develop slowly [18]. Therefore, under the conditions of circulating open channel flow, the pH value of the solution increased with the increase in the fluidity of flow, which further aggravated the generation of cracks in the rock mass.

3.3. Mechanical Laws of the Effects of Different Flow Patterns on Rock Softening

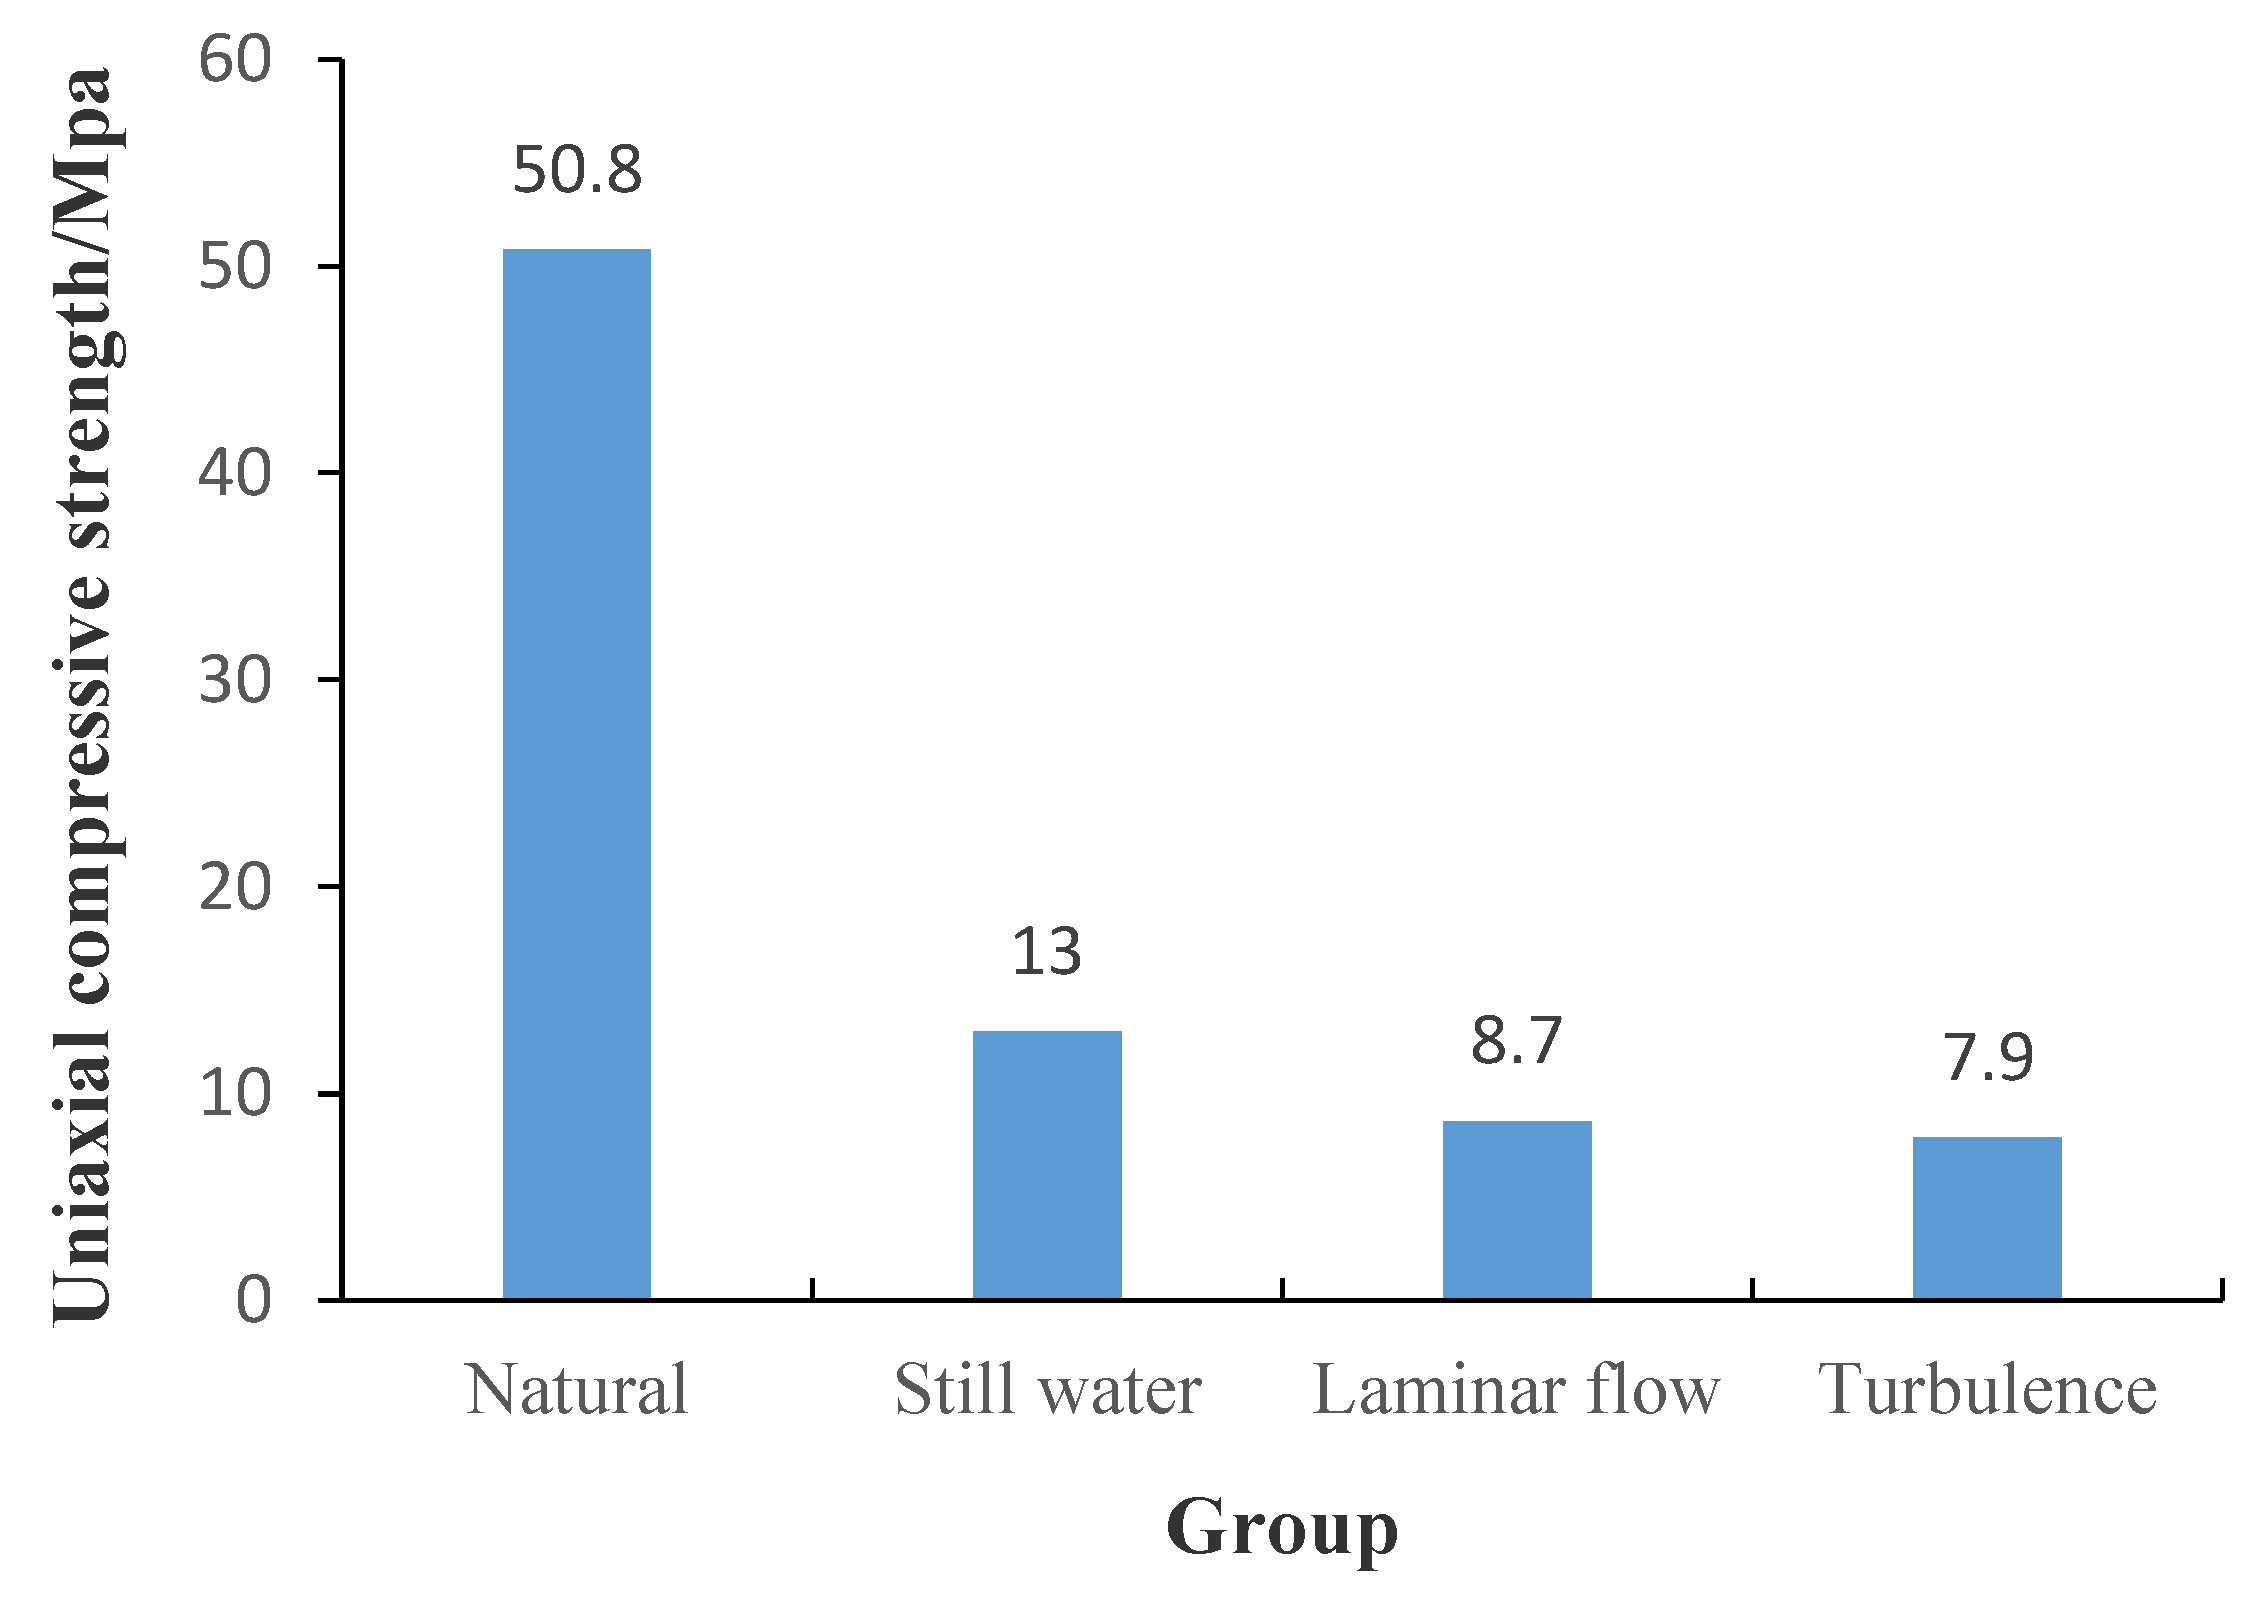
3.3.1. Comparative Analysis of Uniaxial Compressive Strength

The uniaxial compression tests were carried out on three groups of rock samples, which were completely immersed in laminar flow, turbulent flow and hydrostatic (flow state reference frame), respectively, with the same duration of water–rock interaction in the three different water flow states; thus, the three groups of rock samples were subjected to uniaxial compression tests. The values in Figure 10 represent the intermediate value of uniaxial compression data for each group of rock samples under three flow patterns of saturation. (Because there was a certain degree of discreteness between the data of each group, in order to highlight the comparability of each set of data, the intermediate value of each group of data was used for comparative analysis. That was, the maximum and minimum values for each set of data were discarded and the intermediate value was taken.)
It can be seen from the figure that the uniaxial mechanical strength of red sandstone with the same water saturation time was as follows in the different flow patterns: turbulent flow> laminar flow> static water, which means that with the same water saturation time, the mechanical strength of red sandstone decreases with the increasing fluidity of flow.

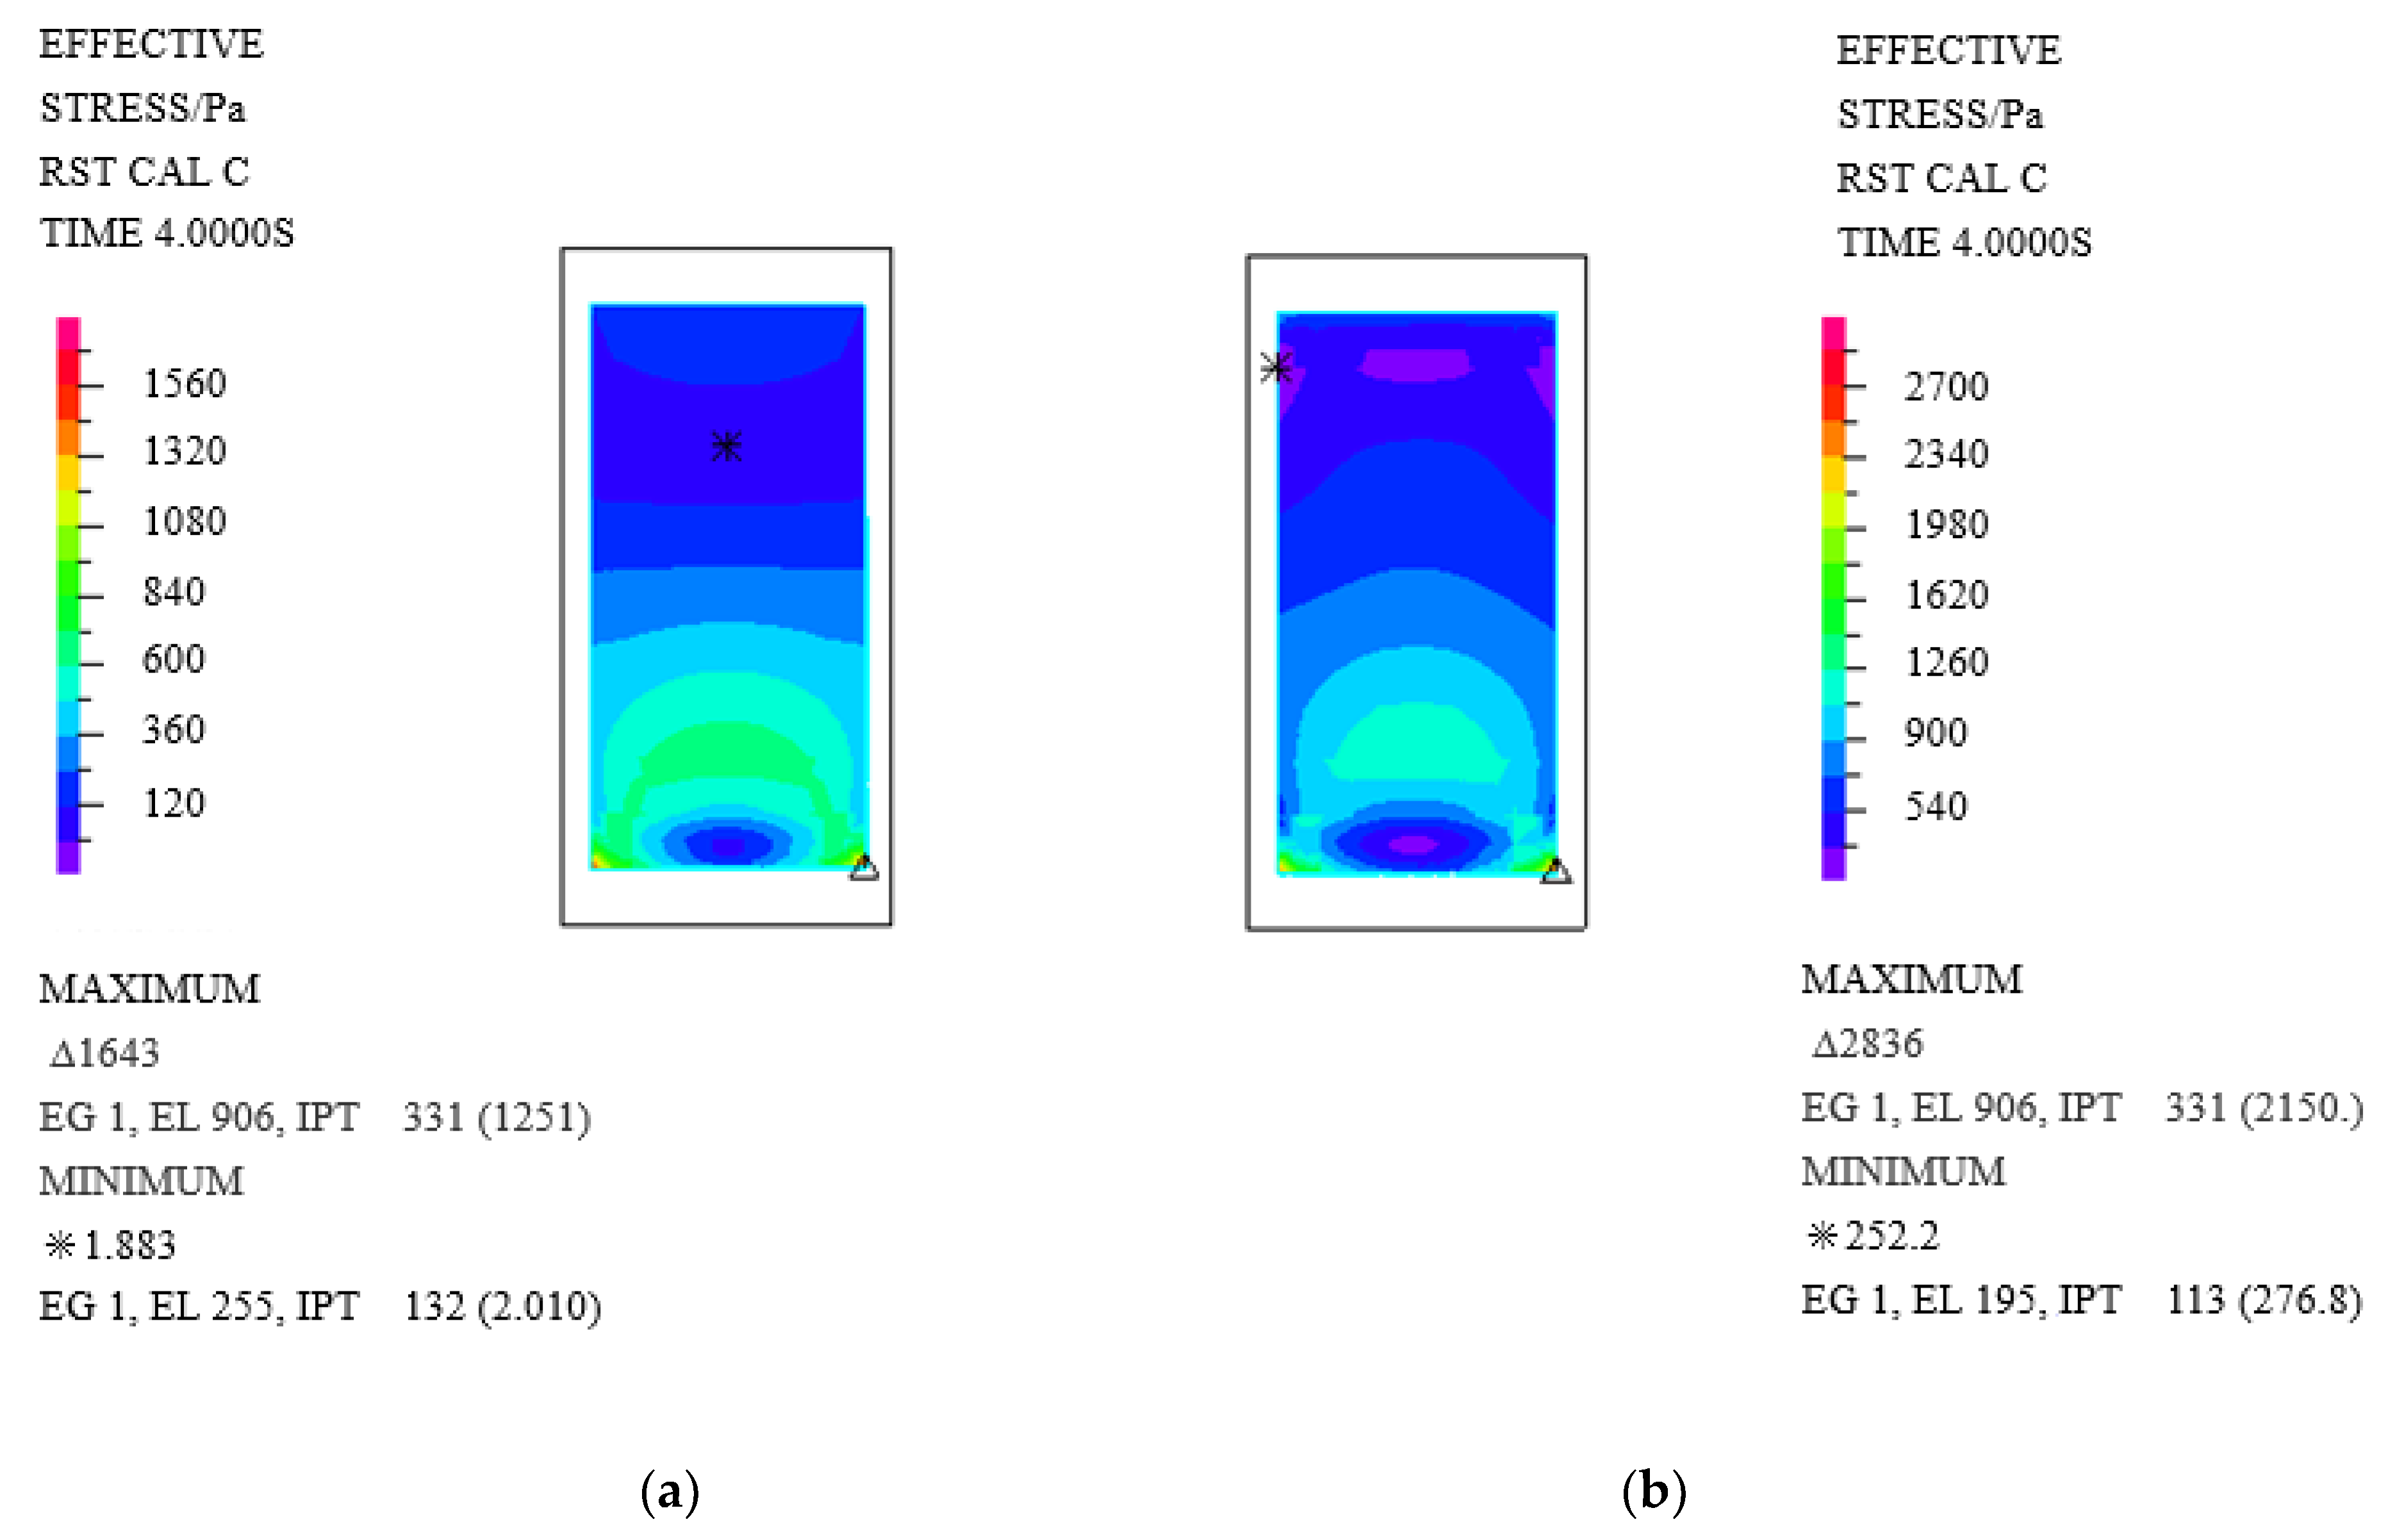
3.3.2. Comparative Analysis of Stress Index of Water–Rock Interaction in Different Flow Patterns

(1) Comparison of flow field fluid pressure
As shown in Figure 11 and Figure 12, the laminar and turbulent model fluid pressures gradually increased from top to bottom. By comparing the two fluid pressure cloud maps and lateral slice cloud diagrams, it is clear that the peak fluid pressure of the turbulent model was approximately twice that of the laminar flow. Studies have shown that when water penetrates through microcracks and micropore creation under the influence of water pressure, it accelerates the creep damage of the rock. For soft rock, the higher water pressure was more pronounced for mechanical damage [19]. This result implies that the turbulent flow pattern has a greater influence on the mechanical properties of the red-bed sandstones in the same period of time.
(2) Comparison of normal disturbance force
The normal disturbance force of fluid to the rock would also affect the mechanical strength of the rock sample. The magnitude and frequency of the disturbing force of the fluid–structure interaction interface directly affect the degree of softening damage of the red-bed sandstone. As shown in Figure 13, within the total solution time of 4 s, regardless of whether the laminar or turbulent model was used, the rock sample closest to the inlet had the largest normal disturbance force, and the stress of the other rock samples decreased progressively. Overall, the normal disturbance force of turbulent flow was greater than that of laminar flow by 1–2 orders of magnitude.
(3) Comparison of the X-direction shear force
As shown in Figure 14, in both turbulent flow and laminar flow, the fluid–solid coupling interfaces of the three rock samples were the ones closest to the inlet that had the largest shear forces, and the other rock samples were gradually reduced. The fluid–solid coupling interface X-direction shear force of the turbulence model was 2–3 orders of magnitude larger than that of the laminar flow model. This result reveals that the shear force of the fluid–solid coupling interface increases with increasing flow fluidity, and the mechanical damage to the rock also increases naturally.
(4) Comparison of effective stress
Figure 15 and Figure 16 show the cross-cutting nephogram and mark the points of the slitting line effective stress nephogram for the laminar and turbulent rock sample models, respectively. A comparison of the two chart parameters indicates that the effective stress of the rock samples under turbulent flow conditions was twice that of the rock samples under laminar flow conditions. Obviously, under the continuous impact of water flow, the rock samples under turbulent flow were more likely to produce microcracks, and at higher hydrodynamic pressures, it would be easier for water to penetrate into the interior of the rock and to accelerate the softening and creep of sandstone. From this perspective, the red-bed sandstone softening under turbulent flow conditions was also faster than that under laminar flow conditions.

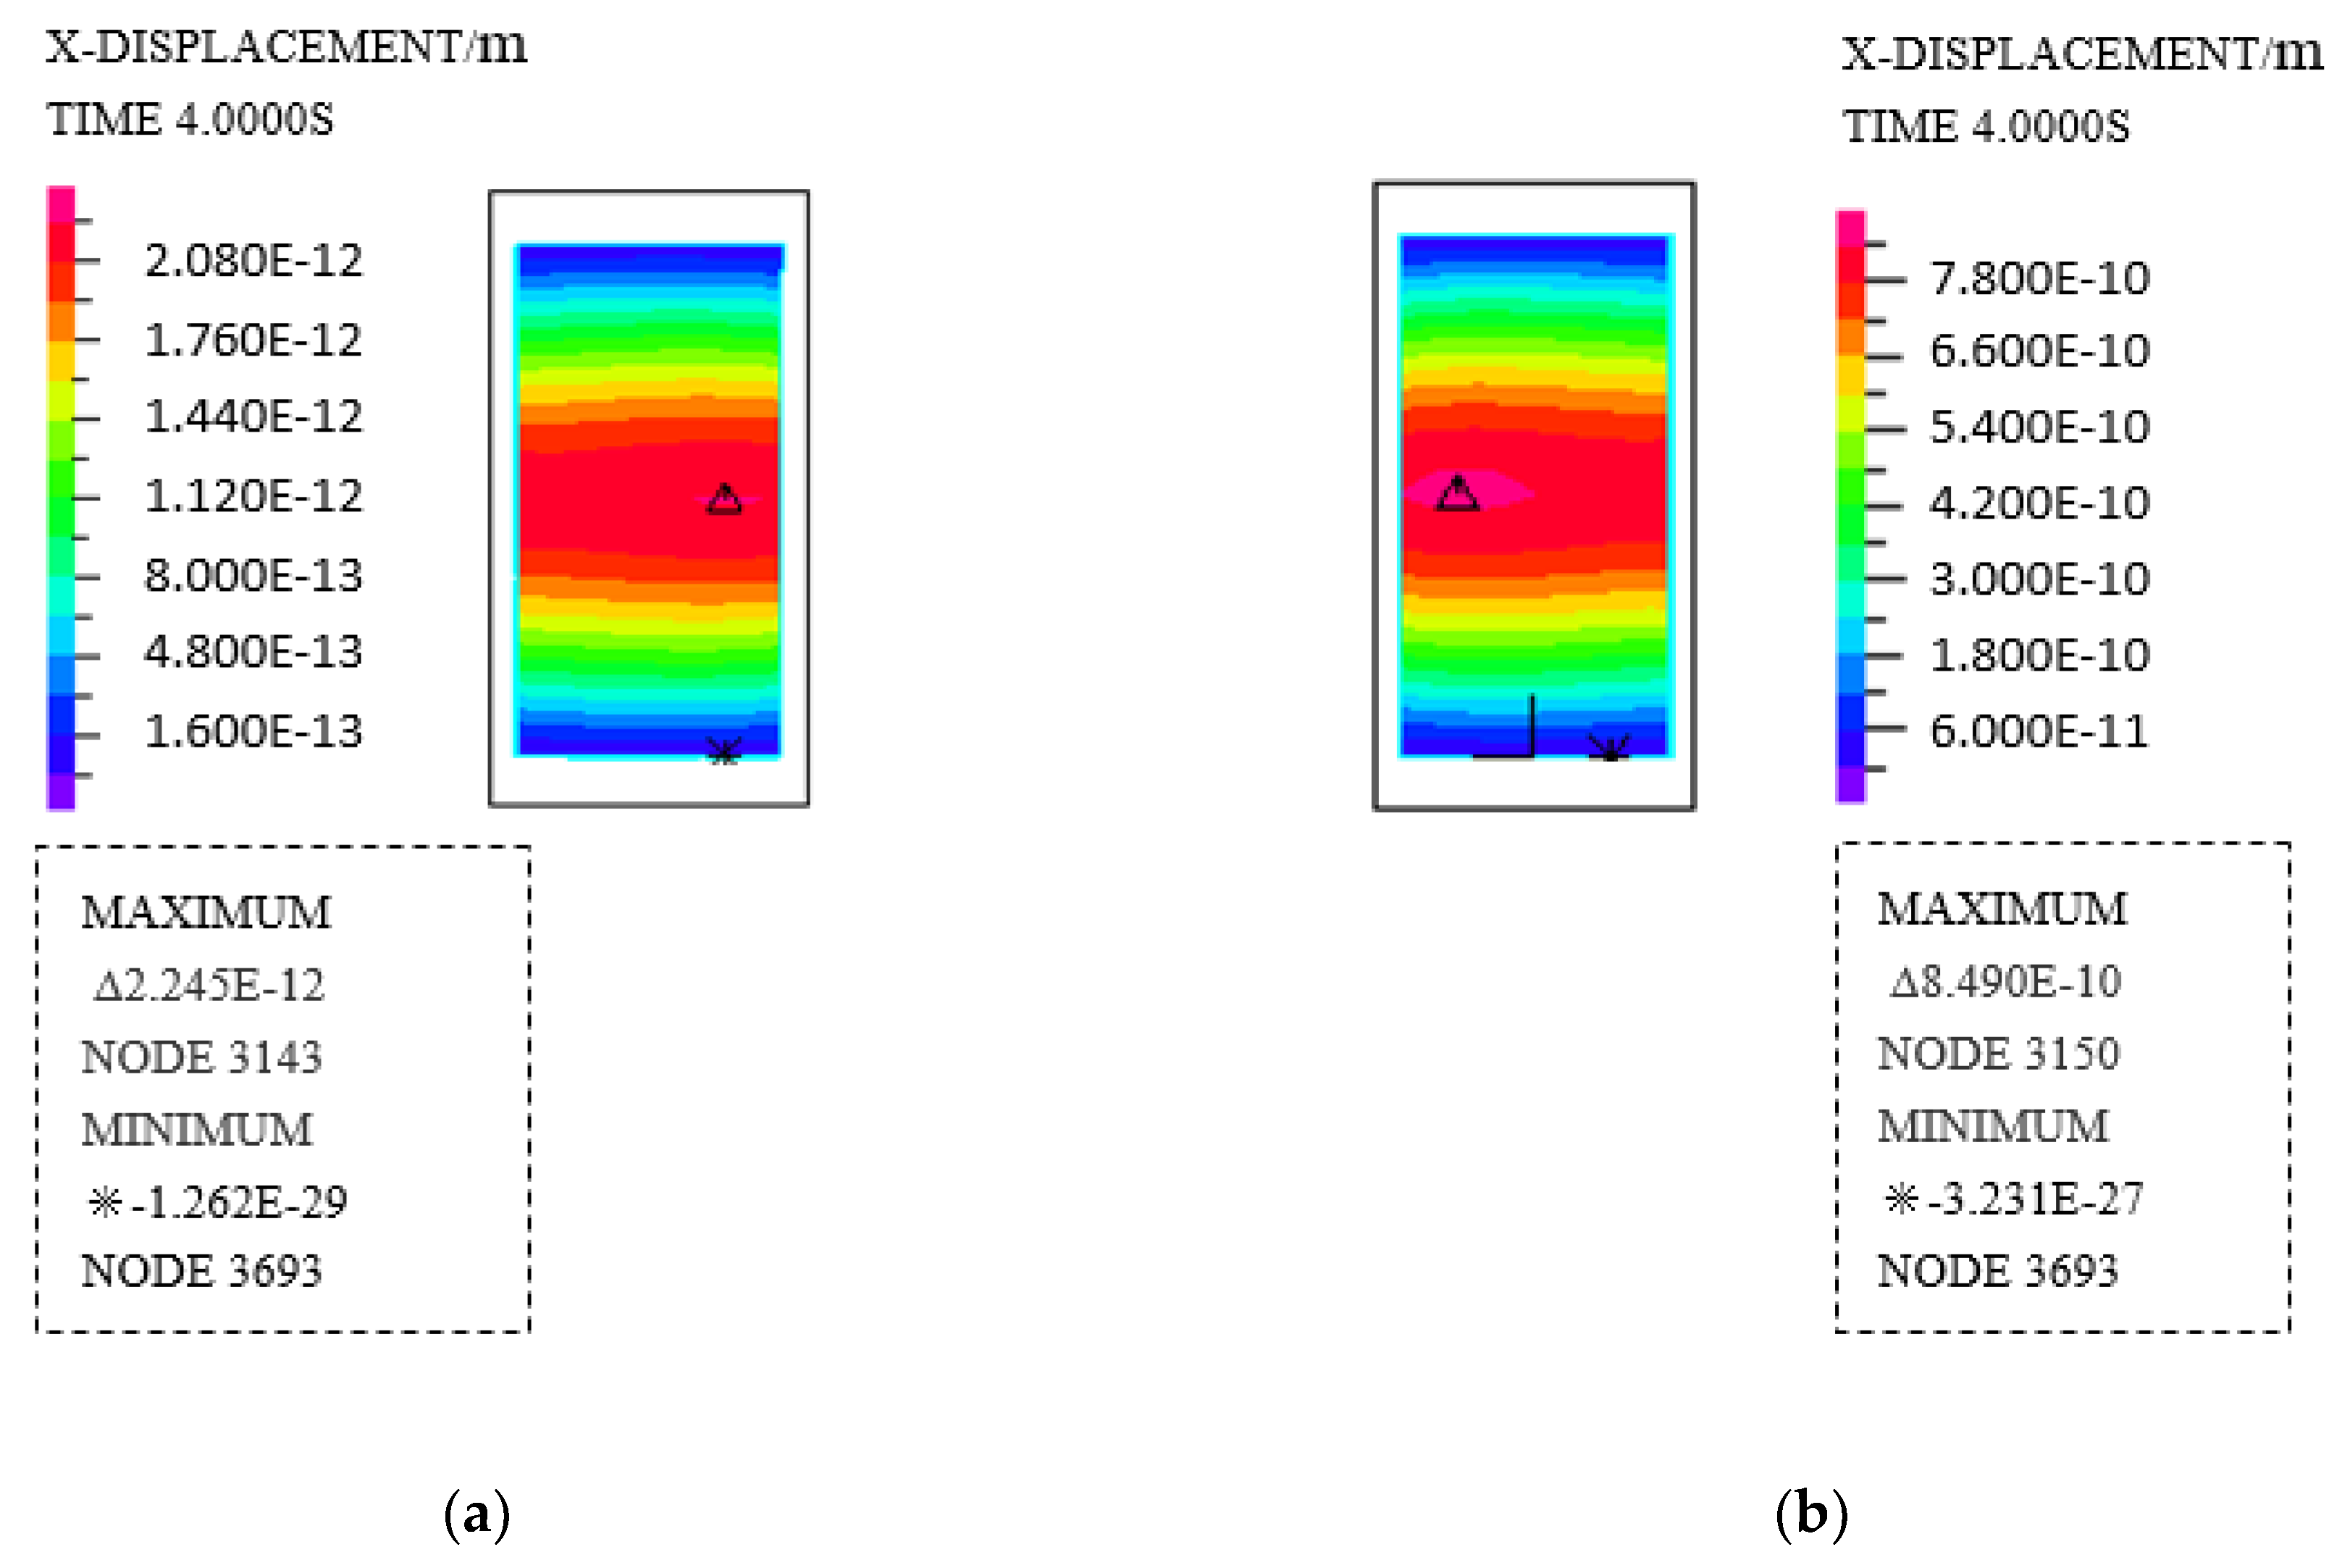
3.3.3. Comparative Analysis of the Strain Index of Water–Rock Interactions in Different Flow Patterns

Figure 17 and Figure 18 show that the cross-cutting and slitting line nephogram of the X-direction displacement were generated by the influence of the flow pattern on the laminar and turbulent rock samples. It can be seen from the cross-cutting nephogram that the displacement of the turbulent rock sample model in the X-direction was 1–2 orders of magnitude higher than that of the laminar model. It also reflects that the deformation of rock under turbulent flow conditions was greater than that of laminar flow under the same time conditions. The result indicated by the slitting line nephogram of the rock model that the displacement in the X-direction was basically the same for each rock under the laminar flow pattern, while the X-direction displacement of the rock sample closest to the water inlet under the turbulent flow pattern was significantly larger than that of the other two samples. The three rock samples showed a descending order of trends under the turbulent flow pattern. It can be seen that the degree of deformation of rock samples was positively correlated with the velocity of water flow. Based on the results of stress and strain caused by different flow patterns on rocks, comparison and analysis of physical and chemical indexes, such as pH value and ion concentration of circulating solution, porosity and uniaxial compressive strength of rock during practical test, enough to indicate that the flow pattern changes the internal structure of rock through the interaction of physical, chemical and mechanical properties, thus affecting the process of softening and failure of rock.

3.4. Mechanism of Influence of Different Flow Patterns on Rock Softening

The mineral composition of red sandstone is mainly composed of detrital minerals and clay minerals, among which detrital minerals are mainly quartz, feldspar, calcite and calcium. The calcium and iron cement in calcite and red sandstone are easily corroded by aqueous solutions and react with H+, and then they consume a large amount of H+ in the aqueous solution, which increases the pH of the solution. Under dynamic water conditions, the influence of water flow has promoted the reaction between calcium and iron cements, which are easily corroded by the H+ of an aqueous solution, which increases the pH value with the increasing flow fluidity within a certain range. At the same time, the pH value of the aqueous chemical solution also affects the propagation of cracks. When the acidity or the alkalinity of the solution is stronger, the corrosion is greater and the crack propagation is faster. When the pH is neutral, the corrosion effect is greatly relieved and the cracks develop slowly [18]. Therefore, under the conditions of circulating open channel flow, the pH value of the solution increases with the increase in the fluidity of flow, which further aggravates the generation of cracks in the rock mass.
The collapse mechanism of red-bed soft rock was caused by the hydration, diffusion and loss of clay particles at the water–rock interface in the muddy fill area between fragments of soft rock under the action of water, which was caused the reduction of the shaly belt of cementation and led to a decrease in cohesion between fragments. As the red-bed soft rock contains more clay minerals with exchangeable ions, such as montmorillonite, kaolinite and illite, the ion exchange in the water–rock interaction process is an important driver of the destruction of the microstructure of rock. The author believes that in dynamic water, because of the effect of water flow, the action of molecules or ions in water on the erosion, dissolution and exchange of rock minerals is promoted, and thus the ion reaction is positively promoted. In addition, the concentration of exchangeable ions and the pH of the solution are important factors that affect ion exchange and adsorption. As the exchangeable ion concentration becomes greater, the exchange reaction becomes faster. At the same time, the increase in the water flow rate increases the scouring effect of the horizontal thrust of the water on the rock mass, which in turn increases the hydrodynamic seepage pressure on the rock. That is, the force exerted on the fracture wall increases and the filling material in the fracture must overcome the resistance action of the water in the course of the movement along the fracture; the direction of the hydrodynamic pressure is the same as the direction of the water movement. As the hydrodynamic pressure becomes greater, more fillers are taken away from the fissures, the shear strength decreases more and it becomes easier to produce displacement or shear deformation along the structural surface. The water–rock interaction of the internal material also promotes the formation of new fissures, which accelerates the expansion of clay minerals and the propagation of fissures and thus aggravates the damage of water to the shear strength (cohesion and internal friction angle) on the cracked (joint) surface of rock.
In other words, the change of flow pattern not only changes the erosion of rock but also produces chemical-physical-mechanical interactions on rock, which affects the process of rock softening and breaking.

4. Conclusions

Through the laboratory test and numerical simulation of the effect of different flow patterns on soft rock softening in red beds, it was shown that in different flow patterns, as the fluidity of flow increases, the alkalinity of the solution increased, the speed of ion concentration stabilization became faster, the development of the microscopic structure of the corresponding rock became higher and the decrease in mechanical strength became greater. That is, the flow pattern affects the processes of rock softening and breaking through the interaction of the chemical, physical and mechanical processes. This research has made up for the deficiency of quantitative analysis and mechanistic explanation of rock softening under the condition of dynamic water.
At the same time, the self-developed multifunctional open channel hydraulics test equipment realizes the integrated control of the long-time flow, temperature and water level. We solved the problem of obtaining the flow pattern of open channels with small circulation for a long time without sustainability. This provides technical support for the experimental study of the effect of different flow patterns on the softening of red sandstone under dynamic water conditions.
In the past, the governance design of reservoir or dike bank slopes was mainly based on the static water condition, but ignored the influence of the dynamic water condition on the bank slopes catastrophe, which was not completely consistent with the actual situation. The research provides a more practical protection reference for the treatment design of reservoir and dike slope. The research is also a new interpretation for the catastrophic mechanism of red bed bank slopes based on the different flow patterns. The research also provides a thought for the prediction and analysis of estuarine slopes and water conservancy projects disasters. At the same time, it provides experimental means and reference for the strengthening design of estuarine and coastal slopes and water conservancy projects.

Author Contributions

Conceptualization, Z.L. and C.Z.; Methodology, Z.L., X.H. and C.Z.; Software, X.H.; Validation, Z.L., and X.H.; Formal Analysis, X.H.; Investigation, X.H. and C.Z.; Resources, X.H. and C.Z.; Data Curation, Z.L. and C.Z.; Writing-Original Draft Preparation, Z.L. and X.H.; Writing-Review & Editing, Z.L. and X.H.; Visualization, Z.L. and X.H.; Supervision, C.Z.; Project Administration, Z.L. and C.Z.; Funding Acquisition, Z.L. and C.Z.

Funding

This research was funded by the National Key R&D Program of China [Grant No. 2017YFC1501201, Grant No. 2017YFC0804605], the Major Program of National Natural Science Foundation of China [Grant No. 41530638], the Science and Technology Planning Project of Guangdong Province, China [Grant No. 2015B090925016, Grant No. 2016B010124007], Guangdong Province: Special Support Plan for High-Level Talents [Grant No. 2015TQ01Z344] and the Science and Technology Program of Guangzhou, China [Grant No. 201803030005].

Acknowledgments

The authors would like also to express their gratitude to the reviewers for their constructive suggestions and observations that helped in improving the present work.

Conflicts of Interest

The authors declare no conflicts of interest.

References

  1. Hadizadeh, J.; Law, R.D. Water-weakening of sandstone and quartzite deformed at various stress and strain rates. Int. J. Rock Mech. Min. Sci. 1991, 28, 431–439. [Google Scholar] [CrossRef]
  2. Lepokurova, O.E.; Ivanova, I.S. Water-rock-ore interaction (on example: Major bakchar iron-ore deposit–Western Siberia, Russia). Procedia Earth Planet. Sci. 2017, 17, 690–693. [Google Scholar]
  3. Brusky, I.; Sembera, J.; Paces, T. Long-term water-rock interaction in the Bohemian Cretaceous Basin (Central Europe): Field evidence and modelling. J. Hydrogeol. Hydrol. Eng. 2017, 6, 2. [Google Scholar] [CrossRef]
  4. Zhou, C.Y.; Deng, Y.M.; Tan, X.S.; Liu, Z.Q.; Shang, W. Experimental research and application of mechanical properties softening of saturated soft rock. J. Rock Mech. Eng. China 2005, 24, 33–38. [Google Scholar]
  5. Ermano, D.A.; Marcel, R.A.G.; Bas, H. Damage characterization of rock slopes. J. Mar. Sci. Eng. 2019, 7, 10. [Google Scholar] [CrossRef]
  6. Zhang, R.H.; Zhang, X.T.; Hu, S.M. Experimental study on water rock interactions at temperatures up to 435 °C and implications for geophysical features in upper mid-crust condition. Tectonophysics 2011, 502, 276–292. [Google Scholar] [CrossRef]
  7. Chen, Y.; Cao, P.; Chen, R.; Teng, Y. Effect of water–rock interaction on the morphology of a rock surface. Int. J. Rock Mech. Min. Sci. 2010, 47, 816–822. [Google Scholar] [CrossRef]
  8. Yang, S.Q.; Jing, H.W.; Cheng, L. Influences of pore pressure on short-term and creep mechanical behavior of red sandstone. Eng. Geol. 2014, 179, 10–23. [Google Scholar] [CrossRef]
  9. Shukla, R.; Ranjith, P.G.; Haque, A.; Yellishetty, M.; Hong, L. Mechanical behaviour of reservoir rock under brine saturation. Rock Mech. Rock Eng. 2013, 46, 83–93. [Google Scholar] [CrossRef]
  10. Zhang, Y.C.; Deng, H.F.; Wang, W.; Duan, L.L.; Zhi, Y.Y.; Li, J.L. The dynamic response law of bank slope under water-rock interaction. Adv. Civ. Eng. 2018, 2018, 1–10. [Google Scholar] [CrossRef]
  11. Redwan, M.; Moneim, A.A.A.; Amra, M.A. Effect of water–rock interaction processes on the hydrogeochemistry of groundwater west of Sohag area, Egypt. Arab. J. Geosci. 2016, 9, 111. [Google Scholar] [CrossRef]
  12. Marta, P.; Markus, B.; Alessandro, C.; Luca, C.; Federica, P.; Zhao, Q. Quantitative estimates of bio-remodeling on coastal rock surfaces. J. Mar. Sci. Eng. 2016, 4, 37. [Google Scholar] [CrossRef]
  13. Tang, L.S.; Zhang, P.C.; Wang, S.J. Experimental study on fracture mechanics effect of water-rock chemical interaction. J. Rock Mech. Eng. China 2002, 6, 822–827. [Google Scholar]
  14. Tang, L.S.; Zhang, P.C.; Wang, Y. Study on fracture strength of rock mass under water action. J. Rock Mech. Eng. China 2004, 19, 3337–3341. [Google Scholar]
  15. Lu, Z.D. Study on uniaxial compressive fracture process of fractured rock under hydrochemical environment. In Proceedings of the Second National Symposium on Environmental Geotechnical and Geosynthetic Materials, Changsha, China, 13–15 November 2008. [Google Scholar]
  16. Bathe, K.-J.; Zhang, H. A flow-condition-based interpolation finite element procedure for incompressible fluid flows. Comput. Struct. 2002, 80, 1267–1277. [Google Scholar] [CrossRef]
  17. Bathe, K.J.; Pontaza, J.P. A flow-condition-based interpolation mixed finite element procedure for higher Reynolds number fluid flows. Math. Models Methods Appl. Sci. 2002, 12, 525–539. [Google Scholar] [CrossRef]
  18. Yang, H.; Cao, P.; Jiang, X.L. Meso-mechanical model of equivalent crack propagation for water-rock chemistry. Rock Soil Mech. China 2010, 31, 2104–2110. [Google Scholar]
  19. Guo, F.L.; Zhang, D.L.; Su, J.; Xiao, C.M. Experimental research on the influence of groundwater and confining pressure on the mechanical properties of soft rock. J. Rock Mech. Eng. China 2007, 11, 2324–2332. [Google Scholar]
Figure 1. Structural schematic diagram of multifunctional open channel hydraulics test equipment.
Jmse 07 00155 g001
Figure 2. Physical image of multifunctional open channel hydraulics test equipment.
Jmse 07 00155 g002
Figure 3. Sample chart.
Jmse 07 00155 g003
Figure 4. Turbulence test state diagram.
Jmse 07 00155 g004
Figure 5. Laminar flow field meshing diagram.
Jmse 07 00155 g005
Figure 6. Change in pH value in different periods of different circulating aqueous solutions.
Jmse 07 00155 g006
Figure 7. Concentration curves of major cations in circulating aqueous solution under different flow patterns (a) Concentration variation of K+; (b) Concentration variation of Na+; (c) Concentration variation of Mg2+; (d) Concentration variation of Ca2+; (e) Concentration variation of Zn4+; (f) Concentration variation of Si4+.
Jmse 07 00155 g007
Figure 8. Curves of the main anion concentrations in circulating aqueous solution under different flow patterns (a) Concentration variation of Cl; (b) Concentration variation of NO3; (c) Concentration variation of SO42.
Jmse 07 00155 g008
Figure 9. The microstructure change of rock samples under different flow patterns (×3000) (a) Natural rock sample; (b) Rock sample after still water immersion; (c) Rock sample after laminar soaking; (d) Rock sample after turbulent soaking.
Jmse 07 00155 g009aJmse 07 00155 g009b
Figure 10. Comparison of the value of the uniaxial compressive strength of red sandstone under different flow patterns.
Jmse 07 00155 g010
Figure 11. Fluid pressure cloud maps (a) Laminar flow model; (b) Turbulence model.
Jmse 07 00155 g011
Figure 12. Fluid pressure cross-cutting cloud maps (a) Laminar flow model; (b) Turbulence model.
Jmse 07 00155 g012
Figure 13. Normal disturbance force–time curve of laminar flow and turbulence model.
Jmse 07 00155 g013
Figure 14. X-direction shear force–time curves for laminar and turbulent flow models.
Jmse 07 00155 g014
Figure 15. Cross-cutting effective stress nephogram (a) Rock sample models of laminar flow; (b) Rock sample models of Turbulence.
Jmse 07 00155 g015
Figure 16. Laminar and turbulence rock sample models mark points of slitting line effective stress nephogram.
Jmse 07 00155 g016
Figure 17. X-direction displacement cross-cutting nephogram (a) Rock sample models of laminar flow; (b) Rock sample models of Turbulence.
Jmse 07 00155 g017
Figure 18. X-direction displacement slitting line nephogram (a) Rock sample models of laminar flow; (b) Rock sample models of Turbulence.
Jmse 07 00155 g018aJmse 07 00155 g018b
Table 1. Rock sample property parameter setting table.
(a)
Rock TypesRock TraitsDensity/(g/cm3)Water Absorption/(%)Compressive Strength/(MPa)E/(GPa)
DryWet
SandstoneMetamorphic, strong weathering2.522.774713.919.8
(b)
MaterialModulusPoisson’s RatioDensityInternal Friction AngleCohesionAlways Solve the Time
Moore Cullen19.8e90.25252025°8 MPa4.00 S
Table 2. Time function.
NumberTimeValue
100
20.21
3 1 × 10 20 1
Table 3. Statistics of porosity and fractal dimension of soft rock after different flow patterns.
NumberCategoryFractal Value/DPorosity/n
1Natural1.8310.64%
2Still water1.8718.79%
3Laminar flow1.9921.35%
4Turbulent flow2.0226.87%

